Article

Impact of Low-Carbon City Pilot Policies on Green Construction Industry Innovation

College of Civil Engineering, Nanjing Forestry University, Nanjing 210037, China
*
Author to whom correspondence should be addressed.
Sustainability 2024, 16(7), 2964; https://doi.org/10.3390/su16072964
Submission received: 27 February 2024 / Revised: 29 March 2024 / Accepted: 30 March 2024 / Published: 2 April 2024

Abstract

:
The building industry, as one of the fundamental and pivotal sectors of economic development in China, is also a high source of pollution emissions. Therefore, construction enterprises play a pivotal role in urban low-carbon development, and green innovation is an effective approach for these corporations to meet emission reduction targets and enhance economic benefits. This study primarily focused on the panel data of Chinese construction companies from 2000 to 2019. This study applied a multi-period double difference model. The purpose of this study was to investigate the impact of piloting low-carbon city policies on green innovations in the construction sector. The results indicate that the policy clearly advanced the green development of enterprises in the construction industry, and this effect persisted even after undergoing long-term robustness tests. The heterogeneity test results revealed that the pilot policy has been more effective in promoting green innovation for SOEs as well as for construction companies that are in the process of maturing.

1. Introduction

According to the China Construction Research Report 2016–2020, building energy consumption was 20.6% of the total in China, while building accounted for 19.4% of carbon emissions in 2016. In 2018, life-cycle carbon emissions within the construction sector were responsible for 51% of domestic carbon emissions. In 2020, the overall carbon emissions throughout the construction industry process represented approximately half (50.9%) of the total national carbon emissions [1,2,3]. These statistics highlight that China’s construction industry significantly deviates from national green development requirements and undermines its own sustainable development prospects. During the 2020 United Nations Summit on Biodiversity, two proposals were introduced—“protecting green development” and “realizing a win-win situation between high-quality economic development and environmental protection”. Subsequently, the 20th Congress of the Communist Party of China emphasized the ambitious objective of “promoting green development and fostering harmonious coexistence between humanity and nature”. This strategic goal has been reiterated multiple times in significant gatherings. In summary, the current state in China is characterized by a shift toward green economic and social development, with the aim of promoting the realization of environmentally friendly, low-carbon, and high-quality growth. One of the strategic objectives of China’s green and sustainable development is to achieve dual-carbon goals on schedule [4,5].
The global goal is to attain “peak carbon” and “carbon neutrality” to meet the challenges posed by global warming. Numerous countries have implemented diverse environmental regulatory measures to optimize the deployment of ecological resources at a societal level [6,7]. There are primarily three fundamental policy tools for environmental regulation, including command-and-control policies, market-based policies, and voluntary policies [8,9,10,11]. Command-and-control policy instruments are mandatory environmental regulatory tools mediated through environmental legislation, pollution emission limits, and the development of technology access standards. Market-based policy instruments are used to internalize environmental pollution through the market adjustment mechanism, thereby achieving the purpose of environmental protection. Common market incentive policy instruments include environmental taxes, credit preferences, environmental subsidies, and emissions trading systems. Voluntary policy instruments have no mandatory implementation requirements. They are characterized by regular disclosure of environment-related information to society and the public, mainly through environmental visions, three waste emissions, green offices, green travel, and environmental investments. Zhang et al. (2020) [12] used Tobit regression to explore the impact of three environmental regulations on green innovation. Their study found that different types of environmental regulations have different effects on the level of green technology innovativeness.
Low-carbon cities are recognized in various countries as an integrated approach to environmental regulation that promotes a low-carbon economy [13]. China’s low-carbon city pilot policy is to implement a low-carbon economy in cities, including the promotion of carbon-reducing production and consumption. The objective of the policy is to set up a resource-saving and environmentally friendly society while establishing a virtuous and sustainable energy ecosystem. Low-carbon city building and green innovation capacity have been extensively studied by many scholars. Among them, Chen et al. (2022) [14] employed urban balance sample data to examine the impact of low-carbon cities on spatial variations in PM2.5 levels. The findings indicated that these pilot policies not only decrease local PM2.5 concentrations but also effectively mitigate haze pollution in neighboring cities.
However, there remains no consensus within academia regarding whether constructing pilot cities can effectively mitigate carbon emissions. Based on panel data from 49 cities in China, Feng et al. (2021) [15] explored the effects of pilot policies for low-carbon cities on city-level carbon intensity. The results of their study were contrary to expectations, showing that both the first and second pilot cities significantly increased their carbon intensity by 15–20%. However, the growth effect of carbon intensity tapered off in the third year after the policy was implemented. Li et al. (2022) [16] studied the mechanisms influencing green innovation behavior in construction firms by building a VAR model. The results found that the role of environmental regulation on green innovation by construction firms is non-linear, and also concluded that overseas foreign direct investment (OFDI) and regional GDP affect green innovation. Environmental regulation has emerged as a potent instrument for governments to incentivize firms toward embracing environmentally friendly innovative technologies. It is a way for governments to nudge businesses toward going green through regulation.
In summary, most of the existing research discusses how well these policies are working to make cities eco-friendly and energy-efficient. Primarily, it delves into how these policies influence the innovation of green technologies within urban settings, while neglecting their effects on micro-enterprises, particularly construction companies. In 2010, the National Development and Reform Commission of China initially designated five provinces and eight cities as low-carbon pilot areas. Subsequently, in the second phase of the policy, Hainan Province and 28 additional cities, including Beijing and Shanghai, were included as part of the low-carbon pilot areas in 2012. In January 2017, an additional 45 cities such as Nanjing and Hefei were included as part of the third batch of pilot cities. The progressive expansion of low-carbon pilot policies reflects China’s steadfast commitment to enforcing more stringent environmental regulations and actively pursuing a policy focused on low-carbon, green, and high-quality development initiatives [17]. The study of construction enterprises’ response to low-carbon pilot policies, as well as their proactive approach toward improving environmental issues through green technology innovation and achieving transformation and upgrading, is crucial in the context of urban low-carbon construction and pollution prevention. Therefore, this study focused on construction enterprises as the sample group, employing a multi-phase difference-in-differences model to analyze the impact of low-carbon city pilot policies on the adoption of green innovation technologies within these enterprises. The objective of this research was to offer decision-making support for the expansion of pilot projects by the government and to formulate strategies for green transformation and upgrading in the construction industry.

2. Theoretical Analysis and Research Assumptions

2.1. Low-Carbon Cities Pilot Policies and Green Innovation for Businesses

The construction of low-carbon cities has been used by countries around the world as a comprehensive environmental regulation tool to promote low-carbon economic development [13], aiming to effectively control urban greenhouse gas emissions. The traditional neoclassical economics theory posits that environmental regulations are likely to impede economic growth due to the increased operational costs and constraints imposed on enterprises, thereby hindering their capacity for innovative activities and ultimately hampering national economic development. However, the “Porter hypothesis” posits that decent environmental regulations can incentivize firms to respond positively by fostering green technological innovations, ultimately leading to increased productivity and profitability. As a result, these benefits offset the initial costs associated with environmental governance and ultimately achieve harmonious economic-environmental development.
Consequently, there are two primary perspectives regarding how environmental regulations impact enterprise green innovation in academic circles. Some argue that strict environmental regulations may limit firms’ ability to innovate. Compliance with regulations could be seen as burdensome and costly, diverting resources away from innovation efforts. Tang et al. (2022) [18] utilized fixed-effects models and threshold panel models with panel data from 30 provinces in China spanning from 2006 to 2015. Their objective was to empirically examine the inherent connection between environmental regulation and green innovation. The findings indicate that environmental regulation significantly contributes to fostering green innovation at the regional level.
Liang et al. (2023) [19] conducted a study spanning from 2010 to 2020 across 258 cities. Their research revealed that environmental regulation tends to elevate firms’ costs, consequently hindering the innovation of green technologies. Conversely, others believe environmental regulations can actually drive innovation within firms, and have conducted in-depth research on this perspective using literature study and empirical analysis. Ren et al. (2023) [20] synthesized and examined a series of separate studies published between 2006 and 2020, concentrating on the relationship between environmental regulation and firms’ technological innovation. Their analysis revealed that existing studies have not reached a consistent conclusion regarding whether environmental regulation serves to promote or inhibit green technology innovation. On the whole, there exists a notable positive correlation between environmental regulation and corporate green innovation.
Shen et al. (2022) [21] concluded that the relationship between environmental regulation and green innovation has an inverted “U” shape, suggesting that green innovation is stimulated as regulations become more stringent. Beyond a certain point, however, further tightening of regulations may begin to discourage innovation. Reasonable and effective environmental regulatory policies being implemented can increase the efficiency of green innovation. Chen et al. (2022) [22] conducted an empirical investigation into the impact of environmental regulations on firms’ green innovation. They utilized OLS and Poisson regression models on panel data sourced from Shanghai and SZSE in China. Their findings indicate that environmental regulations exert a positive moderating influence on firms’ green technology innovation. It is evident that there is no consensus on whether environmental regulation effectively promotes green innovation. Thus, further investigation is warranted to determine if specific environmental regulation policies can indeed stimulate green innovation and explore strategies for enhancing its effectiveness.
The implementation of a policy will consciously encourage enterprises to actively invest in green technology innovation. Throughout this process, enterprises will inevitably undergo technological changes and transformations, leading to upgrades that encourage the advancement of green technologies in line with low-carbon principles and realize the “Porter Hypothesis” [23]. As a key industry for achieving energy conservation, emission reduction, and innovative development, the construction sector will face more stringent standards and policy requirements. To achieve the objective of lowering costs related to energy conservation and emissions reductions, construction enterprises need to enhance their competitive advantages and market position through reforms centered around green technologies. Construction enterprises participating in low-carbon city pilots can acquire additional elements of innovation as well as resources necessary for green technology advancements. Consequently, this enables them to choose greener methods of innovation instead of compromising environmental sustainability. Drawing from the analysis presented earlier, this paper suggests the following hypothesis:
H1: 
Low-carbon city pilot policies, functioning as a form of environmental regulation, play a crucial role in fostering green technological innovation within construction enterprises.

2.2. Government Resource Allocation and Enterprise Green Innovation

Some scholars have discovered that government-led financial allocation can positively stimulate green innovation. Wu et al. (2020) [24] utilized a fixed-effects model to investigate how external government subsidies and resource allocation influenced green technology innovation among Chinese manufacturing firms. Their study revealed that both government subsidies and scarce resources positively influence green technology innovation. Additionally, they discovered that the outcomes for non-state-owned firms aligned with the benchmark regression results, while state-owned firms were significantly different from the benchmark results. This is consistent with the conclusions reached by Han et al. (2024) [25].
In contrast to the former, Zhang et al. (2022) [26] found that state-owned enterprises play a more significant role in promoting green innovation in pilot regions where green financial reform and innovation are underway. However, some studies have also shown that government subsidies and idle resources impede green technology innovation. Incorporating the research findings of Yu et al. (2016) [27] revealed that government subsidies exert a notable crowding-out effect on new energy enterprises. Coming to the same conclusion was Leyva-De et al. (2019) [28]. Liu Z. et al. (2020) [29] used institutional logic theory, finding that firms demonstrated distinct subsidy allocation behaviors between non-green and green innovations. They argue that firms with different property rights hold different endowments of innovation resources and capabilities because they face different environmental and innovation pressures, so state-owned firms exhibit a greater willingness to engage in green innovation activities compared to non-state-owned firms. As a result, there is no consensus on whether government subsidies and idle resources can promote the active generation of green technological innovations by state-owned enterprises.
Low-carbon city pilot policies can better strengthen regional financial support for science and technology. Green innovation involves characteristics such as R&D difficulty, significant risk, and a lengthy revenue cycle. Consequently, substantial capital investment is necessary to undertake these innovative activities. However, many enterprises often lack the financial means to afford these exorbitant costs, leading to a disruption in green technology R&D efforts. Regional governments implementing a low-carbon city pilot policy will offer tax reductions and government subsidies to assist construction enterprises in improving their production methods, minimizing energy consumption and pollution, and embracing the principles of green development. Furthermore, special funds for low-carbon development and green credit policies will be directed toward these regional enterprises in order to alleviate financing constraints and better stimulate them to engage in innovative green technologies.
In China’s market context, the ownership structure of enterprises plays a crucial role in determining the degree of green innovation. Due to the political nature of state-owned businesses, they possess greater advantages in terms of policy resources and are more likely to secure financial support from both governmental institutions and banks for expanding production capabilities and increasing investments in technology. To elevate the level of urban innovation, the government can inspire state-owned firms to augment their R&D investment by intensifying scientific and technological expenditure, as well as fostering green technology innovation within these enterprises. Based on this premise, this paper suggests the following hypothesis:
H2: 
Low-carbon city pilot policies can enhance the willingness of state-owned enterprises to develop green innovation through government environmental subsidies.

3. Data Description and Model Construction

3.1. Data Description

3.1.1. Explanatory Variables

Green innovation is the process of investing some resources and obtaining economic benefits. This process of investing resources includes mainly physical assets, human capital, and financial resources [12]. Green technology innovation in the construction industry relies heavily on knowledge and skills. The outputs of green technological knowledge and technology in the construction industry are usually some technological achievements, which is why the number of green patent applications can be used as an effective metric for green innovation capacity.
In this paper, the count of patent applications related to environmentally friendly technologies, originating from construction firms, was employed as an explanatory factor, with reference to Nie et al. (2023) [30]. The sample companies’ patent applications were filtered using Chinese keywords to extract specific data related to green technology innovation. The keywords were required to be able to reflect the concept of green technology innovation, including protection of the ecological environment, water saving, power saving, energy saving, cleanliness, pollution control, economy, emission reduction, recycling, green, sustainable, and low carbon. For example, the following green technology patents have been searched: 3D printing, BIM, green insulation materials, recycled materials, etc.
The data were sourced from the State Intellectual Property Office (SIPO) and were log-transformed to the number of green patents filed by the company in that year. The data cover the 2000–2019 period. There are two reasons: first, green patents represent a direct reflection of enterprises’ green technology innovation endeavors [31], which are quantifiable and have spillover effects within and outside the industry. Furthermore, in comparison to R&D investments, patents offer distinct advantages due to their precise technical classifications. This enables the further categorization of patent data based on various technical properties, thereby elucidating the diverse value implications and contributions of innovative activities. Secondly, considering the protracted process involved in patent application, employing patent application data instead of patent authorization data allows for a timely examination of the effects.
To ensure the robustness of the benchmark analysis, this paper also utilized the count of green invention patent applications and green utility model patent applications from construction enterprises as explanatory variables, rather than solely relying on the total number of green patent applications. This approach was further subjected to a robustness test.

3.1.2. Control Variables

It is recognized that additional factors of the firms may potentially influence green technology innovation [32]. Thus, this paper also incorporated the inclusion of a set of eight control variables pertaining to firm characteristics, drawing upon the research conducted by Liu et al. (2020) [29] and Zhang et al. (2022) [26]: enterprise size, age, the value of Tobin Q, debt, earnings on total assets, capital intensity, shareholding ratio of the top ten shareholders and the proportion of independent directors. The data used in this study were acquired from the CSMAR database. The authors obtained it through field name searches, collection, and a series of filtering and processing. The method of calculation and source selection for each control variable is shown in Table 1:

3.1.3. Scope of Research

The research scope of this paper involves 79 enterprises in 18 cities, including the initial group of pilot cities, Guangdong Province, Liaoning Province, Guangzhou City, Hangzhou City, Shenzhen City, and Chongqing City; the second batch of pilot cities, Beijing City, Ningbo City, Shanghai City, Urumqi City, and Wuhan City; the third batch of pilot cities, Chengdu City, Hefei City, Jinan City, Nanjing City, and Xining City; and cities that did not implement the pilot policy, Harbin City and Fuzhou City.

3.1.4. Data Descriptive Analysis

Table 2 displays the descriptive statistics of the data concerning the variables of interest.

3.2. Model Building

The multi-period DID method is an extended model of the DID method, which is suitable for the situation where the implementation of time points of policies across different regions varies inconsistently. The premise for the use of this methodology is consistent with the pilot policies of the low-carbon cities studied in this paper. Therefore, the multi-period DID model is suitable for the policy. Referring to the research ideas of the multi-period DID method of Wang et al. [33], the low-carbon city pilot policy was treated as a quasi-natural experiment in this paper. The multi-period DID method was employed to estimate whether the implementation of the low-carbon city pilot has led to improvements in the green innovation levels of construction enterprises. The regions implementing low-carbon city pilot policies were designated as the experimental group in this study, while the regions without pilot policies served as the control group. The dummy variables t r e a t j and t i m e t were constructed to indicate the implementation of the pilot policy. During the observation period, the experimental group required enterprises to be in a low-carbon pilot region and assigned a value t r e a t j of 1; enterprises that were not in the low-carbon city pilot area were set as the control group, and j was assigned a value of 0; t i m e t , to represent a dummy variable for policy implementation. Based on when each pilot province or city was actually included in the pilot policy, we took 1 for the year of inclusion and beyond, and 0 for the year before inclusion.
In order to avoid the unpredictable factors and time effect factors that may affect the interaction term coefficients in the multi-period DID model, this paper added an industry fixed-effect and year fixed-effect to the model. Hence, the final DID model specified in this paper is as follows:
G r e e n i t = β 0 + β 1 t r e a t j × t i m e t + β 2 C o n t r o l s i , t + y e a r t + i n d u s t r y j + ε i , t
The explained variable G r e e n i t is the quantities of green patents of enterprise i in year t; t r e a t j × t i m e t represents the interaction between the policy dummy variable and the core explanatory variable of the model. If the city where the enterprise is registered is implementing a city pilot program in a particular year, the result of the interaction term is 1. If the city where the enterprise is registered has not implemented a low-carbon pilot policy, the result of the interaction term is 0. β 1 quantifies the impact of low-carbon city pilot policies on the green innovation levels of enterprises relative to cities without such policies, while holding constant urban economic factors and macro policy factors.
C o n t r o l s i , t is the control variable related to the green innovation of enterprises, including enterprise size, enterprise age, enterprise Tobin value, enterprise debt, enterprise earnings on total assets, enterprise capital intensity, enterprise independent director ratio, and enterprise top ten shareholders’ shareholding ratio, etc. The researchers found that large-scale companies often exhibit a propensity for risk-taking and demonstrate a willingness to enhance investments in green R&D. Therefore, we incorporated a variable for firm size to control for potential economies of scale in patenting.
Organizational competitiveness increases as firms grow older, and firm age is an important force for innovation. Thus, we included firm age as one of the control variables.
Corporate Tobin Q value is a metric that assesses a company’s market worth in relation to its replacement cost valuation. If Tobin’s Q is greater than 1, this means that the capitalization of a firm exceeds the book value or replacement cost valuation of its assets. The company may increase its investment in innovative technologies because the market perceives the value of its new investment opportunities as exceeding its costs. Conversely, if the Q is less than 1, it means that the market value of the company is lower than the value of its assets. The company may be less optimistic about its prospects and then will limit its investment in new technologies. Therefore, we used the firms’ Tobin Q value as an important variable to control for the firms’ green innovation.
The level of R&D investment is typically constrained by the amount of debt held, return on total assets, and capital intensity. I argue that these three have important implications for green R&D investment. Thus, we introduced them into the panel model. The ratio of independent directors within a firm and the proportion of shares held by the top ten shareholders signify the concentration of capital and the effectiveness of resource allocation. We believe that excessive concentration of firms’ capital will have a negative affect on their investments in green technology R&D. Consequently, we propose incorporating these two variables into the panel model.
Moreover, i n d u s t r y j represents the fixed-effect of individual industry, which can be used to adjust the differences in the industry, while y e a r t denotes the time fixed-effect, which serves to account for and adjust the influence of various policy factors over time, and ε i t represents the random error term, capturing unobserved factors and measurement errors that affect the implicit variable in the panel model.

4. Empirical Analysis

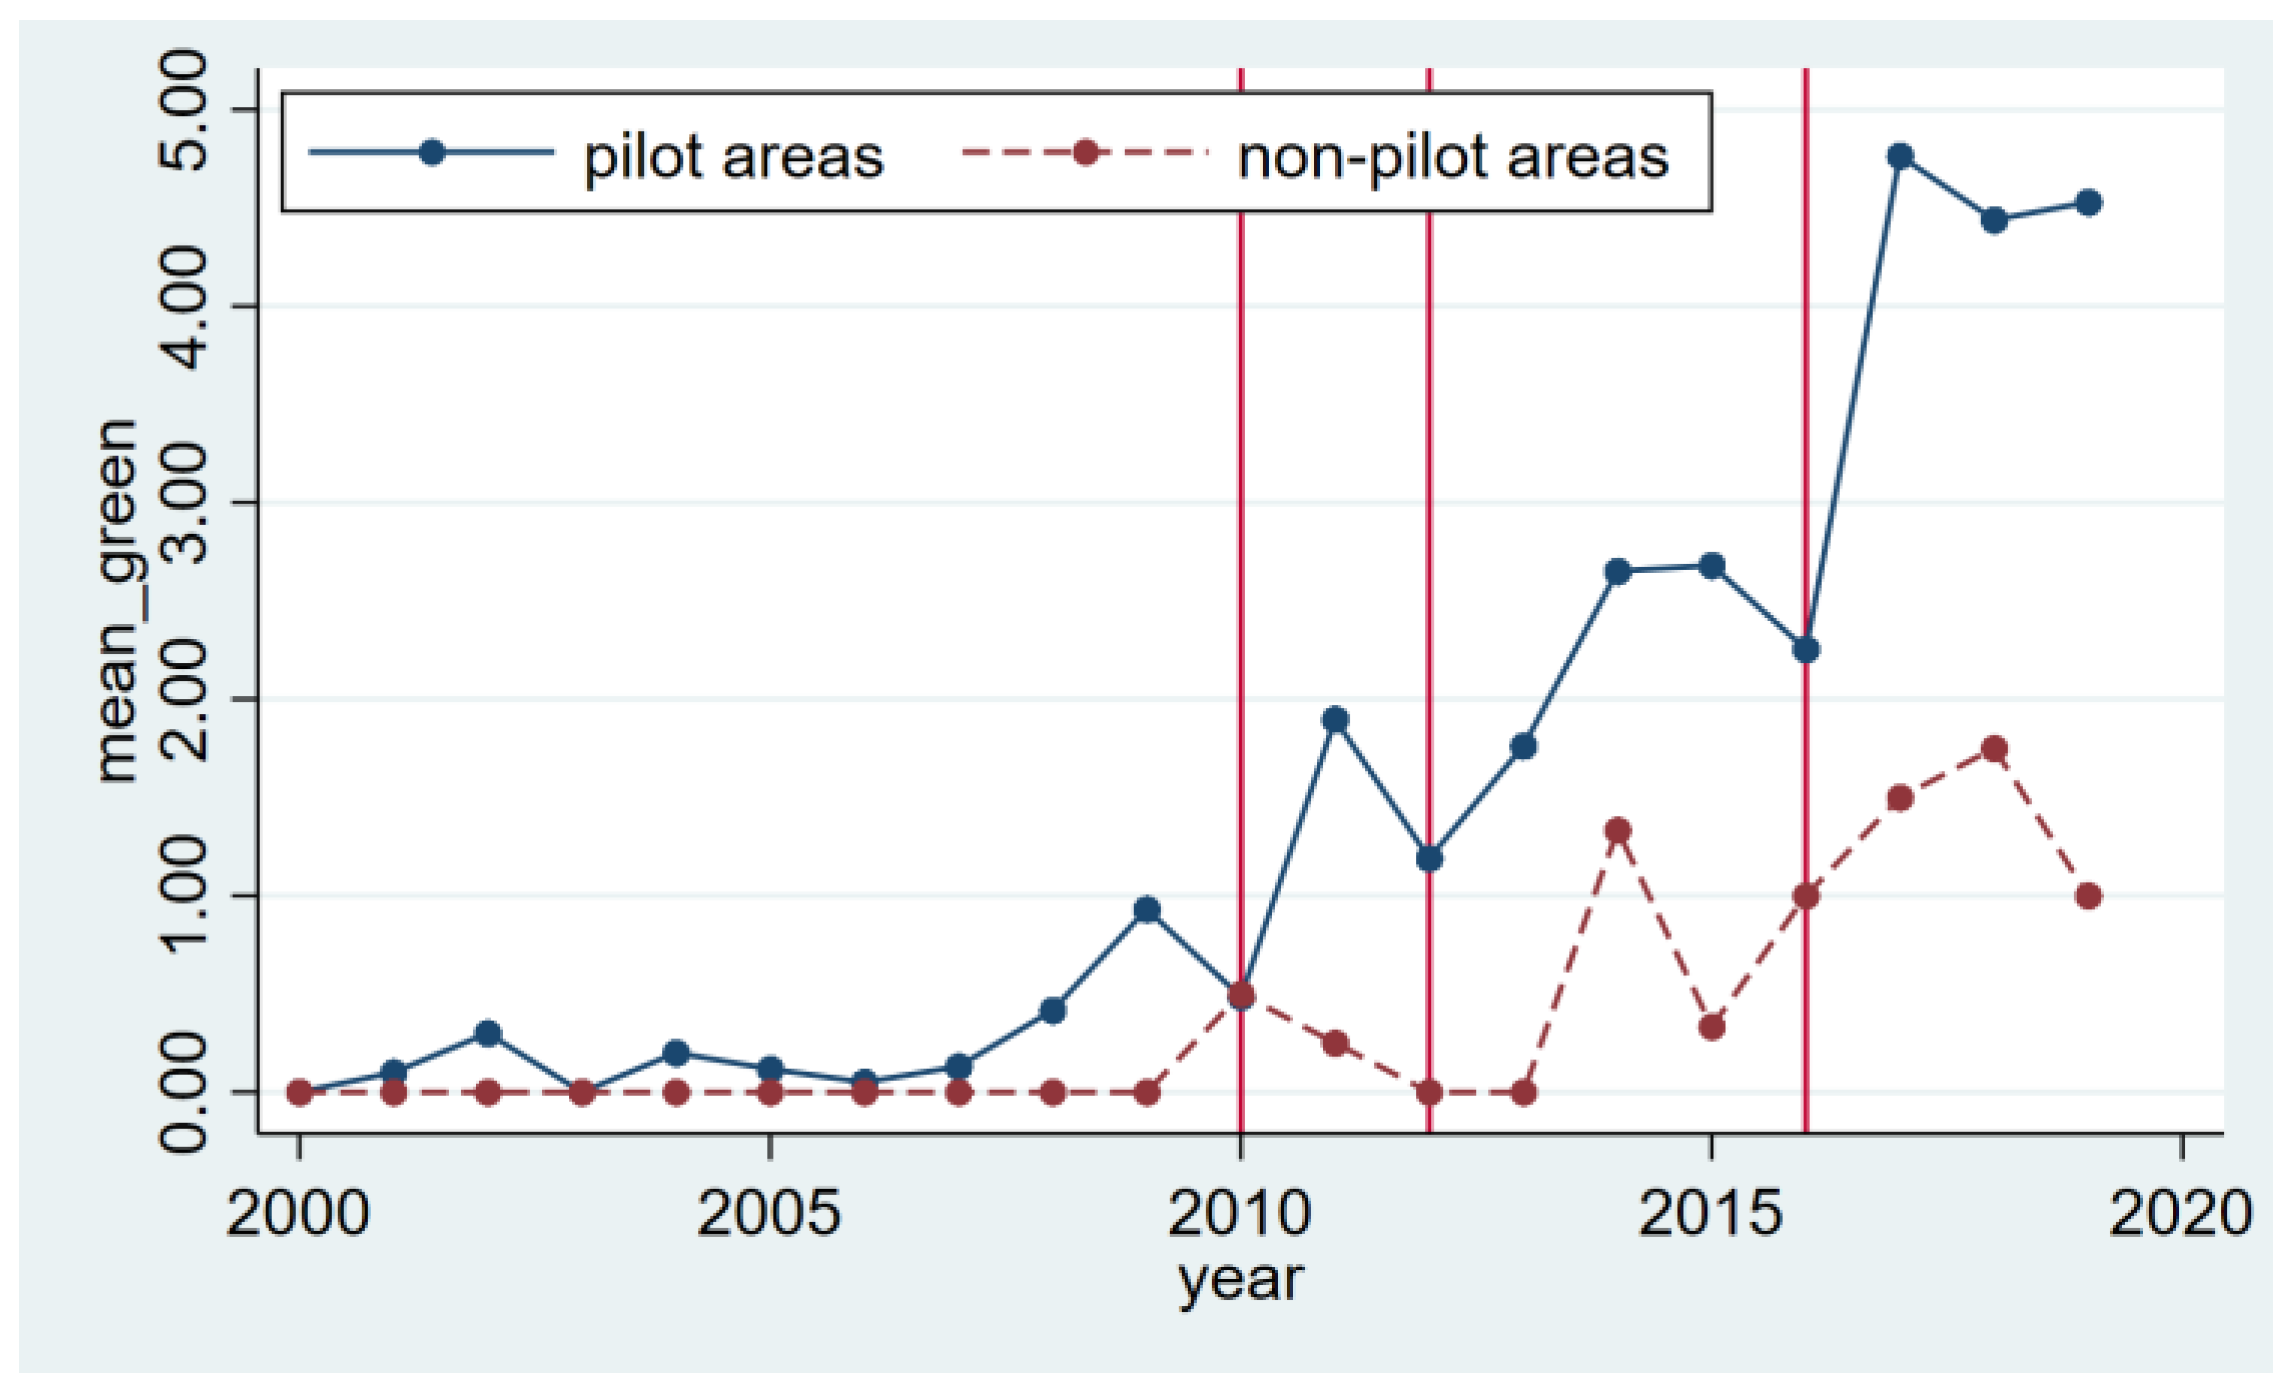
4.1. Parallel Trend Test

To ensure the unbiasedness of the estimates, it is essential for the experimental group and the control group to pass the parallel trend test in a multi-period DID model. This study confirmed, through a parallel trend test, that the trends in the number of green patent applications by construction companies in pilot and non-pilot cities were basically similar. If there was a significant difference between the quantities of green patent applications of construction businesses in pilot cities and the quantities of green patent applications of construction enterprises in non-pilot cities, this would indicate that the parallel trend between the control group and the experimental group was broken after the pilot policy was implemented. Figure 1 shows the results of these tests. The year is located on the horizontal coordinate, and the vertical axis shows the average number of green patent applications filed by construction companies on a city-by-city basis. Meanwhile, the three vertical red lines in Figure 1 represent the years when the three pilot policies were implemented. It can be observed from Figure 1 that pilot areas and non-pilot areas basically maintained a parallel trend before 2010. However, with the implementation of the pilot policy, the level of green patent applications of construction enterprises in the three batches of pilot areas significantly exceeded that in non-pilot areas, and this trend continued until the end of the sample period. In summary, it can be concluded that these cities satisfy the hypothetical preconditions of the multi-period DID model.

4.2. Basic Regression Results

After verifying that the two city groups met the parallel trend test, this paper first performed a multi-period DID regression on the sample data. Table 3 shows the basic regression results for the sample data. The coefficient of the interaction term “City. Post” in the table represents the influence of the introduction of the low-carbon city pilot policy. If the estimated coefficient of the number of green patents is significantly positive, this indicates that the pilot low-carbon city can promote the rapid growth of the green innovation level of local construction enterprises. In Table 3, Model (1) represents the estimated results of the green patent numbers without adding any control variables, and Model (2) represents the regression results of the green patent numbers after adding the control variables. Three batches of pilot cities were covered for the observation period 2010 to 2017, involving 79 construction enterprises in 18 cities. Regression analysis showed that the influence coefficient of the number of green patents applied by construction enterprises was 2.641, and it was statistically significant at 5%. This indicates that low-carbon city pilot policies can promote the green innovation level of construction enterprises. Consequently, hypothesis 1 above can be confirmed. After adding control variables related to the firm’s level of green innovation, such as enterprise scale, enterprise age, enterprise Tobin value, enterprise debt, return on total assets, asset density, shareholding ratio of the top ten shareholders, and proportion of independent directors, the regression coefficient was statistically significant at 1%, and increased from 2.641 to 3.325, indicating that some of the selected control variables affect the effect of policy implementation. If the relevant factors cannot be controlled, the regression results will have certain deviations.

4.3. Robustness Test

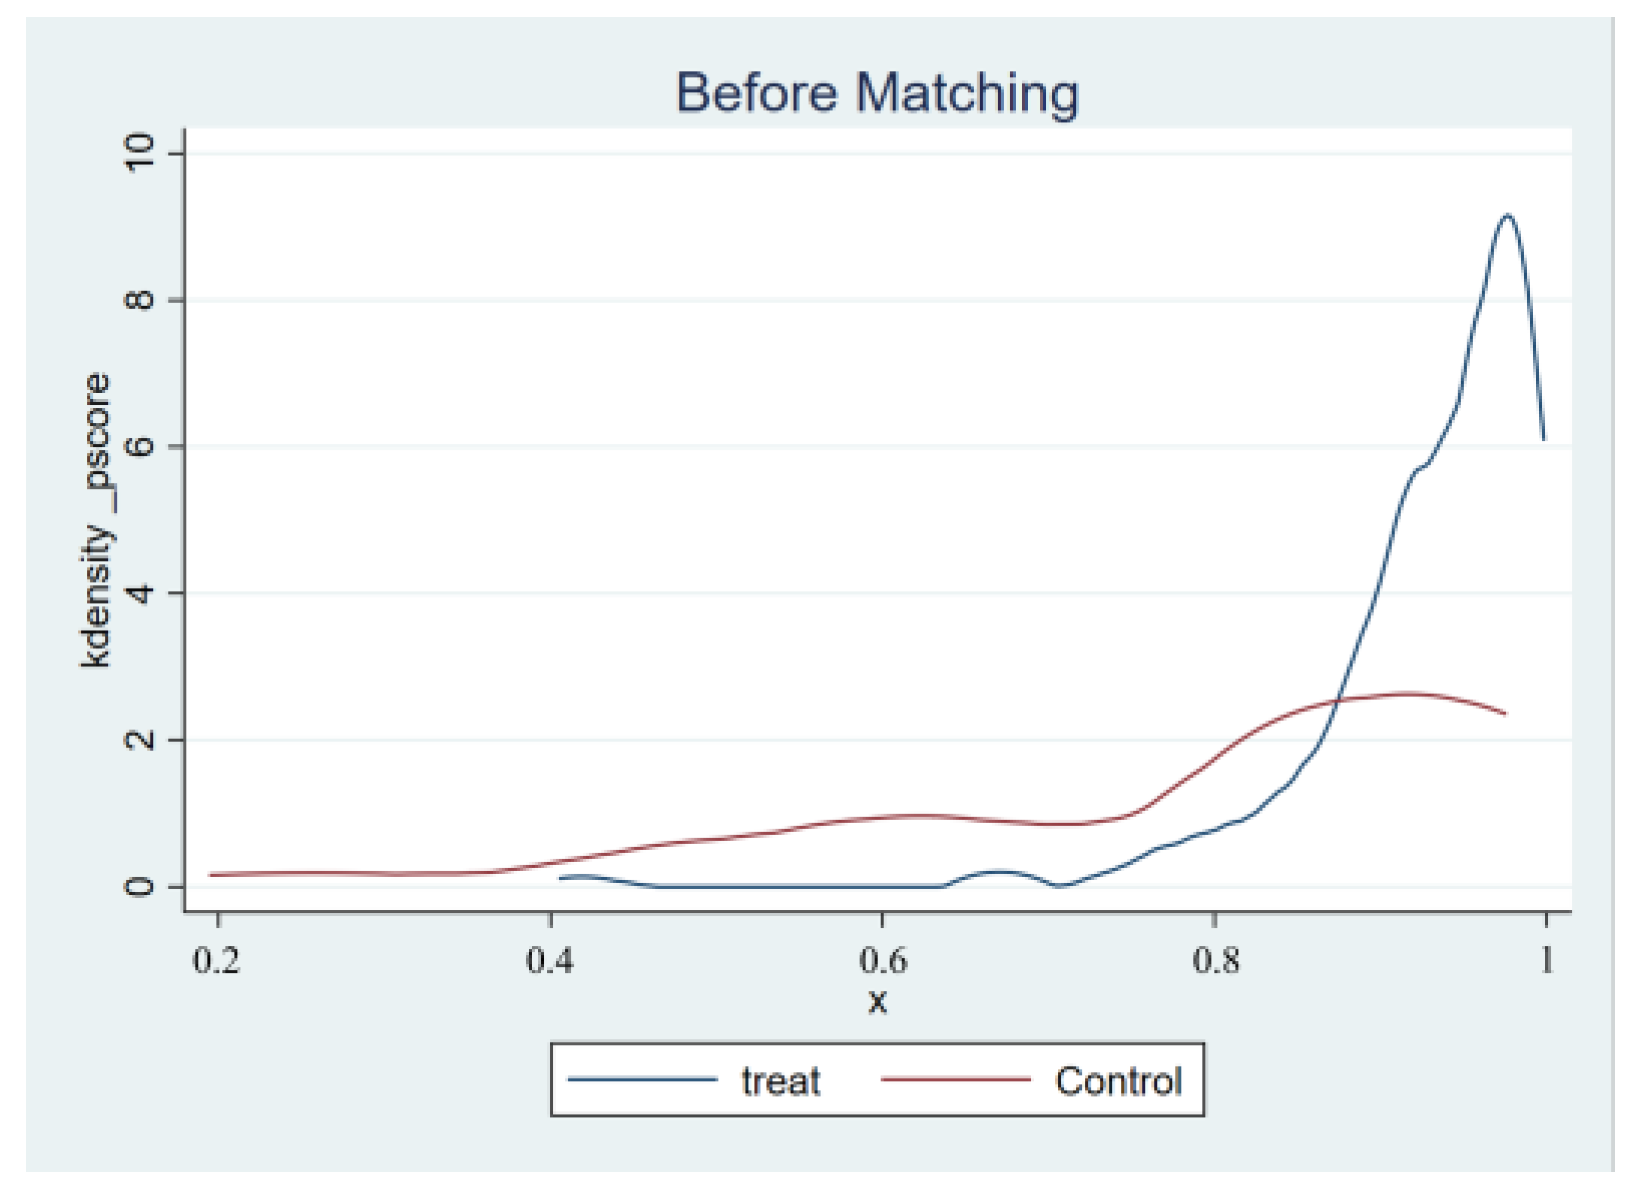
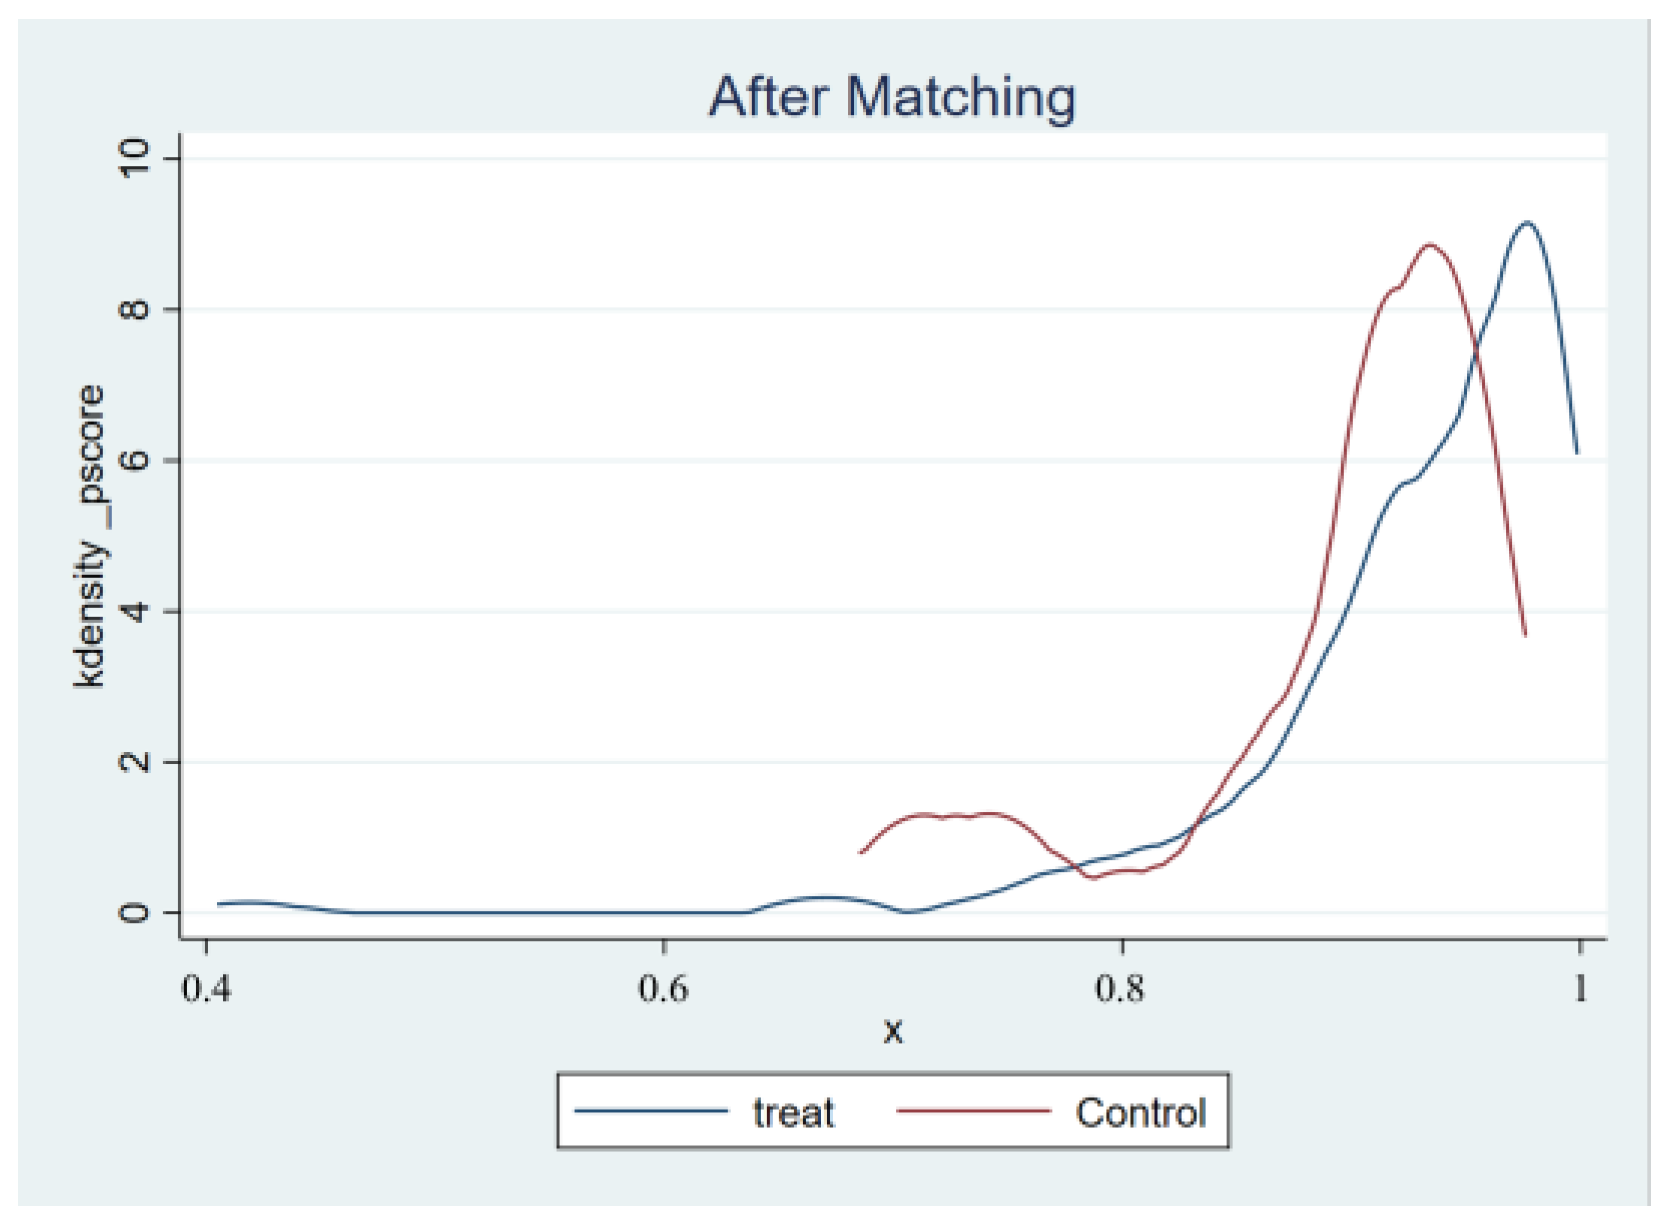
4.3.1. PSM-DID Testing

When using a multi-period DID model, the control and experimental samples need to satisfy parallel trend tests in addition to applying strict exogenous factors. As the implementation of the pilot low-carbon city policy in each city is the result of government-initiated choices, it is not randomly assigned. Therefore, it is necessary to effectively adjust the selection bias of the research sample to correctly evaluate the implementation effect of the pilot policy on low-carbon cities. In summary, the propensity score-matched DID approach was used in this paper to test the robustness of the policy implementation effect.
In order to construct a set of control groups that most closely match the basic situation and the trend of green innovation level of cities that have not practiced low-carbon pilot policies, and taking into account the influence of other factors on the green innovation level of enterprises as well as the availability of data, in this paper, the three variables of the percentage of independent directors, the percentage of shareholding of the top ten shareholders, and the size of the enterprise were selected as the matching variables, and repeated sampling was conducted by using the principle of 1:1 nearest-neighbor matching.
In Stata17.0, this paper plotted the kernel density distribution curves before and after PSM (Figure 2). From Figure 2, it can be clearly seen that the probability density distributions of the control group and the experimental group were quite different before matching, and the probability density distributions were basically the same after matching, which indicates that the matching effect is valid. Then, the matching balance test was conducted on the samples to verify whether the samples after matching could conform to the independent distribution hypothesis. That is, after the matching was completed, there were no significant differences between the samples, and Table 4 shows the equilibrium results for variable matching.
As can be seen in Table 4: (1) The t-values of all variables were not significant after matching. Before performing matching, the samples of the two groups showed significant differences in t-tests with p-values of 0. However, after matching, the p-values of both the control and experimental groups increased and showed non-significance, indicating that the original hypothesis of no difference could not be rejected, i.e., the variables of the control and experimental groups had ideal effects after matching. (2) The standardized deviation significantly declined after matching. For example, the standard deviation of the proportion of independent directors changed from 37.1% to 12.8%; the standard deviation of the proportion of the top ten shareholders changed from 40.8% to −12.5%; and the standard deviation of the enterprise size changed from 59.7% to 17.9%. In addition, Rosenbaum et al. believe that if the absolute value of the standard error is less than 20% after matching, the matching conclusion is credible [34]. It can be observed from Table 4 that the predicted values of the standard deviation after matching were all less than 20%, and thus the prediction results of the PSM are credible.

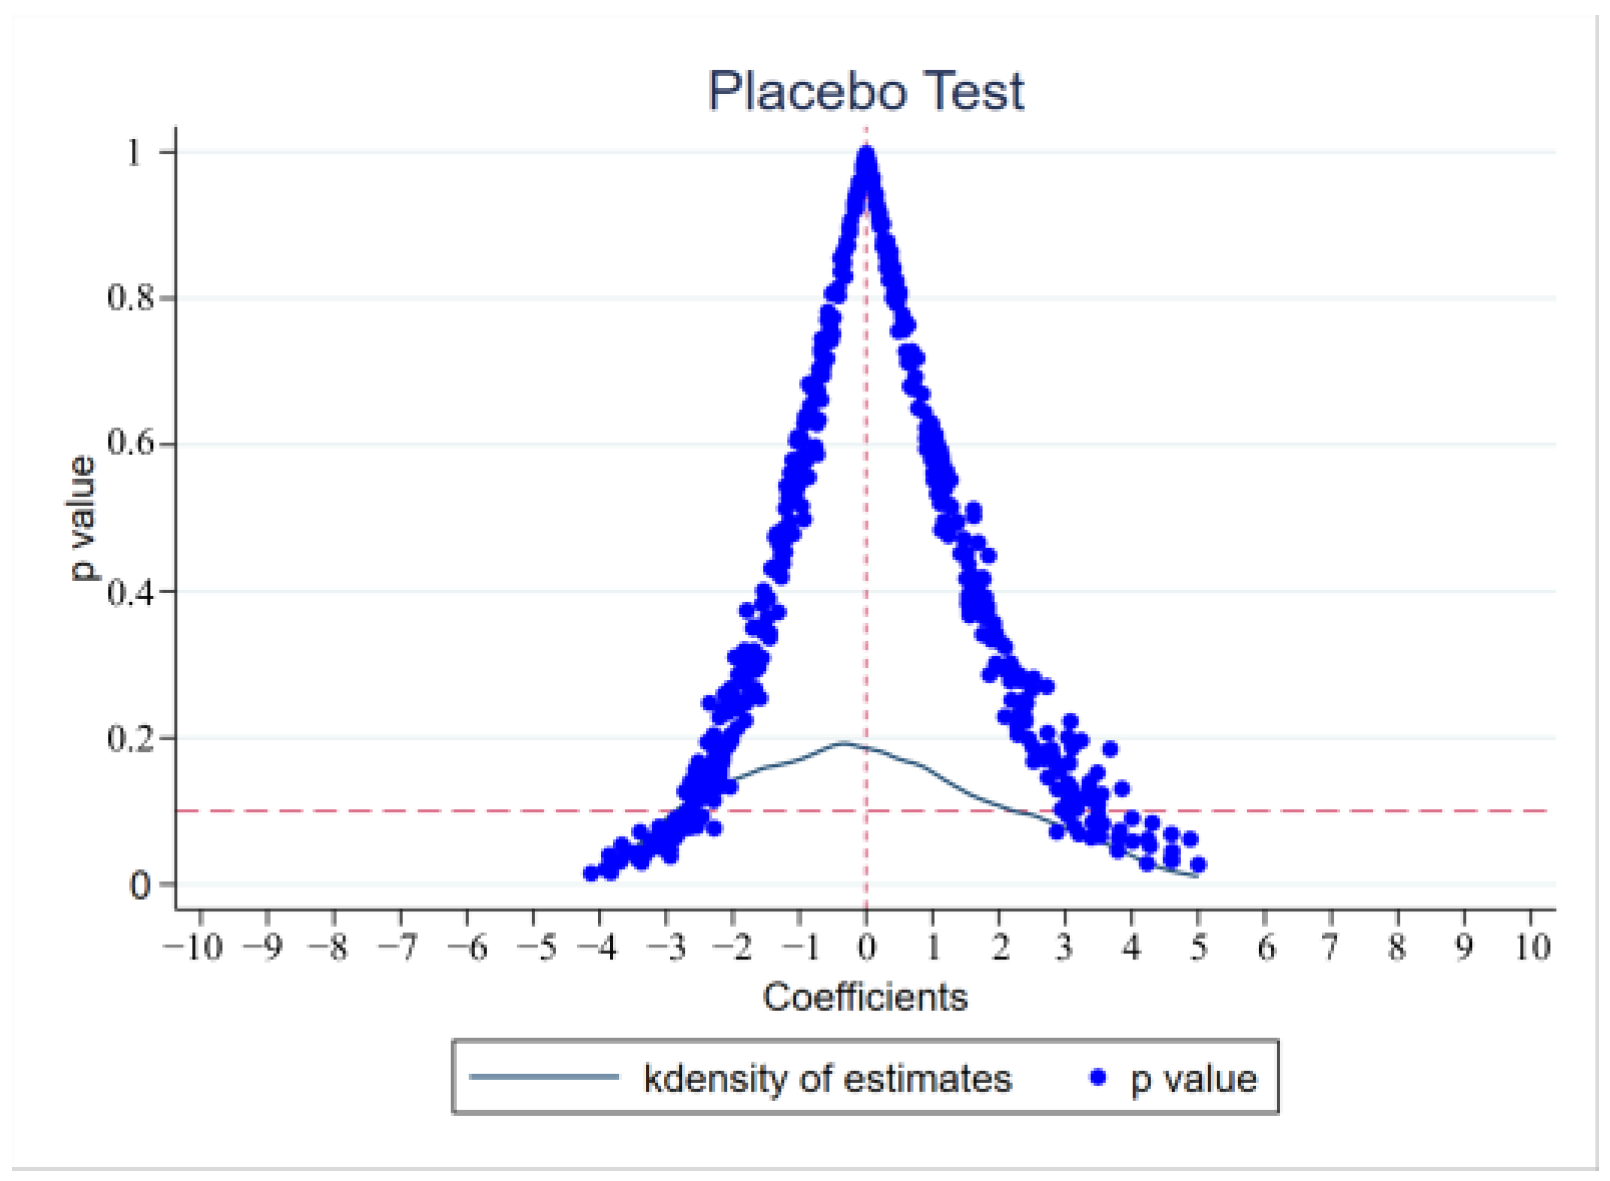
4.3.2. Placebo Testing

The purpose of placebo testing is to test whether there are other unobservable factors that affect the benchmark regression results [35]. The core idea is to randomly fictionalize the treatment group, which is achieved by randomly selecting individuals as the treatment group and repeating the process 500 or 1000 times to look at the “pseudo-policy dummy variables” for regression. In this study, there were 16 cities in the actual treatment group, and for consistency of numbers, the placebo test also sampled 16 cities as a virtual treatment group. while other cities were used as false control groups. After 500 repetitions, the kernel density distribution was drawn. The horizontal dashed line in Figure 3 shows the p-value, which takes the value of 0.1, and the vertical dashed line shows the estimated coefficient, which takes the value of 0. The purpose of these two lines is to give the reader a clearer view of where the p-value and the estimated coefficient are if they satisfy the 10% significance level. Based on the observation from Figure 3, it appears that the regression coefficients are predominantly clustered around the value of 0 and show a normal distribution, indicating that a large number of regression results show an insignificant trend. In addition, in the placebo test, if the coefficient estimates lie in the high tail of the spurious regression coefficients, this implies a low probability event. Therefore, the influence of unobservable omitted variables can be basically excluded.

4.3.3. Replace the Explanatory Variable

The regression results of model (1) in Table 5 were estimated when the total number of green patents was taken as the implicit variable. Model (2) and (3), respectively, represent the regression results obtained when the quantities of green invention patents and the quantities of green utility model patents are explained variables. The above model’s estimation results were obtained under the condition of adding control variables. The regression analysis indicates that the effect of implementing a low-carbon city pilot on the number of green patents in the enterprise’s location city was estimated at 3.325, and it was statistically significant at 1%, which indicates that the implementation of a low-carbon city pilot policy has the potential to enhance the level of green innovation within enterprises to some degree.

4.4. Heterogeneity Analysis

4.4.1. Heterogeneity Analysis of Enterprise Ownership Types

Previous studies have demonstrated that the ownership type of enterprises significantly impacts the extent of green innovation within the Chinese market environment. Gao et al. (2022) [36] found from a survey of Chinese manufacturing firms that state-owned enterprises (SOEs) negatively affect green innovation by strengthening their managerial power. Yu et al. (2021) investigated how financial constraints affect the advancement of green innovation. Their study showed that private firms are subject to more financing constraints than state-owned firms, and their ability to innovate in a green way is jeopardized [37]. Yang et al. (2022) [38] examined the relationship between economic policy uncertainty and green technological innovation, revealing that economic policy uncertainty marginally fosters green innovation among Chinese listed firms. This impact effect is influenced by firm ownership. Their findings noted that state-owned enterprises exhibit a stronger promotional effect on green technology innovation activities compared to non-state-owned enterprises. The unique political characteristics of state-owned enterprises confer them with advantages in terms of policy resources, enabling them to expand production and operations while increasing technology investments. Consequently, it is essential to examine whether disparities exist between state-owned construction enterprises and their non-state-owned counterparts regarding the implementation of low-carbon city pilot policies and the promotion of green innovation levels. To proactively respond to these policies, construction companies with different natures are compelled to augment their operational costs and technology investments. Hence, the objective of this study was to insights into the impact of how the policy affects the level of green innovation in construction firms with different ownership structures.
The regression results of different enterprise ownership types are shown in Table 6. For state-owned construction enterprises, the regression coefficient between the low-carbon city pilot policy and the level of green innovation in enterprises was found to be 2.933, which was statistically significant at 1%. On the other hand, for non-state-owned enterprises, the regression coefficient between the low-carbon city pilot policies and the level of green innovation within enterprises was much lower, specifically 0.014, and not significant. Thus, it is evident that the low-carbon city pilot policy exerts a more pronounced promotional effect on the green innovation level of state-owned construction enterprises compared to their non-state-owned counterparts.

4.4.2. Analysis of Differences in the Life Cycle of Enterprises

When confronted with the same policy stimulus, enterprises at different stages of their life cycles exhibit variations in experience, management approaches, available resources, and other aspects. According to the age of enterprises, the life cycle is divided into three stages: the start-up stage (less than 5 years), the growth stage (from 5 years to less than 10 years), and the mature stage (more than 10 years). Table 7 shows the regression results of the three models. It appears that the regression coefficients for the pilot low-carbon city policy and the level of green innovation of enterprises during the growth and maturity periods were positively significant and statistically significant at 1% in Table 7. In contrast, for construction enterprises in the start-up stage, the regression coefficient of the low-carbon city pilot policy and the level of green innovation was negative and statistically insignificant. This indicates that as enterprises mature, construction enterprises can make full use of the low-carbon city pilot policy to give full play to their ability to stimulate enterprise green innovation. This trend promotes enterprises to continue to explore and practice in green and low-carbon fields, and continuously improve their own green innovation level. Enterprises in the growth stage and the mature stage have cultivated a large number of management personnel and formulated a relatively stable personnel organizational structure during long-term operation. When responding to the low-carbon city pilot policy, these enterprises can grasp the opportunity in time and achieve better development. On the contrary, enterprises in the initial stage are still in the exploratory stage and have not yet established a perfect operation mode. The evidence suggests that the policy will not yield an immediate effect on the green innovation capability of enterprises and it needs to be tested over a period of time.

5. Research Conclusions and Policy Suggestions

5.1. Research Conclusion

Green innovation in the construction industry plays a crucial role in driving national cities toward low-carbon development. This paper used 79 construction enterprises from 2000–2019 as the research object to investigate whether urban pilot policies can motivate green innovation among these enterprises, thereby facilitating the transition toward low-carbon urban development. The findings demonstrated that low-carbon urban pilot policies positively influenced the level of green innovation within construction enterprises, which was further confirmed through robustness tests. These results highlight the effectiveness of low-carbon urban pilot policies in stimulating green innovation among construction enterprises. Moreover, heterogeneity analysis revealed that more established construction enterprises are better positioned to leverage the impact of such policies on promoting green innovation by exploring new knowledge domains and conducting comprehensive research in green and low-carbon fields. Therefore, construction companies in their growth and maturity stages are encouraged to upgrade their level of green innovation. Finally, in the context of firm heterogeneity, it is notable that pilot low-carbon city policies have demonstrated greater significance in promoting the growth of state-owned enterprises.
Alongside the imperative for the construction industry to enhance its green technology innovation endeavors and upgrade to a low-carbon transition, all sectors should join the bandwagon [39,40,41]. This is essential to be able to meet the carbon neutrality target by 2060. The foremost goal of the Chinese government in formulating low-carbon city pilot policies is to internalize carbon neutrality. Green technology innovation activities will be a major factor in the sustainable development of corporations and a necessary activity for the sustainable development of Chinese society, as China’s economy is under tremendous pressure to move to high-quality green technology.
The main contributions of this paper can be summarized as follows: Firstly, this paper enriches the theoretical research on the mechanism of low-carbon city pilot policies and green innovation in the construction industry. Secondly, this paper has important implications for government policy makers and managers of construction firms in developing management practices for strategic green development programs. Thirdly, in addition to assessing the implementation effect of the pilot low-carbon city policy from the perspective of the nature of enterprises, this paper delves deeper into the impact of the pilot low-carbon city policy on enterprises across various growth stages.

5.2. Policy Recommendations

Firstly, low-carbon city pilot policies serve as a catalyst for stimulating green technology innovation within construction enterprises, thereby facilitating China’s progress toward sustainable and low-carbon development. As a flexible policy approach in urban environmental governance, this initiative empowers pilot cities to autonomously craft their own low-carbon development strategies, providing them with a degree of policy flexibility and adaptability. Governments can shift their focus from merely increasing the quantity of environmental regulations to enhancing the substance and effectiveness of environmental regulations. Considering the limited restrictive nature of the low-carbon pilot policies, when formulating environmental regulations, policymakers should take into full consideration the characteristics of their building construction enterprises and formulate corresponding green and low-carbon hard indicators to realize the supervision and guidance of the pilot cities. It is anticipated that through fostering green technology innovation within construction enterprises, both carbon emission reduction and economic development can be achieved.
Furthermore, facilitating the transition of the conventional construction industry toward low-carbon practices emerges as a pivotal undertaking for fostering the advancement of low-carbon cities. To expedite progress in this direction, policymakers should devise more explicit guidance programs for technological transformation to stimulate a heightened level of innovation. The findings indicate that green technology innovation within the construction sector primarily manifests through green utility model patents, with relatively limited impact from pilot policies on more inventive invention patents. Considering that construction enterprises operate within high-carbon industries, green utility model patents exert a positive influence on short-term emission reduction efforts in this domain. In the long run, the key to driving a low-carbon transition in the construction industry lies in more innovative green patent innovations. Consequently, it is recommended that pilot cities elucidate technical transformation guidance programs tailored specifically for construction enterprises to enhance the implementation efficacy of these pilot policies.
Thirdly, it is crucial to allocate greater attention and support toward non-state-owned enterprises, particularly start-ups and those in the growth phase. Firstly, considering the inherent disparities between state-owned and non-state-owned enterprises, there are also certain resemblances as well as divergences in terms of resource accessibility and policy backing. Therefore, the government should enhance incentives and support for non-state-owned construction enterprises to ensure their alignment with the developmental pace of state-owned enterprises. Secondly, construction enterprises belonging to the start-up and growth periods should be given more attention, leveraging the potential of pilot low-carbon city policies to stimulate the secondary growth of mature enterprises. The rapid development of start-up and growth-stage enterprises can be driven by establishing enterprise alliances and other means.
This paper provides a preliminary examination of low-carbon city pilot policies affecting the level of green innovation in construction firms, but there are still some limitations. First of all, as the government has not yet furnished comprehensive data for the past two years, we have selected time-series data only for the years 2000 through 2019. Second, this paper lacks the “time effect” of the influence of low-carbon city pilot policies on enterprises’ green innovation, and subsequent studies can analyze the impact of the time effect by dividing the time between long-term and short-term. Furthermore, existing studies have mainly focused on listed companies and lacked attention to non-listed companies. There are significant differences between non-listed and listed companies in terms of capital structure and enterprise scale. A thorough investigation into the effects of low-carbon pilot policies on the green innovation of non-listed construction companies can serve to complement and enhance existing research efforts.

Author Contributions

Conceptualization, X.M. and L.Z.; methodology, X.M.; resources, L.Z.; data curation, L.Z.; writing—original draft preparation, X.M. and L.Z.; writing—review and editing, X.M. and L.Z.; visualization, X.M.; supervision, X.M.; project administration, X.M. and L.Z.; funding acquisition, X.M. All authors have read and agreed to the published version of the manuscript.

Funding

This research was funded by Jiangsu University Philosophy and Social Science Research Project, Grant No. 2018SJA0134.

Institutional Review Board Statement

Not applicable.

Informed Consent Statement

Not applicable.

Data Availability Statement

Dataset available on request from the authors.

Acknowledgments

Thanks to the judging experts and all members of our team for their insightful advice.

Conflicts of Interest

The authors declare no conflicts of interest.

References

  1. Liu, H.; Li, J.; Sun, Y.; Wang, Y.; Zhao, H. Estimation Method of Carbon Emissions in the Embodied Phase of Low Carbon Building. Adv. Civ. Eng. 2020, 2020, 8853536. [Google Scholar] [CrossRef]
  2. Yao, Q.-Z.; Yin, Z.-M.; Wang, J.-M.; Li, J.-L.; Shao, L.-S. Calculation of Life Cycle Carbon Emissions of Residential Buildings. J. Phys. Conf. Ser. 2023, 2534, 012015. Available online: https://iopscience.iop.org/article/10.1088/1742-6596/2534/1/012015 (accessed on 20 April 2023). [CrossRef]
  3. Guo, X.-M.; Fang, C.-L. Spatio-temporal interaction heterogeneity and driving factors of carbon emissions from the construction industry in China. Environ. Sci. Pollut. Res. Int. 2022, 30, 81966–81983. [Google Scholar] [CrossRef]
  4. Xu, X.; Mumford, T.; Zou, P. Life-cycle building information modelling (BIM) engaged framework for improving building energy performance. Energy Build. 2021, 231, 110496. [Google Scholar] [CrossRef]
  5. Wei, Y.-M.; Chen, K.-Y.; Kang, J.-N.; Chen, W.-M.; Wang, X.-Y.; Zhang, X.-Y. Policy and Management of Carbon Peaking and Carbon Neutrality: A Literature Review. Engineering 2022, 14, 52–63. [Google Scholar] [CrossRef]
  6. Chen, F.; Zhang, W.-Y.; Chen, R.; Jiang, F.-F.; Ma, J.; Zhu, X.-H. Adapting carbon neutrality: Tailoring advanced emission strategies for developing countries. Appl. Energy 2024, 361, 122845. [Google Scholar] [CrossRef]
  7. Hou, Z.-M.; Xiong, Y.; Luo, J.-S.; Fang, Y.-L.; Haris, M.; Chen, Q.-J.; Yue, Y.; Wu, L.; Wang, Q.-C.; Huang, L.-C.; et al. International experience of carbon neutrality and prospects of key technologies: Lessons for China. Pet. Sci. 2023, 20, 893–909. [Google Scholar] [CrossRef]
  8. Beiser-McGrath, L.F.; Bernauer, T.; Prakash, A. Command and control or market-based instruments? Public support for policies to address vehicular pollution in Beijing and New Delhi. Environ. Polit. 2022, 32, 586–618. [Google Scholar] [CrossRef]
  9. Lamperti, F.; Napoletano, M.; Roventini, A. Green Transitions and the Prevention of Environmental Disasters: Market-Based vs. Command-and-Control Policies. Macroecon. Dyn. 2019, 24, 1861–1880. [Google Scholar] [CrossRef]
  10. Gao, Z.; Liu, H.; Xu, X.; Xiahou, X.; Cui, P.; Mao, P. Research Progress on Carbon Emissions of Public Buildings: A Visual Analysis and Review. Buildings 2023, 13, 677. [Google Scholar] [CrossRef]
  11. Wang, L.; Long, X.; Wu, K.-J.; Tseng, M.-L.; Cao, Y. Nexus amongst environmental regulations, carbon emission intensity and technological innovation in China’s construction industry. Environ. Sci. Pollut. Res. 2023, 30, 57915–57930. [Google Scholar] [CrossRef]
  12. Zhang, J.-X.; Ouyang, Y.; Ballesteros-Pérez, P.; Li, H.; Philbin, S.P.; Li, Z.-L.; Skitmore, M. Understanding the impact of environmental regulations on green technology innovation efficiency in the construction industry. Sustain. Cities Soc. 2021, 65, 102647. [Google Scholar] [CrossRef]
  13. Mollaei, S.; Amidpour, M.; Sharifi, M. Analysis and development of conceptual model of low-carbon city with a sustainable approach. Int. J. Environ. Sci. Technol. 2019, 16, 6019–6028. [Google Scholar] [CrossRef]
  14. Chen, J.-Y.; Luo, W.-J.; Ren, X.-H.; Liu, T.-Q. The local-neighborhood effects of low-carbon city pilots program on PM2.5 in China: A spatial difference-in-differences analysis. Sci. Total Environ. 2022, 857, 159511. [Google Scholar] [CrossRef]
  15. Feng, T.; Lin, Z.-G.; Du, H.-B.; Qiu, Y.-M.; Zuo, J. Does low-carbon pilot city program reduce carbon intensity? Evidence from Chinese cities. Res. Int. Bus. Financ. 2021, 58, 101450. [Google Scholar] [CrossRef]
  16. Li, X.; Huang, Y.; Li, J.; Liu, X.; He, J.; Dai, J. The Mechanism of Influencing Green Technology Innovation Behavior: Evidence from Chinese Construction Enterprises. Buildings 2022, 12, 237. [Google Scholar] [CrossRef]
  17. Wu, H.; Xia, S.; Long, X.; Chen, J.; Li, C.; Hao, Y. Innovation under environmental constraints: Does corporate environmental responsibility matter in green innovation? J. Inf. Econ. 2023, 1, 21. [Google Scholar] [CrossRef]
  18. Tang, J.; Li, S. How Do Environmental Regulation and Environmental Decentralization Affect Regional Green Innovation? Empirical Research from China. Int. J. Environ. Res. Public Health 2022, 19, 7074. [Google Scholar] [CrossRef] [PubMed]
  19. Liang, P.; Xie, S.; Qi, F.; Huang, Y.; Wu, X. Environmental Regulation and Green Technology Innovation under the Carbon Neutrality Goal: Dual Regulation of Human Capital and Industrial Structure. Sustainability 2023, 15, 2001. [Google Scholar] [CrossRef]
  20. Ren, G.; Chen, Y. Is the impact of environmental regulation on enterprise green technology innovation incentives or inhibitions? A re-examination based on the China meta-analysis. Front. Environ. Sci. 2023, 10, 3389. [Google Scholar] [CrossRef]
  21. Shen, T.; Li, D.; Jin, Y.; Li, J. Impact of Environmental Regulation on Efficiency of Green Innovation in China. Atmosphere 2022, 13, 767. [Google Scholar] [CrossRef]
  22. Chen, J.; Wang, X.; Shen, W.; Tan, Y.; Matac, L.M.; Samad, S. Environmental Uncertainty, Environmental Regulation and Enterprises’ Green Technological Innovation. Int. J. Environ. Res. Public Health 2022, 19, 9781. [Google Scholar] [CrossRef] [PubMed]
  23. Shen, W.-P.; Wang, Y.; Luo, W.-J. Does the Porter hypothesis hold in China? Evidence from the low-carbon city pilot policy. J. Appl. Econ. 2021, 24, 246–269. [Google Scholar] [CrossRef]
  24. Wu, H.-Q.; Hu, S.-M. The impact of synergy effect between government subsidies and slack resources on green technology innovation. J. Clean. Prod. 2020, 274, 122682. [Google Scholar] [CrossRef]
  25. Han, F.; Mao, X.; Yu, X.-Y.; Yang, L.-G. Government environmental protection subsidies and corporate green innovation: Evidence from Chinese microenterprises. J. Innov. Knowl. 2024, 9, 100458. [Google Scholar] [CrossRef]
  26. Zhang, Y.; Li, X. The Impact of the Green Finance Reform and Innovation Pilot Zone on the Green Innovation—Evidence from China. Int. J. Environ. Res. Public Health 2022, 19, 7330. [Google Scholar] [CrossRef] [PubMed]
  27. Yu, F.; Guo, Y.; Le-Nguyen, K.; Barnes, S.J.; Zhang, W. The impact of government subsidies and enterprises’ R&D investment: A panel data study from renewable energy in China. Energy Policy 2016, 89, 106–113. [Google Scholar] [CrossRef]
  28. Eyva-de la Hiz, D.I.; Ferron-Vilchez, V.; Aragon-Correa, J.A. Do Firms’ Slack Resources Influence the Relationship between Focused Environmental Innovations and Financial Performance? More is Not Always Better. J. Bus. Ethics 2019, 159, 1215–1227. [Google Scholar] [CrossRef]
  29. Liu, Z.-M.; Li, X.; Peng, X.-R.; Lee, S. Green or nongreen innovation? Different strategic preferences among subsidized enterprises with different ownership types. J. Clean. Prod. 2020, 245, 118786. [Google Scholar] [CrossRef]
  30. Nie, C.; Li, R.; Feng, Y.; Chen, Z. The impact of China’s energy saving and emission reduction demonstration city policy on urban green technology innovation. Sci. Rep. 2023, 13, 15168. [Google Scholar] [CrossRef]
  31. Gao, D.; Wong, C.W.Y.; Lai, K.-h. Development of Ecosystem for Corporate Green Innovation: Resource Dependency Theory Perspective. Sustainability 2023, 15, 5450. [Google Scholar] [CrossRef]
  32. Wang, J.; Liu, Z.; Shi, L.; Tan, J. The Impact of Low-Carbon Pilot City Policy on Corporate Green Technology Innovation in a Sustainable Development Context—Evidence from Chinese Listed Companies. Sustainability 2022, 14, 10953. [Google Scholar] [CrossRef]
  33. Xu, X.; Yu, H.; Sun, Q.; Tam, V. A critical review of occupant energy consumption behavior in buildings: How we got here, where we are, and where we are headed. Renew. Sustain. Energy Rev. 2023, 182, 113396. [Google Scholar] [CrossRef]
  34. Rosenbaum, P.R.; Rubin, D.B. Constructing a Control Group Using Multivariate Matched Sampling Methods That Incorporate the Propensity Score. Am. Stat. 1985, 39, 33–38. [Google Scholar] [CrossRef]
  35. Li, H.; Wang, L. Research on the Impact of China’s National Innovation City Pilot Policy on High-Efficiency Agglomeration—Estimation and Analysis Based on DID Models. In Proceedings of the Fifth International Conference on Economic and Business Management (FEBM 2020), Sanya, China, 17–19 October 2020; pp. 37–41. [Google Scholar] [CrossRef]
  36. Gao, K.; Wang, L.; Liu, T.-T.; Zhao, H.-Q. Management executive power and corporate green innovation—Empirical evidence from China’s state-owned manufacturing sector. Technol. Soc. 2022, 70, 102043. [Google Scholar] [CrossRef]
  37. Yu, C.; Wu, X.; Zhang, D.; Chen, S.; Zhao, J. Demand for green finance: Resolving financing constraints on green innovation in China. Energy Policy 2021, 153, 112255. [Google Scholar] [CrossRef]
  38. Yang, X.; Mao, S.; Sun, L.; Feng, C.; Xia, Y. The Effect of Economic Policy Uncertainty on Green Technology Innovation: Evidence from China’s Enterprises. Sustainability 2022, 14, 11522. [Google Scholar] [CrossRef]
  39. Vladimirov, I.; Vicentiy, A.; Gavrilov, O. Modern cloud technologies for business and industry: Opportunities and trends for Russian & Global markets. J. Inf. Econ. 2023, 1, 18. [Google Scholar] [CrossRef]
  40. Li, L. Online consumers build trust with online merchants through real-time interaction function. J. Inf. Econ. 2023, 1, 17. [Google Scholar] [CrossRef]
  41. Ma, J.; Hu, Q.; Shen, W.; Wei, X. Does the Low-Carbon City Pilot Policy Promote Green Technology Innovation? Based on Green Patent Data of Chinese A-Share Listed Companies. Int. J. Environ. Res. Public Health 2021, 18, 3695. [Google Scholar] [CrossRef]
Figure 1. Parallel trend tests for multi-period double difference models.
Sustainability 16 02964 g001
Figure 2. Kernel density function before and after matching.
Sustainability 16 02964 g002aSustainability 16 02964 g002b
Figure 3. Distribution of estimated coefficients and p values of policy cities.
Sustainability 16 02964 g003
Table 1. Selection of control variables.
Variable NameCalculation MethodData Source
Quantities of green patent applicationsNumber of searches cumulativeSIPO
Enterprise sizeLogarithm of the total capital at the end of the year for enterpriseCSMAR
Enterprise ageThe logarithm of the duration of the enterprise‘s listingCSMAR
Tobin QThe logarithm of enterprise’s Tobin QCSMAR
Enterprise debtThe amount of loans obtained by the enterprise in the current year/total assetsCSMAR
Earnings on total assetsNet profit of the enterprise/total assetsCSMAR
Capital intensityTotal assets of the enterprise/operating revenueCSMAR
Shareholding ratio of the top ten shareholdersShareholdings held by the top ten shareholders/total sharesCSMAR
Proportion of independent directorsNumber of independent directors/total number of board membersCSMAR
Table 2. Descriptive analysis of data.
VariableObsMeanStd. Dev.MinMax
Number of green patent applications7372.1195.422043
Enterprise size7376.29 × 10102.05 × 10111.07 × 1072.03 × 1012
Enterprise age7378.1766.424027
Tobin Q7371.3630.4980.8494.951
Enterprise debt7370.6360.1940.0281.890
Earnings on total assets7370.2290.057−0.8590.502
Capital intensity7370.6440.3320.0151.961
Shareholding ratio of the top ten shareholders73756.80318.5280.8895.38
Proportion of independent directors7370.3670.11000.8
Table 3. Influence of low-carbon city pilot policies on the green innovation level of the construction enterprises.
Variable(1)(2)
Number of Green PatentsNumber of Green Patents
City. post2.641 **3.325 ***
(2.799)(3.021)
Enterprise size 0.696
(1.577)
Enterprise age 1.118 **
(2.461)
Tobin Q 3.837 **
(2.153)
Enterprise debt −0.157
(−0.049)
Earnings on total assets 13.895 *
(1.834)
Capital intensity −5.448
(−1.105)
Shareholding ratio of the top ten shareholders −0.029 **
(−2.461)
Proportion of independent directors 0.072
(0.011)
Individual fixation effectControlControl
Year fixed effectControlControl
N737737
R20.2590.305
Note: The values in the brackets below the estimated coefficients are statistics t, * p < 0.1, ** p < 0.05, *** p < 0.01. “Control” in the table indicates that the control variable has been controlled.
Table 4. Balance Test of Matched Variables.
VariableUnmatchedMean% reductt-testV(T)/
MatchedTreatedControl% bias|bias|tp > |t|V(C)
Proportion of independent directorsU0.03990.367437.165.64.550.0001.53 *
M0.38850.377712.81.630.1040.98
Shareholding ratio of top ten shareholdersU59.38752.0440.869.25.060.0000.81
M57.20259.461−12.5−1.750.0811.15
Enterprise sizeU23.42422.44759.770.07.310.0001.78 *
M23.00322.7117.92.350.0190.74 *
Note: * indicate statistical significance at the 10%.
Table 5. Regression results of substituted explained variables.
Variable(1)(2)(3)
Number of Green PatentsNumber of Green Invention PatentsNumber of Green Utility Model Patents
City. post3.325 ***3.109 ***0.216
(3.021)(5.323)(0.414)
Enterprise size0.6960.3190.378 *
(1.577)(1.181)(2.025)
Enterprise age1.118 **0.5670.552
(2.461)(1.426)(1.235)
Tobin Q3.837 **1.4562.381 *
(2.153)(1.433)(2.004)
Enterprise debt−0.157−0.7840.626
(−0.049)(−0.681)(0.289)
Earnings on total assets13.895 *6.065 **7.830
(1.834)(2.443)(1.360)
Capital intensity−5.448−3.559−1.889
(−1.105)(−1.342)(−0.822)
Shareholding ratio of the top ten shareholders−0.029 **−0.007−0.022 **
(−2.461)(−1.626)(−2.701)
Proportion of independent directors0.072−1.3001.372
(0.011)(−0.398)(0.387)
Individual fixation effectControlControlControl
Year fixed effectControlControlControl
N737737737
R20.3050.2890.306
Note: The values in the brackets below the estimated coefficients are statistics t, * p < 0.1, ** p < 0.05, *** p < 0.01. “Control” in the table indicates that the control variable has been controlled.
Table 6. Regression results of different enterprise natures.
Variable(1)(2)(3)
All Construction EnterprisesState-Owned EnterprisesNon-State-Owned Enterprises
City. post3.325 ***2.933 **0.014
(3.021)(2.312)(0.004)
Enterprise size0.6960.627−0.271
(1.577)(0.874)(−0.082)
Enterprise age1.118 **1.055 *0.040
(2.461)(1.952)(0.017)
Tobin Q3.837 **3.136 **3.895
(2.153)(2.366)(1.161)
Enterprise debt−0.157−0.7821.728
(−0.049)(−0.316)(0.353)
Earnings on total assets13.895 *14.075 **11.427
(1.834)(2.177)(0.466)
Capital intensity−5.448−10.543 **2.237
(−1.105)(−2.538)(1.009)
Shareholding ratio of the top ten shareholders−0.029 **−0.008−0.075
(−2.461)(−0.226)(−1.053)
Proportion of independent directors0.072−2.876−3.376
(0.011)(−0.482)(−0.313)
Individual fixation effectControlControlControl
Year fixed effectControlControlControl
N737387228
R20.3050.4210.384
Note: The values in the brackets below the estimated coefficients are statistics t, * p < 0.1, ** p < 0.05, *** p < 0.01. “Control” in the table indicates that the control variable has been controlled.
Table 7. Regression results of enterprise life cycle difference analysis.
Variable(1)(2)(3)
Start-Up EnterpriseGrowing EnterpriseMature Enterprise
City. post−16.2653.174 ***5.980 ***
(−1.120)(2.928)(6.571)
Enterprise size1.1940.721 *1.617
(0.576)(1.930)(1.710)
Enterprise age5.9933.974 **0.703
(1.759)(2.165)(0.213)
Tobin Q1.3760.224−4.996
(0.753)(0.066)(−0.979)
Enterprise debt−24.48810.664−19.707
(−0.586)(1.246)(−0.949)
Earnings on total assets3.957−5.638−17.350 *
(1.408)(−1.159)(−2.022)
Capital intensity−0.058 **−0.032 ***−0.045
(−2.162)(−2.933)(−0.555)
Shareholding ratio of the top ten shareholders−18.273 ***0.6701.231
(−6.021)(0.101)(0.103)
Individual fixation effectControlControlControl
Year fixed effectControlControlControl
N184615245
R20.4890.3020.493
Note: The values in the brackets below the estimated coefficients are statistics t, * p < 0.1, ** p < 0.05, *** p < 0.01. “Control” in the table indicates that the control variable has been controlled.
Disclaimer/Publisher’s Note: The statements, opinions and data contained in all publications are solely those of the individual author(s) and contributor(s) and not of MDPI and/or the editor(s). MDPI and/or the editor(s) disclaim responsibility for any injury to people or property resulting from any ideas, methods, instructions or products referred to in the content.

