Article

Manufacturing Execution System Application within Manufacturing Small–Medium Enterprises towards Key Performance Indicators Development and Their Implementation in the Production Line

Department of Industrial Engineering, University of Bologna Alma Mater Studiorum, Via Fontanelle 40, 47121 Forlì, Italy
*
Author to whom correspondence should be addressed.
Sustainability 2024, 16(7), 2974; https://doi.org/10.3390/su16072974
Submission received: 1 March 2024 / Revised: 29 March 2024 / Accepted: 1 April 2024 / Published: 3 April 2024
(This article belongs to the Special Issue Sustainable, Resilient and Smart Manufacturing Systems)

Abstract

:
This paper explores the importance of smart manufacturing in the context of Industry 4.0, highlighting the crucial role of Manufacturing Execution Systems (MESs) in facilitating Industry 4.0, particularly in data capture and process management. It is worth noting that Small and Medium Enterprises (SMEs) face several obstacles, unlike large companies that have the resources to adopt these principles. This text explores the challenges that SMEs encounter when adopting Industry 4.0, considering budget constraints and technology transfer difficulties. The potential benefits of such projects are often difficult to measure during the initial stages, but they can facilitate the digital transformation of small businesses. To support this thesis, this paper presents an example of MES implementation in a manufacturing SME, showcasing the creation of a comprehensive data monitoring and industrial performance assessment system. This paper aims to introduce a systematic approach for integrating a Key Performance Indicator (KPI) framework using MESs within an SME. This paper highlights the importance of transitioning from big data to smart data to achieve outcomes in terms of operational efficiency, cost analysis, workload management, resource utilisation, knowledge dissemination, and enhanced operator engagement.

1. Introduction

Smart manufacturing has become a significant trend in the manufacturing industry in recent years [1]. Enterprises are increasingly seeking flexibility, efficiency [2], and sustainability in production in order to optimise costs and remain competitive in the market. Smart manufacturing relies on advanced technologies such as automation, robotics, artificial intelligence, and Internet of Things (IoT) [1,2]. The effectiveness and resilience of smart manufacturing systems are closely tied to the level of digitisation within an enterprise. Integrating Industry 4.0 technologies can enhance efficiency and provide manufacturing systems with the resilience required to overcome global challenges. This approach, based on digitisation and technological integration, may enable manufacturers to innovate and succeed in an increasingly complex and competitive environment [3]. Currently, large enterprises have achieved a significant level of digitalisation, with numerous machines capable of generating large quantities of different types of data (big data) [4], which can be collected, managed, and analysed to create new business opportunities [5]. Data are associated with Industry 4.0 technologies and pose a considerable challenge in implementing its main paradigm—Cyber Physical Systems—particularly for Small–Medium Enterprises (SMEs) [6,7,8].
The aim of this study is to present a methodology for identifying and selecting KPIs to manage and monitor the production processes of a SME using Industry 4.0 tools and technologies.

1.1. The Goals of Industry 4.0

Since April 2013, when the Industry 4.0 Working Group published its final report, academia and industry endeavoured to fully comprehend the new technology paradigm and its applications. Despite initial uncertainties, a comprehensive definition of Industry 4.0 was proposed [9]: “Industry 4.0 is a manufacturing philosophy that includes modern automation systems with a cretin level autonomy, flexible and effective data exchanges encoring the implementation of next generation production technologies, innovation in design, and more personal and more agile in production as well as customized products”.
In a more practical way, the goals of Industry 4.0 are the following [10]:
  • To provide IT-enabled mass customisation for manufactured products.
  • To make automatic and flexible adaptation of the production chain.
  • To track parts and products.
  • To facilitate communication among parts, products, and machines.
  • To apply human–machine interaction paradigms.
  • To achieve IoT-enabled production optimisation in smart factories.
  • To provide new types of services and business models of interaction in the value chain.

1.2. Manufacturing Execution System for Industry 4.0

A Manufacturing Execution System (MES) is an enabling technology for Industry 4.0 due to the high demand for data in the current technological context. This capability facilitates the collection of heterogeneous data and the development of process management indicators. Decentralised decision-making has resulted from building an enterprise’s Cyber Physical Systems. Therefore, enterprises must consider how to apply MES technology in accordance with this approach to both decision-making and monitoring [5]. The interconnection of systems with the production process can enable enterprises to become more intelligent and create a fertile environment of possibilities, which can usher in a new era of big data analysis [2]. It is believed that Industry 4.0 has the capability to streamline the processes required for implementing a Total Quality Management (TQM) approach [11].
Furthermore, although limited research emphasises this connection, Industry 4.0 technologies have the intrinsic capability to collect and exchange data, which can aid in the move towards environmental, social, and economic sustainability in various industries [12,13]. Collecting and assessing data from production processes provides the basis for advancing towards Industry 4.0 or Industry 5.0, as defined by the EU in 2021 [14]. Industry 5.0 acknowledges the capacity of industry to achieve societal objectives beyond job creation and economic growth and to become a resilient source of prosperity by ensuring that production conforms to the limits of our planet and prioritises the welfare of industry workers in the production process [14].

1.3. Differences between SMEs and Large Companies in Industry 4.0

While large companies have the resources to address these innovative issues, SMEs face many barriers to adopting new technologies, including financial constraints, a lack of established standards, and the challenge of transferring research-based technology to an industrial context. These barriers for SMEs have been reported through specific statistics by Elhusseiny et al., which also highlights the opportunities in adopting these systems. [15]. Coping with these obstacles requires a significant amount of effort, which is often beyond the capabilities of SMEs. The implementation process and the digital transition often produce outcomes that are difficult to quantify, making it challenging to determine the value of an investment and its impact on the organisation [16].
Therefore, this paper aims to illustrate a practical application within an Italian SME where a comprehensive data monitoring and industrial performance assessment system based on MESs and Key Performance Indicators (KPIs) has been established. It proposes specific KPIs for monitoring a manufacturing SME that can be calculated through the application of an MES, addressing the barriers that an SME may face. The system provides a framework for SMEs to make informed and measurable choices towards enterprise sustainability despite persistent uncertainty surrounding the practical implementation of data monitoring strategies through Industry 4.0 technologies [17].

2. State-of-the-Art: MES Integration in Industry 4.0 and SMEs

A Manufacturing Execution System (MES) can be a valuable tool for linking shop floor operations and enterprise strategy, particularly in the context of Industry 4.0. While MESs have traditionally been adopted by larger enterprises, it is important to consider the unique challenges that integrating MESs may pose for SMEs. This discussion aims to explore both the challenges and opportunities that SMEs may encounter when adopting MESs, with the goal of enhancing operational efficiency and monitoring overall performance.

2.1. Manufacturing Execution Systems (MESs)

A MES forms the basis of the practical development outlined in this paper.
Positioned between the Device level and the Enterprise level, illustrated in Figure 1, an MES collects and manages production information in greater detail than Supervisory Control and Data Acquisition (SCADA) and Human Machine Interface (HMI) systems yet with less aggregation than the strategic information provided by Enterprise Resource Planning (ERP). This position is responsible for managing day-to-day and real-time operations in production departments. It ensures consistent data are provided to management KPIs chosen by the enterprise for the production process [18].
MESs are widely used technologies, particularly in large enterprises, due to their high productivity and minimal product variations. An MES operates with high levels of automation and integrates seamlessly, allowing for continuous monitoring through data collection and KPI calculation [19]. This tool is a statistical data processing system that provides comprehensive insights into production performance, including material input, consumable utilisation, product flow, and faults [20]. Thanks to these data and the Industry 4.0 manufacturing paradigm, Kuys Blair et al. state that it is possible to create more durable and sustainable products [21].
According to the MESA-11 model, an MES should implement eleven specific functionalities, listed in Table 1, to fully integrate with the Industry 4.0 paradigm [22]:
However, Ardeshir Shojaeinasab et al. propose an MES classification in relation to Industry 4.0, as no existing MES model provides all the listed features [18]:
(1)
Digitalisation and computerisation of an MES: Data from each information source are collected automatically in real-time and sent to the MES.
(2)
Visibility and sensor-based MES: MES operations highly rely on sensor readings to figure out the current production status.
(3)
Transparency and adding perception to an MES: This level implies the adoption of smart sensors and intelligent software to gather more structured information about the production process.
(4)
Prediction and utilising prediction methods in an MES: The system can anticipate the requirement for maintenance of machinery, equipment, and robotics.
(5)
Adaptability and self-optimisation: That is the final maturity level, where the use of real-time data allows the system to make the best possible decision in relation to the facing scenario.

2.2. Application within SMEs

In addition to the theoretical definition, as far as SMEs are concerned, there are only a few instances of MES adoption [23] and implementation frameworks presented in the literature [24]. This poses a major concern for SMEs, as they cannot afford mistakes in investment and risk losing their competitive edge [20,25]. If the investments for MES implementation were undertaken, multiple difficulties would be encountered in practically carrying out the project [25]:
(1)
Ineffective closed loop: Enterprises measure their performance using specific KPIs. However, if these KPIs are not connected to the shop floor data, the implementation process remains incomplete.
(2)
Fragmented infrastructure: The heterogeneity of the production environment poses a strong barrier to data collection and communication between the different technologies involved in MES monitoring.
(3)
Inflexible processes: SMEs aspire to quickly respond to a volatile market. However, despite their IT system and MESs being able to manage information effectively, the production system cannot keep up with the demand of the market.
(4)
Inefficient data: Inadequate data collection contributes to incomplete information, which can negatively impact the real-time functioning of the MES.
(5)
Ineffective data: The selection of raw data from the shop floor is necessary to reconstruct the context, which will give the data a clear meaning. The aim is not the collection of big data but smart data that can aid in effective decision-making.
After collecting data on the MES database, KPIs are defined to reduce complexity, enabling the transition from big data to smart data and facilitating the elaboration of strategic information for process management [26].
In recent years, numerous papers have proposed frameworks for creating and implementing successful KPI monitoring systems in enterprises [27,28,29,30], as well as in an SME network [31]. Furthermore, various studies have explored suitable dashboard and visualisation systems [30,32]. Despite the available literature, there is a lack of manufacturing SME examples and a tailored implementation process to meet the specific requirements of small enterprises regarding performance measurement.

3. Methodology

Today’s manufacturing companies, especially SMEs, must optimise their operations to decrease production time and expenses. Achieving this objective requires the implementation of an MES system that can effortlessly incorporate data originating from both the shop floor and external information systems. Nevertheless, this technology has not been widely adopted in SMEs due to economic constraints and challenges associated with adapting the system to non-series production. Additionally, two other factors contribute to the low adoption:
(1)
Lack of approach that enables SMEs to implement the system and monitor their process through numerical indicators.
(2)
Lack of entrepreneurial foresight regarding the benefits of this implementation. This difficulty mainly arises from the challenge of quantifying the economic returns of investments in terms of data collection and management, while the outcomes are clear.
The succeeding sections present the methodology for implementing MESs within manufacturing SMEs, along with a specific industrial case study in which the same methodology has been executed.

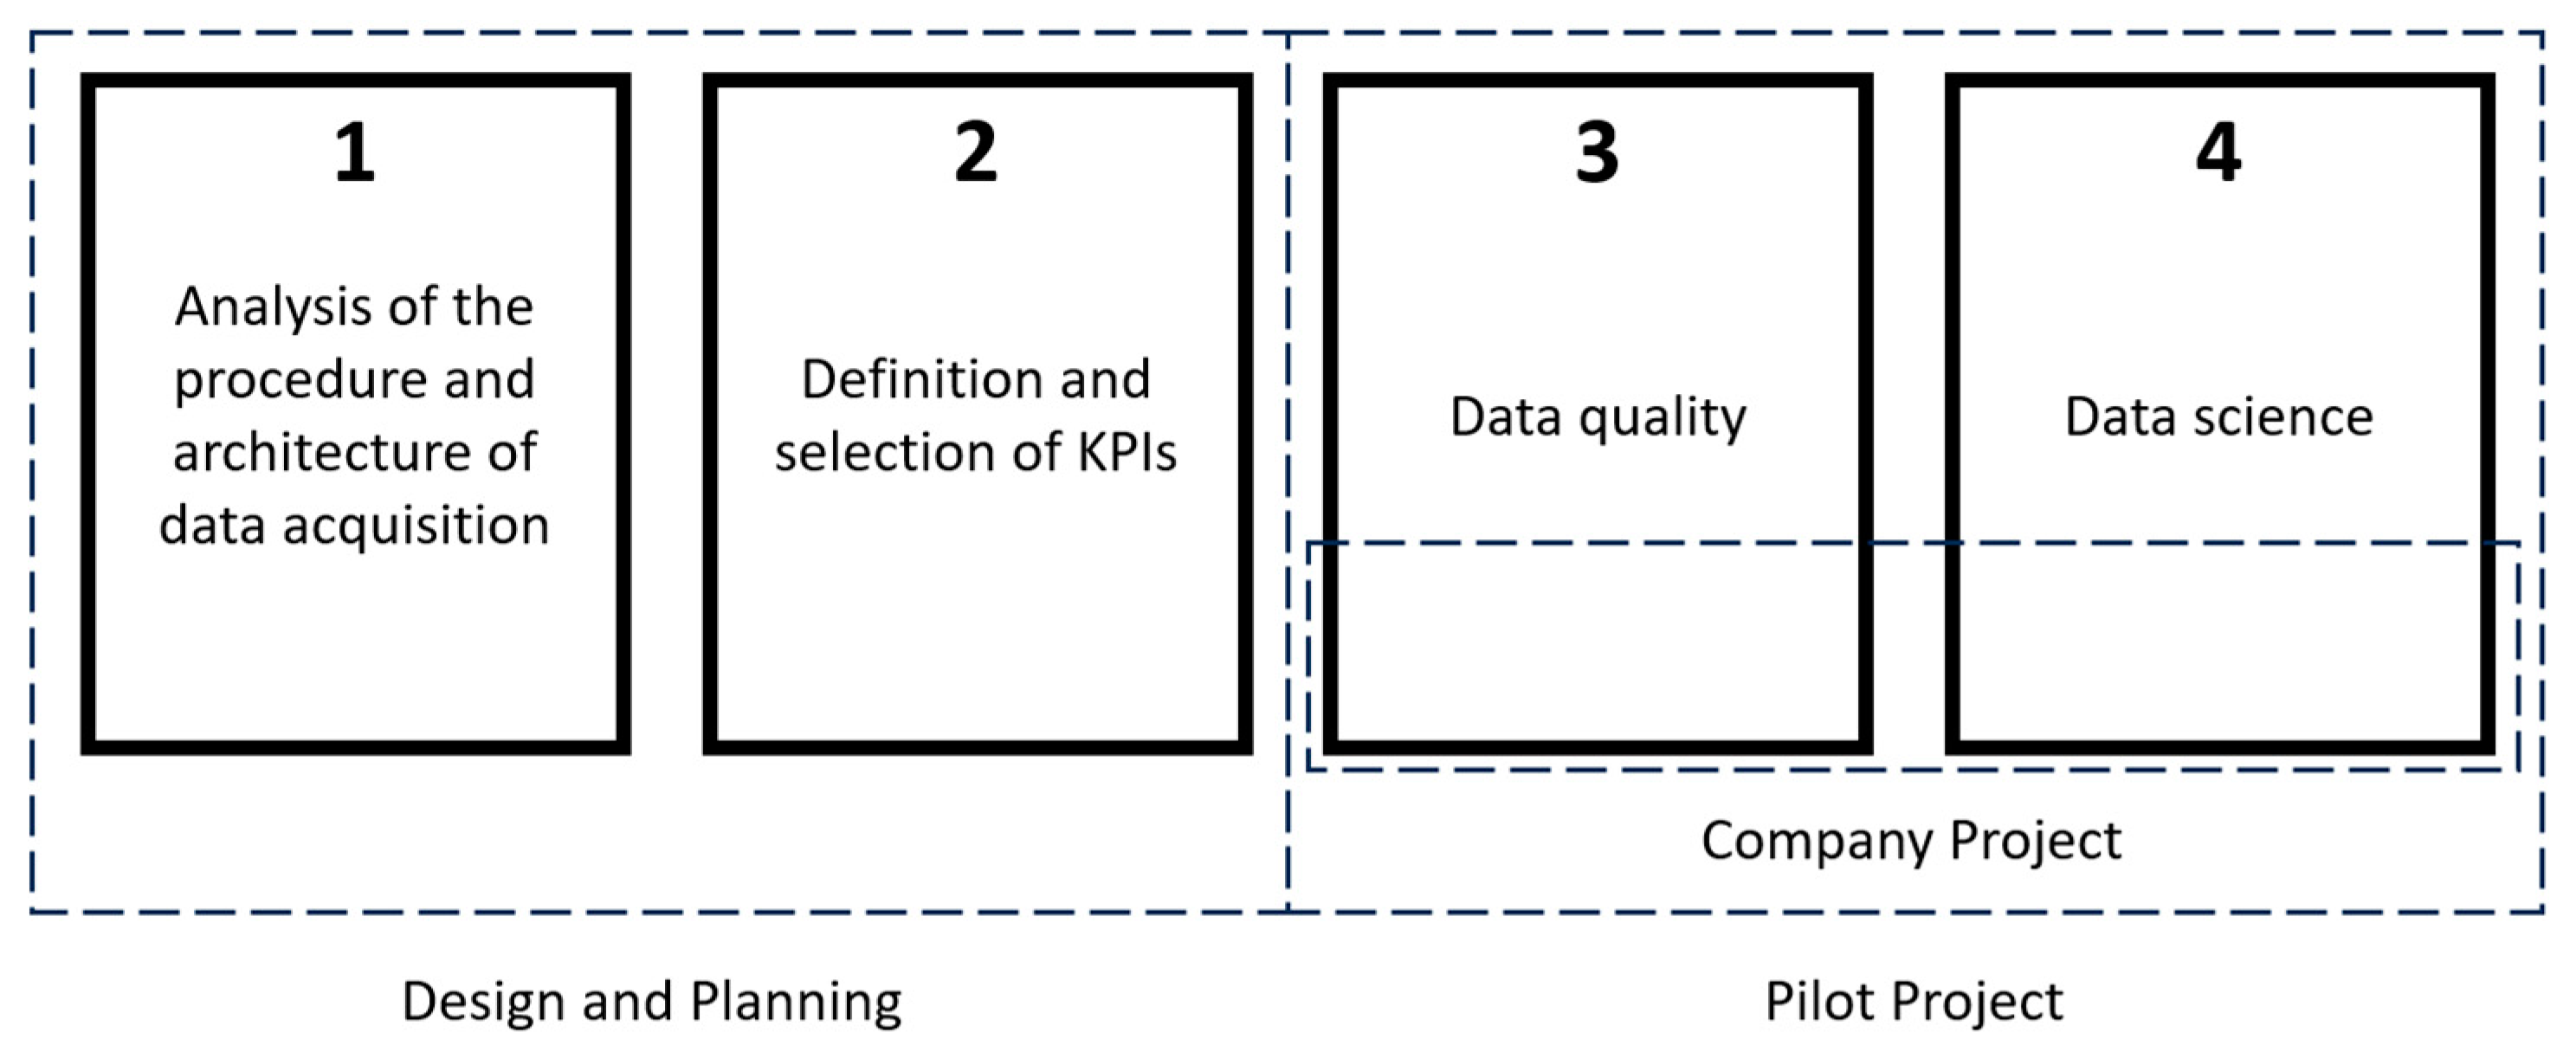
3.1. Methodology Stages

To deploy an automated production monitoring system that uses visual KPIs in an SME, four primary stages must be completed. These stages are illustrated in Figure 2.
The first two phases establish the Design and Planning stage. This stage involves a comprehensive analysis of production conditions, the tools currently in use, and the necessary information collection. During the initial phase of outlining the architecture of the data acquisition process, it is worth noting that the integration of Industry 4.0 technologies may significantly enhance the ability to collect and store data. This advancement could further facilitate the identification and definition of potential KPIs aligned with the company’s strategic objectives, setting a strong foundation for data-driven decision-making. During the second stage, KPIs that are necessary for monitoring and managing processes are selected. The subsequent step involves implementing the data collection structure and KPIs that have been previously determined.
To begin the first phase, it is crucial to conduct a Pilot Project on a limited section of the production, such as a specific machine or production line. The next step involves implementing what was previously determined in the data collection structure and KPIs. Finally, it is necessary to evaluate the quality of the data to ensure that what the MES acquires and calculates aligns with actual production. After the system implementation is completed, it may be beneficial to consider utilising data science methodologies. This could help manage the big data collected and effectively process, visualise, and interpret the results, thereby unlocking the full potential of the data. Only after concluding the Pilot Project and ensuring that the results meet expectations, a complete Plant Project can be initiated.
The following includes a detailed description of each step.

3.1.1. Analysis of the Procedure and Architecture of Data Acquisition

Characterising the enterprise and the data acquisition system is a crucial stage. It is fundamental to complete the following:
(1)
Study the process. To ensure an accurate association of operational conditions with the stored data, it is essential to comprehend the operational process of the enterprise or department being considered by recognising a set of KPIs. This procedure is particularly crucial for small enterprises. Therefore, it becomes necessary to map the working procedure under study.
(2)
Study the data acquisition mechanism. This study focuses on the architecture of the data acquisition. It is essential to establish the method of recording data in the following terms:
(a)
Structure of data acquisition hardware.
(b)
Structure of the database.
(c)
Acquisition timeframes.
Establishing a robust data framework is crucial for selecting and supplying KPIs in the subsequent stage. This structure forms the foundation for all subsequent data processing and may vary depending on the application case and machine type. In fact, the level of digitisation of the machine determines whether the connection is simple or complex. If the machine has a low level of digitisation or is not digitised at all, the cost of connecting it will increase.

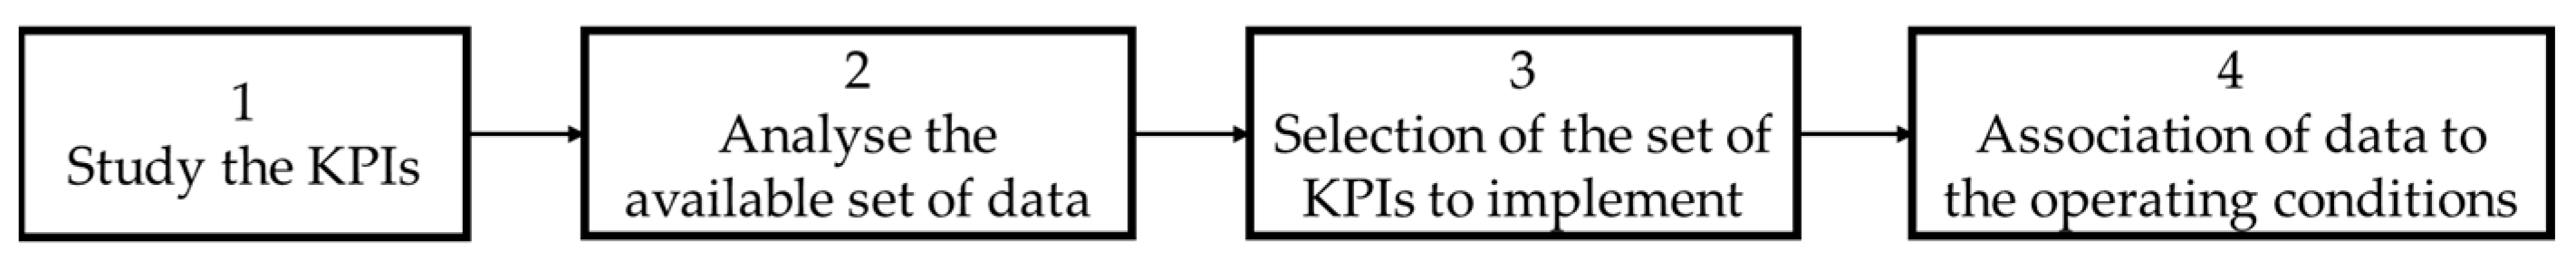
3.1.2. Definition and Selection of KPIs

The second stage of the methodology involves defining the KPIs required by each enterprise depending on its sector. Therefore, their definition starts with identifying the company’s needs. Measuring performance is a vital aspect of enterprise operations, requiring careful consideration and precise evaluation. In a business organisation, performance evaluation is essential for the following:
  • Having an objective measure to take short-, medium-, and long-term decisions.
  • Exactly identifying critical issues in the production.
  • Establishing coherent targets according to the enterprise.
  • Encouraging employees’ work.
The initial stage is to establish a set of KPIs to monitor the company’s production.
The process for developing these KPIs, illustrated in Figure 3, includes the following:
(1)
Study the KPIs. Search the literature for suitable KPIs within the relevant sector. It may be helpful to examine similar systems used in other industrial projects for possible examples of KPI monitoring.
(2)
Analyse the available set of data. Once the KPIs have been defined, it is essential to verify whether the data are available to support the factors that make up these KPIs. Additionally, the KPIs should be generated automatically upon project completion. If the data acquisition does not support a KPI factor, it should be removed. Alternatively, it may be possible to obtain the necessary data for KPI calculation by consulting with the data acquisition system supplier.
(3)
Selection of the set of KPIs to implement. After completing Steps 1 and 2, the appropriate set of KPIs can be selected. It is essential to involve enterprise management and production managers at this stage to ensure they understand the rationale behind the selection and comprehend how to interpret the data in the future.
(4)
Association of data to the operating conditions. It is essential to understand the correlation between data storage and operational parameters to characterise the enterprise process. This understanding is crucial for subsequent steps of the methodology.
A standardised approach is required to identify KPIs for all the preceding steps. Below is a catalogue of commonly implemented KPIs used to monitor processes and production:
  • Overall Equipment Effectiveness (OEE) = Availability × Performance × Quality;
  • Machine hours-to-man hours ratio = Machine hours/Man hours;
  • Order Fulfilment Cycle Time (OFCT) = Source Cycle time + Market cycle time + Delivery cycle time;
  • Compliance Index = [1 − (S/R)] × 100; where S represents non-compliant quantities, and R represents the quantity shipped in the period;
  • Punctuality of delivery = Lines of orders fulfilled in time/Total lines requested in the period;
  • Over Time Rate = Hours of overtime/Total hours.
This list can be used as a general starting point for identifying the KPIs that best reflect the specific production process. It has been retrieved based on ISO 9001 for quality and ISO 22400 for manufacturing operations management [33,34]. As stated at the beginning of this section, indicators should be selected based on specific monitoring requirements and data availability.

3.1.3. Data Quality

To make informed decisions, it is important to have a set of reliable KPIs. The gathered data must accurately depict the true state of the company or correspond to the current operating conditions.
The following steps outline how to verify the quality of the data:
(1)
Implement a method for testing the data. This task requires emphasising the data values that require verification according to the operating system specifications. Additionally, it is imperative to ensure that the stored data can be accessed and interpreted easily.
(2)
Plan the test according to the enterprise’s production. It is essential to collaborate with the production manager to schedule testing activities. This will reduce the impact on production and ultimately lower expenses.
(3)
Data check and result evaluation. The purpose of this test is to verify whether the stored data match exactly with the operating conditions established in point one. If the data correspond to the actual conditions, the data acquisition system is considered reliable. However, if there is a mismatch, measures must be taken to mitigate the problem and ensure the reliability of the data acquisition system.

3.1.4. Data Science

The last step in this methodology involves transitioning from big data to smart data. In this stage, data stored in a database are extracted and analysed to generate visual representations of KPIs through a Business Intelligence Software (BI):
  • Choose the structure of data to visualise. The objective of an effective KPI visualisation system is to facilitate the prompt and precise identification of critical issues. A well-organised KPI visualisation system allows for the monitoring of individual machining centres for work orders, while also aiming to summarise the work of a department or multiple machining centres.
  • Elaborate on the data. After defining the data structure, it is possible to create KPIs as outlined in point one. An initial elaboration and data visualisation can be performed using a spreadsheet.
  • Implement data visualisation in a BI software. The final step in the method involves implementing the spreadsheet from point two into a BI software. This is essential for the automatic and continuous management of a large amount of data.

3.1.5. Pilot and Enterprise Project

To reduce initial investment costs when the benefit and functionality of the system are not yet established, the project can be divided into two phases: a pilot project and an enterprise project.
The pilot project aims to accomplish the following:
  • Test the system under real-life circumstances.
  • Verify the data flow accuracy.
  • Verify the accurate interpretation of indicators.
During this phase, the company reduces its economic investment and gains the ability to monitor a portion of its production directly through the use of KPIs. The company can analyse whether the operators are able to read and interpret the data in order to enhance production performance. Furthermore, the management can utilise the same data to make strategic decisions.
If the pilot project is successful, the work can then be expanded to the rest of the production plant to achieve complete control over the entire production process. This would pave the way for an enterprise project.

4. Application

4.1. Industrial Case Study: A Machining Industry

The methodology was applied in a small-scale Italian enterprise situated in Emilia Romagna, also known as ‘Packaging Valley’. This region is home to world-leading companies that design and produce automatic packaging machines for various industries, including food and pharmaceuticals. The decision to implement the methodology in a small company was made because SMEs constitute the majority of Italy’s industrial infrastructure. In recent years, the Italian government has invested in promoting digital transition. Although SMEs have benefited from these incentives, the digital transition has not yet been fully completed.
The enterprise involved in the project specialises in creating high-precision mechanical parts that are later assembled into automated machines. As a subcontractor, the enterprise produces custom components for clients and offers the option to run small orders and prototype parts using Computerised Numerical Control (CNC) machines. The company has gained considerable expertise during its 45 years in the sector, resulting in the employment of around fifty staff and an annual turnover of approximately 6 million euros.
To ensure the longevity of the company, it was necessary to establish an information system that could pass down knowledge to future generations. This system was designed to prepare for the shift from a traditional craftsmanship culture to a digitalised and collaborative one. To achieve this, industrial plans were incorporated to introduce novel techniques and cutting-edge technologies. In order to ensure a more successful future for the company, it began considering the option of strengthening its relationship with its clients by openly disclosing information about its production processes. Consequently, an information system was implemented to monitor and manage the production process using numerical data.
The enterprise’s primary goals can be summarised as follows:
  • Smooth knowledge transfer.
  • Complete control of the production cycle.
  • Efficiency control.
  • Process streamlining.
  • Access to information from any workstation.
To achieve these goals, the enterprise has implemented an MES to link machine signals in the field with the ERP. As stated in Section 2.1, this system is primarily intended for managing large volumes of data related to highly repetitive serial production. Its outputs comprise statistical indicators for individual machine performance, productivity, and defects. However, the main production aspects of the enterprise are completely different and can be summarised as follows:
  • Small batch or prototype production.
  • Production often includes orders that have never been placed before.
  • Production of complex parts that requires highly skilled employees.
  • Industry divided in departments.
To adapt the information system to the specific production characteristics, the project resulted in software that is able to offer greater flexibility for customisation. It was vital to identify a software provider with the appropriate skills to adapt the system to the versatile production process. A technical specification for the software was prepared and shared with several potential providers. The specification covered key points such as the following:
  • Integration and connectivity with existing software.
  • Production planning and management.
  • Real-time machine monitoring and control.
  • Workflow automation and efficiency.
  • Document and data management.
The endeavour took nearly two years, and only after that, the methodology presented in Section 3 could be implemented with the help of external professionals and specific IT consulting services.

4.2. MES Implementation in a SME

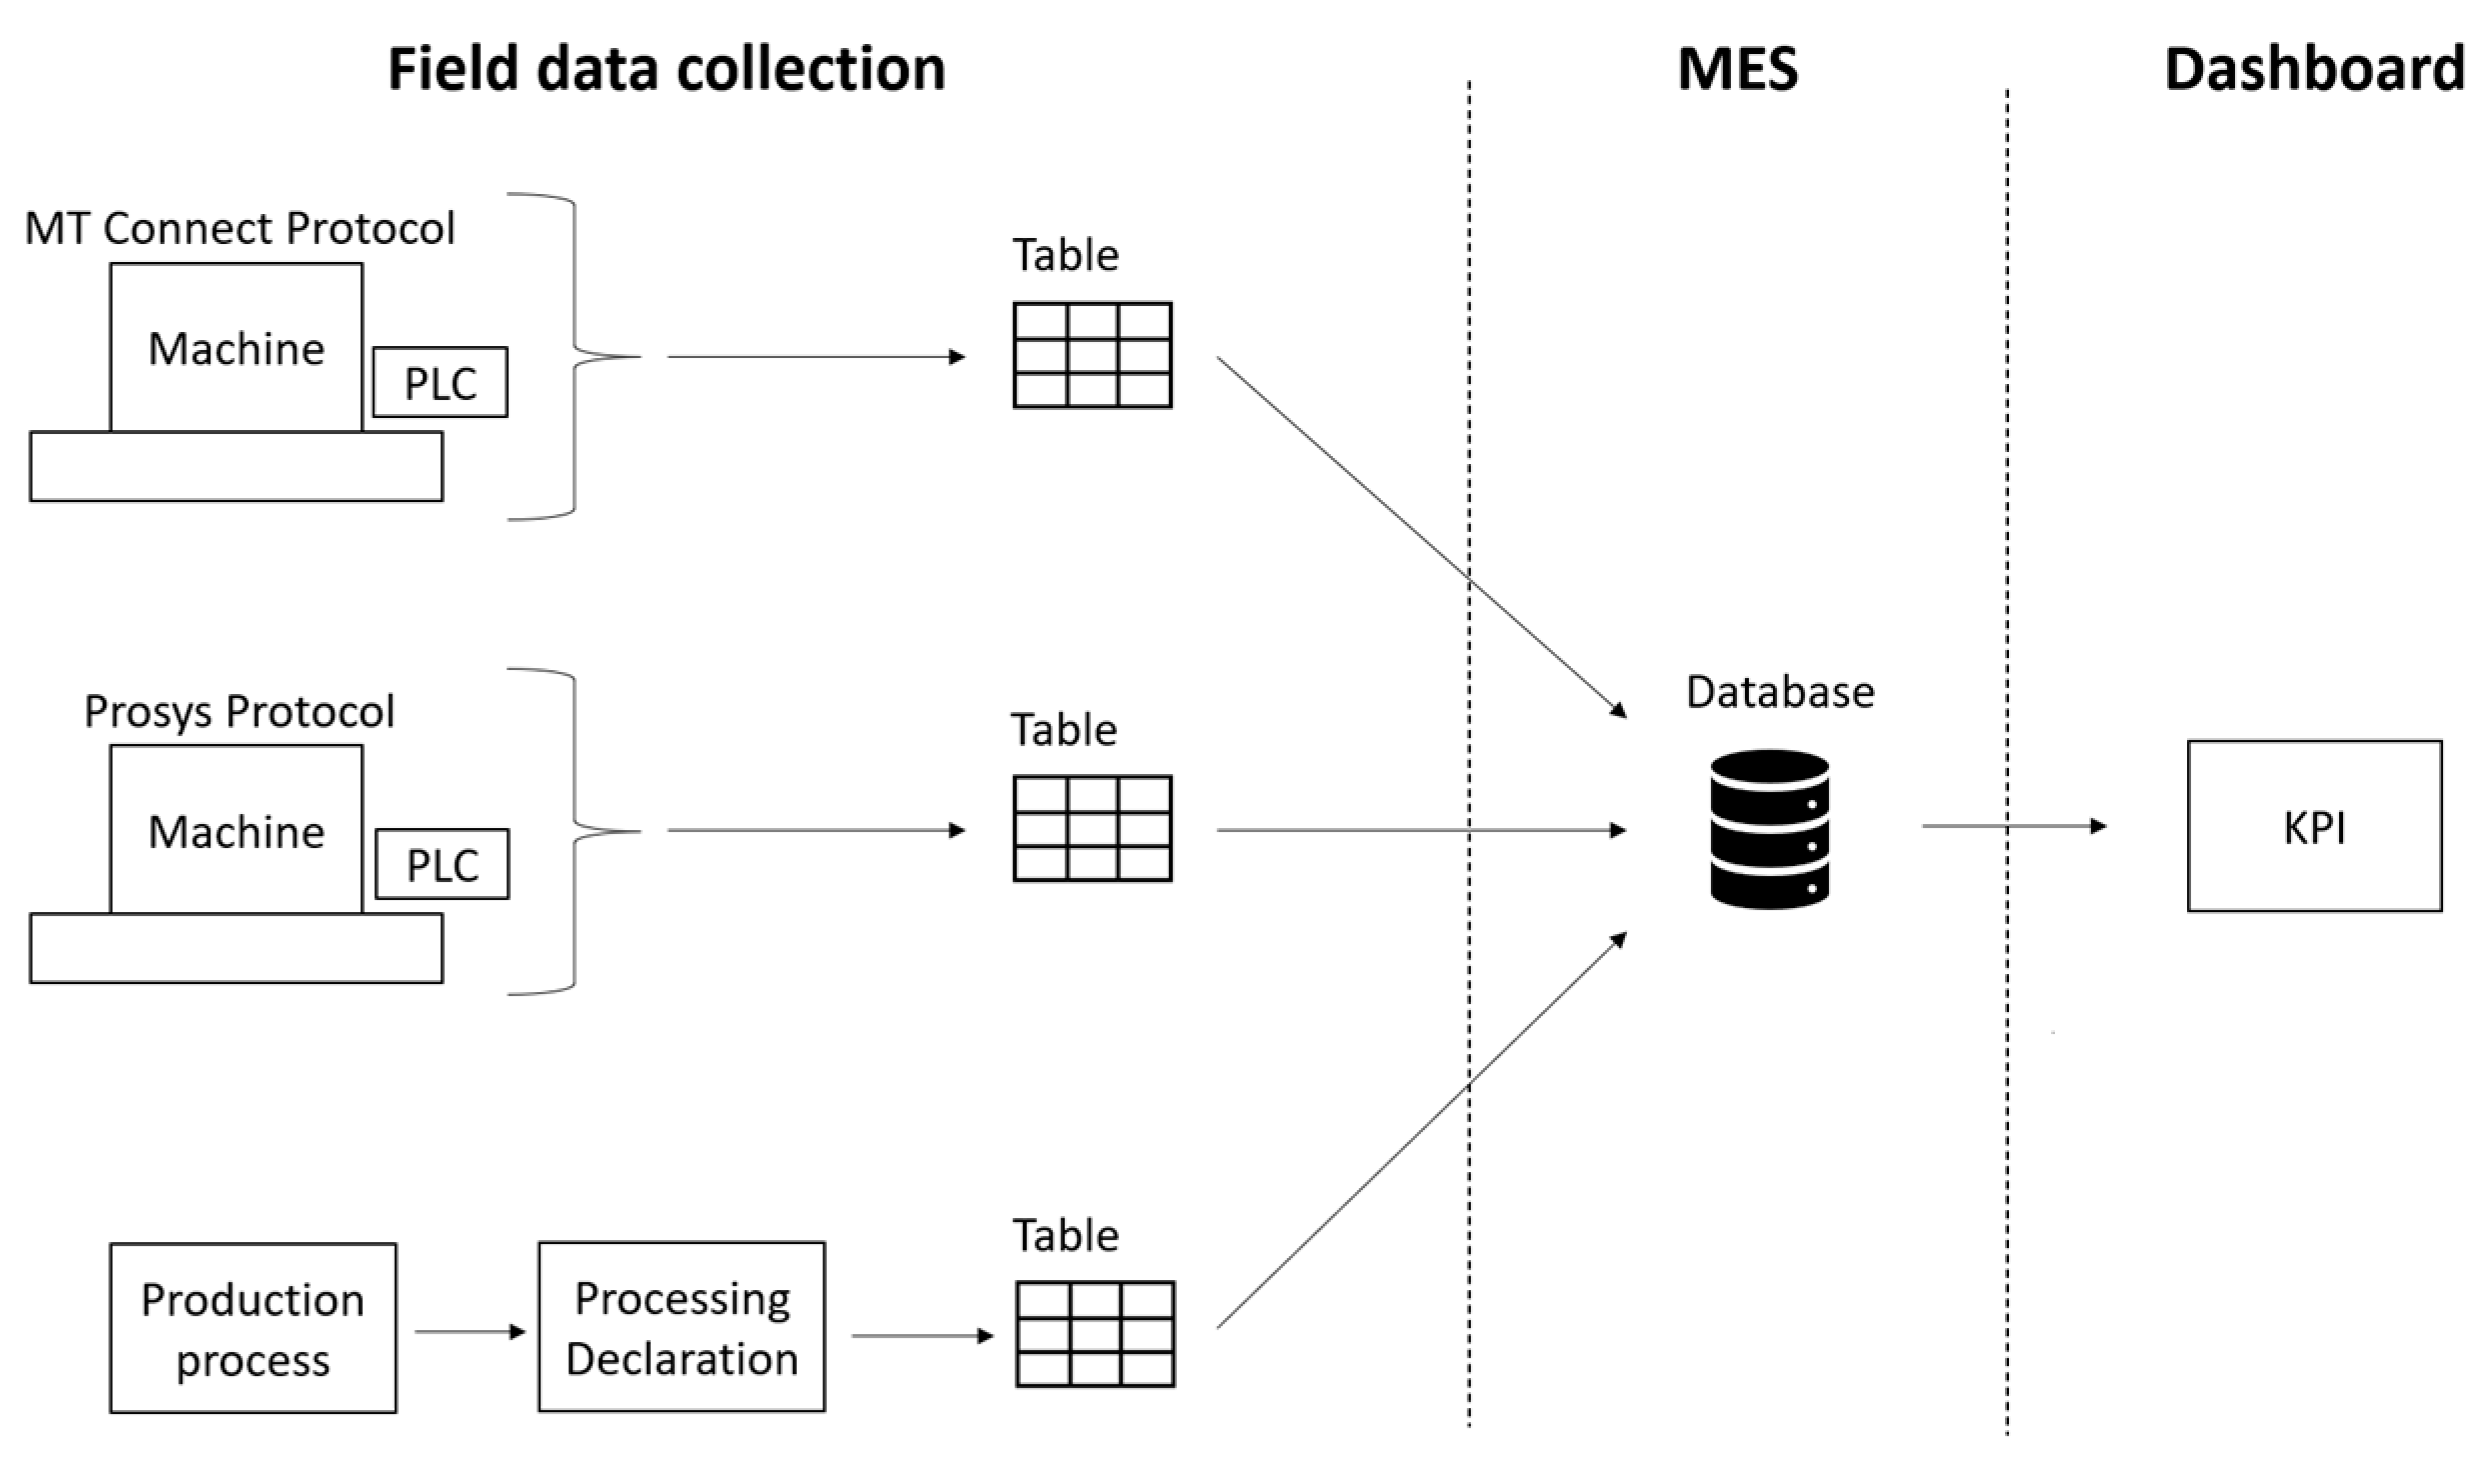
4.2.1. Application of Architecture of Data Acquisition System

The first steps in implementing the methodology outlined in Section 3 involve assessing the production process and developing a suitable data acquisition mechanism for the enterprise. Figure 4 presents a scheme of the level of automation of the enterprise:
An analysis was conducted on all machines in the enterprise, which were constructed at different years. The enterprise comprises four departments and a total of 18 CNC machines. These machines have varying ages, with some being modern and others considerably older without the necessary features to be compatible with MES for data exchange. Management refused to connect only new-generation machines to the MES system. It was important to measure and monitor all activities and machine centres using consistent KPIs, especially within a single department. Only three of the eighteen older machines were excluded, each requiring a unique data acquisition architecture. The Table 2 illustrates the distinct characteristics identified for each. Therefore, measures were implemented to establish connectivity between each machine and MES by installing suitable hardware if the machine was incapable of sharing data.
The recorded data are saved into different tables according to the communication protocol and then integrated into the MES database. This allows for the extraction of useful data to calculate the chosen KPIs. Figure 5 shows an illustration of this framework.
During the production process, the MES requires statements from the operator in addition to machine field signals. The purpose of these statements is to accurately record the times for each stage of the work order. Figure 6 highlights the operator’s statements in red and emphasises their importance in allowing the production data to correlate with the tables automatically generated by the database.
The necessary declarations concern the start and end of the Presetting stage, which involves preparing the tool and programme, and the beginning and end of the Processing stage, which includes the actual creation of the workpiece. The system identifies discrepancies in machine usage by comparing them with operator reports.
At this point, it is essential to establish a robust data framework for use in the subsequent stage of KPI input. In this SME, the data structure is designed to account for the operating conditions of each machine over time. Established conventions have been used to evaluate the efficiency and utilisation of the machines. It is necessary to include the following time frames:
  • Tooling times: the time required for the technician to load and prepare the component on the device.
  • Active spindle times: time when the machine runs the programme continuously.
  • M0 stop times: scheduled stop times in the Part Programme that are necessary for both spindle cleaning and dimensional checks of the workpiece.
  • M1 manual stop times: interruptions that are not scheduled in the Part Programme but are required for manual control of the machine by the operator, like machine cleaning and checking dimensions.
  • Hold times: time when the component is fixed onto the machine and is awaiting processing.
  • Downtimes: time resulting from malfunctions or anomalies.
In order to ensure accurate KPI reporting, a specific colour was assigned to each operating condition. This is illustrated in Table 3 and Table 4:
Note that the grey colour is not monitored but appears when the machine is not connected or when the work order has not been declared. This should account for a small proportion of machining and tooling.

4.2.2. Application of Definition and Selection of KPIs

During the definition and selection of KPIs within the enterprise, it was decided to only consider KPIs that could be automated from the data provided by the MES. Therefore, only the first two KPIs listed in Section 3.1.2 were chosen:
  • Machine hours to man hours ratio (I0) = Machine hours/man hours
    Machine hours: working time of the machine.
    Man hours: working time of the operator.
  • Overall Equipment Effectiveness (I1) = Availability × Performance × Quality
    Availability: percentage of actual uptime versus available uptime.
    Performance: percentage of parts produced compared to theoretical capacity when the plant is active (corresponds to actual speed compared to rated speed).
    Quality: percentage of compliant parts to total parts produced.
In this enterprise’s context, additional observations about the OEE could be performed. The Quality factor was set to 100% because this enterprise produces multiple batches consisting of few or one-of-a-kind parts. Similarly, since specific productions are often unprecedented, the cycle time is uncertain, and thus, the Performance factor was also set to 100%. The OEE of this enterprise was reduced to only reflect Availability, as configured in the database:
A v a i l a b i l i t y = N °   g r e e n   h o u r s + N °   r e d   h o u r s N °   d a i l y   m a c h i n e   w o r k i n g   h o u r s
To enhance the business process, it is crucial to identify the sources of issues, such as inefficiencies, slowdowns, or anomalies. To achieve this objective, it was necessary to define additional KPIs. Two new indicators were designed and implemented to meet the specific needs of the project and feed into the data already available in the MES database: machine cycle efficiency (I2) and fleet saturation (I3). It was crucial to organise these KPIs in a clear and effective manner to enable targeted enhancements.
Table 5 presents a summary of the KPIs used in the enterprise based on time tracked using coloured hours:
Table 6 displays the legends for each factor that determines the KPIs:
Each of these KPIs, or a set of them, has been developed to support a specific corporate hierarchy in its tasks within the company:
  • I0, I1, I2, and I3 are all indicators monitored by the enterprise management.
  • I0 is monitored by the department manager, as it represents the ability to control multiple machines with the same resources.
  • I1 is monitored by the work centre manager, as it reflects the ability to efficiently run the work centre, which in turn affects the machine’s availability.
  • I2 is monitored by the technical office, as it reflects the programmer’s ability to minimise the need for programme calibration during execution.
  • I3 is monitored by the sales and planning department, as it indicates the saturation level of the machines.

4.2.3. Application of Data Quality

The data quality and subsequent data science have been examined in a pilot project that connected one department’s machines for data collection and processing.
The primary purpose of this phase was to confirm the accuracy of information sourced from the MES. A series of tests have been conducted directly on the field, which took about a month to complete. If the data are unreliable, the indicators lack representativeness and become essentially worthless.
This stage has been conducted through three main steps following the methodology outlined in Section 3.1.3:
(1)
Implement a method for testing the data. To compare the division of coloured hours obtained from the MES with the actual output, it was necessary to compare each machine’s MES processing output with a simulated work cycle. This provided information on the machine’s times and statuses. The supplier was asked to provide a data extraction that would allow for the observation of processing status variations, durations, and colours.
(2)
Plan the test according to the enterprise’s production. Test activities were planned with the production manager to minimise their impact on production and costs. Table 7 displays the control sheet template for testing the fictitious cycle executed on each machine to verify the correspondence between cycle characteristics and data processed by the MES.
(3)
Data check and result evaluation. After collecting data on the operating conditions, including times and corresponding colours, the recorded results were compared with those stored by the system to assess its reliability. Discrepancies between the data points were observed on certain occasions. The primary errors identified were related to the assignment of colours to the operating conditions of the machines, which were not correct. This was caused by the fact that a single operator was able to operate multiple machines simultaneously. Subsequently, the entire data acquisition chain was retraced to identify and rectify the error. The activity concluded when all machine data from the whole department accurately depicted the work cycles carried out.

4.2.4. Application of Data Science

The final stage of the methodology entailed deploying data science, which refers to an automated visualisation system for data and indicators. Below are the steps followed to complete the activity:
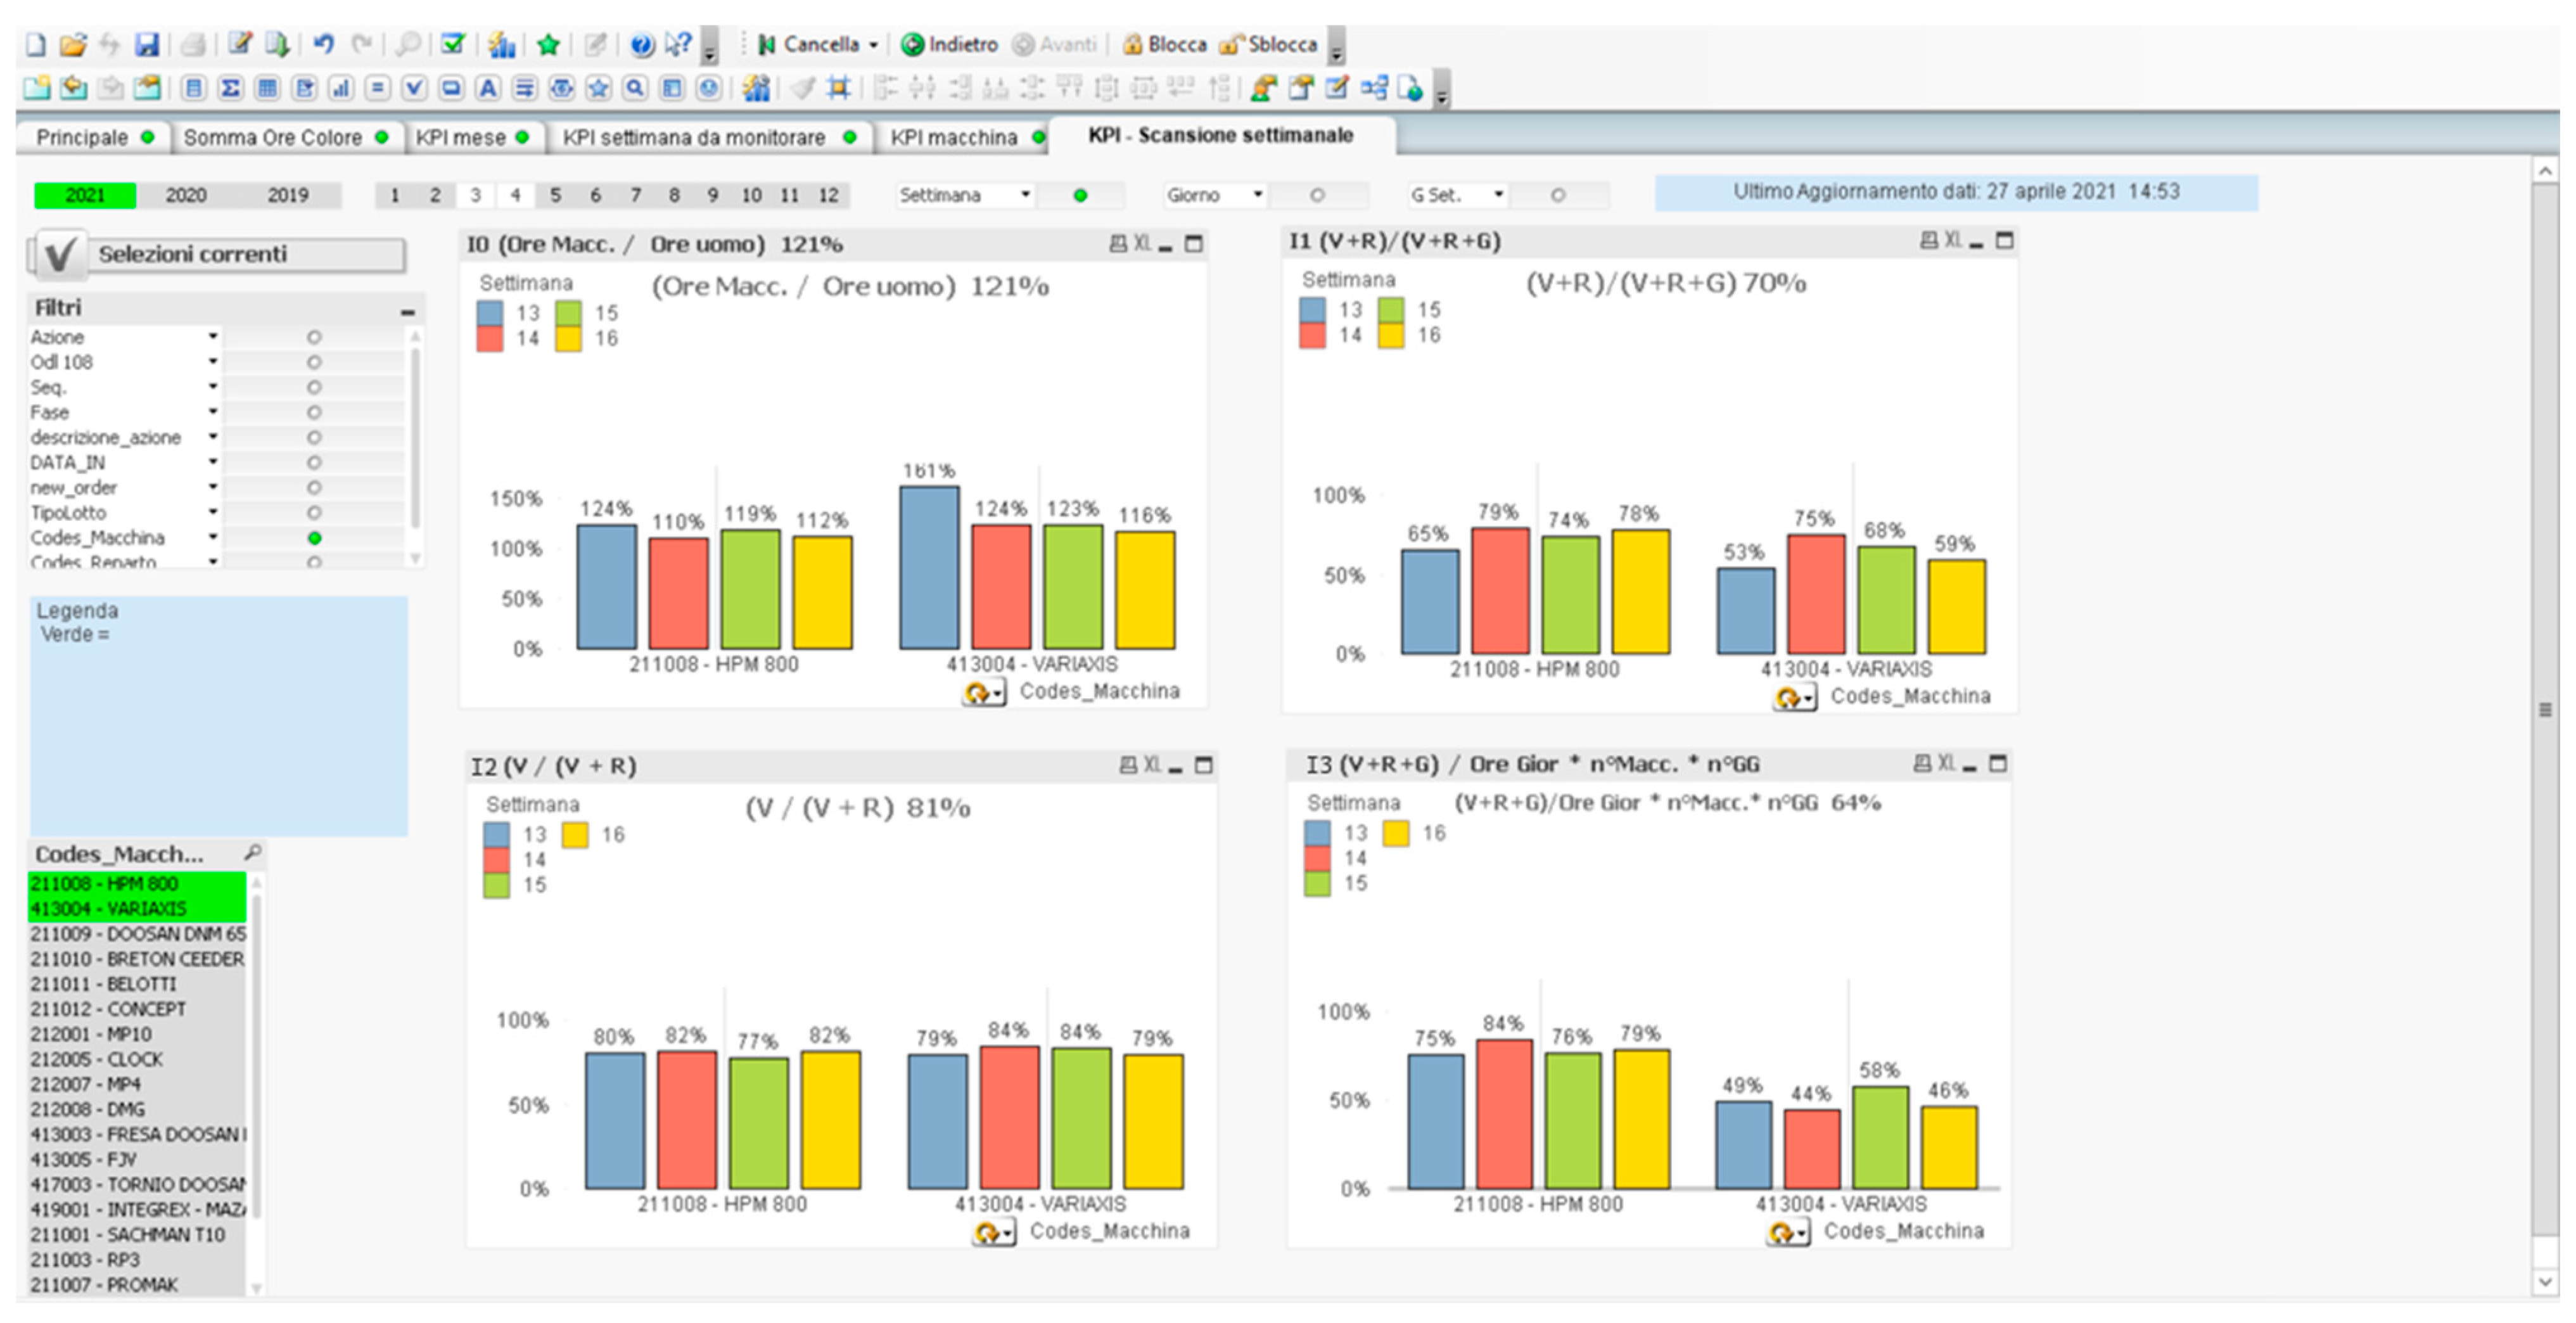
  • Choose the structure of the data to visualise. In the present case, three different structures of data visualisation have been elected: (i) Management; (ii) Department; (iii) Machine.
  • Elaborate on the data. Initially, the exported data from the MES were processed in a spreadsheet. The objective was to create a KPI dashboard with the previously elaborated structure. In the pilot project, this stage verifies whether the selected structure aligns with the set objectives and is convenient to implement.
  • Implement data visualisation in a BI software. After processing the data in the spreadsheet and confirming that the visualisation aligns with the objectives and is user-friendly, the same structure was applied in a BI software. This was necessary, as a large volume of data requires automated management.
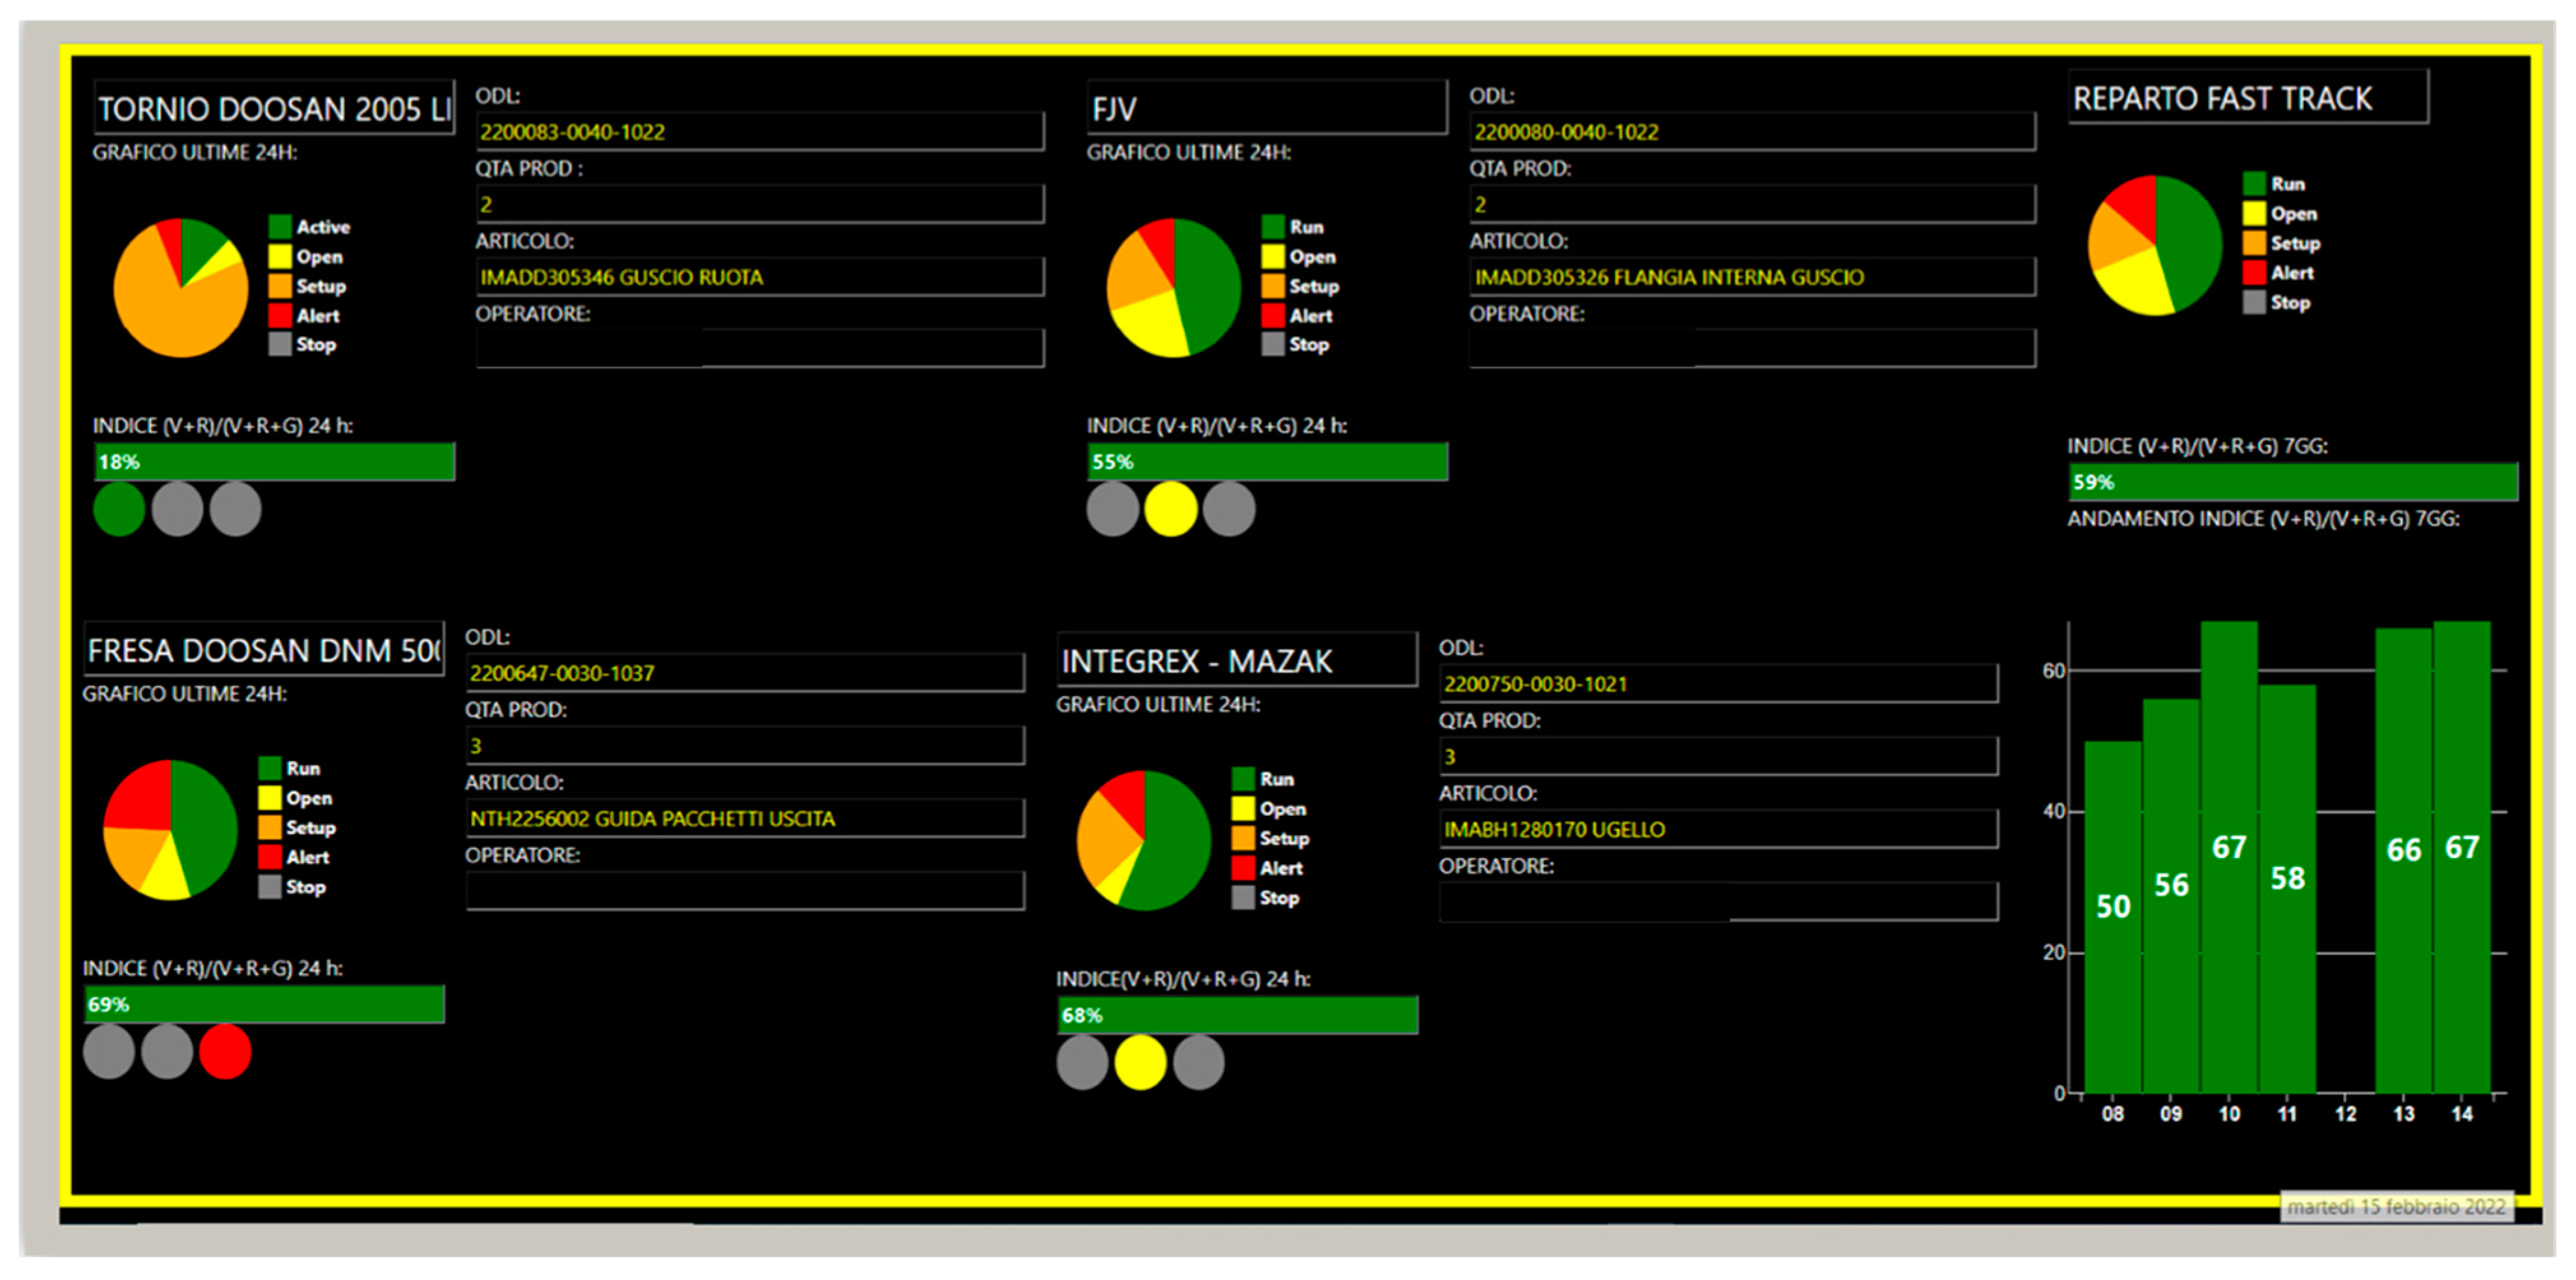
Several visualisations were created based on the data structure to be visualised. The first visualisation is the enterprise dashboard, which is only visible to management and contains indicators for all connected machinery and departments. Figure 7 and Figure 8 display the management control panel.
Figure 7 shows the indicators for two different departments during a specific week. The left and top sections contain filters that allow for customisation of the display based on each request. Figure 8 demonstrates the variation of all indicators in two machines during the selected weeks:
Figure 9 displays the departmental dashboard on a TV screen in every department of the enterprise. The dashboard shows performance metrics for individual machinery, including coloured hours, availability, and status. Specifically, for each machine, the dashboard displays eight key pieces of information:
  • Machine name.
  • Pie chart showing the colour breakdown of the last 24 h.
  • Machine availability indicator (I1, OEE).
  • Traffic light graphic indicating the status of the machine (green: running programme, red: M0 stop times and manual stop times, yellow: presetting, piece awaiting processing, and machine downtime).
  • Code number of work order in process.
  • Quantity produced for the work order.
  • Code number and description of the article being processed.
  • Operator name.
In addition, the dashboard displays a summary of the department’s overall performance on the right-hand side, presenting two key pieces of information:
  • A pie chart showing the coloured hours breakdown of the last 24 h of all machines.
  • Overall availability indicator of the department:
    The bar chart shows the average availability of all machines in the department over the last seven days.
    The histogram shows the indicator’s value over the past seven days.
The machine dashboard is displayed on each machine, providing real-time monitoring of its performance. It shows the same information as the department dashboard but only for the specific machine. This allows the operator to receive direct feedback on the operation efficiency. In addition to the machine dashboard, the operator also has access to the MES interface. This facilitates machining operations by displaying technical documents, set-up diagrams, and quality checks. Similar dashboards to those shown in Figure 5 and Figure 6 were created for the other KPIs, I0, I2, and I3, monitored by the departmental manager, technical department, and sales and planning department.

5. Results and Discussion

The presented project successfully adapted the MES information system, originally designed for serial and highly repetitive production, to a small-scale industrial environment characterised by small production volumes, variable production, and individual prototyping. Implementing software systems in SMEs presents significant difficulties, as various sources in the literature suggest. However, by following the methodology explained above, most of the barriers listed by Dutta G. et al. [25] have been successfully overcome. The most challenging aspect, in terms of the scientific accomplishments of the project, was identifying and selecting suitable indicators. There are few instances in the literature detailing a list of indicators beneficial for overseeing the production of a manufacturing SME. Thus, a comprehensive inquiry was carried out to establish a set of quantifiable metrics that effectively demonstrate the manufacturing process in order to identify operational inefficiencies, defects, and abnormalities.
The main challenges faced by SMEs when implementing digitalisation solutions, such as MES, are related to budget constraints, lack of technical expertise, and employee training requirements. To address the issue of technical expertise, this case study employed external consultancy. The acquired skills were then disseminated through training sessions to department heads, who subsequently trained employees through on-the-job training activities. With regard to budget constraints, it is worth noting that in addition to the cost of the MES software, modernising CNC machines requires a significant initial investment for installation, as highlighted by Coronado et al. [20]. However, the investment quickly paid for itself due to increased enterprise profitability. Within the first year of full system operation, enterprise profitability increased by 7% compared to the average of the previous three years. Furthermore, all objectives outlined in Section 4.1 were achieved successfully. Regarding process control, the goal was achieved by the ability to numerically monitor the process. It was recognised that the machines had low availability, indicating an inefficient production process with extended periods of machine idleness. The efficiency of the production process increased significantly by utilising organisational tools, such as meetings and discussions between management and department managers, to analyse indicators and optimise enterprise resource usage. The company has achieved its goal of providing access to information within an MES from every workstation by installing computers. These computers provide operators with all the necessary information to process machine parts, including technical documents such as 3D and 2D drawings, set-up diagrams, and quality checks. Furthermore, each workstation has the ability to view the complete schedule of orders for the specific machine, including their relative priorities and the corresponding part programmes required for uploading with the correct work cycle. If necessary, the operator can make changes by uploading the modified part programme to the MES or by highlighting any non-conformities through photos uploaded from smartphone devices. This architecture has also successfully achieved the goal of facilitating the smooth transfer of skills between generations. This approach allows for the induction of new resources with a short period of shadowing a senior resource, making the company an attractive place to work for younger generations who aspire to excel in technologically advanced environments.
The installation of screens in each department displaying KPIs calculated through the MES and their trends, as illustrated in the department dashboard in Section 4.2.4, has achieved an important and unexpected objective. This has generated healthy competition between operators, prioritising the improvement of indicators and increasing the overall efficiency of processes. The company’s commitment has improved, despite the lack of incentives from management, by simply looking at the performance indicators. A possible future development could be the introduction of incentive mechanisms based on performance monitoring. These mechanisms would be based on the ability of departments to meet established target goals, supported by meaningful and representative statistical data. According to Zheng T. et al. [17], this unexpected result has proven that companies transitioning to Industry 4.0 gain more advantages than initially expected. Furthermore, the transfer of skills between generations and the increased engagement of the operators marks the initiation of the Industry 5.0 transition, as defined in the EU document [14]. Table 8 presents the Industry 4.0 technologies used and their respective areas of application at the end of the project:
The enterprise achieved another important milestone by implementing a better cost stratification, which was one of the primary objectives of the project. The data collection structure enables a comprehensive breakdown of costs associated with the execution of a single work order, resulting in more precise cost estimates during negotiations with clients to produce new components. Ultimately, this reduces the need for cost revisions with clients and provides substantial evidence in cases of budget overruns. This promotes trust and transparency with customers, validating the partnership. However, as noted by Siedler et al. [16], it is difficult to quantify this positive outcome economically.
In summary, the project lasted for four years, from the identification of the need for an information system to the implementation of indicators to manage the process. A large amount of time and resources were invested. During the first year, an initial version of the MES was implemented, but it was considered too inflexible and inadequate for the company’s needs and was subsequently abandoned. In the following year, a new software provider was selected whose product specifications aligned better with the project goals. The process of integrating each machine with the system began. By the third year, all machines without a control system capable of transmitting machine states were connected. The communication system for transmitting all data was also fully operational. In the fourth and final year, the focus was on interpreting data to identify KPIs for monitoring and governing the process.
The project has the potential to expand into the field of environmental sustainability and address requests from large companies that must comply with the European Corporate Sustainability Reporting Directive [35]. A potential future development of the presented system could lead to the estimation of the carbon emissions resulting from the production of each specific order. All emission-related data would be collected through an MES architecture.

6. Conclusions

This paper outlines the implementation of MESs in SMEs and the development of KPIs for monitoring enterprise processes. The project has significantly improved the company’s ability to understand and manage its internal operations. A methodology was developed, based on indicator research, to effectively use the large amount of data generated by Industry 4.0 technologies. This has enabled the creation of smart data indicators, which assist management in their pursuit of continuous process improvement.
The project faced several challenges, including selecting appropriate MES software, which was later customised for the company with numerous modifications. Another challenge was connecting the production machines to the information system, which involved updating outdated machines without status reporting capabilities by installing additional sensors. These two issues resulted in increased costs compared to the budget. Finally, the drafting of KPIs proved to be a complex task for managing and monitoring processes. As a result, the KPIs used were modified and could not be applied as per the literature. After a development period of four years, the system achieved full operational capability. This achievement resulted in increased profitability and efficiency within the enterprise. The economic efforts to implement the system have been repaid, and the procedures have been streamlined. Production costs are now broken down in a timely manner, and customer engagement with the system has improved, thereby enhancing business relations. Additionally, employee participation achieved further objectives.
The initiative had a positive impact on social sustainability by promoting corporate commitment through healthy competition among employees to improve performance based on monitored indicators. This aspect could be measured with specific indicators in the future. The company’s implementation of new technology has made it more attractive to young workers by creating a dynamic working environment that facilitates growth, training, and knowledge sharing through the MES system. This system collects and shares information on specific procedures and transactions within the company. Its flexibility allows for future growth and improvements by identifying new indicators and improving record-keeping. For instance, the integration of consumption meters offers valuable data to monitor the environmental impact of the production process through the MES system. This aspect will be explored in future research to investigate the benefits of Industry 4.0 on product sustainability. Other issues that deserve further improvement or research are the selection and adaptation of the software, the reduction of the system’s application time, as stated in a specific method by Mesa David et al. [36], and finally the adaptability and scalability of the system.
The methodology’s foundational approach allows it to be applied in various industrial settings, making it easier to adopt effective information systems, even within SMEs.

Author Contributions

A.B.: supervision, project administration, methodology; I.S.: conceptualisation, methodology, validation, formal analysis, investigation, data curation, writing—original draft preparation, writing—review and editing; A.A.: conceptualisation, methodology, validation, data curation, writing—original draft preparation, writing—review and editing; M.M.: visualisation, writing—review and editing; V.S.: visualisation, writing—review and editing. All authors have read and agreed to the published version of the manuscript.

Funding

This research did not receive any specific grant from funding agencies in the public, commercial, or not-for-profit sectors.

Data Availability Statement

Data is contained within the article.

Acknowledgments

The authors acknowledge the partners involved in the project described in this paper. The authors would also like to especially thank the company Andimec of DICO Group for the financial support of this project. Paolo Venturi, who was the CEO of Andimec at the time of the project, for initiating and leading the project. Nicolò Pascale Guidotti Magnani for his valuable support in defining the KPIs and implementing the new organisational model. Lastly, we would like to thank. Giorgio Zompi and Matteo Colamonaco for their invaluable work in supporting the implementation and optimisation of the system. The collaboration between individuals and companies involved has facilitated the realisation of this corporate digitalisation project towards a more digitalised and sustainable business.

Conflicts of Interest

The authors declare no conflicts of interest.

Abbreviations

MESManufacturing Execution System
KPIKey Performance Indicators
SMESmall–Medium Enterprise
ITInformation Technology
OEEOverall Equipment Effectiveness
HMIHuman Machine Interface
SCADASupervisory Control and Data Acquisition
IoTInternet of Things
TQMTotal Quality Management
ERPEnterprise Resource Planning
OFCTOrder Fulfilment Cycle Time
CNCComputerised Numerical Control
BIBusiness Intelligence

References

  1. Ahuett-Garza, H.; Kurfess, T.R. A brief discussion on the trends of habilitating technologies for Industry 4.0 and Smart manufacturing. Manuf. Lett. 2018, 15, 60–63. [Google Scholar] [CrossRef]
  2. Goel, R.; Gupta, P. Robotics and Industry 4.0. In A Roadmap to Industry 4.0: Smart Production, Sharp Business and Sustainable Development; Nayyar, A., Kumar, A., Eds.; Advances in Science, Technology & Innovation; Springer: Cham, Switzerland, 2020. [Google Scholar] [CrossRef]
  3. Aheleroff, S.; Mostashiri, N.; Xu, X.; Zhong, R.Y. Mass personalisation as a service in industry 4.0: A resilient response case study. Adv. Eng. Inform. 2021, 50, 101438. [Google Scholar] [CrossRef]
  4. Ward, J.S.; Barker, A. Undefined by data: A survey of big data definitions. arXiv 2013, arXiv:1309.5821. [Google Scholar]
  5. Sarker, S.; Arefin, M.S.; Kowsher, M.; Bhuiyan, T.; Dhar, P.K.; Kwon, O.J. A Comprehensive review on Big Data for Industries: Challenges and Opportunities. IEEE Access 2022, 11, 744–769. [Google Scholar] [CrossRef]
  6. Almada-Lobo, F. The Industry 4.0 revolution and the future of Manufacturing Execution Systems (MES). J. Innov. Manag. 2016, 3, 16–21. [Google Scholar] [CrossRef]
  7. Uhlemann, T.H.; Lehmann, C.W.; Steinhilper, R. The Digital Twin: Realizing the Cyber-Physical production system for industry 4.0. Procedia CIRP 2017, 61, 335–340. [Google Scholar] [CrossRef]
  8. Topalović, A.; Azzini, A. Data mining applications in SMEs: An Italian perspective. Bus. Syst. Res. Int. J. Soc. Adv. Innov. Res. Econ. 2020, 11, 127–146. [Google Scholar] [CrossRef]
  9. Oztemel, E.; Gürsev, S. Literature review of Industry 4.0 and related technologies. J. Intell. Manuf. 2018, 31, 127–182. [Google Scholar] [CrossRef]
  10. Masood, T.; Sonntag, P. Industry 4.0: Adoption challenges and benefits for SMEs. Comput. Ind. 2020, 121, 103261. [Google Scholar] [CrossRef]
  11. Canbay, K.; Akman, G. Investigating changes of total quality management principles in the context of Industry 4.0: Viewpoint from an emerging economy. Technol. Forecast. Soc. Chang. 2023, 189, 122358. [Google Scholar] [CrossRef]
  12. Stock, T.; Seliger, G. Opportunities of sustainable manufacturing in industry 4.0. Procedia CIRP 2016, 40, 536–541. [Google Scholar] [CrossRef]
  13. Sharma, R.; Jabbour, C.J.C.; De Sousa Jabbour, A.B.L. Sustainable manufacturing and industry 4.0: What we know and what we don’t. J. Enterp. Inf. Manag. 2020, 34, 230–266. [Google Scholar] [CrossRef]
  14. Research and Innovation. Industry 5.0—Towards a Sustainable, Human-Centric and Resilient European Industry. (n.d.). Available online: https://research-and-innovation.ec.europa.eu/knowledge-publications-tools-and-data/publications/all-publications/industry-50-towards-sustainable-human-centric-and-resilient-european-industry_en (accessed on 8 February 2024).
  15. Elhusseiny, H.M.; Crispim, J. SMEs, Barriers and Opportunities on adopting Industry 4.0: A Review. Procedia Comput. Sci. 2022, 196, 864–871. [Google Scholar] [CrossRef]
  16. Siedler, C.; Langlotz, P.; Aurich, J.C. Modeling and assessing the effects of digital technologies on KPIs in manufacturing systems. Procedia CIRP 2020, 93, 682–687. [Google Scholar] [CrossRef]
  17. Zheng, T.; Ardolino, M.; Bacchetti, A.; Perona, M.; Zanardini, M. The impacts of Industry 4.0: A descriptive survey in the Italian manufacturing sector. J. Manuf. Technol. Manag. 2019, 31, 1085–1115. [Google Scholar] [CrossRef]
  18. Shojaeinasab, A.; Charter, T.; Jalayer, M.; Khadivi, M.; Ogunfowora, O.; Raiyani, N.; Yaghoubi, M.; Najjaran, H. Intelligent manufacturing execution systems: A systematic review. J. Manuf. Syst. 2022, 62, 503–522. [Google Scholar] [CrossRef]
  19. Iarovyi, S.; Mohammed, W.M.; Lobov, A.; Ferrer, B.R.; Lastra, J.L.M. Cyber–physical systems for open-knowledge-driven manufacturing execution systems. Proc. IEEE 2016, 104, 1142–1154. [Google Scholar] [CrossRef]
  20. Coronado, P.D.U.; Lynn, R.; Louhichi, W.; Parto, M.; Wescoat, E.; Kurfess, T. Part data integration in the Shop Floor Digital Twin: Mobile and cloud technologies to enable a manufacturing execution system. J. Manuf. Syst. 2018, 48, 25–33. [Google Scholar] [CrossRef]
  21. Kuys, B.; Koch, C.; Renda, G. The priority given to sustainability by industrial designers within an industry 4.0 paradigm. Sustainability 2022, 14, 76. [Google Scholar] [CrossRef]
  22. MESA International. MES Explained: A High Level Vision; MESA International White Paper 6; MESA International: Chandler, AZ, USA, 1997. [Google Scholar]
  23. Menezes, S.; Creado, S.; Zhong, R.Y. Smart manufacturing execution systems for small and medium-sized enterprises. Procedia CIRP 2018, 72, 1009–1014. [Google Scholar] [CrossRef]
  24. Pfeifer, M.R. Development of a Smart Manufacturing Execution System architecture for SMEs: A Czech case study. Sustainability 2021, 13, 10181. [Google Scholar] [CrossRef]
  25. Dutta, G.; Kumar, R.; Sindhwani, R.; Singh, R. Overcoming the barriers of effective implementation of manufacturing execution system in pursuit of smart manufacturing in SMEs. Procedia Comput. Sci. 2022, 200, 820–832. [Google Scholar] [CrossRef]
  26. Welsch, B. Integrating production machines in a manufacturing execution system (MES). In Proceedings of the Third European Seminar on Precision Optics Manufacturing, Teisnach, Germany, 12–13 April 2016. [Google Scholar] [CrossRef]
  27. Parmenter, D. The new thinking on key performance indicators. Financ. Manag. Mag. 2006, 133, 10–12. [Google Scholar]
  28. Eckerson, W.W. Performance management strategies. Bus. Intell. J. 2009, 14, 24–27. [Google Scholar]
  29. Kaganski, S.; Eerme, M.; Tungel, E. Optimization of enterprise analysis model for KPI selection. Proc. Est. Acad. Sci. 2019, 68, 371–375. [Google Scholar] [CrossRef]
  30. Tokola, H.; Gröger, C.; Järvenpää, E.; Niemi, E. Designing manufacturing dashboards on the basis of a Key Performance Indicator survey. Procedia CIRP 2016, 57, 619–624. [Google Scholar] [CrossRef]
  31. Mahmood, K.; Lanz, M.; Toivonen, V.; Otto, T. A performance evaluation concept for production systems in an SME network. Procedia CIRP 2018, 72, 603–608. [Google Scholar] [CrossRef]
  32. Eckerson, W.W. Performance Dashboards: Measuring, Monitoring, and Managing Your Business; John Wiley & Sons: Hoboken, NJ, USA, 2010. [Google Scholar]
  33. ISO 22400-2; Automation Systems and Integration—Key Performance Indicators (KPIs) for Manufacturing Operations Management—Part 2: Definitions and Descriptions. ISO (International Organization for Standardization): Geneva, Switzerland, 2014.
  34. ISO 9001; Quality Management Systems—Requirements. ISO (International Organization for Standardization): Geneva, Switzerland, 2015.
  35. Directive (EU) 2022/2464 of the European Parliament and of the Council of 14 December 2022. Available online: https://eur-lex.europa.eu/legal-content/EN/TXT/?uri=CELEX:32022L2464 (accessed on 8 February 2024).
  36. Mesa, D.; Renda, G.; Gorkin, R., III; Kuys, B.; Cook, S.M. Implementing a Design Thinking Approach to De-Risk the Digitalisation of Manufacturing SMEs. Sustainability 2022, 14, 14358. [Google Scholar] [CrossRef]
Figure 1. The automation pyramid in the Industry 4.0 paradigm for manufacturing enterprises.
Sustainability 16 02974 g001
Figure 2. Methodology Stages.
Sustainability 16 02974 g002
Figure 3. Definition and selection of KPIs.
Sustainability 16 02974 g003
Figure 4. Automation level of the enterprise.
Sustainability 16 02974 g004
Figure 5. Data acquisition architecture.
Sustainability 16 02974 g005
Figure 6. Production sequence with red-highlighted operator declaration phase.
Sustainability 16 02974 g006
Figure 7. Management dashboard—department performance comparison for a single week.
Sustainability 16 02974 g007
Figure 8. Management dashboard—weekly comparison of a single department’s performance.
Sustainability 16 02974 g008
Figure 9. Department dashboard.
Sustainability 16 02974 g009
Table 1. MES functionality according to MESA-11 model.
IDFunction
1Resource allocation and status
2Operations scheduling
3Dispatching product units
4Document control
5Data collection and acquisition
6Labour management
7Quality management
8Process management
9Maintenance management
10Product tracking
11Performance analysis
Table 2. Machine characteristics.
TypologyConnectableN° of MachinesControlHardware IntegrationsCommunication Protocol
Old generationNo3Analogic//
New generationYes3DigitalNoMT Connect
New generationYes12DigitalYes, for three of theseProsys
Table 3. Matrix colours.
Work Order
Open
ActivitySignal
Spindle Active
Signal for AlarmSignal M0 StopColour Stored on Data Base
no---offoffoffGREY
no---onoffoffGREY
no---offonoffGREY
no---offoffonGREY
yesPRESETTINGoffoffoffYELLOW
yesPRESETTINGonoffoffYELLOW
yesPRESETTINGoffonoffYELLOW
yesPRESETTINGoffoffonRED
yesPROCESSINGoffoffoffYELLOW
yesPROCESSINGonoffoffGREEN
yesPROCESSINGoffonoffYELLOW
yesPROCESSINGoffoffonRED
Table 4. Meaning of colours.
ColourMeaning
GREYMachine not connected
Undeclared work order
GREENRunning Programme
YELLOWPresetting
Piece awaiting processing
Machine downtime
REDM0 scheduled stop times
M1 manual stop times
Table 5. Selected KPIs.
KPIDescription
I0 = Hm/HuN° of machines a single operator can operate
I1 = (v + r)/(v + r + g)Availability of the Machine (OEE)
I2 = v/(v +r )Machine cycle efficiency
I3 = (v + r + g)/24 × n°mach × n°daysFleet Saturation
Table 6. KPIs factors.
Legend
HmMachine hours
HuMan hours
VGreen hours
RRed hours
GYellow hours
n° machNumber of machines considered
n° daysNumber of days considered
Table 7. Control sheet template for testing the fictitious order of work.
Kind of ActivitySet TimesActivityDetected
Colour (Actual)
Stored Colour
No odl2′
Declaration Start Presetting
Presetting2′
Presetting2′Loading programme
Presetting2′Refer the Piece
Declaration End Presetting
Declaration Start Processing
Processing2′Spindle Running
Processing2′M0 (Manual Operation Expected by the programme)
Processing2′Manual Operation
Processing2′Joystick
Processing2′Alarm (If possible)
Declaration End Processing
Table 8. Industry 4.0 technologies used at the end of the project.
TechnologyArea of Application
Big dataData acquisition from shopfloor
Data analytics and business intelligenceData science
Cyber physical systemProcess management
Machine interconnectionData acquisitition system
HMI on each workstationWorkers engagement
Cyber securityProtection of company know-how
Disclaimer/Publisher’s Note: The statements, opinions and data contained in all publications are solely those of the individual author(s) and contributor(s) and not of MDPI and/or the editor(s). MDPI and/or the editor(s) disclaim responsibility for any injury to people or property resulting from any ideas, methods, instructions or products referred to in the content.

