Article

Enhancing Dairy Farm Welfare: A Holistic Examination of Technology Adoption and Economic Performance in Kahramanmaraş Province, Turkey

1
Faculty of Agriculture, Department of Agricultural Economics, Selçuk University, Konya 42000, Türkiye
2
Faculty of Agriculture, Department of Agricultural Economics, Kahramanmaraş Sütçü İmam University, Kahramanmaraş 46000, Türkiye
*
Author to whom correspondence should be addressed.
Sustainability 2024, 16(7), 2989; https://doi.org/10.3390/su16072989
Submission received: 14 February 2024 / Revised: 28 March 2024 / Accepted: 2 April 2024 / Published: 3 April 2024

Abstract

:
Technology and innovations have significant potential to enhance farm productivity, profitability, and economic sustainability. This study comprehensively investigates the relationship between technology adoption and economic performance within dairy farming. First, it seeks to clarify how socio-economic, information-seeking, behavioral factors and technical efficiency influence the level of technology adoption in dairy farms. It also compares the economic indicators of dairy farms depending on their technology adoption levels and evaluates whether technology adoption affects dairy farms’ technical, allocative, and economic efficiency. The data were collected from 188 dairy farmers in Kahramanmaraş Province in the East Mediterranean Region of Turkey in 2022. The results reveal that dairy farms’ technology adoption levels are influenced by income, household size, investment, ownership of cultured cattle breeds, Chamber of Agriculture membership, contact frequency with private veterinarians and other farmers, perceived ease of use, perceived usefulness, and technical efficiency. Farms with high-level technology adoption demonstrate increased profitability and efficiency scores, highlighting the positive correlation between technology adoption and farm efficiency. Policymakers should focus on training and support programs for dairy farmers to optimize technology use and input management. They can also promote resource-efficient farming and provide financial incentives for sustainable practices and dairy technologies.

1. Introduction

Dairy cattle farming significantly contributes to the Turkish economy in terms of value-added and employment generation from past to present. In 2022, Turkey produced 21.8 million tons of milk, accounting for 2.46% of global production [1]. Notably, dairy cattle alone accounted for 91.57% of total milk production in Turkey. In the context of marketed animal products, dairy milk occupies a dominant position, accounting for 35.11%, along with sheep milk comprising 4.29%, goat milk making up 0.94%, and buffalo milk contributing 0.11% [2]. Dairy cattle farming provides employment and income to those living in rural areas; however, it is typically conducted by small-scale family farms using traditional methods and limited technology, resulting in low productivity and competitiveness [3]. This is compounded by shifting consumer preferences and market demands [4]. As a consequence, the sector’s competitiveness is undermined by low milk yield and quality, coupled with rising production costs, potentially jeopardizing long-term sustainability.
In a study, Constantine et al. [5] underscored the importance of high-value-added agricultural and food products, efficient use of technology, profitable production, appropriate trade policies, and optimal resource management in enhancing competitiveness, and they focused on sustainable economic competitiveness. They stated that sustainable economic competitiveness can be attained by elevating the final product’s value through an effective value chain management system that incorporates environmental and social considerations. This involves increasing productivity and product quality throughout the agri-food value chain, highlighting the importance of harnessing technology and innovation. The adoption of technology and innovation is also important to assist farms in maintaining competitiveness within a dynamically changing sector by facilitating adaptation to evolving consumer demands and market trends.
In order to improve the productivity of dairy farms, the Turkish government has implemented various support mechanisms. Nationally, farmers receive various types of support such as feed support, vaccine and waste support, milk premium, disease-free enterprise support, and financing tools (low-interest loans). Furthermore, investments in modern farms have increased particularly due to the inclusion of support for milk and dairy product processing and marketing under the IPARD (Instrument for Pre-Accession Assistance Rural Development Program) in the 2014–2020 period. However, despite increased investments and support, technology adoption rates remain below optimal levels, indicating the need for concerted efforts to bridge this gap.
Integrating technology and innovations throughout dairy cattle farming is vital for ensuring cow health and welfare [6], enhancing milk yield and quality, and bolstering the sector’s profitability and sustainability [7,8]. Over the past two decades, the transition of dairy cattle farms from labor-intensive to knowledge-intensive production underscores the importance of farmers adept at swiftly utilizing information [4]. The impact of technologies remains a critical factor for rural development, encompassing domestic and foreign market development, as well as advancements in communication and transportation [9]. As stated by Yalçın and Boz [10], adopting modern technologies will help to increase productivity and profit rates in the short term while improving the living standards in rural areas in the long term.
Determining the level of technology adoption among dairy farmers and understanding the factors that influence their adoption decisions is the first step in assessing the impact of these technologies on all aspects [11]. Technology and innovations are generally adopted based on their perceived benefits and utility [12]. Farmers who aim to maximize profit will adopt new technologies if they perceive that the adoption will generate a positive net economic benefit [13]. It was stated that technology is an essential factor that influences efficiency, along with factors such as quality, farm management and organization, political and institutional conditions, and farm economies [14]. Therefore, it is important to consider the effect of technology adoption levels on the economic performance of dairy farms. Studying the relationship between technology adoption levels and farm efficiency will provide insights into the impact of technological advancements on overall economic performance.
Numerous studies have highlighted the significant role that various factors play in shaping the adoption of agricultural technologies among dairy farms [15,16]. Additionally, research has extensively focused on efficiency analysis and its determinants within dairy cattle farms [14,17,18,19,20,21]. While extant literature has delved into various facets of technology adoption and efficiency analysis within dairy farming, significant gaps persist, particularly concerning the interplay between technical efficiency and technology adoption [22,23]. Moreover, the relationship between efficiency and technology adoption in the Turkish context remains underexplored, necessitating comprehensive research endeavors to elucidate these dynamics. It is imperative to comprehend the economic implications for dairy farms by understanding the relationship between technology adoption and farm efficiency. Therefore, this study aims to extend previous literature to address these gaps and provide a more comprehensive understanding of the dynamics between technology adoption, efficiency, and economic performance within the dairy farming sector.
This study examines the relationship between dairy farms’ technology adoption levels and their economic performance by employing a multifaceted analytical framework comprising three distinct models. The first model analyzes various determinants influencing technology adoption, including socio-economic, information-seeking, and behavioral factors and technical efficiency. This model helps us to understand the technology adoption process by evaluating the impact of different factors, particularly technical efficiency. The second model compares economic performance indicators, such as gross production value, gross margin, technical efficiency, allocative efficiency, and cost efficiency, to identify differences in economic performance according to the level of technology adoption by dairy farms. The third model examines the impact of farm characteristics, specifically dairy farms’ technology adoption levels, on their economic efficiency. These models offer a comprehensive analysis by scrutinizing the relationship between technology adoption and economic performance from various angles. The outcomes of this study will offer significant findings for all stakeholders in the dairy sector and researchers investigating this subject.
This section is followed by theoretical background and hypotheses. The next section, Section 3, describes the research design, including data collection methods, sample selection, statistical models, and variables used for analysis. Section 4 presents the findings from the statistical models, including analyses of determinants of technology adoption, differences in economic performance indicators according to technology adoption levels, and the impact of farm characteristics and technology adoption on economic efficiency. Section 5, the discussion part, interprets the results in light of previous studies and discusses implications. The final section, Section 6, presents the conclusion of this study. This section summarizes the main findings, focuses on implications, reiterates the study’s significance, addresses limitations, and suggests avenues for future research.

2. Theoretical Background and Hypotheses

Effective modeling in research necessitates a thorough grasp of farmers’ decision-making processes and outcomes [24]. The theory of agricultural technology adoption integrates decision theory and the diffusion of innovation theory to elucidate why some farmers adopt new technologies while others do not [25]. Various factors have shaped the development of adoption theories, resulting in diverse models and theories depending on objectives and context. This section provides an overview of the theoretical frameworks and literature underpinning the conceptual model for this research, followed by the formulation of research hypotheses based on insights derived from these frameworks.

2.1. Innovation Adoption and Diffusion Theory

Recent studies on the diffusion and adoption of agricultural innovations have explored various perspectives, including innovation diffusion theory, behavioral models, econometric models, social capital, and social network analysis [26]. Notably, the adoption and diffusion models of Rogers [27], Feder et al. [28], and Nowak [29] have been extensively studied. Rogers defines innovation as a new idea, practice, or technology for an individual or adopter, where adoption refers to the decision to use innovation as the most suitable course of action, and diffusion is the process by which an innovation spreads through specific channels over time among members of a social system. The adoption decision process, according to Rogers, is an information-seeking and processing activity driven by the need to reduce uncertainty about the advantages and disadvantages of an innovation. Rogers further suggests that adoption is influenced by various factors, including socio-economic characteristics, personality traits, and communication behaviors [30]. Feder et al. [28] expanded on Rogers’s model by incorporating communication channels and contextual factors, such as environmental, economic, geopolitical, socio-economic, and institutional factors, alongside risk and uncertainty. Nowak [29] adds that adoption decisions are influenced by social–psychological, structural, ecological, and institutional factors. Research from multiple fields has identified several factors affecting technology adoption, including personal, cultural, social, and economic attributes and specific technology characteristics [31].
Numerous studies have investigated the factors influencing technology adoption in dairy farming. For instance, Çiçek et al. [15] found that education level, farm scale, age, experience, participation in social life, and extent of mass media usage influence technology adoption. Similarly, in Ethiopia’s cattle industry, Mekonnen et al. [32] observed significant influences of cattle breed, education level, family size, and proximity to the market on technology adoption, with higher adoption rates associated with improved milk yield. Boz et al. [30] identified farmer age, income level, investment, improved breeds, internet usage, and interactions with extension personnel and private veterinarians as determinants of adoption levels. Wairimu et al. [16] found hired employees, dairy records, total dairy cows, and household head education to be influential factors for technical dairy innovation adoption, while the intensity of organizational and institutional dairy innovation adoption was influenced by income, farm size, dairy records, and access to dairy information. Gargiulo et al. [33] revealed a positive relationship between herd size and the adoption of precision technology, while Abeni et al. [34] reported higher probabilities of using precision livestock tools in farms with larger herds. Gillespie et al. [35] identified several factors influencing technology adoption in the U.S. dairy industry, including farmer demographics, farm location, tenure, size, and diversification. Dehinenet et al. [36] found significant influences of various factors, such as family size, farming experience, access to extension services, livestock availability, income from milk products, training, household head age, and off-farm activities, on dairy technology adoption probability and level. According to innovation diffusion theory, technology adoption is influenced by household members’ education level, experience, and gender [37], with social networks and peers also playing significant roles [38].

2.2. Technology Acceptance Model (TAM)

The Technology Acceptance Model (TAM) is widely used for predicting technology adoption, complementing economic models in capturing the complexity of farmers’ behavior and motivation [39]. The TAM, rooted in the Theory of Reasoned Action (TRA) developed by Fishbein and Ajzen [40] in 1975, posits that an individual’s attitude toward using a system depends on their perceptions of its usefulness and ease of use. Perceived usefulness refers to the extent to which an individual believes that using a particular system would enhance their job performance, while perceived ease of use refers to the extent to which an individual believes that using a particular system would be effortless [41]. According to the TAM, perceived usefulness is influenced by perceived ease of use, suggesting that the easier a system is to use, the more useful it can be [41]. The TAM has found widespread applications across various fields, including agriculture.
Numerous studies have validated the Technology Acceptance Model’s efficacy in evaluating technology adoption in agriculture [42,43]. Venkatesh and Davis [44] reported that the TAM explains a significant proportion of variance in usage intentions and behavior, with studies in Thailand highlighting the model’s relevance in dairy technology adoption [43]. Flet et al. [39] found significant associations between perceived usefulness, perceived ease of use, and technology adoption among dairy farmers in New Zealand. Naspetti et al. [45] extended the TAM to analyze dairy farmers’ attitudes and intentions toward sustainable production strategies, revealing a strong influence of perceived usefulness on acceptance. Schaak and Muscof [46] conducted a study in Germany applying the Technology Acceptance Model. Their results indicate that the perceived usefulness and perceived ease of use significantly influence the adoption of grazing practices.

2.3. Economic Performance and Efficiency Measurement Approaches

Technology adoption in dairy farming is crucial for enhancing productivity, efficiency, and profitability. Economic performance analysis guides planning and decision-making processes for achieving business success and sustainability, with technology adoption typically driven by economic benefits [13]. Various indicators, such as gross production value, gross margin, variable costs, profitability, and efficiency scores, are used to measure farm economic performance, aiding resource allocation decisions [47]. The agricultural economics literature emphasizes the impact of fixed and variable costs and profitability on technology adoption, with economic performance indicators facilitating comparisons between adopters and non-adopters or different levels of adoption [48].
Efficiency measures, including technical, allocative, and economic efficiency, offer insights into overall dairy farm performance, with Farrell [49] first conceptualizing efficiency as the ability to maximize output from given inputs. Technical efficiency assesses a farm’s ability to maximize output using a given technology and input quantity. In contrast, allocative efficiency focuses on optimal input use proportions to minimize costs given technology and input prices [50]. Efficiency can be measured using SFA (parametric) and DEA (non-parametric). SFA primarily utilizes econometric regression to analyze the production function. This involves redefining the functional form and separating the residual into a non-negative inefficiency element and the error term [47]. On the other hand, efficiency can be calculated without making assumptions about the technology by using DEA. Additionally, DEA is not limited by statistical concerns regarding the number of inputs that can be included [50,51].
Studies on farm efficiency and determinants have employed non-parametric and parametric approaches, with herd size, feed ratio, land, labor, education, infrastructure, subsidies, soil type, and technological innovations among the key determinants influencing efficiency [14,17,18,19,20,22,52,53,54,55]. Improved breeds, feed innovations, and policy changes have been shown to positively impact efficiency, with factors like subsidies and farm diversification exhibiting mixed effects across studies.

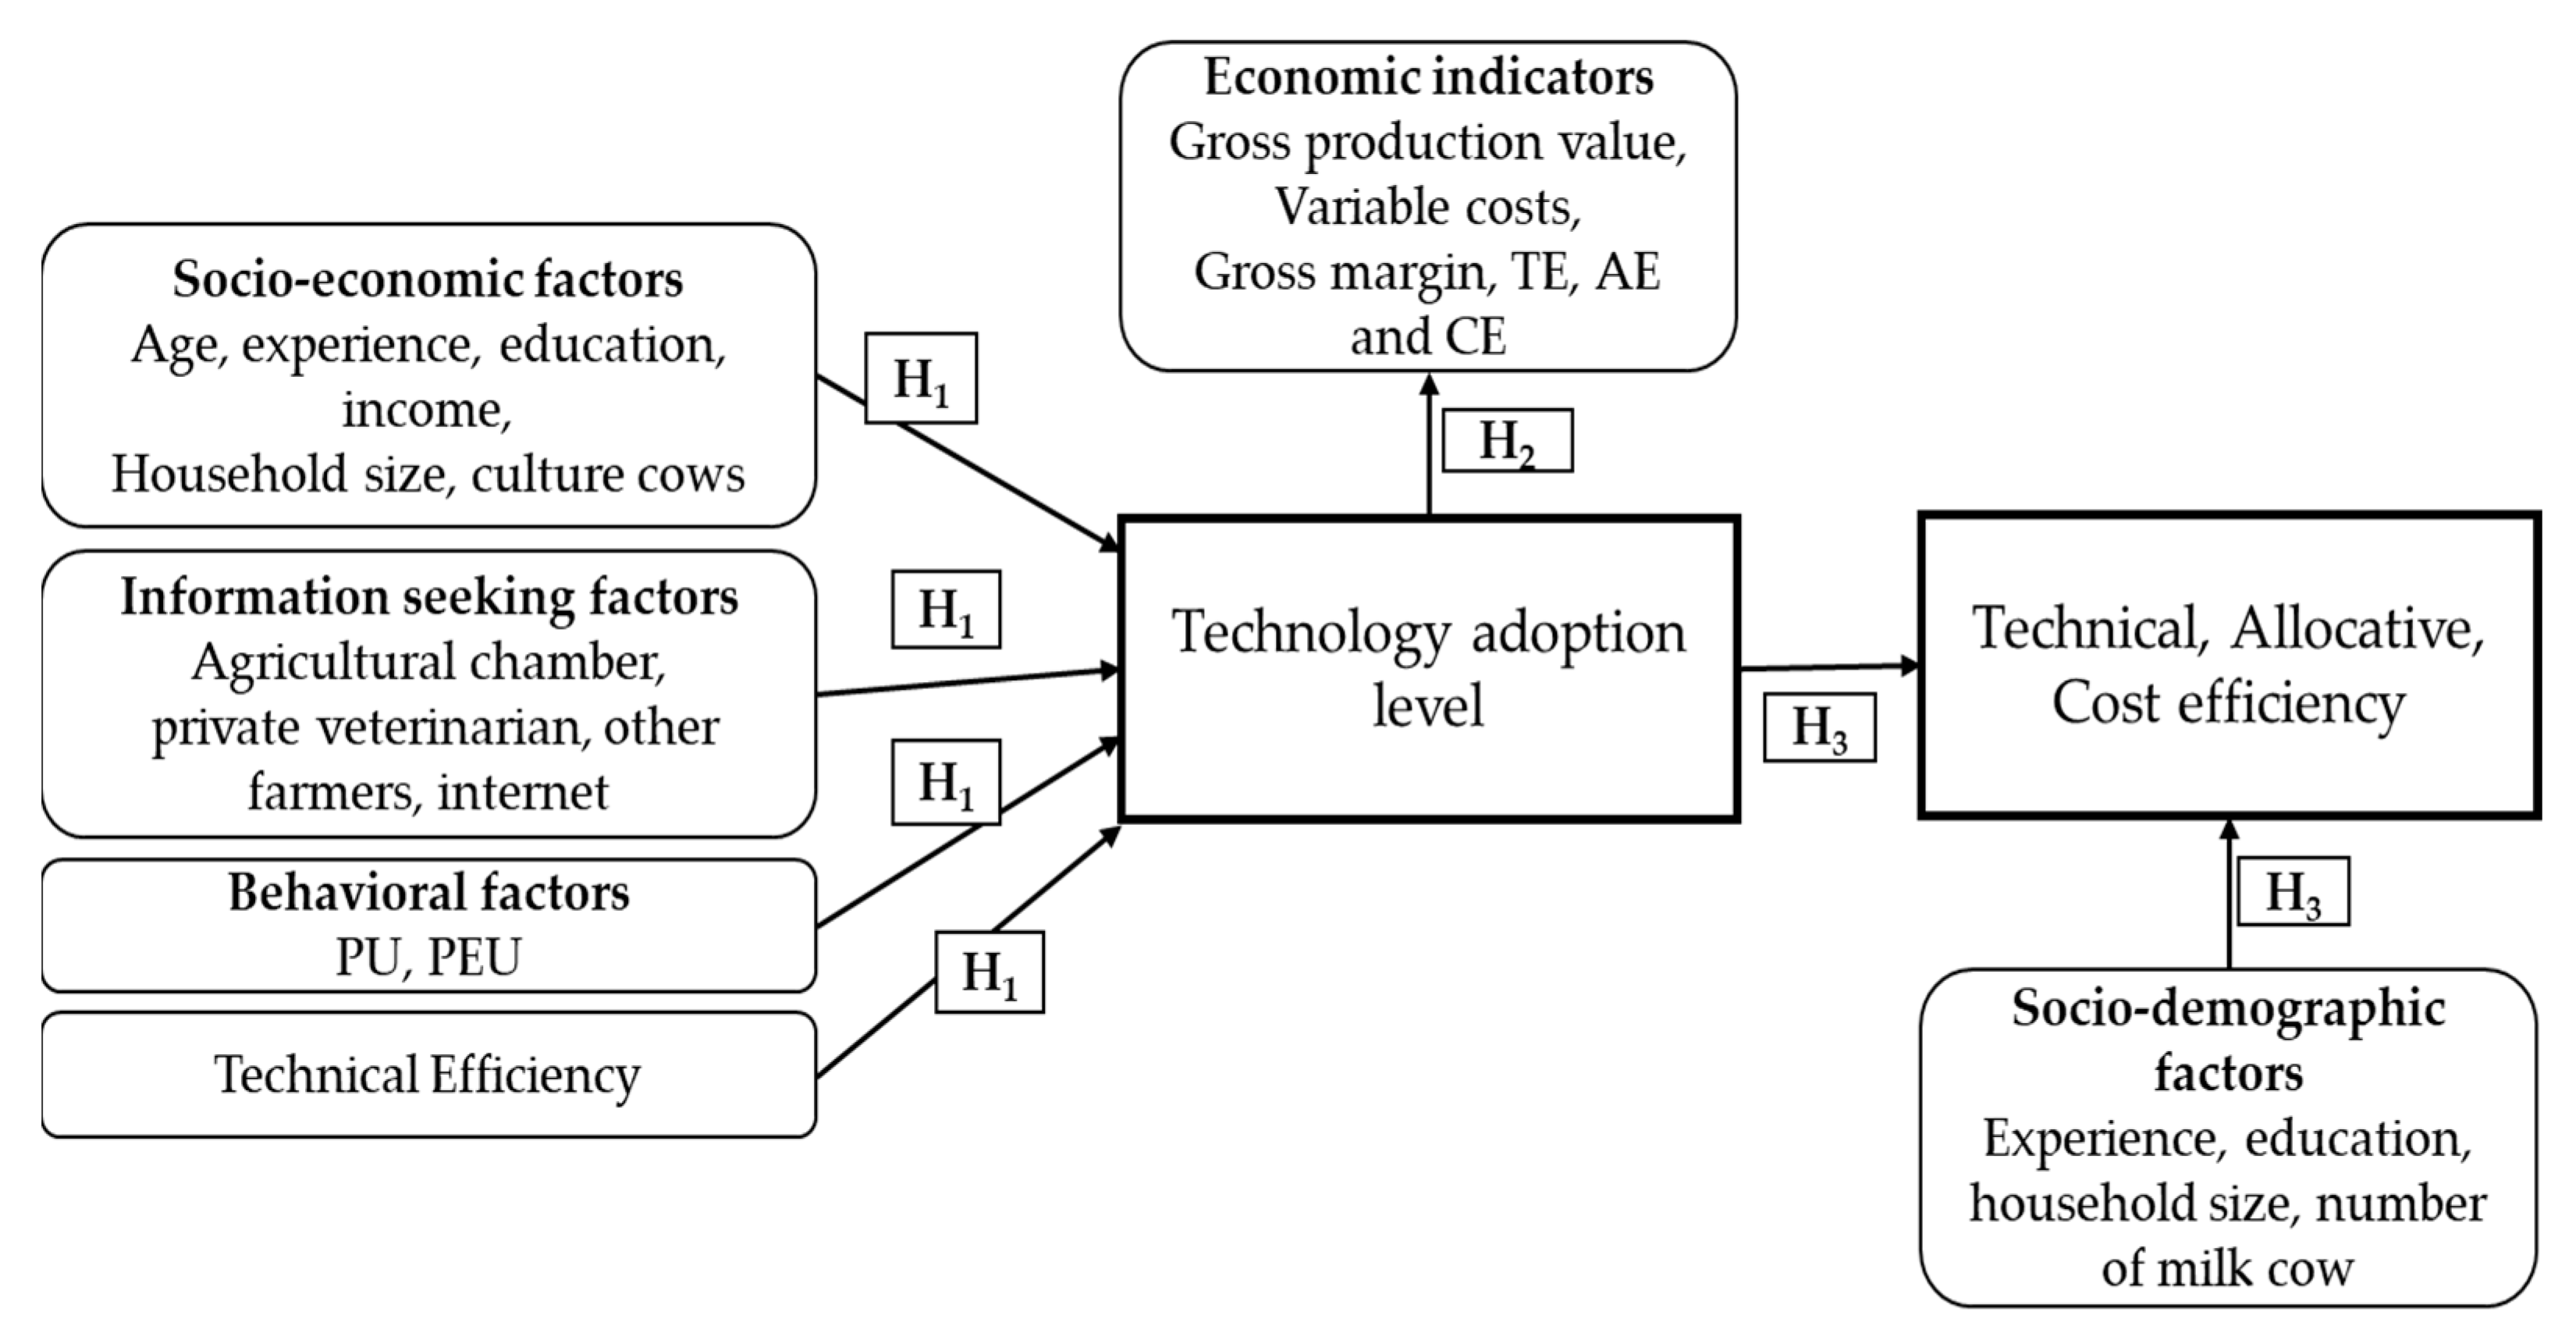
2.4. Conceptual Framework and Hypotheses

In conclusion, each model possesses unique characteristics and attributes limiting its applicability to specific areas, necessitating the identification of a comprehensive and compatible framework aligned with the study objectives. The conceptual framework integrates insights from innovation adoption and diffusion theory, the Technology Acceptance Model, farm efficiency, and performance measurement concepts, providing a comprehensive framework for investigating the relationship between socio-economic factors, information-seeking behaviors, efficiency, and technology adoption. Additionally, it explores the impact of technology adoption levels on dairy farm performance, aiming to enhance understanding of technology adoption mechanisms and their implications for dairy farm efficiency and economic performance.
This study employs a three-stage conceptual framework and develops hypotheses accordingly. The first stage examines the effect of socio-economic factors, information-seeking behaviors, and technical efficiency on the level of technology adoption of dairy farms, formulated as follows:
H1. 
The adoption level of technology in dairy farms is influenced by socio-economic factors, information-seeking behaviors, behavioral factors, and technical efficiency.
The second stage employs economic analysis to assess differences in economic performance indicators across varying technology adoption levels. Comparing farms’ economic performance based on varying technology adoption levels has significant implications. Firstly, such a comparison allows for assessing the impact of technology adoption on farms’ profitability. For instance, determining whether farms with higher levels of adoption are associated with greater profitability and productivity can inform the planning and implementation of future technology adoption strategies in the long term. Therefore, the following hypothesis was developed:
H2. 
There are significant differences in economic indicators according to the level of technology adoption in dairy farms.
The third stage investigates the effects of technology adoption levels and socio-economic factors on the technical, allocative, and economic efficiency of dairy farms, leading to the formulation of the following hypothesis:
H3. 
Socio-demographic factors and dairy farms’ technology adoption levels significantly influence technical, allocative, and cost efficiencies.
Figure 1 presents an overview of the conceptual framework of this study. On the left side, explanatory variables of technology adoption level are displayed, including socio-economic, informational, and behavioral factors and technical efficiency. The determinants of technical, allocative, and cost efficiencies are illustrated on the right side. The variables considered in this study include socio-demographic factors such as experience, education, household size, number of milk cows, and the level of technology adoption. The economic indicators, including gross production value, variable costs, TE, AE, and CE, are shown on the upper side of Figure 1, along with the technology adoption level as a factor variable.

3. Materials and Methods

3.1. Study Area

This research was conducted in 2022 in Kahramanmaraş Province, located in southern Turkey, east of the Mediterranean Region, between 37°11′ and 38°36′ north parallels and 36°15′ and 37°42′ east meridians. The total milk obtained from dairy cattle in Turkey is 20.7 million tons. The Mediterranean region accounts for 8.57% of the dairy milk production in Turkey [2]. Kahramanmaraş ranks second in the Mediterranean region in terms of total milk production and the number of milked dairy cattle. The primary data for this research were collected through face-to-face surveys with dairy cattle farmers in Kahramanmaraş Province. Additionally, data from the Ministry of Agriculture and Forestry records, statistics from institutions such as the Turkish Statistical Institute and FAO, and information from scientific publications such as theses and articles were utilized as secondary data sources.

3.2. Sample Size and Data Collection

According to data obtained from the Kahramanmaraş Provincial Directorate of Agriculture and Forestry, the province is home to 14,865 dairy cattle farms. Four districts (Dulkadiroğlu, Onikişubat, Göksun, and Türkoğlu) where dairy farming is the main income source were selected for this study. Farms with fewer than five dairy animals were excluded from the population. The proportional sampling method was employed to determine the sample size, established as 165, using a 99% confidence interval and a 10% margin of error [56].
n = N p ( 1 p ) N 1 σ p x 2 + p ( 1 p )
In the formula, n: sample size; N: total number of dairy farms; p: 0.5; r: margin of error (10%);  Z α / 2 : 2.58;  σ p x 2 : variance.
σ p x 2 = r Z α / 2 2 = 0.10 2.58 2 = 0.00150
However, due to potential challenges in the research area, such as farmers’ reluctance to share information or misreport their answers, a replacement survey was conducted at a rate of 15% of the original sample size. Consequently, this research analyzed data from a total of 188 dairy farms. Questionnaires were used as the primary data collection tool, designed through an extensive review of previous studies and input from subject experts.
The technology and innovations incorporated into the questionnaire were constructed through a comprehensive literature review supplemented by insights from experts in the field. These technologies encompass a range of advancements and practices relevant to dairy farming, including precision farming systems in dairy cattle breeding [33,57], mechanization [58,59], best management practices and innovations [30,60], and milking machines and milking systems [4,61], as well as various technical innovations [15,16,37,62,63,64,65]. Expert input was solicited to ensure the inclusion of pertinent technologies and to validate the questionnaire’s content validity.
Out of the 92 technologies related to dairy farming identified, 8 were excluded as their utilization level was less than 1%. These excluded technologies were automatic intensive feed units, drinker systems measuring water consumption, ultrasonographic imaging devices, image analysis systems, rotary platforms, waste recycling systems, pasture measuring devices, and barn heating. The remaining 84 technologies were used for the analyses. A list of these technologies and innovations is provided in Appendix A.

3.3. Data Analyses

3.3.1. Ordered Logistic Regression

Ordered logistic regression (OLR) analysis was used to determine the factors affecting the level of technology adoption of dairy farms. This method is appropriate when the dependent variable comprises ordered categories, such as low, medium, and high, and aims to evaluate the association between predictor variables and the ordinal categories of the outcome variable [66]. Additionally, it provides more accurate results than linear and logistic regression.
The ordered logistic regression employs a link function to elucidate the impacts of explanatory variables on an ordered categorical variable, eliminating the need for assumptions regarding constant variance and normality [67,68]. The OLR model is explained by the hypothesis that there is an unobservable latent variable (Y*) behind the observable dependent variable (Y) [69]. This variable is expressed as follows;
Y* = β′X + ê
where Y* is the latent variable, β is the coefficient of the parameters, and ê is the error term. The error term is assumed to be 0 and symmetric. The relationship between the latent variable (Y*) and the dependent variable (Y) is a function of threshold points that vary according to observations. The maximum likelihood technique is used to determine the Y* regression equation. The OLR equation is given in Equation (2) [69].
link (yi) = µi − ∑β′k xk
Here, yi is the cumulative probability value of the i-th category, µi is the threshold value of the i-th category, β′ is the regression coefficient, and x is the independent variable. Since the effect of the coefficients obtained as a result of OLR analysis cannot be interpreted accurately, marginal effects were calculated to determine how much the independent variables change the probability of falling into each category of the dependent variable [70]. STATA (version 14) was used in the analysis of the data [71].
The variables selected for the OLR model were based on the theories and findings of the previous literature mentioned in Section 2. The dependent variable was created by identifying 84 technologies used in dairy farming. Three adoption categories were established by analyzing the frequency distribution of farmers’ responses regarding their adoption (or not) of these technologies. Farmers who adopted less than 21 technologies were classified as low-level technology adoption, while those who adopted 22–37 technologies were classified as medium-level technology adoption, and farmers who adopted 38 or more technologies were classified as high-level technology adoption [15,30,62].
The OLR model included independent variables such as socio-economic characteristics, information-seeking factors, behavioral factors, and technical efficiency of dairy farms. The selection of socio-economic and information-seeking factors was based on previous studies that followed the Innovation Adoption Theory [30,32,37,38]. The socio-economic characteristics of farmers were age, agricultural experience, education, income level, household size, investment, and ownership of cultivated breeds. The factors that were identified as important for seeking information were membership in the Agriculture Chamber, frequency of contact with private veterinarians and other farmers, and frequency of internet use.
The Technology Adoption Model posits that an individual’s decision to adopt a technology is influenced by their perception of its usefulness and ease of use. As such, the model includes perceived usefulness and perceived ease of use as determinants. Few studies in the literature have examined the relationship between technical efficiency and technology adoption in dairy farming. To contribute to the literature and future studies, it is crucial to examine the effect of technical efficiency on the level of technology adoption. Therefore, the OLR model includes the technical efficiency, measured by employing Data Envelopment Analysis, as an explanatory variable.

3.3.2. Economic Assessment

To achieve the second aim of this study, Analysis of Variance (ANOVA) was used to compare dairy farms’ economic performance according to their technology adoption levels. ANOVA is employed to determine whether there is a statistically significant difference between various groups. This analysis aids in determining whether different levels of technology adoption exhibit significant differences in terms of economic performance indicators such as efficiency scores, gross production value, variable costs, and gross margin. This is crucial for comprehending the economic impacts of technology adoption on dairy farming. Also, identifying differences in economic performance between farms with different levels of technology utilization can help to direct agricultural policies toward promoting access to technology. The gross production value was calculated by multiplying the daily milk yield (liters/cow) by the milk price. The gross margin was obtained by subtracting the sum of variable costs from the gross production value. All values were calculated in relation to the lactation period, and the number of cows milked.

3.3.3. Data Envelopment Analysis (DEA)

Data Envelopment Analysis (DEA) was used to calculate the technical (TE), allocative (AE), and cost efficiency (CE) scores by using the DEAP 2.1 [72]. Data Envelopment Analysis (DEA) is a widely used method for obtaining efficiency scores for Decision-Making Units (DMUs) [73]. This method requires no assumptions regarding functional relations between inputs and outputs. DEA involves using linear programming methods to construct a non-parametric piece-wise frontier over the data, and efficiency measures are then calculated relative to this surface [50]. Any farm that falls below this frontier is considered inefficient. This means that the farm could either maintain its output while reducing input use or increase output while using the same level of input [74].
Since dairy farmers have more control over inputs than outputs, an input-oriented efficiency model was used to estimate efficiency scores [72]. According to Equation (3), yi defines the output variable, and xi defines the input. If there are N dairy farms, K × N represents the input matrix (X), while M × N represents the output matrix (Y). The technical efficiency scores were calculated as follows:
Minθ,λ θ,
θ Subject to −yi + Yλ ≥ 0,
θxi − Xλ ≥ 0, λ ≥ 0
θ is the technical efficiency score that ranges from 0 to 1. λ is the N × 1 vector of constants. A score of 1 indicates that the farm is technically efficient. According to Coelli et al. [50], allocative efficiencies can be measured if the input prices are available. After obtaining TE scores given in Equation (3), the next step requires a solution of the following cost-minimization DEA:
Minλxi* wi′ xi*
Subject to −yi + Yλ ≥ 0
xi* − Xλ ≥ 0, λ ≥ 0
where wi is a K × 1 vector of input prices for the i-th dairy farm, xi* is the cost-minimizing vector of input quantity, wi is the input price, and yi is the output level. The cost efficiency (CE) under the constant returns to scale (CRS) assumption is calculated as follows:
CE = wi′ xi*/wi′ xi
The allocative efficiency is calculated as:
AE = CE/TE
While allocative efficiency is farmers’ ability to consider costs when combining inputs, economic efficiency measures overall efficiency, including both technical and allocative efficiency.
A two-stage approach was applied in this study. Firstly, efficiency scores were estimated using Data Envelopment Analysis. Then, a regression model was used to determine the factors that affect TE, AE, and CE. Tobit regression was used to evaluate the impact of various factors on the efficiency scores, as in prior studies [51,52,75]. The model is expressed as follows:
Yi = α + β1x1 + … + βnXn + ui
Yi is the efficiency score, and x1,…,xn are the independent variables. The variables used to estimate the dairy farmers’ technical, allocative, and economic efficiency and the variables used in Tobit regression are presented in Table 1. In DEA, the monthly milk yield was used as the output, and the roughage feed (kg/head) and concentrate feed (kg/head) were used as inputs. The reason for selecting these two inputs is that they have the highest proportion of variable costs. The previous literature on dairy farming has investigated various factors that influence efficiency scores. Mareth et al. [51] surveyed 42 studies and identified 14 variables: location, age, education, farm size, feeding practices, animal health, and technology adoption. However, this study specifically focuses on the impact of technology adoption levels on dairy farm efficiencies. Thus, socio-demographic factors and the level of technology adoption of dairy farms were used as explanatory variables in the Tobit model (Table 1).

4. Results

The variables used in the ordered logistic regression analysis and their descriptives are given in Table 2. It was determined that 22.9%, 59.0%, and 18.1% of the farmers have low, medium, and high technology adoption levels, respectively. The average age of the farmers was 48.49 years, and the average agricultural experience was 24.35 years. Of these farmers, 59% had primary and secondary education levels, and 41% had a low income level (Table 2). On average, there are 4.46 people in a household, 37% of the farmers have invested in their farms in the last three years, 29% are members of cooperatives, and 72% have culture breeds in their farms. While the frequency of meetings with veterinarians and other farmers is at a medium level, the frequency of internet usage is low. In addition, 50% of the farmers stated that it was easy to use technology, and 71% stated that technology increased farm productivity. On average, the technical efficiency score of dairy farms was measured as 0.60. This indicates that inefficient dairy farms could achieve the same output by reducing 40% of their inputs to become as efficient as their counterparts (Table 2).

4.1. Influencing Factors of Technology Level of Dairy Farms

The coefficients, standard error, p-values, and marginal effects of the OLR model are presented in Table 2. In the model, the Log-Likelihood value is −96.57, the Chi-square value is 173.88, and the model is significant (p = 0.000). According to Miles [76], the VIF value should be less than 10. The Variance Inflation Factor (VIF) ranged between 1.11 and 2.84, indicating the absence of multicollinearity among the independent variables. Another crucial assumption for the validity of the OLR model is the parallel lines. This implies that the predicted values of the independent variables should not vary according to the categories and cut-off points of the dependent variable. According to the parallel lines test, the p-value was calculated as 0.260. This result indicates that the estimates of the independent variables passed through the same threshold point, meeting the assumption of parallel curves. Pearson Chi-square and deviance tests were applied to determine the goodness of fit of the model. Pearson Chi-square (p = 0.591) and deviance (p = 1.000) tests showed that the model was appropriate. In addition, the Nagelkerke R2 value was determined as 0.714, indicating that the independent variables explain 71.4% of the change in the dependent variable.
The results of the OLR and the marginal effects are presented in Table 3. Out of 16 variables analyzed, 11 were found to be statistically significant. These variables include income, number of individuals in the family, investment, presence of cultivated breed, cooperative membership, frequency of meeting with a private veterinarian, frequency of meeting with other farmers, PEU, and PU, as well as TE. The analysis revealed a negative relationship between technology adoption level and the number of individuals in the family. Conversely, a positive relationship was observed with other variables. However, age, experience, education, and the frequency of internet use were found to have no significant effect on the level of technology adoption. When evaluating the marginal effects of the income variable, it is observed that being in the middle-income group decreases the probability of being in the high-technology level by 11.45% compared to those in the high-income group. Similarly, being in the low-income group decreases the probability of being in the high technology level by 15.20% (Table 3).
According to the results, there was a negative and significant relationship between the number of family members and the level of technology adoption (p = 0.055). Having more family members negatively affects the adoption of technology. In other words, a one-unit increase in the number of family members decreases the probability of farmers being at a high technology level by 1.5%. It was found that there was a statistically significant and positive relationship between the level of technology adoption and investment (p = 0.000). Farmers who invested in their farms were 7.14% more likely to be at a medium level of technology adoption and 19.01% more likely to be in a high-level technology adoption group than those who did not invest. Similarly, a significant relationship exists between the presence of cultured breeds and the level of technology adoption (p = 0.016). The findings indicate that having more cultured breed animals on the farm increases the likelihood of the farm being classified at a high technology adoption level by 7.04%. According to the OLR findings, farmers affiliated with the Chamber of Agriculture are 6.20% more likely to be classified within the high-technology-adoption group (Table 3).
As expected, it was determined that farmers’ more frequent contact with private veterinarians (p = 0.020) and other farmers (p = 0.050) had a positive and significant relationship with the level of technology adoption. On the other hand, no significant relationship was found with the frequency of internet use (p = 0.586). This result indicates that more frequent meetings with private veterinarians and other farmers increase the likelihood of adopting technologies. The findings reveal that PEU and PU positively and significantly affect technology adoption (Table 3). The marginal effects analysis indicates that a farmer’s perception of a technology’s ease of use and its ability to enhance milk yield increases the likelihood of adopting high-level technologies by 12.38% and 8.67%, respectively. The technical efficiency of dairy farms significantly affects the level of technology adoption. As the TE score increases, the probability of being in the medium and high technology adoption levels increases by 8.60% and 22.89%, respectively.

4.2. Comparison of Economic Indicators in Terms of the Technology Adoption Level of Dairy Farms

This study compared the gross production value, variable costs, gross profit, and efficiency scores of dairy farms based on their technology levels (Table 4). The results indicate that economic variables vary significantly depending on the technology level. The technical efficiency scores of dairy farms in terms of low, medium, and high technology levels were 60.22%, 57.83%, and 71.97%, respectively, and the average of TE for all dairy farms was calculated as 60.93%. Dairy farms with high technology levels achieved significantly higher TE than those with lower technology levels. However, despite their advanced technology, these farms are not utilizing their inputs optimally. These farms can achieve the same output while reducing their input usage by approximately 28%.
The allocative efficiency scores for low, medium, and high technology levels were calculated as 81.92%, 81.11%, and 87.10%, respectively. The average of AE for the entire sample was measured as 82.38%. This shows that, given input prices, these dairy farms use an inappropriate feed mix, and they can achieve the same output by reducing costs by 18.08%, 18.89%, and 12.90%, respectively. The cost efficiencies of the dairy farms were calculated to be 61.80% on average. The CE scores of dairy farms were less than 70%, depending on their technology levels. This means that the feed cost of average dairy farms is 30% higher than that of their efficient counterparts. In other words, dairy farms spend 30% more than the minimum cost input combination. Consequently, the category with the highest level of technology has the highest technical, allocative, and cost-efficiency scores along with the highest gross production value and gross margins (Table 4).

4.3. The Effect of Farm Characteristics and Technology Adoption Level on Efficiency

Table 5 presents the results of the Tobit regression estimations. TE, AE, and CE scores were used as dependent variables, and five independent variables were regressed on these efficiency scores. According to the results, experience, education, household size, and technology adoption level of dairy farms significantly influence efficiency scores. The experience of dairy farmers has a positive and significant influence on dairy farms’ technical, allocative, and cost efficiency. This suggests that farmers with more experience work more efficiently than those with less experience. The education level of dairy farmers has a significant relationship with AE and CE. Low education negatively affects the AE and CE of dairy farms compared to those with higher education. In other words, dairy farmers with higher education tend to achieve higher AE and CE scores. In addition, the results showed a significantly negative association between efficiency scores and household size. Having more family members on the farm decreases TE, AE, and CE.
Technology adoption level is also significantly related to dairy farms’ technical, allocative, and cost efficiency. Regarding efficiency scores, high-technology farms have higher efficiency scores than low- and medium-technology farms. This implies that the use of technology in dairy farming improves dairy farms’ technical, allocative, and cost-efficiency.

5. Discussion

This study offers valuable insights into the determinants and consequences of technology adoption and its impact on the economic performance of dairy farms, shedding light on the multifaceted nature of this phenomenon. The findings confirm several hypotheses regarding the determinants of technology adoption, revealing that factors such as income levels, investment in farm operations, and ownership of cultured breeds positively influence technology adoption levels. These findings align with prior research by Boz et al. [30] and Quddus [60], emphasizing the importance of financial resources and breed management practices in fostering technology uptake among dairy farmers.
Moreover, family size emerged as a significant factor affecting technology adoption, with larger households exhibiting lower adoption levels. While new technologies offer labor-saving benefits [77], contradictory findings [36,78] suggest diverse impacts of family size on adoption patterns, warranting further investigation. Additionally, membership in agricultural organizations like Chambers of Agriculture was associated with higher technology adoption rates, emphasizing the role of institutional networks in facilitating technology transfer and knowledge dissemination among farmers. Encouraging farmers to join such organizations can enhance access to resources, market information, technologies, and agricultural inputs, thereby promoting competitiveness and sustainability. Constantine et al. [5] stated the importance of high-value-added agricultural products, efficient use of technology, trade policies, and optimal resource utilization to enhance competitiveness. Thus, national policies can augment competitiveness by furnishing a supportive framework to encourage farmers to adopt innovation and technologies. Furthermore, this study underscores the role of information access and farmers’ attitudes in shaping technology adoption behavior.
The level of technology adoption was positively correlated with frequent engagement with private veterinarians and fellow farmers. This highlights the importance of knowledge exchange and social networks in facilitating technology transfer and adoption. Conversely, the absence of a significant association between internet usage and technology adoption suggests the necessity for more targeted and context-specific interventions to harness digital technologies for agricultural development in dairy farming contexts. In a recent study, Muca et al. [79] used Instagram to share scientific knowledge about dairy cow nutrition and health with the public. Their results suggest that social media platforms can help farmers reach a wider audience, engage with stakeholders, and promote the adoption of technological advancements in dairy farming.
The adoption levels were significantly influenced by positive perceptions of technology’s ease of use and utility, which is consistent with the findings of Flet et al. [39] and Schaak and Mußhoff [46]. This highlights the importance of addressing farmers’ attitudes and beliefs in promoting technology uptake and diffusion. Training and awareness programs should be developed to increase farmers’ positive perceptions of technology use. Technical efficiency positively influences the level of technology adoption. The high technical efficiency enables farmers to use resources more efficiently and effectively. This may increase the propensity of firms to invest in more technology and adoption rates. In other words, an increase in technical efficiency increases the level of technology adoption.
Significant differences were observed among economic indicators, including gross production value, gross margin, technical efficiency, allocative efficiency, and cost efficiency, across different levels of technology adoption, confirming the second hypothesis. Farms with advanced technology demonstrated higher technical, allocative, and cost efficiencies, which is consistent with findings from other studies conducted in Greece [80] and Pakistan [81].
The third hypothesis examined the determinants of efficiency scores, including the level of technology adoption, experience, education, household size, and number of milked cows. The results confirmed that these factors are significant determinants of efficiency scores except number of milked cows, which supports the third hypothesis. As expected, experience and education positively and significantly affect efficiency scores. These results are in line with previous studies [7,21,82]. Efficiency is higher in households with fewer members, which can be attributed to technology adoption. This can be explained by the fact that using more technology and innovation on the farm would increase labor productivity. While this result supports Mareth et al. [19], it is inconsistent with Cabrera et al. [17]. Farms with advanced technology demonstrated higher technical, allocative, and cost efficiencies. This underscores the potential of technology adoption to enhance farm productivity and profitability, aligning with previous research highlighting the positive impact of technology on dairy farm efficiency [12,23].

6. Conclusions

The relationship between technology adoption and economic efficiency in dairy farming is crucial for the sustainable development of rural economies. While a considerable portion of dairy farmers in Kahramanmaraş Province have embraced modern agricultural technologies, there remains a notable disparity in economic efficiency across different technology adoption levels.
The results found several key factors influencing technology adoption and economic efficiency in dairy farming. Farmers in the high-technology-adoption group demonstrated higher incomes, ownership of cultured breeds, greater investment in farm operations, and higher technical efficiency scores. Recognizing the positive influence of income levels, investment in farm operations, and ownership of cultured breeds on technology adoption, policymakers can design targeted financial support programs and provide training on effective breed management practices. This could encourage more dairy farmers to adopt dairy technologies, thereby enhancing overall farm efficiency and productivity.
Moreover, membership in agricultural organizations and frequent engagement with agricultural professionals and peers were also associated with higher technology adoption levels. Given the association between membership in agricultural organizations and higher technology adoption rates, policymakers can incentivize farmers to join such organizations by offering benefits like access to resources, market information, and agricultural inputs. Strengthening institutional networks can facilitate technology transfer and knowledge dissemination among farmers, ultimately fostering competitiveness and sustainability in the dairy farming sector. Policymakers should prioritize initiatives facilitating knowledge exchange and networking opportunities to promote technology transfer and adoption among dairy farmers. This can be achieved through engagement with private veterinarians and fellow farmers, leveraging existing social networks, and enhancing access to valuable information and resources.
However, despite the widespread adoption of technology, the main challenge facing dairy farms is their low technical and economic efficiency. Technical inefficiency is a primary contributor to low economic efficiency, with disparities in input utilization posing significant challenges for farm productivity. The observed inefficiencies are not solely due to low technology adoption but also reflect shortcomings in input management and resource allocation at the farm level. To improve technical efficiency, policymakers can offer training and support programs to assist farmers in optimizing technology use and improving input management practices. This can be achieved through providing farmer training and extension services. In addition, policymakers should address inefficiencies in input utilization by promoting resource-efficient farming practices and encouraging the adoption of sustainable agricultural techniques. Financial incentives could be provided for sustainable resource management practices, as well as for the adoption of dairy farm technologies. By prioritizing these strategies and fostering collaboration between stakeholders, Turkey’s dairy sector can achieve its full potential and contribute to the long-term prosperity of rural communities.
This study contributes to the existing body of knowledge by providing insights into the relationship between technology adoption and economic performance in dairy farming, thus enriching the academic literature on agricultural economics and technology adoption. The results will guide policymakers, agricultural extension services, and industry stakeholders in promoting sustainable agricultural practices by encouraging the adoption of efficient technologies and innovations.
Although this study provides valuable contributions, there are several limitations. Firstly, the data were collected from a specific geographic area, which limits the generalizability of the findings to other regions or countries. Furthermore, the study primarily focused on socio-economic and behavioral factors, neglecting potential contextual variables that could impact technology adoption and farm efficiency. To improve the robustness of the findings, future research could benefit from including a wider range of variables and conducting comparative studies across different regions. Furthermore, the cross-sectional nature of the data limits the ability to establish causal relationships between technology adoption and farm performance. Longitudinal studies could provide more profound insights into the dynamics of technology adoption over time and its impact on farm efficiency. Furthermore, this study identifies factors linked to higher levels of technology adoption. However, the mechanisms by which these factors influence adoption decisions are unclear. Future research could investigate the motivations and decision-making processes that drive technology adoption among dairy farmers. Continuous monitoring and evaluation of technology adoption trends are essential for informing policy interventions and extension programs aimed at promoting sustainable agricultural development.

Author Contributions

Conceptualization, M.E. and H.B.A.; methodology, M.E. and H.B.A.; software, M.E. and H.B.A.; validation, M.E. and H.B.A.; formal analysis, M.E. and H.B.A.; investigation, M.E.; resources, M.E. and H.B.A.; data curation, M.E. and H.B.A.; writing—original draft preparation, M.E. and H.B.A.; writing—review and editing, M.E. and H.B.A.; visualization, M.E. and H.B.A.; supervision, M.E. and H.B.A. All authors have read and agreed to the published version of the manuscript.

Funding

This research received no external funding.

Institutional Review Board Statement

Not applicable.

Informed Consent Statement

Not applicable.

Data Availability Statement

The data may be obtained upon request from the authors.

Acknowledgments

This study was derived from the data of the first author’s M.Sc. thesis entitled “Factors Affecting the Level of Technology Use in Dairy Cattle Farming: A Case of Kahramanmaraş Province”.

Conflicts of Interest

The authors declare no conflicts of interest.

Appendix A

Technology and Innovations0—No,
1—Yes
Electronic animal recognition system
Automatic milk measurement systems integrated into the milking system (temperature, fat, protein, electrical conductivity, etc.)
Automatic animal weighing system
Automatic individual feeding units
Activity meters—Automatic estrus detection system (pedometer)
Automatic intensive feed units (intensive feed consumption measurement)
Coarse-Dense Feed Mixer with Electronic Scale and Distributors
Feed systems that measure roughage consumption
Drinking systems that measure water consumption
Software for monitoring herd health (Diagnosis of mastitis, metabolic symptoms, foot symptoms, reproductive disorders)
Milking robots
Milking system management (automatic stimulation, pulsator function, machine final milking, automatic cluster removal)
Automatic animal separation and marking (automatic separator door, automatic animal marking system)
Image analysis systems
Ultrasonographic imaging devices
Software for herd management
Tractor
Trailer
Grass mower
Grass crushing machine
Silage machine
Silage transport trolley
Baler
Feed crushing machine
Feed mixing and distributing machine
Feed silo
Camera
Computer for records
Barn ventilation unit
Barn heating unit
Barn spraying system (humidification)
Pressure washer for barn cleaning
Hoof care tools
Milking machine
Milking system
Milk cooling tank
Delivery room
Milking house- milking cow compartment
calving pen
Group calf compartment
Young animal compartment
Sick animal compartment
Ear tag
Bed stall iron set
Feed lock set
Calf bottle
Milk buckets
Animal bedding-plastic
Automatic manure scraper
Solid manure cleaning systems
Liquid manure cleaning systems
Automatic drinker
Double frost-free drinker
Automatic feeder
Animal scratching brush
Waste recycling system
Solar panel in meeting energy needs
Generator
Weigh-in-motion system
Pasture measuring device
Pulse device (Pulsator)
Veterinary services (Animal care and health under veterinary control)
Taking animals to pasture
Silage making and feeding
Making silage from meadow grass
Growing forage crops
Pet insurance
Having advanced animal breeds
Artificial insemination
Embryo transfer for herd breeding
Use of vitamins for animal nutrition
Feeding colostrum to newborns
Vaccination for tuberculosis
Vaccination for Brucella
Vaccination for mad cow disease
Vaccination for anthrax
Vaccination for mastitis
Horn rasping
Lifting excess nipples
Purchase of new animals under veterinary control
Credit use
Barn parasite spraying
Pay attention to hygiene rules while milking
Preparation of ration for feeding under expert supervision
Do you have mixed ration (TMR)?
Do you use UREA in the dairy ration?
Do you use SODA in the dairy ration?
Do you use “YEAST” in your dairy rations?
Do you use “TOXIN BINDER” in your dairy rations?
Considering the pure protein content of feeds
Considering the roughage to concentrate ratio in feeding
Considering the metabolic energy content of feeds

References

  1. FAOSTAT. Food and Agriculture Organization of the United Nations’s Statistical Database. Available online: https://www.fao.org/faostat/en/#home (accessed on 14 December 2023).
  2. TUIK. Turkish Statistical Institute. Available online: https://data.tuik.gov.tr/Kategori/GetKategori?p=tarim-111&dil=2 (accessed on 14 February 2022).
  3. Tagem. Policy Document of Milk Sector. Available online: https://www.tarimorman.gov.tr/TAGEM/Belgeler/yayin/S%C3%BCt%20Sekt%C3%B6r%20Politika%20Belgesi%202018-2022.pdf (accessed on 14 February 2022).
  4. Göncü, S. Sığırcılık; Nobel Kitabevi: Adana, Turkey, 2015; p. 734. [Google Scholar]
  5. Constantin, M.; Sapena, J.; Apetrei, A.; Pătărlăgeanu, S.R. Deliver Smart, Not More! Building Economically Sustainable Competitiveness on the Ground of High Agri-Food Trade Specialization in the EU. Foods 2023, 12, 232. [Google Scholar] [CrossRef] [PubMed]
  6. Heinrichs, A.J.; Heinrichs, B.S.; Cavallini, D.; Fustini, M.; Formigoni, A. Limiting Total Mixed Ration Availability Alters Eating and Rumination Patterns of Lactating Dairy Cows. JDS Commun. 2021, 2, 186–190. [Google Scholar] [CrossRef] [PubMed]
  7. El-Osta, H.S.; Morehart, M.J. Technology Adoption and Its Impact on Production Performance of Dairy Operations. Rev. Agric. Econ. 2000, 22, 477–498. [Google Scholar] [CrossRef]
  8. Singh, A.; Bhakat, C.; Ghosh, M.; Dutta, T. Technologies Used at Advanced Dairy Farms for Optimizing the Performance of Dairy Animals: A Review. Span. J. Agric. Res. 2021, 19, e05R01. [Google Scholar] [CrossRef]
  9. Dudić, B.; Dudić, Z.; Pejanović, R.; Škatarić, G.; Saxunová, D.; Peráček, T. The Rural Policy of Slovakia After Joining the EU. Poljopr. Sumar. 2020, 66, 33–51. [Google Scholar] [CrossRef]
  10. Yalçin, M.; Boz, İ. Information sources of greenhouse growers in Kumluca District. Bahçe 2007, 36, 1–10. [Google Scholar]
  11. Palma-Molina, P.; Hennessy, T.; O’Connor, A.H.; Onakuse, S.; O’Leary, N.; Moran, B.; Shalloo, L. Factors Associated with Intensity of Technology Adoption and with the Adoption of 4 Clusters of Precision Livestock Farming Technologies in Irish Pasture-Based Dairy Systems. J. Dairy Sci. 2023, 106, 2498–2509. [Google Scholar] [CrossRef]
  12. Bizimana, J.-C.; Richardson, J.W. Agricultural Technology Assessment for Smallholder Farms: An Analysis Using a Farm Simulation Model (FARMSIM). Comput. Electron. Agric. 2019, 156, 406–425. [Google Scholar] [CrossRef]
  13. Chavas, J.P.; Nauges, C. Uncertainty, Learning, and Technology Adoption in Agriculture. Appl. Econ. Perspect. Policy 2020, 42, 42–53. [Google Scholar] [CrossRef]
  14. Náglová, Z.; Rudinskaya, T. Factors Influencing Technical Efficiency in the EU Dairy Farms. Agriculture 2021, 11, 1114. [Google Scholar] [CrossRef]
  15. Çiçek, H.; Cevger, Y.; Tandoğan, M. Socio-Economic Factors Affecting the Level of Adoption of Innovations in Dairy Cattle Enterprises. Ank. Üniv. Vet. Fakültesi Derg. 2008, 55, 183–187. [Google Scholar]
  16. Wairimu, E.; Mburu, J.; Ndambi, A.; Gachuiri, C. Factors Affecting Adoption of Technical, Organisational and Institutional Dairy Innovations in Selected Milksheds in Kenya. Agrekon 2022, 61, 324–338. [Google Scholar] [CrossRef]
  17. Cabrera, V.E.; Solís, D.; del Corral, J. Determinants of Technical Efficiency among Dairy Farms in Wisconsin. J. Dairy Sci. 2010, 93, 387–393. [Google Scholar] [CrossRef] [PubMed]
  18. Kavoi, M.; Hoag, D.; Pritchett, J. Measurement of Economic Efficiency for Smallholder Dairy Cattle in the Marginal Zones of Kenya. J. Dev. Agric. Econ. 2010, 2, 122–137. [Google Scholar]
  19. Mareth, T.; Scavarda, L.F.; Thomé, A.M.T.; Cyrino Oliveira, F.L.; Alves, T.W. Analysing the Determinants of Technical Efficiency of Dairy Farms in Brazil. Int. J. Product. Perform. Manag. 2019, 68, 464–481. [Google Scholar] [CrossRef]
  20. Zia, K.; Akram, W. Economic Efficiency and Profitability Analysis of Milk Production in District Sargodha. Appl. Econ. Rev. 2021, 1, 90–125. [Google Scholar] [CrossRef]
  21. Alem, H. The Role of Technical Efficiency Achieving Sustainable Development: A Dynamic Analysis of Norwegian Dairy Farms. Sustainability 2021, 13, 1841. [Google Scholar] [CrossRef]
  22. Kompas, T.; Che, T.N. Technology Choice and Efficiency on Australian Dairy Farms. Aust. J. Agric. Resour. Econ. 2006, 50, 65–83. [Google Scholar] [CrossRef]
  23. Qi, Y.; Han, J.; Shadbolt, N.M.; Zhang, Q. Can the Use of Digital Technology Improve the Cow Milk Productivity in Large Dairy Herds? Evidence from China’s Shandong Province. Front. Sustain. Food Syst. 2022, 6, 1083906. [Google Scholar] [CrossRef]
  24. Borges, J.; Oude Lansink, A.; Emvalomatis, G. Adoption of Innovation in Agriculture: A Critical Review of Economic and Psychological Models. Int. J. Innov. Sustain. Dev. 2019, 13, 36. [Google Scholar] [CrossRef]
  25. Ruzzante, S.; Labarta, R.; Bilton, A. Adoption of Agricultural Technology in the Developing World: A Meta-Analysis of the Empirical Literature. World Dev. 2021, 146, 105599. [Google Scholar] [CrossRef]
  26. Mesa, R.; Pérez, J. Theoretical Framework and Methods for the Analysis of the Adoption-Diffusion of Innovations in Agriculture: A Bibliometric Review. Bol. Asoc. Geógrafos Esp. 2023, 63, 96. [Google Scholar] [CrossRef]
  27. Rogers, E.M. Diffusion of Innovations, 3rd ed.; Free Press: Glencoe, IL, USA; Collier Macmillan: New York, NY, USA; London, UK, 1983; ISBN 978-0-02-926650-2. [Google Scholar]
  28. Feder, G.; Just, R.E.; Zilberman, D. Adoption of Agricultural Innovations in Developing Countries: A Survey. Econ. Dev. Cult. Change 1985, 33, 255–298. [Google Scholar] [CrossRef]
  29. Nowak, P.J. Applicability of an Adoption-Diffusion Model to Resource Conservation a Supporting View. 1982. Available online: https://files.eric.ed.gov/fulltext/ED224667.pdf (accessed on 16 May 2022).
  30. Boz, I.; Akbay, C.; Bas, S.; Bostan Budak, D. Adoption of Innovations and Best Management Practices among Dairy Farmers in the Eastern Mediterranean Region of Turkey. J. Anim. Vet. Adv. 2011, 10, 251–261. [Google Scholar] [CrossRef]
  31. Pannell, D.J.; Marshall, G.R.; Barr, N.; Curtis, A.; Vanclay, F.; Wilkinson, R. Understanding and Promoting Adoption of Conservation Practices by Rural Landholders. Aust. J. Exp. Agric. 2006, 46, 1407–1424. [Google Scholar] [CrossRef]
  32. Mekonnen, H.; Dehninet, G.; Kelay, B. Dairy Technology Adoption in Smallholder Farms in “Dejen” District, Ethiopia. Trop. Anim. Health Prod. 2010, 42, 209–216. [Google Scholar] [CrossRef] [PubMed]
  33. Gargiulo, J.I.; Eastwood, C.R.; Garcia, S.C.; Lyons, N.A. Dairy Farmers with Larger Herd Sizes Adopt More Precision Dairy Technologies. J. Dairy Sci. 2018, 101, 5466–5473. [Google Scholar] [CrossRef]
  34. Abeni, F.; Petrera, F.; Galli, A. A Survey of Italian Dairy Farmers’ Propensity for Precision Livestock Farming Tools. Animals 2019, 9, 202. [Google Scholar] [CrossRef]
  35. Gillespie, J.; Nehring, R.; Sitienei, I. The Adoption of Technologies, Management Practices, and Production Systems in U.S. Milk Production. Agric. Food Econ. 2014, 2, 17. [Google Scholar] [CrossRef]
  36. Dehinenet, G.; Mekonnen, H.; Kidoido, M.; Ashenafi, M.; Bleich, E.G. The Impact of Dairy Technology Adoption on Small Holder Dairy Farmers Livelihoods in Selected Zones of Amhara and Oromiya National Rgional States, Ethiopia. Glob. J. Agric. Econ. Econom. 2014, 2, 126–135. [Google Scholar]
  37. Kosgei, J.K.; Ngeno, E.; Kibett, J.K. Factors Affecting Adoption of Dairy Cattle Milk Production Technologies in Mosop Sub County, Nandi County, Kenya. Afr. J. Agric. Res. 2020, 15, 140–148. [Google Scholar] [CrossRef]
  38. Le, T.Q.A.; Shimamura, Y.; Yamada, H. Information Acquisition and the Adoption of a New Rice Variety towards the Development of Sustainable Agriculture in Rural Villages in Central Vietnam. World Dev. Perspect. 2020, 20, 100262. [Google Scholar] [CrossRef]
  39. Flett, R.; Alpass, F.; Humphries, S.; Massey, C.; Morriss, S.; Long, N. The Technology Acceptance Model and Use of Technology in New Zealand Dairy Farming. Agric. Syst. 2004, 80, 199–211. [Google Scholar] [CrossRef]
  40. Fishbein, M.; Ajzen, I. Belief, Attitude, Intention and Behaviour: An Introduction to Theory and Research; Addison-Wesley Publishing Company: Boston, MA, USA, 1975; p. 600. [Google Scholar]
  41. Davis, F.D. Perceived Usefulness, Perceived Ease of Use, and User Acceptance of Information Technology. MIS Q. 1989, 13, 319–340. [Google Scholar] [CrossRef]
  42. Castiblanco Jimenez, I.A.; Cepeda García, L.C.; Marcolin, F.; Violante, M.G.; Vezzetti, E. Validation of a TAM Extension in Agriculture: Exploring the Determinants of Acceptance of an e-Learning Platform. Appl. Sci. 2021, 11, 4672. [Google Scholar] [CrossRef]
  43. Mir, S.A.; Padma, T. Integrated Technology Acceptance Model for the Evaluation of Agricultural Decision Support Systems. J. Glob. Inf. Technol. Manag. 2020, 23, 138–164. [Google Scholar] [CrossRef]
  44. Venkatesh, V.; Davis, F.D. A Theoretical Extension of the Technology Acceptance Model: Four Longitudinal Field Studies. Manag. Sci. 2000, 46, 186–204. [Google Scholar] [CrossRef]
  45. Naspetti, S.; Mandolesi, S.; Buysse, J.; Latvala, T.; Nicholas, P.; Padel, S.; Van Loo, E.J.; Zanoli, R. Determinants of the Acceptance of Sustainable Production Strategies among Dairy Farmers: Development and Testing of a Modified Technology Acceptance Model. Sustainability 2017, 9, 1805. [Google Scholar] [CrossRef]
  46. Schaak, H.; Mußhoff, O. Understanding the Adoption of Grazing Practices in German Dairy Farming. Agric. Syst. 2018, 165, 230–239. [Google Scholar] [CrossRef]
  47. Gelan, A.; Muriithi, B.W. Measuring and Explaining Technical Efficiency of Dairy Farms: A Case Study of Smallholder Farms in East Africa. Agrekon 2012, 51, 53–74. [Google Scholar] [CrossRef]
  48. Hennessy, T.; Heanue, K. Quantifying the Effect of Discussion Group Membership on Technology Adoption and Farm Profit on Dairy Farms. J. Agric. Educ. Ext. 2012, 18, 41–54. [Google Scholar] [CrossRef]
  49. Farrell, M.J. The Measurement of Productive Efficiency. J. R. Stat. Soc. Ser. Gen. 1957, 120, 253. [Google Scholar] [CrossRef]
  50. Coelli, T.J.; Prasada Rao, D.S.; O’Donnell, C.J.; Battese, G.E. An Introduction to Efficiency and Productivity Analysis; Springer: New York, NY, USA, 2005; p. 349. ISBN 0-387-24265-1. [Google Scholar]
  51. Mareth, T.; Thomé, A.M.T.; Scavarda, L.F.; Cyrino Oliveira, F.L. Technical Efficiency in Dairy Farms: Research Framework, Literature Classification and Research Agenda. Int. J. Product. Perform. Manag. 2017, 66, 380–404. [Google Scholar] [CrossRef]
  52. Parlakay, O.; Semerci, A.; Celik, A. Estimating Technical Efficiency of Dairy Farms in Turkey: A Case Study of Hatay Province. Custos E @Gronegócio Online 2015, 11, 106–115. [Google Scholar]
  53. Moutinho, V.; Madaleno, M.; Macedo, P.; Robaina, M.; Marques, C. Efficiency in the European Agricultural Sector: Environment and Resources. Environ. Sci. Pollut. Res. Int. 2018, 25, 17927–17941. [Google Scholar] [CrossRef] [PubMed]
  54. Silva, E.; Almeida, B.; Marta-Costa, A. Efficiency of the Dairy Farms: A Study from Azores (Portugal). Eur. Countrys. 2018, 10, 725–734. [Google Scholar] [CrossRef]
  55. Jiang, N.; Sharp, B. Cost Efficiency of Dairy Farming in New Zealand: A Stochastic Frontier Analysis. Agric. Resour. Econ. Rev. 2014, 43, 406–418. [Google Scholar] [CrossRef]
  56. Newbold, P. Statistics for Business and Economics, 8th ed.; Pearson Education: Boston, MA, USA; Munich, Germany, 1989; ISBN 978-0-273-76706-0. [Google Scholar]
  57. Uzmay, C.; Kaya, İ.; Tömek, B. Precision dairy herd management applications. J. Anim. Prod. 2010, 51, 50–58. [Google Scholar]
  58. Güzel, M.; Aybek, A. Mechanization Structure of Dairy Cattle Farms in Kahramanmaraş Province. KSU J. Nat. Sci. 2017, 20, 148–159. [Google Scholar]
  59. Borusiewicz, A. Technological Preconditions in Dairy Farms. Agric. Eng. 2017, 21, 59–68. [Google Scholar] [CrossRef]
  60. Quddus, M.A. Adoption of Dairy Farming Technologies by Small Farm Holders: Practices and Constraints. Bangladesh J. Anim. Sci. 2013, 41, 124–135. [Google Scholar] [CrossRef]
  61. Reinemann, D.J. Chapter 10—Milking Machines and Milking Parlors. In Handbook of Farm, Dairy and Food Machinery Engineering, 3rd ed.; Kutz, M., Ed.; Academic Press: Cambridge, MA, USA, 2019; pp. 225–243. ISBN 978-0-12-814803-7. [Google Scholar]
  62. Kiliçtek, S.; Aksoy, A. Evaluation with regards to adoption of innovations of diary milk business managements in Erzurum Province. Türk Tarım Ve Doğa Bilim. Derg. 2019, 6, 424–431. [Google Scholar] [CrossRef]
  63. Gunaseelan, M.; Thilakar, P.; Mathialagan, P.; Serma Saravana Pandian, A. Adoption Level of Improved Dairy Farming Technologies by Peri-Urban Dairy Farmers in Thanjavur District of Tamil Nadu. Int. J. Livest. Res. 2018, 8, 103–111. [Google Scholar] [CrossRef]
  64. Ugochukwu, A.I.; Phillips, P.W.B. Technology Adoption by Agricultural Producers: A Review of the Literature. In From Agriscience to Agribusiness: Theories, Policies and Practices in Technology Transfer and Commercialization; Kalaitzandonakes, N., Carayannis, E.G., Grigoroudis, E., Rozakis, S., Eds.; Innovation, Technology, and Knowledge Management; Springer International Publishing: Cham, Switzerland, 2018; pp. 361–377. ISBN 978-3-319-67958-7. [Google Scholar]
  65. Tosun, H.İ. Profitability and Efficiency Analysis of Dairy Farms in TRC1. Ph.D. Thesis, Ondokuz Mayıs University, Samsun, Turkey, 2021. [Google Scholar]
  66. Bulut, O.D.; Karaman, S.; Çelik Kaysim, Z.; Karadağ Gürsoy, A. Factors Affecting Landowners’ Willingness to Sustain Hiring Foreign Farmworkers: The Case of Banana Producers in Mersin Province, Turkey. Sustainability 2023, 15, 13066. [Google Scholar] [CrossRef]
  67. Chen, C.-K. Using Ordinal Regression Model to Analyze Student Satisfaction Questionnaires. IR Applications, Volume 1, May 26, 2004; Association for Institutional Research: Tallahassee, FL, USA, 2004. [Google Scholar]
  68. Fullerton, A.S. A Conceptual Framework for Ordered Logistic Regression Models. Sociol. Methods Res. 2009, 38, 306–347. [Google Scholar] [CrossRef]
  69. McCullagh, P. Regression Models for Ordinal Data. J. R. Stat. Soc. Ser. B Methodol. 1980, 42, 109–142. [Google Scholar] [CrossRef]
  70. Williams, R. Using the Margins Command to Estimate and Interpret Adjusted Predictions and Marginal Effects. Stata J. 2012, 12, 308–331. [Google Scholar] [CrossRef]
  71. StataCorp LLC. Stata. Version: 14; StataCorp LLC: College Station, TX, USA, 2015. [Google Scholar]
  72. Coelli, T.J. A Guide to DEAP Version 2.1: A Data Envelopment Analysis (Computer) Program; University of New England: Armidale, Australia, 1996; 49p. [Google Scholar]
  73. Behr, A. Production and Efficiency Analysis with R; Springer International Publishing: Cham, Switzerland, 2015; ISBN 978-3-319-20501-4. [Google Scholar]
  74. Fraser, I.; Cordina, D. An Application of Data Envelopment Analysis to Irrigated Dairy Farms in Northern Victoria, Australia. Agric. Syst. 1999, 59, 267–282. [Google Scholar] [CrossRef]
  75. Greene, W. Econometric Analysis, 5th ed.; Prentice-Hall: Upper Saddle River, NJ, USA, 2003; ISBN 978-0-13-066189-0. [Google Scholar]
  76. Miles, J. Tolerance and Variance Inflation Factor. In Wiley StatsRef: Statistics Reference Online; John Wiley & Sons, Ltd.: Hoboken, NJ, USA, 2014; ISBN 978-1-118-44511-2. [Google Scholar]
  77. Gallardo, R.K.; Sauer, J. Adoption of Labor-Saving Technologies in Agriculture. Annu. Rev. Resour. Econ. 2018, 10, 185–206. [Google Scholar] [CrossRef]
  78. Howley, P.; Donoghue, C.O.; Heanue, K. Factors Affecting Farmers’ Adoption of Agricultural Innovations: A Panel Data Analysis of the Use of Artificial Insemination among Dairy Farmers in Ireland. J. Agric. Sci. 2012, 4, p171. [Google Scholar] [CrossRef]
  79. Muca, E.; Buonaiuto, G.; Lamanna, M.; Silvestrelli, S.; Ghiaccio, F.; Federiconi, A.; De Matos Vettori, J.; Colleluori, R.; Fusaro, I.; Raspa, F.; et al. Reaching a Wider Audience: Instagram’s Role in Dairy Cow Nutrition Education and Engagement. Animals 2023, 13, 3503. [Google Scholar] [CrossRef] [PubMed]
  80. Siafakas, S.; Tsiplakou, E.; Kotsarinis, M.; Tsiboukas, K.; Zervas, G. Identification of Efficient Dairy Farms in Greece Based on Home Grown Feedstuffs, Using the Data Envelopment Analysis Method. Livest. Sci. 2019, 222, 14–20. [Google Scholar] [CrossRef]
  81. Khalid, U. Efficiency Analysis and Innovation Adoption among the Dairy Farms of Punjab, Pakistan. Ph.D. Thesis, Ondokuz Mayıs University, Samsun, Turkey, 2022. [Google Scholar]
  82. Dong, F.; Hennessy, D.A.; Jensen, H.H.; Volpe, R.J. Technical Efficiency, Herd Size, and Exit Intentions in U.S. Dairy Farms. Agric. Econ. 2016, 47, 533–545. [Google Scholar] [CrossRef]
Figure 1. Conceptual framework.
Sustainability 16 02989 g001
Table 1. Descriptives of variables used in DEA and Tobit regression.
MeanStd. Deviation
DEA variables
Milk yield (Lt/head/month) 464.70114.80
Roughage feed (kg/head) 14.802.98
Concentrate feed (kg/head) 7.102.99
Roughage price (EUR/kg) 0.140.74
Concentrate price (EUR/kg) 0.360.30
Tobit variablesExpected sign of variables
Experience (years)+24.3510.23
Primary school = 1, others = 00.370.48
Secondary school = 1, others = 00.220.41
* High school and above = 1, others = 0+0.410.49
Household size±4.461.64
Number of milk cow±14.4324.20
Low technology = 00.220.42
Medium technology = 10.590.49
* High technology = 2+0.180.38
* Reference categories.
Table 2. Descriptives of variables used in OLR.
Expected Sign of VariablesVariable NameMeanStd. Dev.
Dependent Variable
Level of technology adoption Adoption
Low = 00.220.42
Medium = 10.590.49
High = 20.180.38
Independent Variables
Age (years)±Age48.499.36
Agricultural experience (years)+Experience24.3510.23
Education+Edu
Primary school = 1, others = 0Edu10.370.48
Secondary school = 1, others = 0Edu20.220.41
* High school and above = 1, others = 0+Edu30.410.49
Income+Income
Low = 1, others = 0Income10.440.48
Medium= 1, others = 0Income20.450.49
* High = 1, others = 0+Income30.110.13
Household size±Hsize4.461.64
Investment in the last 3 years (yes = 1, no = 0)+Investment0.370.48
Owned cultured variety cows (1 = owned, others = 0)+Culture0.720.44
Agricultural chamber membership (member = 1, others = 0)+Acm0.290.45
Contact frequency of a private veterinarian (never = 1, …, several times a week = 5)+Vet2.841.02
Contact frequency of other farmers (never = 1, …, several times a week = 5)+Contact3.350.89
Internet use (never = 1, …, 2–3 h a week = 5)±Internet2.210.90
Perceived ease of use (agree = 1, disagree = 0)+PEU0.500.50
Perceived usefulness (agree = 1, disagree = 0)+PU0.710.45
Technical efficiency score+TE0.600.15
* Reference categories.
Table 3. Factors affecting the technology adoption levels of dairy farms and marginal effects.
ParametersCoefficientsStandard Errorp ValueMarginal Effects
LowMediumHigh
Age0.0010.0310.911−0.00060.00010.0004
Experience0.0100.0300.917−0.00080.00020.0006
Edu1−0.2190.5600.6950.1978−0.0054−0.0143
Edu2−0.4860.5350.3630.0437−0.0119−0.0318
Edu3
Income1−2.324 ***0.8030.0040.2091−0.0577−0.1520
Income2−1.392 **0.7150.0520.1253−0.0342−0.1145
Income3
Hsize−0.238 **0.1250.0550.0214−0.0057−0.0155
Investment2.907 ***0.6570.000−0.26160.07140.1901
Culture1.076 **0.4480.016−0.09680.02640.0704
Acm0.949 **0.4370.030−0.08540.02330.0620
Vet0.485 **0.2080.020−0.04370.01190.0317
Cof0.480 **0.2450.050−0.04320.01180.0314
Internet0.1180.2180.586−0.01070.00290.0077
PEU1.893 ***0.5800.001−0.17040.04650.1238
PU1.325 **0.5840.018−0.11930.03250.0867
TE3.499 **1.3720.011−0.31490.08600.2289
/cut12.990 *2.0890.085
/cut29.524 ***2.3660.000
Log-Likelihood = −96.57; Chi-square = 166.99 (p = 0.000); Nagelkerke R2 = 0.690; significant at * p < 0.10, ** p < 0.05, and *** p < 0.01; Income3 and Edu3 are reference categories.
Table 4. Comparison of some economic variables and efficiency scores based on technology levels.
Adoption Level
LowMediumHigh
MeanS.E.MeanS.E.MeanS.E.
Gross production value (EUR) *6372.41313.8612,157.54896.0371,831.4124,300.15
Feed costs (EUR) *2776.36191.826245.14486.2139,106.9414,786.31
Labor costs (EUR) *1089.2368.321311.7242.541638.45100.38
Veterinary costs (EUR) *424.8136.28813.6878.541887.30228.43
Vitamins, minerals (EUR) *26.974.2751.085.33143.0736.16
Other costs (EUR) *
(Electricity, water, etc.)
122.269.77249.6833.671657.19585.94
Gross margin (EUR) *1932.78318.463485.84471.3127,398.469371.55
Technical efficiency (%) *60.220.02457.830.01371.970.024
Allocative efficiency (%) **81.920.02081.110.01187.100.021
Cost efficiency (%) *65.970.02658.690.01266.680.024
* p < 0.01, ** p < 0.05, S.E: Standard Error
Table 5. Tobit regression results.
VariablesTEAECE
Coef.tCoef.tCoef.t
Experience0.002 **2.410.004 *4.270.003 *2.78
Primary school−0.026−0.91−0.083 *−3.35−0.050 ***−1.72
Secondary school−0.027−0.93−0.033−1.40−0.040−1.43
High school and above
Household size−0.017 *−2.70−0.011 **−2.19−0.021 *−3.45
Number of milk cows0.0061.35−0.005−1.37−0.001−0.32
Low technology−0.103 *−2.84−0.078 **−2.57−0.016−0.47
Medium technology−0.135 *−4.34−0.089 *−3.34−0.097 *−3.17
High technology
LR X237.33 (p = 0.000)31.37 (p = 0.000)31.82 (p = 0.000)
* p < 0.01; ** p < 0.05; *** p < 0.10. High school and above and high technology were the reference categories.
Disclaimer/Publisher’s Note: The statements, opinions and data contained in all publications are solely those of the individual author(s) and contributor(s) and not of MDPI and/or the editor(s). MDPI and/or the editor(s) disclaim responsibility for any injury to people or property resulting from any ideas, methods, instructions or products referred to in the content.

