Review

An Evaluation of Sustainable Power System Resilience in the Face of Severe Weather Conditions and Climate Changes: A Comprehensive Review of Current Advances

by
Swetha Rani Kasimalla
1,
Kuchan Park
1,
Aydin Zaboli
1,
Younggi Hong
1,
Seong Lok Choi
2 and
Junho Hong
1,*
1
Department of Electrical and Computer Engineering, University of Michigan-Dearborn, Dearborn, MI 48128, USA
2
Power Systems Engineering Center, National Renewable Energy Laboratory (NREL), Golden, CO 80401, USA
*
Author to whom correspondence should be addressed.
Sustainability 2024, 16(7), 3047; https://doi.org/10.3390/su16073047
Submission received: 20 February 2024 / Revised: 27 March 2024 / Accepted: 3 April 2024 / Published: 6 April 2024

Abstract

:
Natural disasters pose significant threats to power distribution systems, intensified by the increasing impacts of climate changes. Resilience-enhancement strategies are crucial in mitigating the resulting social and economic damages. Hence, this review paper presents a comprehensive exploration of weather management strategies, augmented by recent advancements in machine learning algorithms, to show a sustainable resilience assessment. By addressing the unique challenges posed by diverse weather conditions, we propose flexible and intelligent solutions to navigate disaster complications effectively. This proposition emphasizes sustainable practices that not only address immediate disaster complications, but also prioritize long-term resilience and adaptability. Furthermore, the focus extends to mitigation strategies and microgrid technologies adapted to distribution systems. Through statistical analysis and mathematical formulations, we highlight the critical role of these advancements in mitigating severe weather conditions and ensuring the system reliability.

1. Introduction

In contemporary power systems, the primary emphasis has traditionally been on ensuring a reliable, affordable, flexible, and efficient electricity supply to consumers. However, this priority has largely overlooked the impacts of severe climate events. In recent times, assessment and improvement techniques for power system resilience have gained considerable traction due to amplified concerns stemming from high-impact low-frequency events. These events are recognized for their rapid and devastating nature, leading to widespread damage across multiple components over expansive regions [1,2]. A survey conducted by the United States Government Accountability Office (GAO) presented findings on the profound impact of climate change on the resilience of the power system in 2021. The released report projected a significant escalation in annual costs incurred by utility customers due to outages. Estimates indicated an increase from approximately USD 55 billion over the period of 2006–2019 to a staggering USD 480 billion during the span of 2080–2099 [3]. Historical data reveal that weather and climate factors predominantly contribute to power outages. Approximately 75 % of these interruptions stem directly from weather events (e.g., lightning, wind, and heavy rain) or indirectly from infrastructure failures due to weather conditions such as overheating and winter storms. Notably, an estimated 80 % of significant power disruptions between 2003 and 2012 were attributed to extreme weather occurrences [2,4,5]. The entirety of the power system infrastructure experiences repercussions from extreme events, with each disaster type significantly impacting specific equipment within the power system. For instance, events such as wildfires directly affect transmission systems, leading to outages due to heightened fault risks. Elevated temperatures escalate the probability of line-to-line faults, while line slaps can cause sparks and drastically reduce the lifespan of power equipment [6]. These scenarios worsen in correlation with the intensity of wildfires [7]. Likewise, following hurricane events, the government allocated USD 3.2 billion for the construction of new poles and feeders and USD 4.7 billion for power plant repairs.
Understanding and forecasting impending disasters, interpreting their potential occurrence, and preparing the power system to withstand the consequences of such high-impact, low-frequency events pose significant challenges. To tackle these issues effectively, it is crucial first to comprehend the concept of resilience and to identify the factors that influence this specific type of resilience [8]. These considerations have initiated a crucial move toward studying the resilience of power systems and formulating strategies to counter the looming threats posed by extreme weather conditions in the future. However, achieving this is not a simple task, as numerous factors come into play in sustaining the resilience of the power system. The term “resilience” refers to the system’s capacity to swiftly return to its inherent characteristics following any form of disturbance or disruption. So, resilience is contingent upon several factors, including the size of the distribution system, the diversity of resources, the network structure, geographical placement, weather conditions, types of loads, geopolitical concerns, and interconnections with other crucial infrastructure [9]. Considering these factors, it is essential to identify, develop, and implement strategies that effectively counteract the impacts of extreme disasters and prolonged power outages on power distribution systems.
In order to achieve a resilient distribution system, it is crucial to address five essential requirements, which include creating metrics to measure resilience effectively, strengthening system design to enhance resilience, upgrading preparedness and mitigation strategies, enhancing system response and recovery capabilities, and analyzing and managing interconnections between elements [10]. The initial requirement involves measuring a metric with which to make decisions and assess the power system network’s vulnerability. This metric is crucial for guiding investment and operational planning. The subsequent requirement focuses on fortifying the system design, which entails reinforcing existing equipment and infrastructure. This reinforcement involves physical alterations to the power system infrastructure to withstand unforeseen hazards. In this case, several methods are employed, including tree pruning, vegetation management, upgrades to segments of transmission and distribution networks, replacing overhead lines with underground cables, and enhancing the redundancy of the distribution network system. The next requirement involves enhancing preparedness and mitigation strategies, encompassing power system forecasting models that improve the capability to evaluate faults, outages, and loads in renewable power systems [11,12]. For instance, emerging energy technologies (e.g., digital twins) create peer-to-peer digital models for structural modifications and data transfer [13]. Another highly efficient restoration strategy during unpredictable events involves MGs, which serve as the foundation of numerous smart grid technologies. Their integration is anticipated to significantly enhance energy resilience and security. In particular, the integration of renewable energy systems enables critical loads to receive uninterrupted power through the establishment of islanding mode during blackout events [14]. This approach guarantees the production of robust, secure, and eco-friendly energy, even in the face of uncertainties. However, attaining the desired performance level necessitates a comprehensive understanding of the diverse uncertainties inherent in their planning, design, and operation. Moreover, recognizing and accounting for the impact of power electronic interfaces, integral components within these systems, is crucial. These interfaces, which are employed in MGs to link different distributed resources to loads via the distribution network, play a pivotal role in influencing resilience metrics [15]. As a result, recent research has put forward various methods to evaluate and improve the resilience of power systems. These methods can be summarized into a standard five-phase analysis for resilience, including defining threats, assessing vulnerabilities in components, analyzing system responses, evaluating baseline resilience, and measuring the impact of strategies to enhance resilience. Yet, variations in assumptions and modeling techniques have resulted in discrepancies in the results and their understanding.
Numerous comprehensive review papers have significantly contributed to the current research, offering an in-depth understanding of severe climatic conditions and their impacts on power distribution systems [16,17,18]. However, much of this literature tends to concentrate on specific problems, proposing limited solutions tailored to those issues. For instance, some studies have exclusively addressed the challenges posed by wildfires, snowstorms, hurricanes, and typhoons, focusing on a singular aspect of these problems. In contrast, this paper presents an expansive review, including a variety of weather-related challenges and their effects on power systems. It not only discusses the broad range of weather conditions and their consequent implications, but also proposes viable solutions for mitigating these challenges. Hence, the main contributions of this paper can be summarized as follows:
  • This review paper thoroughly examines the complexities of climate-related challenges, offering a perspective compared to broader literature reviews. The consequences of diverse weather scenarios were assessed carefully and emphasized tailored measures for each context. By categorizing these measures into short-term and long-term plannings, the crucial relationship between preparedness, timing, and disaster severity is elucidated, thus enhancing understanding of weather management strategies. Distinct from many review papers providing broad overviews, this survey offers insight into the specific planning measures suited for different hazards and time frames.
  • Furthermore, it delved deeply into machine learning (ML) frameworks relevant to various weather scenarios, elucidating associated challenges and simulation tools/software. These frameworks are meticulously examined to identify vulnerable regions, emphasizing specificity. Through a comprehensive review, researchers will discover abundant opportunities for further development and gain insights into the challenges of deploying algorithms under diverse weather conditions.
  • Also, this paper underscores the fundamental role of MGs during major events, stressing their integration with various technologies such as multi-MG formation, vehicle-to-home (V2H), vehicle-to-grid (V2G), and mobile power resources, particularly noteworthy being their role in black start (BS) restoration sequences.
The rest of this paper is organized as follows: Section 2 delves into a comprehensive review of work regarding the influence of extreme weather conditions on power networks, including transmission and distribution networks, as well as the power system infrastructures. Moving to Section 3, it focuses on resilience evaluation methods and tools utilized for quantifying indices and assessing vulnerability stemming from these events within the distribution network. Section 4 is dedicated to discussing approaches and techniques employed to fortify resilience, encompassing pre- and post-disaster scheduling methodologies. Finally, this paper is concluded in Section 5.

2. Literature Survey

Acknowledging the substantial influence of unpredictable weather, recent occurrences underscore the vulnerability of the power infrastructure when faced with natural disasters. North American events alone, such as severe winter storms impacting the Gulf states, Atlantic storms causing damage to power lines, and the combination of winter disturbances and summer wildfires in the Northwest, have starkly revealed the fragility of energy systems [19,20]. These challenges have spurred countries to focus on bolstering the resilience of their power grids. In response, governments around the world, such as the U.S. government, have invested USD 20 billion in federal support, which has increased their investments and accelerated ongoing projects aimed at grid fortification [21]. This section delves into the extensive current and recent research efforts undertaken to address these concerns. Also, it sheds light on the frameworks crafted to improve the resilience of grid systems. Table 1 presents a summary of various frameworks that have been created for scheduling pre- and post-disasters, tailored to different types of weather events. Disaster planning is crucial in distribution systems, as effective preparedness post-disaster enables faster and more efficient deployment of crews and equipment to affected areas [22,23,24].
Arif et al. have introduced a two-stage stochastic mixed-integer linear program. The first stage of this program involves determining the optimal number of depots, crews, and equipment for each site. In the subsequent stage, the assignment of crews for repair work is made. This model aims to minimize the costs associated with depots, crews, and equipment while also reducing delays in restoration times. The effectiveness of this system has been demonstrated using a 123-bus distribution system. General Algebraic Modeling System (GAMS), Pyomo, and IBM CPLEX 12.6 are among the software tools mentioned by the authors. Pyomo serves as a Python-based optimization modeling language and framework, whereas IBM CPLEX 12.6 represents a particular version of the CPLEX optimization solver developed by IBM. These tools are employed to formulate and solve optimization problems, particularly those involving mixed-integer programming, leveraging a high-performance computing system. However, this approach is limited in its ability to address widespread issues due to computational challenges [25].
Recently, Kotikot et al. have devised a geo-spatial framework in response to the impact of Hurricane Maria on the utility companies in Puerto Rico. This framework utilizes a multi-criteria decision analysis (MCDA) approach to strategically place reserve generators, employing 12 distinct criteria. This method can be extended to locate potential sites for additional energy infrastructure (e.g., transformers, mobile stations, and MGs) essential for powering a city during extreme events. However, aspects such as energy supply and demand that are key factors in determining the necessary number of reserve generators, their capacity, and their optimal placement in relation to population centers are out of the scope of this paper [26]. Sun et al. introduced a methodology using Monte Carlo simulation to evaluate the resilience of power distribution systems, specifically assessing the random failure potential of distribution lines during typhoon events. Their framework was crafted and validated using the IEEE 33-bus distribution system. While originally designed for typhoons, the adaptability of this model to diverse extreme weather scenarios remains plausible. Nonetheless, the ongoing discussion pertains to establishing fragility models for distribution lines and other components within the power system, necessitating continued research efforts [27]. For the same typhoon event, Wang et al. developed a framework for distribution grids that is segmented into three parts. Initially, a probabilistic generation model was used for assessing the distribution line vulnerability, followed by a spatio-temporal vulnerability model to quantify typhoon impacts. This laid the foundation for a subsequent phase involving the implementation of a breadth-first search algorithm to isolate the distribution grid and calculate load shedding in the isolated MGs. While the framework’s feasibility was demonstrated using the IEEE 33-bus test system, this framework was executed using MATLAB. The optimization model for the distribution grid considering energy storage during typhoon disasters is formulated as a linear model. To address this problem, the software packages utilized in this study are the YALMIP and CPLEX packages, which are employed to solve the optimization tasks. Regarding challenges, this paper did not specifically investigate the effects of interactions between adjacent lines in the distribution network [28]. Recently, the world was again shaken by another extreme weather event (i.e., wildfires). In response to this, Arab et al. introduced a three lines of defense (3LD) framework aimed at evaluating crucial aspects of defense, including mitigation and preparedness for recovery from such events. However, the considerable challenges of risk modeling arise from profound uncertainty, so it did not encompass the physics of wildfires, as this was beyond its scope [29]. Similarly, Trakas et al. used a stochastic programming approach to assess the dynamic line rating of overhead lines. This method is designed to model the impact of wildfires on transmission line conductors. The suitability of the proposed approach was demonstrated using a modified IEEE 33-bus distribution system. The model was solved using GAMS IDE and the IBM CPLEX solver. The computation time recorded was almost 973 s with a PC equipped with an Intel Core i7 CPU. Nevertheless, it is important to note that this model is limited to constant loads and does not cover dynamic loads [30].
In tackling disaster events, a strategic plan is essential, either to mitigate their impact or to counter them effectively. In this context, Yao et al. have proposed a two-stage planning model, encompassing normal and resilient stages. During the normal stage, planning decisions are made regarding transmission lines, the installation of battery energy storage systems (BESSs), and BS facilities. Upon transitioning to the resilient stage, their focus shifts toward minimizing power generation and load-shedding costs within the power system. This algorithm primarily addresses uncertainties in transmission and outage statuses, utilizing a duality-based column and constraint-generation approach. It includes the allocation of BESSs through sectionalization and determines the start-up sequences of non-black-start (NBS) generators. The proposed model was solved using GUROBI/CPLEX, with examples taken from the IEEE 30-bus and 39-bus systems. However, their model’s scope was limited to the N 1 and N 2 security criteria due to computational constraints, set at a maximum of one hour [31]. The techniques developed for BS operations are currently limited to the transmission level. To broaden their application to the distribution level, the implementation of a dynamic MG becomes essential. Du et al. have suggested a framework aimed at augmenting an MG’s self-healing capability. Their approach involves two stages: first, an automated sectionalization, followed by a flexible reconfiguration. This entire framework underwent validation on a 34-bus system via real-time hardware-in-the-loop (HIL) simulation. Furthermore, the paper has specifically tackled practical operational hurdles, such as optimization problems, the absence of an advanced metering infrastructure, and load modeling. However, it is important to note that fault assessment falls outside the scope of this paper [34,35,36].
The primary objective of a resilient power system network is to ensure a continuous power supply to essential loads, which presents challenges in system restoration. MGs are observed as an effective solution for integrating and coordinating various types of distributed energy resources (DERs) to enhance resilience. In this context, MGs are expected to emerge as the most promising solution due to their numerous benefits (e.g., self-healing, self-protection, and self-control). Moreover, research suggests that these MGs can communicate and operate as networked entities, centrally optimized to improve resilience.
An integration of intelligent systems into these applications can lead to significant advancements in distribution system protection. For instance, Qiu et al. [37] developed a decentralized framework for coordinating networked MGs (NMGs) with a focus on resilience. They proposed a novel multi-agent reinforcement learning (MARL) method to address this challenge. The MARL method includes an efficient credit assignment scheme using the Shapley Q-value technique to enhance resilience, effectively. A case study conducted on modified IEEE 15- and 69-bus distribution networks validated the effectiveness of the proposed MARL method in facilitating coordination among NMGs and achieving a high level of resilience. However, the scalability of this approach presents shortcomings. As the number of agents increases, so does the complexity of managing their power exchanges, local observations, and actions. This leads to the issue of dimensionality, making it impractical to train neural networks effectively. Additionally, the number of interactions between agents grows quadratically in multi-agent systems with the agent count, resulting in non-stationary issues and difficulties in stabilizing policies [37].
The resilience of a distribution network typically centers on restoring power specifically to critical loads rather than ensuring full load capabilities. Luo et al. have introduced a framework aimed at assessing distribution network resilience, with a focus on the critical load’s impact. Their approach involves utilizing the Monte Carlo method to simulate the entire process, validated on the IEEE 33-bus system. The evaluation index for resilience has been established based on the significance and loss of critical loads. Notably, the paper does not delve into the effects of transmission networks during the same event [14].
The advent of MGs has led to increased integration of RESs, including energy storage systems. Consequently, the development of a robust distribution energy resource management system has become imperative. Liu et al. have put forward optimization methods for critical load restoration, which have been validated using the IEEE 37 and 123 node test feeders. However, the uncertainties introduced by RESs present significant challenges. These include making optimal decisions for load restoration and dealing with issues such as voltage and frequency fluctuations, which are major concerns in such applications [32]. As electrochemical energy storage systems evolve, they provide efficient backup sources. However, these sources are typically installed in locations where they offer significant economic benefits. With the advent of mobile energy storage (ES) technologies, these systems can now be relocated to areas requiring additional backup. Kim et al. have developed a two-stage optimization model. In the first stage, the model addresses the initial placement of mobile ES units, while in the second stage, it focuses on rerouting these installed units. This approach facilitates the formation of dynamic MGs, aiming to prevent the anticipated load shedding due to disasters. The simulations were conducted utilizing the Gurobi solver version 7.5, implemented on Julia, running on an Intel Xeon processor clocked at 2.6 GHz. They were performed on a 15-bus radial distribution test system. Nevertheless, the capacity of ES units is restricted, and it is economically impractical to incorporate additional ES units to complete load shedding [33].

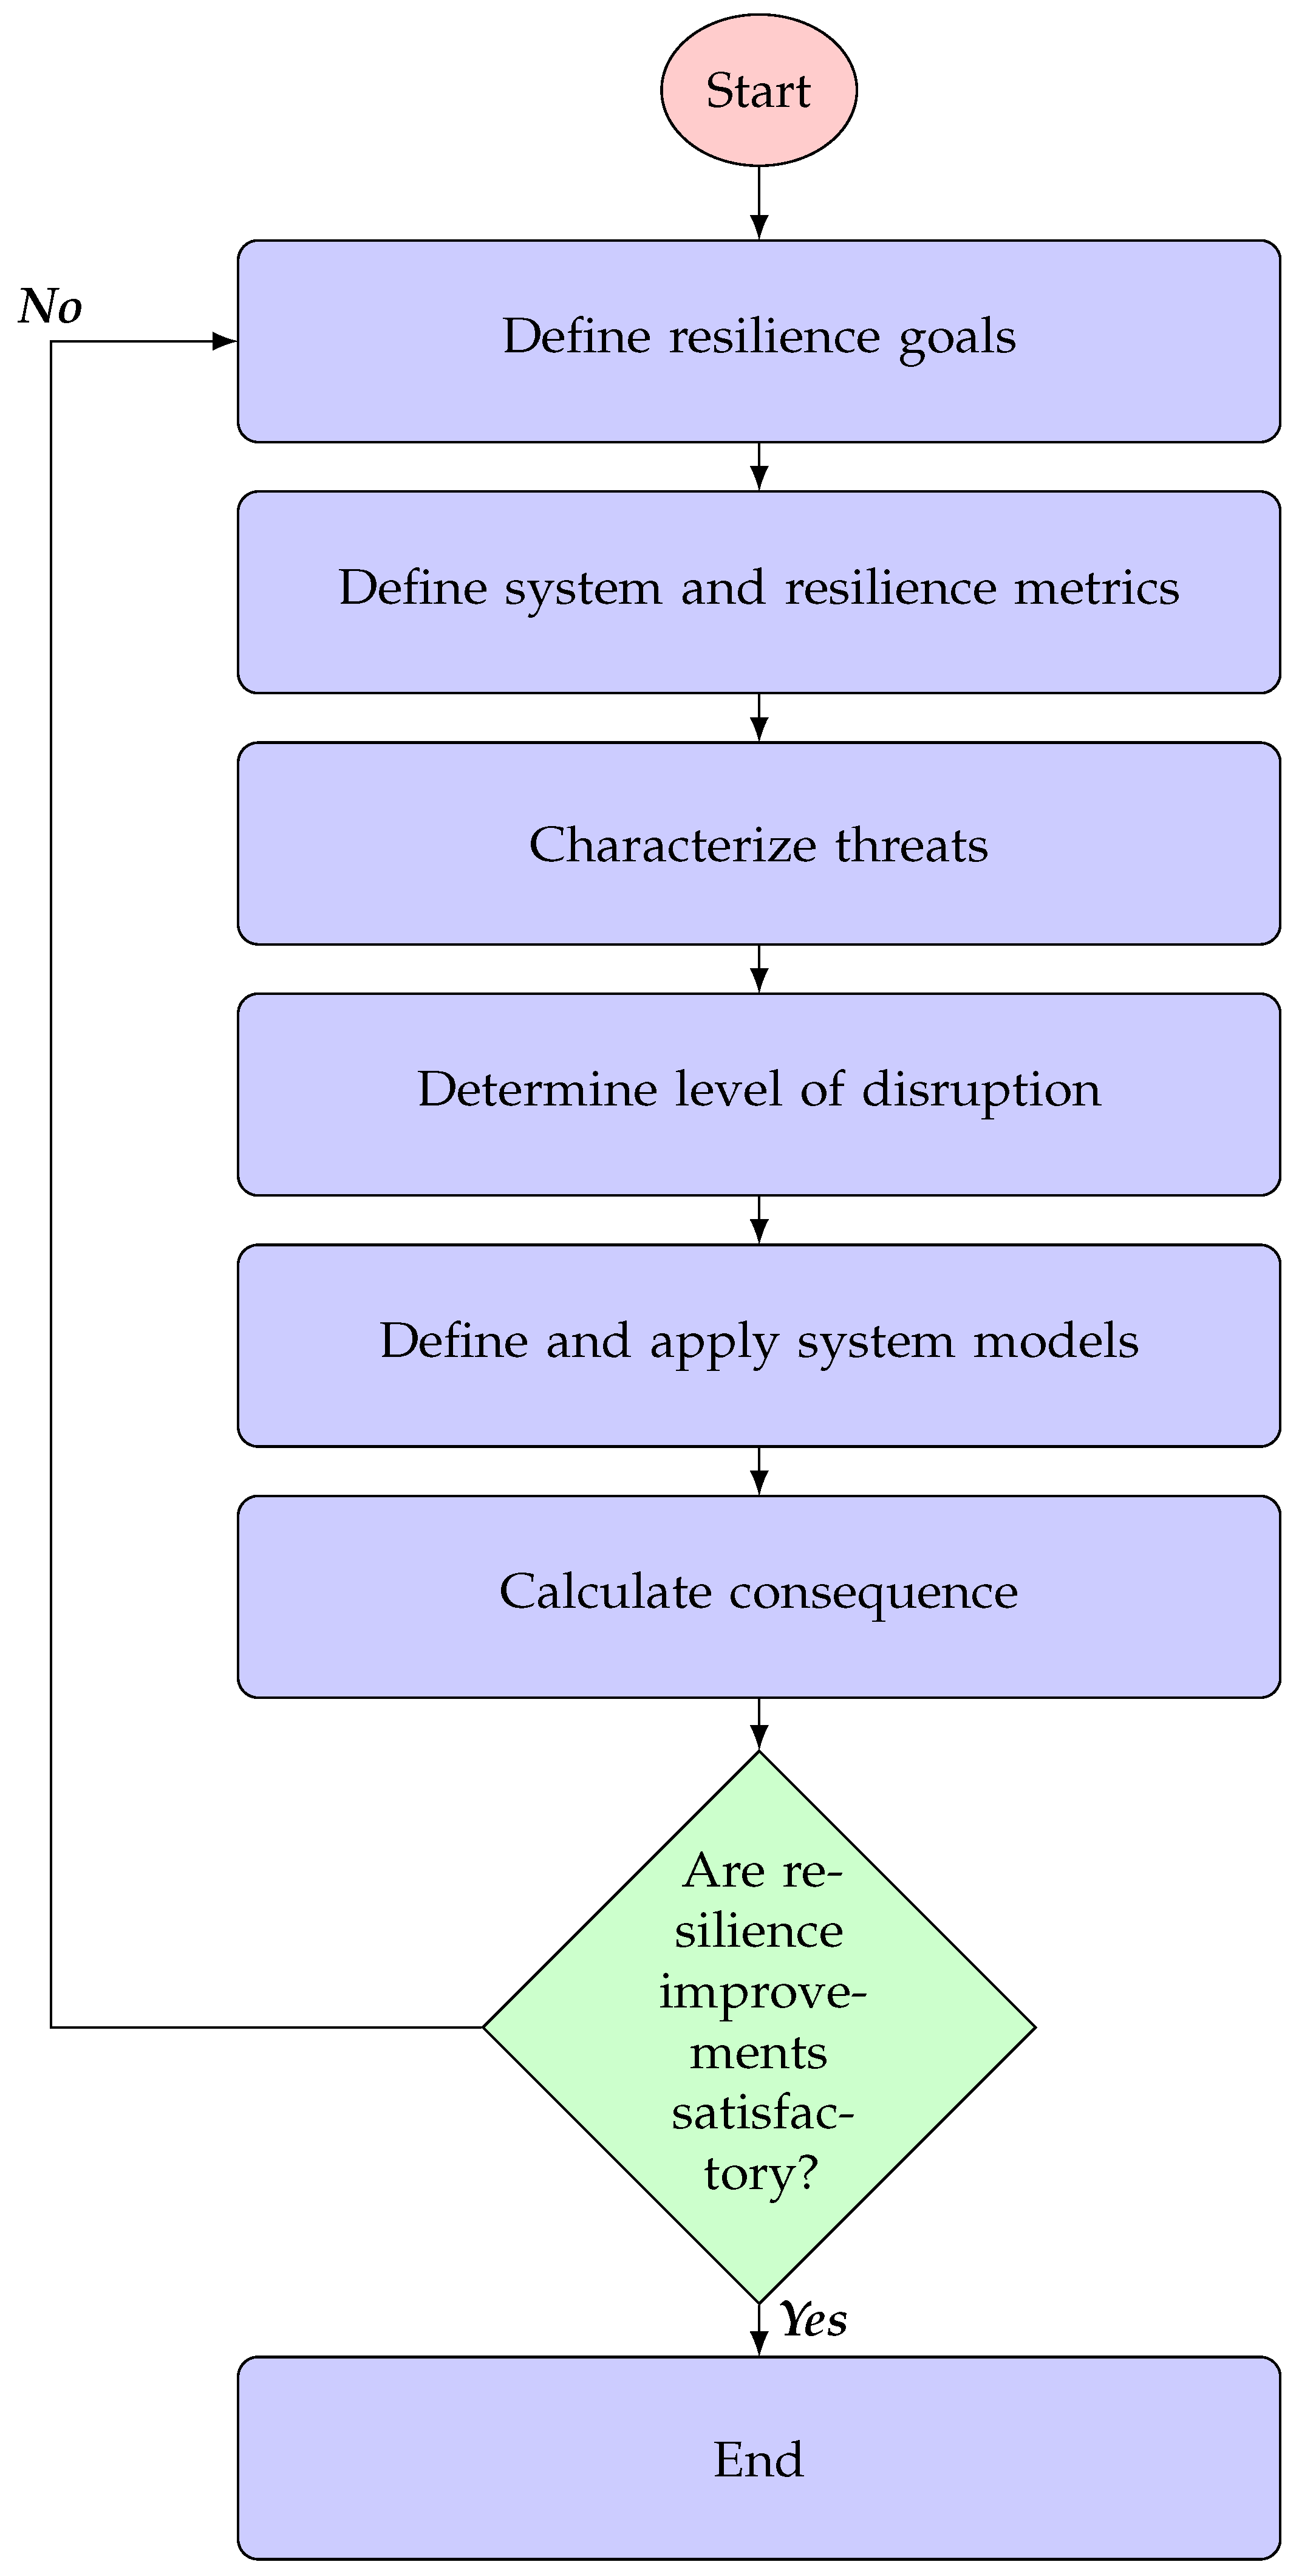
3. Resilience Evaluation Methods

Many researchers have proposed various frameworks to conceptualize the resilience of power systems. A general overview of the sample framework with different steps is illustrated in Figure 1. As can be observed in Figure 1, the process initiates with the definition of resilience goals, which serve as benchmarks for desired outcomes. Subsequently, metrics for both the system and resilience are articulated to provide measurable parameters against which the smart grid’s robustness can be assessed. Then, potential threats to the grid’s integrity are accurately characterized to comprehend the nature and severity of the risks involved. This is followed by an assessment of the anticipated level of disruption each identified threat could impose on the smart grid’s operations. To simulate and analyze the effects of these disruptions, appropriate system models are defined and employed. These models facilitate the calculation of the disruptions’ consequences, offering a quantitative understanding of the impacts in terms of service continuity, financial implications, and other critical factors. At a decisive connection, an evaluation is made to determine if the resilience improvements are satisfactory. Should the improvements align with the predefined resilience goals, the process concludes, affirming the smart grid’s enhanced resilience. Conversely, should the improvements fall short, a recursive loop is initiated, prompting a re-evaluation of the resilience goals and strategies, thereby developing a continuous improvement cycle in the smart grid’s resiliency framework.
Figure 2 shows the key resilience features that a power system must have to effectively respond to events (e.g., natural disasters) that affect the entire system [38].
Before an event occurs, the power system must have sufficient resilience ( R 0 ) to cope with extreme situations. After an event occurs, the entire system naturally degrades and becomes less resilient ( R D E ). Resourcefulness, redundancy, and adaptive self-organization are the main resilience functions required at this stage. These minimize the impact of disasters and the degradation of resilience ( R 0 R D E ) before restoration procedures begin at T R S . Then, the system enters a restoration state and requires restoration capabilities to recover as quickly as possible. When restoration is completed, the system will be in a post-restoration state. The resilience R R E reached at this stage may be higher or lower than the original resilience level R 0 , but is usually lower than R 0 . This is because, although the system can be considered recovered from the operational state perspective, R R E , from the perspective of the entire infrastructure, R 0 has not yet achieved the pre-event level of resilience. In other words, the time for the entire infrastructure to recover to R 0 normally takes longer than the time to restore it to R R E in the worst resilience state (i.e., T R E T R S < T I R E T R E ). However, this may vary depending on the severity of the event and the resilience capabilities of the power system before, during, and after the event. To recapitulate, to evaluate the system resilience, which is defined as a multi-dimensional concept, the resilience level of the power system ( R 0 , R R E , R D E ) and the transition time ( T D E T E S , T R E T R S , T I R E T I R S ) should be considered.
In order to use appropriate resilience indicators, it is necessary to consider what resilience indicators can be utilized. Many researchers have used a variety of different metrics to provide these indicators of the resilience process. According to [39], the resilience of a power system is defined as the ability to prepare for and adapt to changing conditions and withstand and recover rapidly from disruptions. This definition is based on Presidential Policy Directive 21 (PPD21) and consists of four components, including withstanding capability, recovery speed, preparation and planning capacity, and adaptation capability. The authors explain the resilience formulation as follows:
R B = t = 1 N T U , t N T = t = 1 N T U , t t = 1 N ( T U , t + T D , t ) ,
where R B denotes power supply base resiliency for N loads, T is the period of time under consideration, T U , t is a part of T when a load i is able to receive electric power, and T D , t is the remaining portion of T when load i may not be able to receive electric power. Based on [40], four indicators were used to measure grid resilience, including vulnerability, survivability, and recovery: K, LOLP, EDNS, and G. In detail, the first index K measures the number of lines that may experience an outage due to an event. The second index is the loss of load probability (LOLP), which refers to the probability that the load is not fully supplied. The third index, expected demand not served (EDNS), measures expected demand that cannot be supplied. The last indicator, G, represents the grid recovery index. This index is composed of five elements, including the severity of extreme events ( η 1 ), severity of power infrastructure damage ( η 2 ), severity of transportation infrastructure damage ( η 3 ), severity of cyber infrastructure damage ( η 4 ), and unavailability level of human and material resources ( η 5 ).
f = P d ( k V )
K = 0 k f ( k ) d k
L O L P = e i S e P e i
E D N S = e i S e P e i C e i
G = t = 1 5 ω i η i ,
where f means the fragility distribution, k is the number of lines with outage, V refers to the severity level of extreme events, P d is the probability of k line outages in V, e i denotes the ith extreme event, P e i represents the probability of the power grid experiencing e i , S e means the set of extreme events in which the system load exceeds the available generating capacity, C e i is the load interruption in e i , and ω i and η i are the weight and value of the ith factor contributing to the recovery index.
Mathaios et al. defined resilience by dividing it into three stages (i.e., disturbance progress, post-disturbance degradation, and restoration) [41]. Based on these three steps, the following five types of indicators are used:
Φ = R p d o R 0 o t e e t o e
Λ = R 0 o R p d o
E = t o r t e e
Π = R 0 o R p d o T o r t o r
A r e a = t o e T o r R o p ( t ) d t ,
where Φ indicates how quickly the resilience decreases during the disturbance progress stage and Λ indicates how slowly it decreases. E is an indicator of how extensively the second stage, which is the post-disturbance, degraded. Π is how quickly the entire system returns to resilience before the event occurs. Phase 1 (disturbance progress) is the stage between time t o e and t e e . Phase 2 (post-disturbance degraded) represents t o r from time t e e , and phase 3 (restorative) means the time period from t o r to T o r . R 0 o is the pre-disturbance resilience, and R p d o means the post-disturbance operational resilience. A r e a is the integral value of the resilience curve for phases 1, 2, and 3 used in this study. Also, R o p ( t ) represents the resilience curve value.
Sayonsom et al. defined the resilience evaluation method using the code-based metric and power system reliability as follows [42]:
m = c ( α + e f ) ( 1 + f ) ,
where α is the duration of the event, m is the non-scaled value of the resilience, c is a binary variable indicating whether the event occurred in the considered time frame, and f represents the percentage of load that is not affected by the event. As mentioned in the literature, resilience assessment methods vary from study to study. Therefore, it is important to apply an appropriate model to each system.

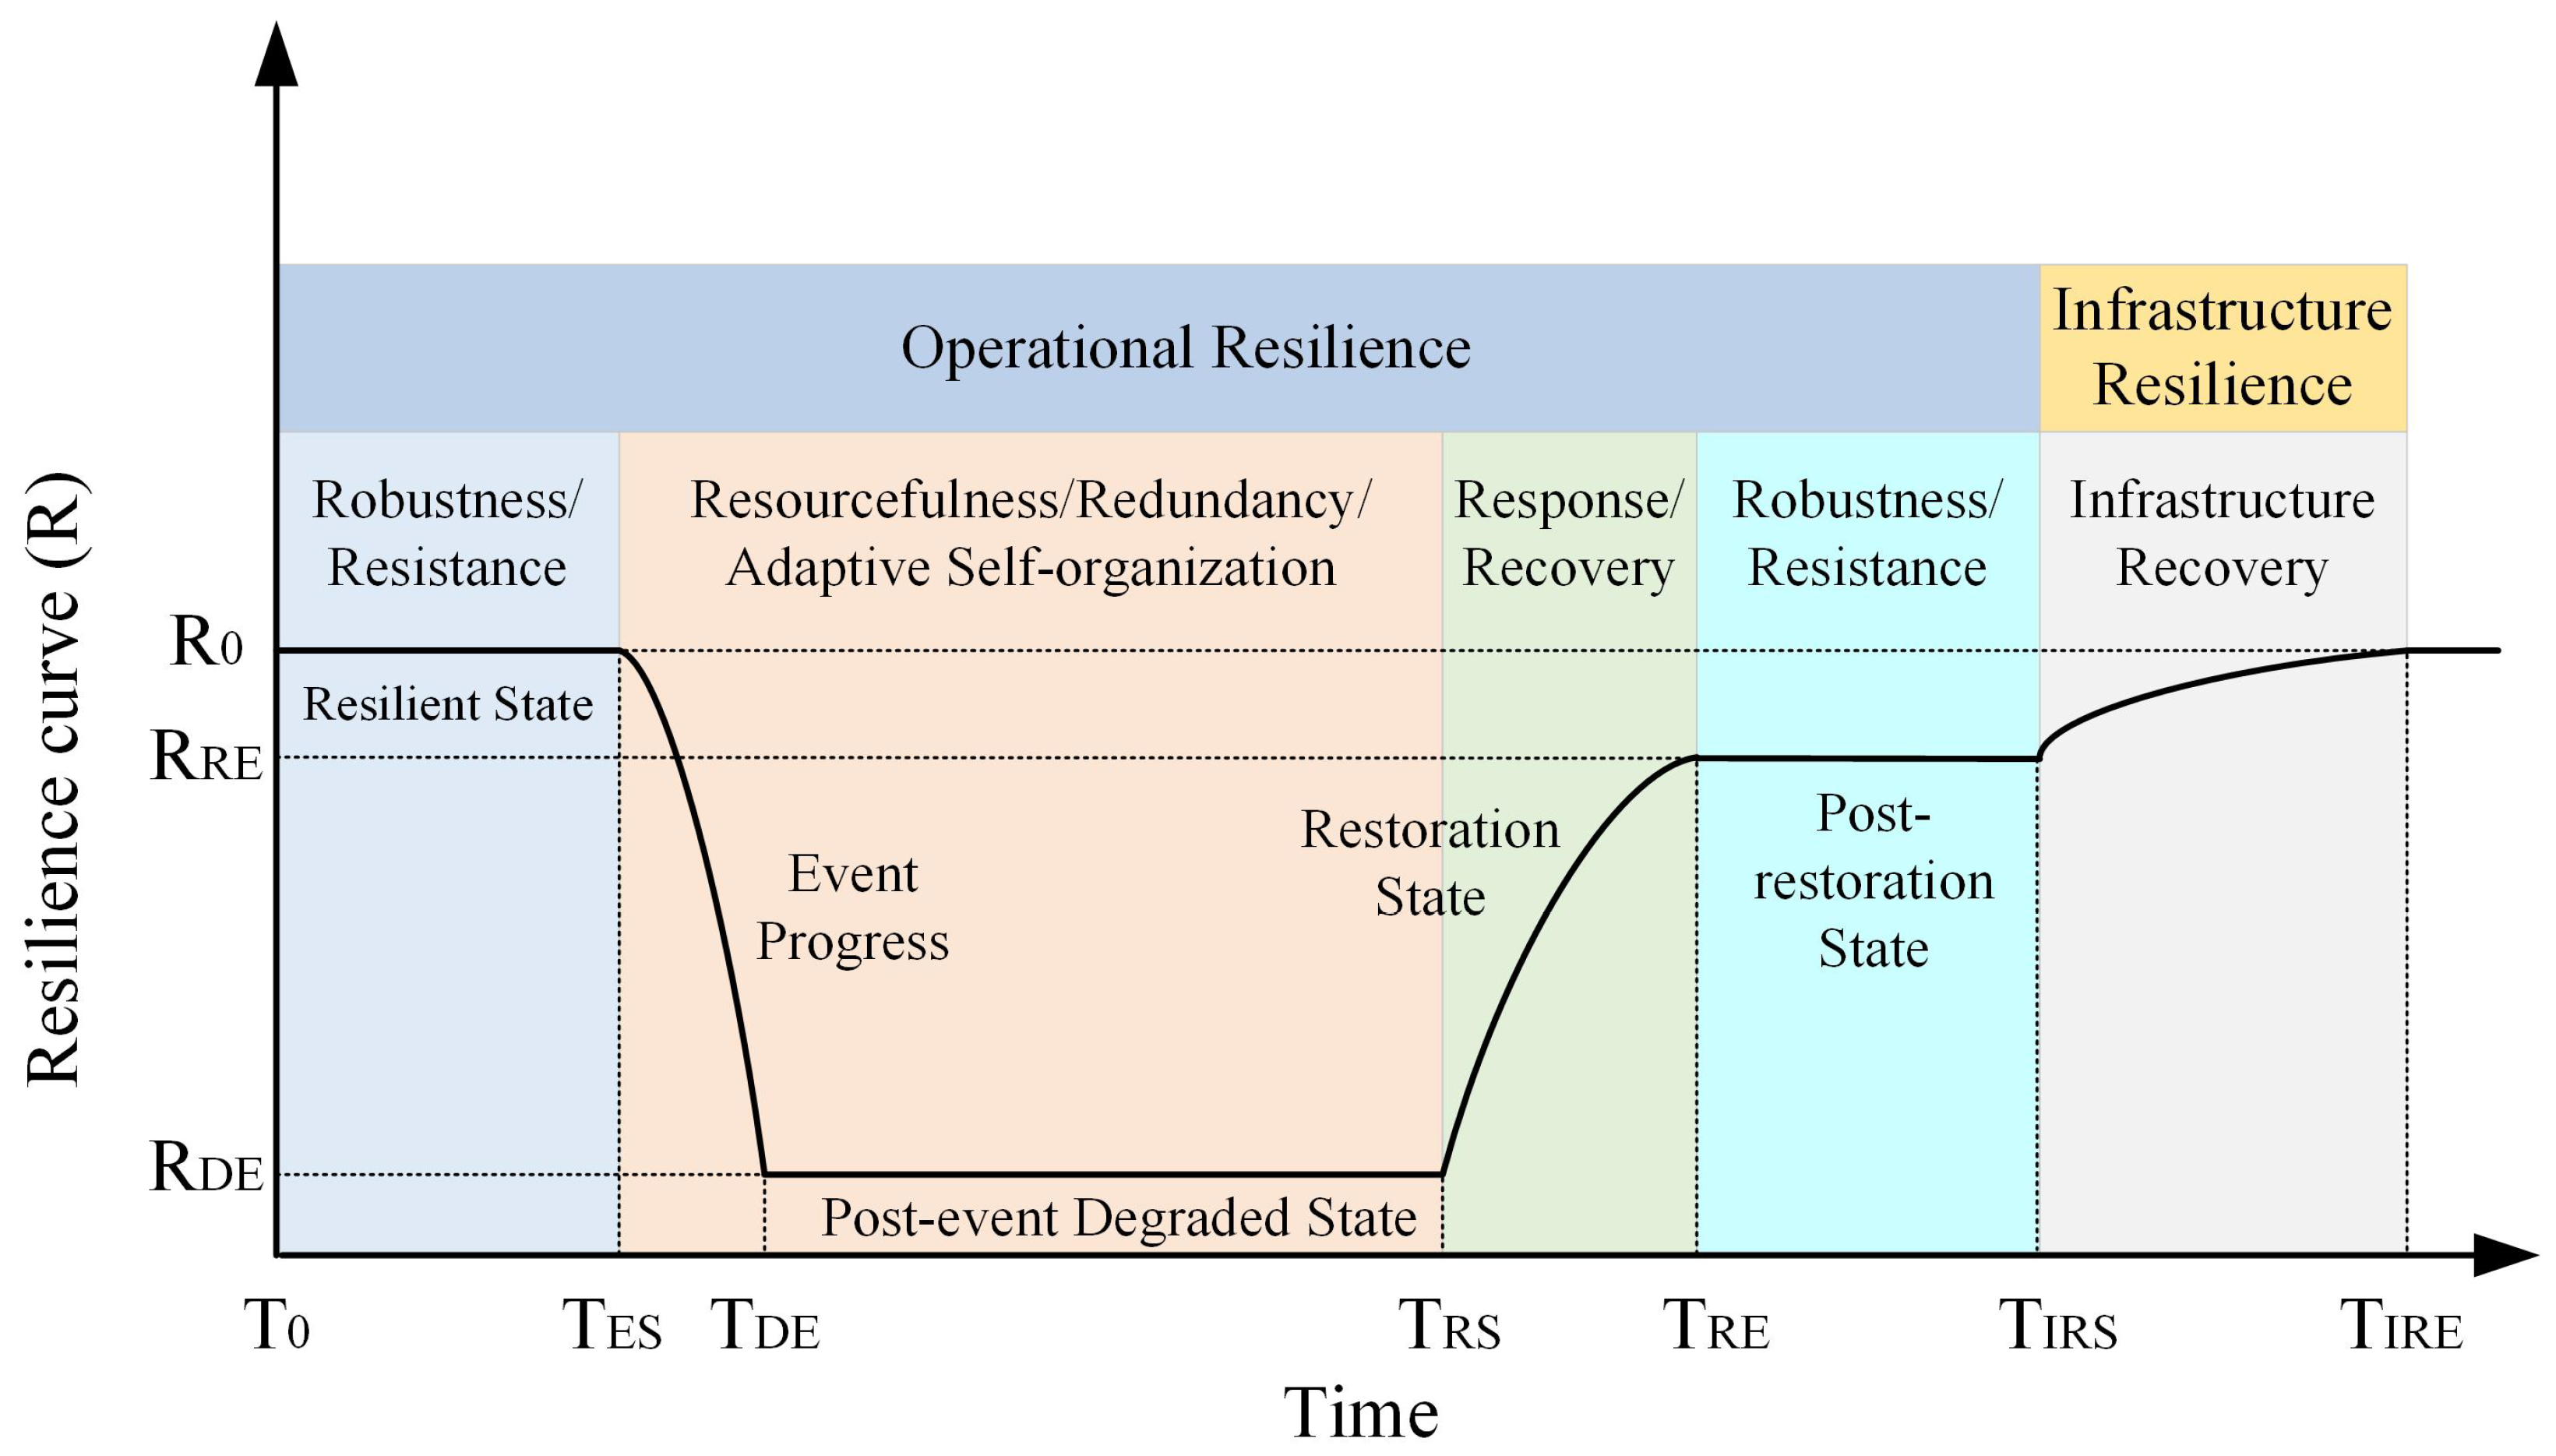
4. Enhancing Resilience: Methods and Strategies

The global community is actively seeking better methods to improve the resilience of power system infrastructures to disasters, acknowledging the major impact of extreme events on lives, property, and the economy. Through a comprehensive analysis of resilience and the quantification of relevant metrics, various strategies have been developed, taking into account constraints such as budgets, resources, and time. This has resulted in the classification of planning into long-term and short-term categories, further delineated into hardening and operational approaches, contributing to the evolution of larger and smarter power systems [38]. Enhancing resilience goes beyond achieving the fastest system recovery; it involves fortifying the system in four distinct aspects, including robustness, resourcefulness, rapid recovery, and adaptability [1,43,44]. The planning and preparedness for a power system are devised with these considerations in mind. Each aspect plays a specific role in operation, as follows:
  • Robustness/resistance: involves sustaining operations, remaining standing during disasters, or enduring low-probability, high-consequence events.
  • Resourcefulness: encompasses effectively managing a disaster as it unfolds by identifying options, prioritizing control measures, and mitigating damage.
  • Rapid recovery: aims to restore normalcy quickly after a disaster through contingency plans and emergency operations.
  • Adaptability: involves learning from catastrophes and introducing new tools and technologies to enhance robustness, resourcefulness, and recovery before the occurrence of the next crisis.
The definitions of resilience emphasize its temporal aspect, distinguishing between short-term and long-term resilience. In the context of power systems, the representation of short- and long-term resilience is demonstrated in Figure 3 through the progression of a blackout. In normal conditions, that is during the power system’s initial state, the system exhibits high resilience due to the fulfillment of all pre-conditions and sufficient security margins. This ensures it can tolerate sudden electrical outages effectively. However, as the system transits to the next state, its robustness decreases and security margins may become insufficient. In this phase, operators must quickly utilize available assets and resources to implement preventive measures and restore the system to a normal state. If a disturbance occurs before these actions are taken, the system may enter an emergency state, depending on the severity of the disruption, known as high-speed cascade, often triggered by severe weather events causing multiple component outages simultaneously. In such scenarios, the system’s resilience reduces further, making it more susceptible to additional outages. Resourcefulness and redundancy become crucial resilience factors during blackouts, facilitating effective response and recovery efforts. A post-disturbance evaluation of causes and impacts is essential for incorporating lessons learned into contingency and risk studies, thus enhancing the system’s short-term resilience against future natural disasters. This forms the basis for long-term resilience planning.

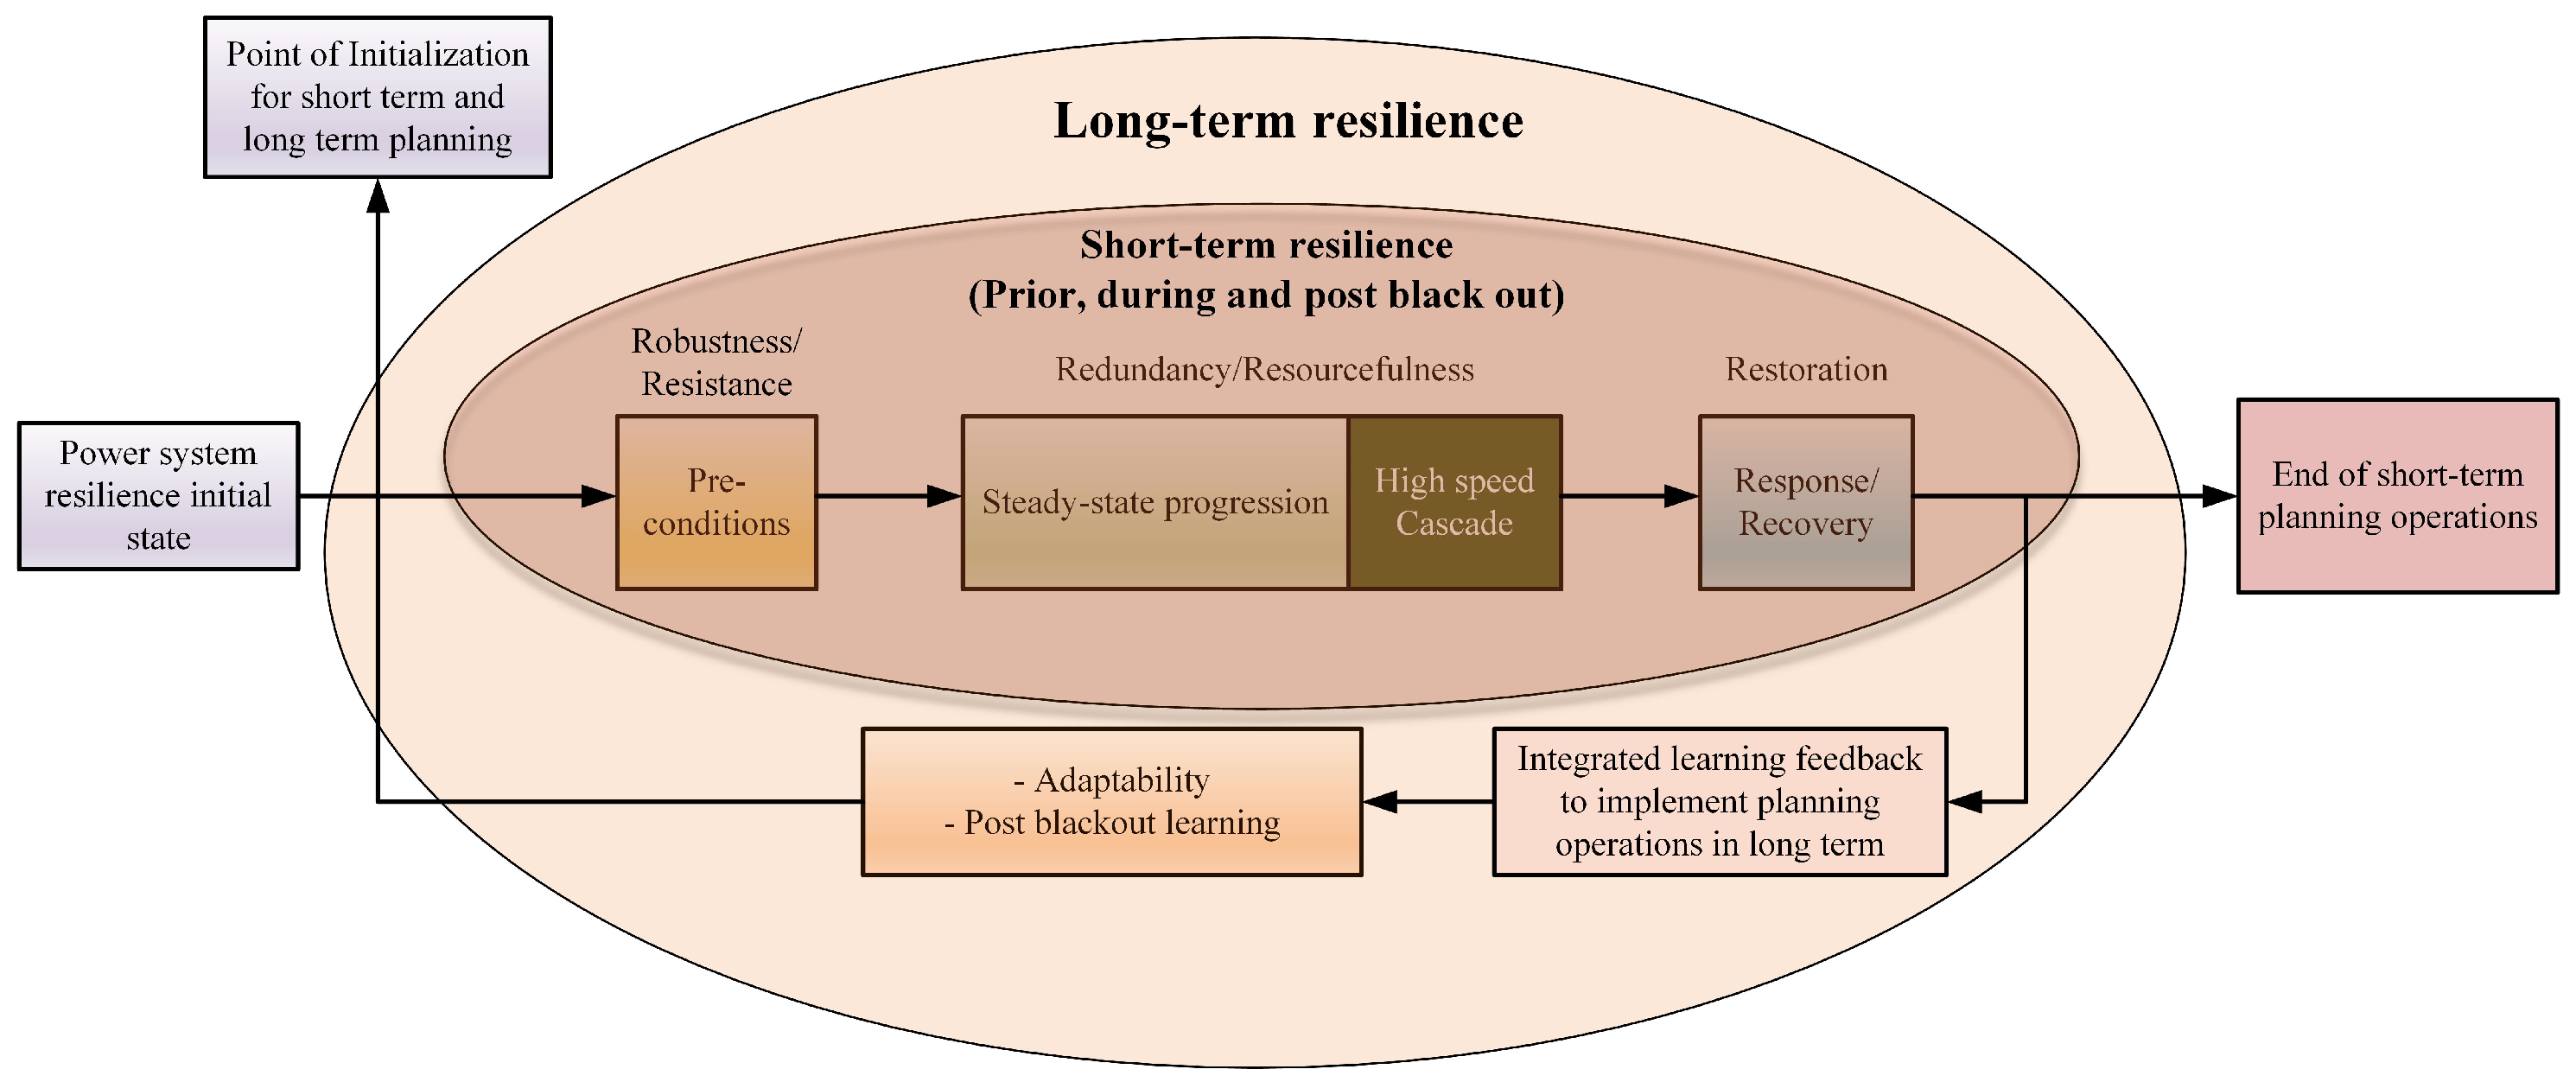
4.1. Short-Term Resilience Planning

Short-term resilience pertains to the essential features required before (preconditions such as load demand and weather conditions), during (cascade events), and after (restoration) an event in an electrical network [45,46]. This includes robustness and resistance, resourcefulness and redundancy, and recovery mechanisms as well. They have the capability to reduce generation and power flows in the highly impacted regions, thereby mitigating post-disturbance line overloading. Additionally, efficient dispatch and pre-positioning of repair and recovery crews would facilitate the fast restoration of damaged components. The presence of backup components and materials also allows for the prompt replacement of power system components affected by weather conditions.
Some of the short-term planning activities before a disaster can include precisely assessing the weather location and intensity; anticipating and positioning the number of repair and recovery crews post-weather event; sustaining supplies of backup components and materials, including transmission towers; collaboration with neighboring networks; and conventional preventive measures (e.g., configuring the system in a resilient state, planning for reserves, verification of BS capabilities, and implementing intelligent solutions such as demand-side management).
Similarly, some of the strategies implemented during the fault occurrence are the verification of communication functionality; collaboration with repair and recovery crews; and conventional corrective measures, including generation re-dispatch, substation reconfiguration, capacitor switching, automated protection and control actions, load and generation rejection, and system separation. Subsequently, some of the measures post-disaster include the evaluation of the disaster and prioritization, restoration of damaged components (e.g., poles and towers), and conventional restoration actions, such as re-energizing transmission lines, restarting units, and restoring loads.

4.2. Long-Term Resilience Planning

Various environmental factors pose risks to overhead power lines, requiring careful consideration and remedial measures. Take, for instance, the potential flashover faults caused by trees growing untrimmed beneath overhead lines on hot days. To address this, rigorous tree management near these lines becomes crucial, although utility companies face limitations in tree-cutting rights. Notably, vegetation management constitutes a significant portion of the maintenance budget for many U.S. utilities. Similarly, heavy snow and ice accumulation during freezing conditions pose a threat to overhead lines, towers, or poles. The weight of ice and snow can lead to flashover faults, which can be mitigated by employing suitably designed insulators. Considering lightning strikes, ionized gases produced during strikes can cause flashover faults. Their protective measures involve adding an earth wire above live conductors or enhancing earthing systems on towers or wooden poles. The cost implications of such measures need to be factored in. In the case of very heavy rain, occasional flashover faults across insulators may occur. Modifying insulator designs can reduce this risk. However, during severe rain leading to flooding and landslides, strategic installation placement becomes crucial to avoid vulnerable areas. Conversely, in drought conditions, the drying of vegetation increases the risk of fires near overhead lines. Attention to vegetation control is essential to mitigating fire-related damages. Summarizing these impacts and remedial measures, Table 2 provides a concise overview.

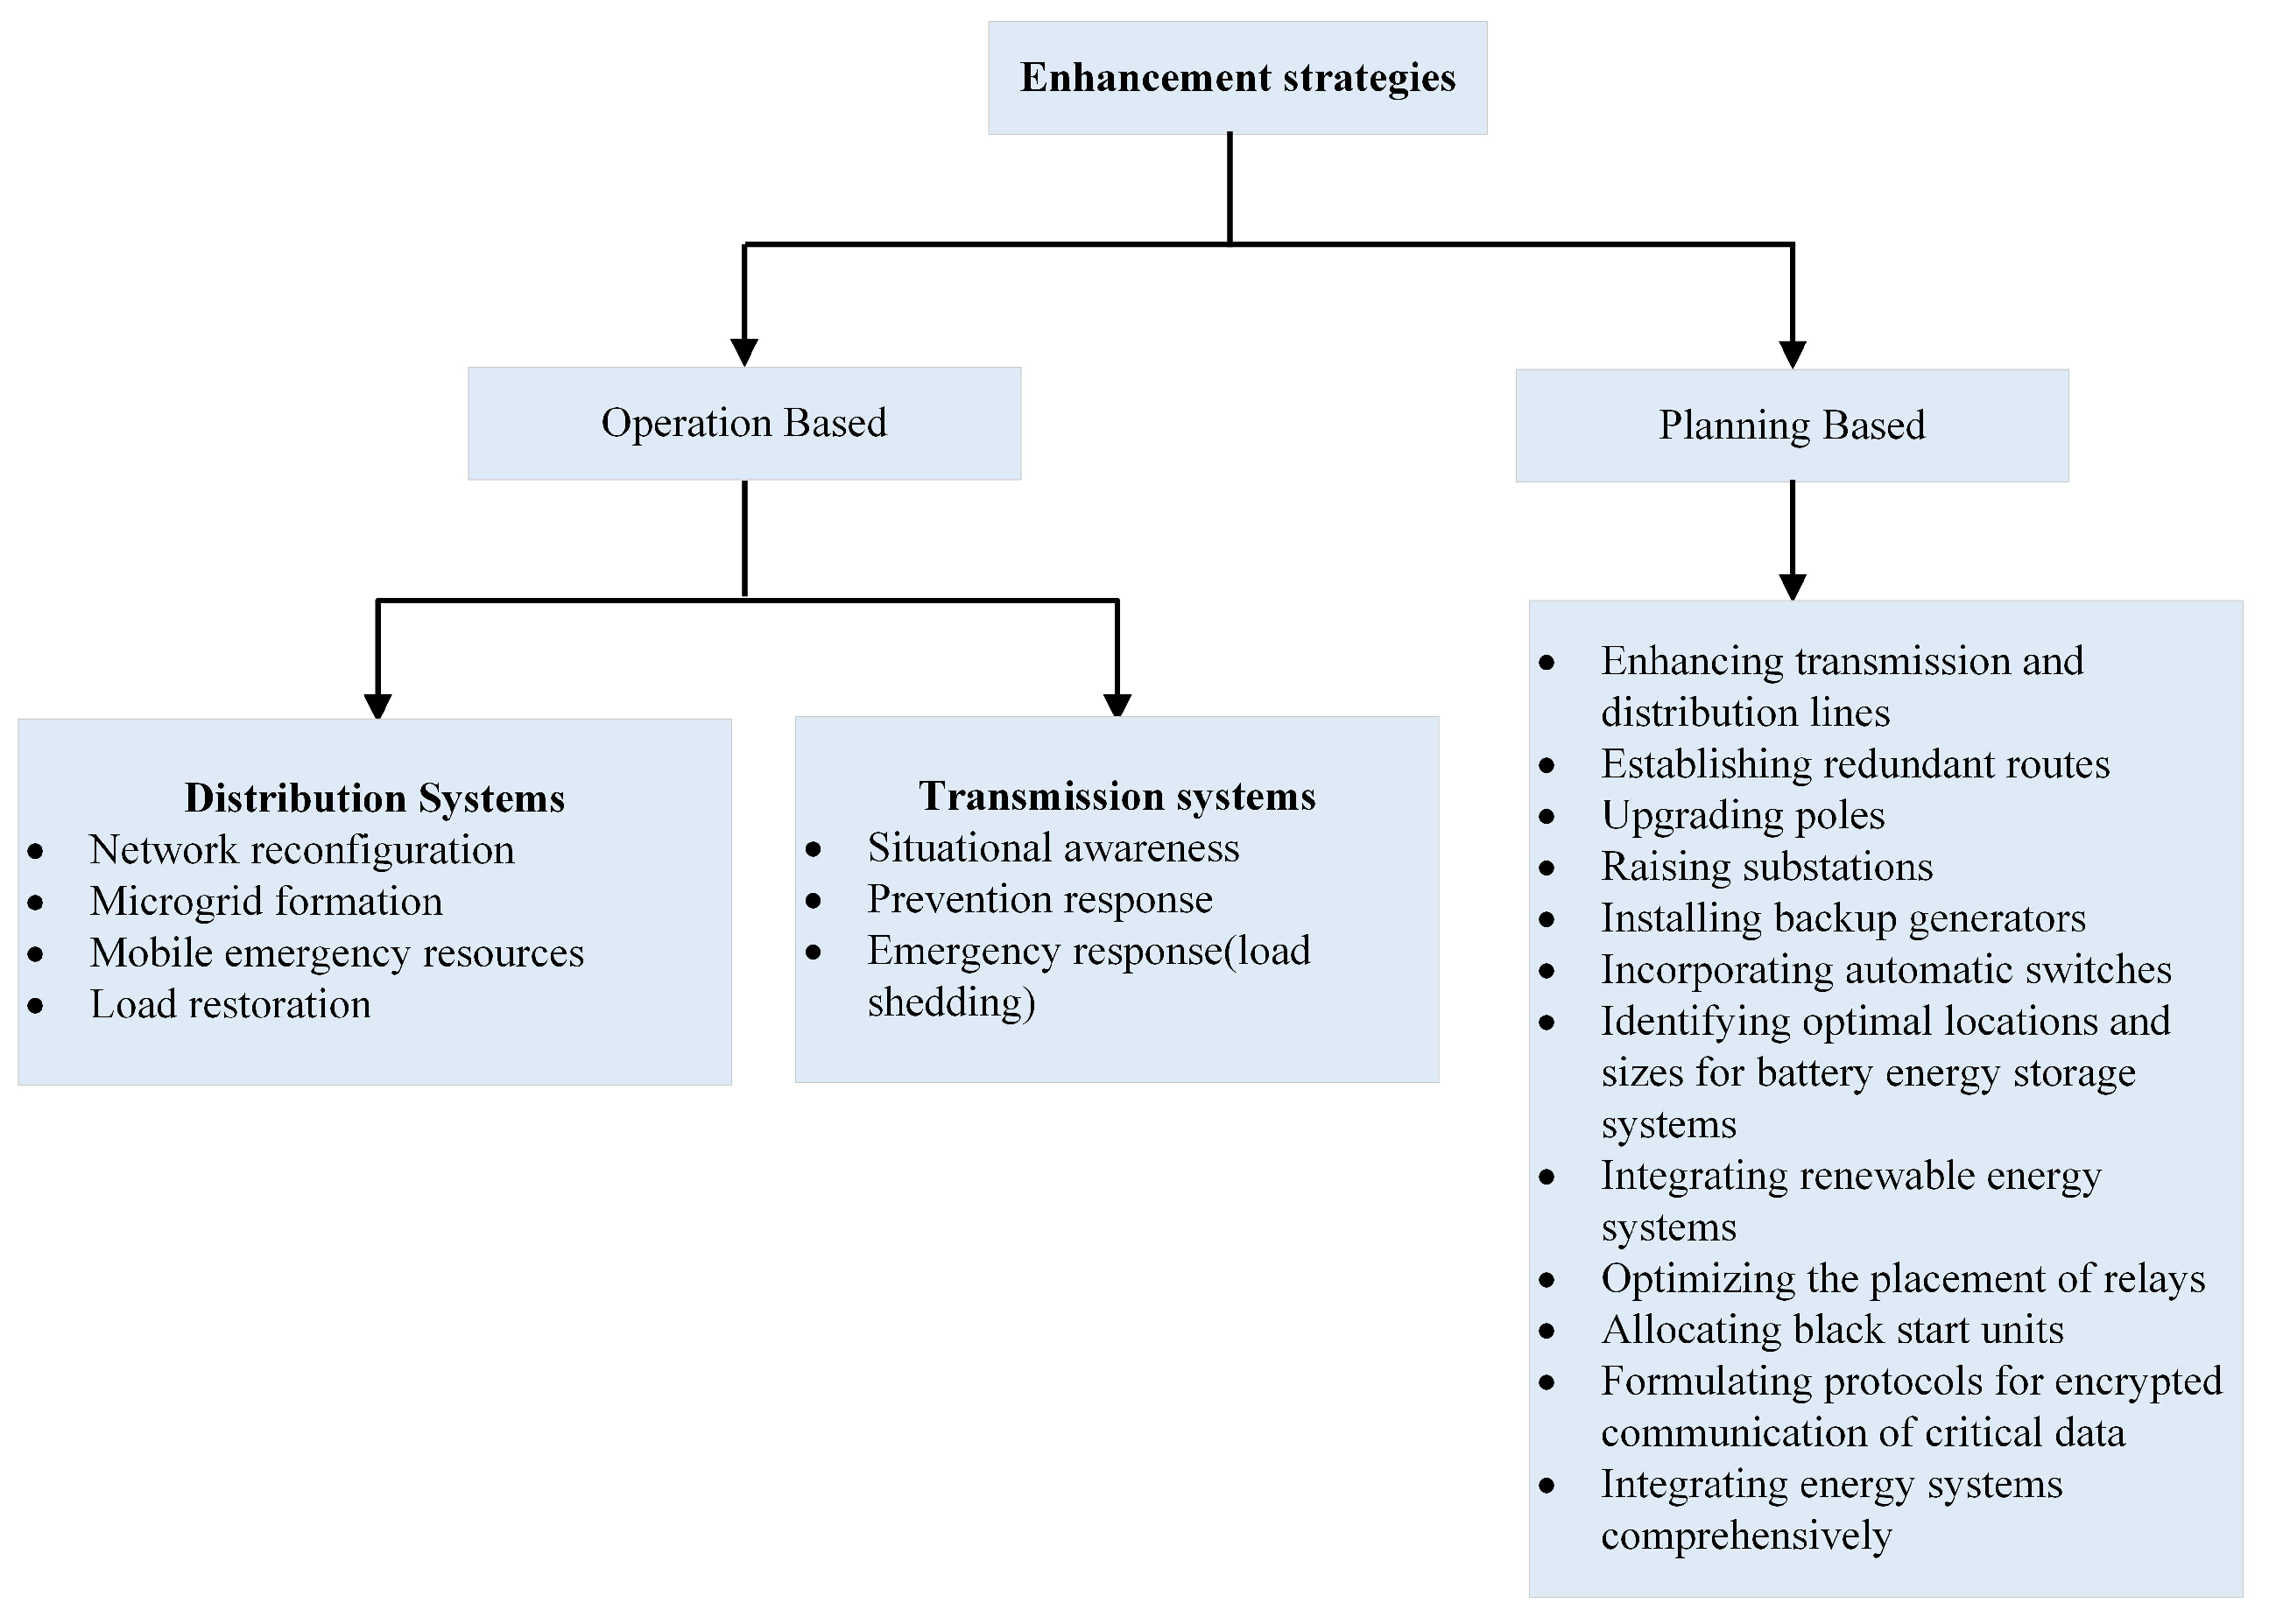
4.3. Operational-Based vs. Planning-Based Restoration Strategies

The power system infrastructure is highly susceptible to extreme weather conditions. The transmission and distribution networks, being the primary components of this infrastructure, are impacted in varying ways. Consequently, different measures need to be taken into account. Figure 4 outlines the remedial actions implemented for segmented transmission and distribution networks, encompassing both hardening and operational measures.
Strategies rooted in planning also contribute to long-term resilience planning. These strategies encompass actions such as elevating substations, strategically placing energy storage units and RESs, upgrading poles, and replacing overhead transmission lines with underground cables. These activities should be undertaken with a comprehensive understanding of post-disaster events [54]. They are collectively referred to as long-term adaptation planning, aimed at mitigating or preventing the impact of disasters in future events.

4.4. Microgrid-Based Restoration Strategies

Smart grid technologies rely significantly on MGs, serving as a fundamental element expected to enhance energy resiliency and security. A crucial aspect for attaining optimal performance involves a comprehensive understanding of uncertainties inherent in the planning, design, and operation of MGs [35,55,56]. Additionally, it is imperative to recognize factors in the impact of power electronic interfaces, which serve as vital components in the system. These circuits play a pivotal role in connecting distributed resources to loads through the distribution network within MGs, thereby influencing metrics related to resiliency.
Figure 5 depicts the functionality of an MG, where renewable energy systems seamlessly integrate with transmission and distribution networks. The switch signifies the interconnection point. In the event of external forces or emergency outages, the re-closers in the distribution networks operate to isolate loads from the main grid system. These loads are then linked to nearby battery storage units or blackout units, facilitated by grid-forming inverters [31,57]. This operating mode is known as islanding mode [58]. Subsequently, when the main grid system is restored, the loads are reconnected to the grid with the assistance of grid-following inverters [59,60].
Therefore, according to the U.S. Department of Energy (DOE), an MG consists of a network of interconnected loads and DERs within clearly defined electrical boundaries. It functions as a unified and controllable entity in relation to the main grid. An MG has the capability to connect to or disconnect from the main grid, allowing it to operate in either grid-connected mode or islanded mode [61]. During periods of high-intensity and low-frequency events, the foremost challenge in any distribution system is the loss of power, often resulting in extensive blackouts. Such occurrences can lead to significant economic losses for a country, necessitating preventive measures. Integrating DERs has profoundly transformed the dynamics of modern electric systems, enhancing their resilience. Understanding the restoration process during a blackout, known as BS restoration, is crucial and outlined in Figure 6.
When a blackout event occurs, backup supply (activated backup unit in Figure 6) automatically engages to ensure the continuous operation of critical infrastructures. A real-time coordination of inputs from various tools—such as the customer information system (CIS), interactive voice response (IVR), advanced metering infrastructure (AMI), and supervisory control and data acquisition (SCADA)—is facilitated at the control center by the outage management system (OMS) and distributed management system (DMS). Feedback from the OMS and DMS is fed into the advanced distribution management system (ADMS), serving as the decision-coordination center, often referred to as the brain box of the entire system. The ADMS synchronizes and enhances the performance of all other systems, simplifying the decision-making process and improving emergency response execution. Leveraging the geographic information system (GIS) network model, the ADMS, along with other tools, creates a real-time network model, providing a unified platform to control and dispatch with a comprehensive view of the distribution system during an outage. Utilizing the available information, the ADMS conducts damage impact analysis and communicates findings to all relevant parties. Once a satisfactory response is achieved in this control loop, faulty systems and locations are communicated to the deployment loop. Throughout the maintenance process, regular updates are provided to the ADMS, maintaining continuous communication until repairs are complete. The entire restoration sequence follows a series of if–else conditions. If all conditions are met, the BS procedure is activated, and systematic load restoration, with attention to cold load pick-up (CLPU), is conducted. The process continues until all conditions are successfully met; otherwise, the loop persists until the conditions are satisfied [62,63,64]. The mathematical representation of BS restoration can be framed as a dynamic optimization problem. This approach allows for decision making across multiple time steps. The discrete-time dynamic optimization problem is outlined in Equation (13):
m a x / m i n = Z o Z n = T Δ t F ¯ [ Z t , x ( Z t ) , u ( Z t ) Δ t ] ,
where Z o and Z n can be represented discretely, with N denoting the total number of time steps, indicating Δ t as the duration of each step. The function F ¯ [ Z t , x ( Z t ) , u ( Z t ) ] is defined as the objective function. The entire goal is to maximize the restored energy within the estimated time frame, which is expressed as Equation (14):
m a x i V L K W i x i P i .
Equations (15) and (20)–(22) are the constraints for injected active power, injected reactive power, and the maximum and minimum value of the voltages, whereas Equations (16)–(19) are the formulations for power injections, power consumption, and power flow for the kth MG, while x i is the binary variable, 0 represents the load is not picked up, and 1 represents the load is picked up.
i V L K P i < = i V I K P j
P i = V i . i , j E k Y i j . V j . c o s ( δ i δ j θ i j ) i V I k
Q i = V i . i , j E k Y i j . V j . s i n ( δ i δ j θ i j ) i V I k
x i P i = V i . i , j E k Y i j . V j . c o s ( δ i δ j θ i j ) i V L k
x i Q i = V i . i , j E k Y i j . V j . s i n ( δ i δ j θ i j ) i V L k
0 < = P i < = P i m a x i V I k
0 < = Q i < = Q i m a x i V I k
V i m i n < = V i < = V i m a x i V k .
Also, V I K and V L K are defined as the voltages of all inverters and the loads at the kth MG [64].
Completing the MG modeling merely is not sufficient to fully address the resilience challenges. It is essential to enhance technologies and integrate additional features that can elevate MG applications to the next level. Therefore, viewing MGs from a resilience management perspective is crucial. To figure out this concept, it is necessary to understand what resilience management entails in MGs. It involves a minimization in outage duration and maintaining supply to as many customers as possible by employing the methods as follows [65]:
  • Strategies for forming multiple MGs.
  • Dynamic MG formation.
  • Utilization of mobile energy resources.
  • Establishment of networked MGs.
All these methods focus on re-configuring MGs and switches to minimize outage duration and the number of customers affected by outages [66].
A potential strategy to achieve the goal of efficiently harnessing DERs and switches involves intentionally partitioning the distribution system into multiple self-sufficient MGs, known as multi-MG formation. According to the IEEE 1547.4, segmenting the distribution system can improve the system’s performance and reliability [67]. The concept and significance of an MMGF come to the forefront as a promising solution to enhance the power system resilience during catastrophic events. With the integration of deep reinforcement learning, this static technique has evolved into the dynamic MMGF formulation. Zhao et al. introduced a dynamic MMGF approach utilizing deep reinforcement learning coupled with convolutional neural networks (CNNs). This scheme was validated on a 7-bus system and an IEEE 123-bus system [68]. The MMGF represents just one aspect of MG technologies. Another remarkable innovation is the integration of electric vehicles (EVs), which has given rise to concepts such as vehicle-to-grid (V2G) and V2H. These advancements leverage distributed EVs and photovoltaic (PV) systems to enhance the resilience of networked MGs against extreme events. Additionally, rooftop solar photovoltaic systems contribute significantly to the ongoing improvements in MG technologies. To gain a system and technical understanding, Simental et al. conducted an analysis focusing on the effective utilization and management of distributed EVs and PV systems within residential networked MGs. This comprehensive analysis was demonstrated using the IEEE 33-bus system, where EVs provided power support for 6 hrs through V2G and V2H technologies. The results showed a 41 % reduction in buses experiencing outages when EVs were involved, compared to an 83 % outage rate without DERs. This highlights the significant advantage of integrating EVs and DERs into distribution systems [69].
A recent advancement in MG integration involves the utilization of EVs as mobile power sources and for deploying repair crews (RCs). This represents another widely adopted innovation in MG technology. These mobile services have emerged as critical resources in MGs, facilitating coordination with RCs to enhance resilience. Their flexibility and mobility make them particularly effective in managing the complex interaction between power and transport systems. To assess their efficacy, Wang et al. have proposed a hierarchical multi-agent reinforcement learning method. This approach features a two-level framework where high-level actions control decision making between power and transport networks, while low-level actions, constructed via a hybrid policy, address continuous scheduling and discrete routing decisions in the respective networks [70]. These emerging technologies represent significant advancements in the area of MGs, revolutionizing existing systems and enhancing distribution system resilience to a greater extent.
Understanding how cost estimation is conducted for MGs to enhance reliability is crucial, especially considering the different range of available technologies. The cost-based approach proves most efficient for MGs and distribution networks integrating distributed generation and energy-storage systems. The cost function of an MG system changes depending on its operational mode, whether it purchases electricity from the main grid or sells surplus energy for revenue. Energy storage offers two significant advantages, which separate electricity generation from consumption, thereby facilitating better supply and demand management. Also, it enables decentralized storage options for local grids or MGs, significantly improving grid security [71]. The cost structure of an MG system is contingent upon its operational mode, whether it operates independently (islanded) or is connected to the main grid. When linked to the network, the MG dynamically balances the variance between load consumption and the output power of micro-generators. This necessitates the MG purchasing electricity from the main grid when needed or selling surplus energy to generate revenue. The objective function for determining the operational costs of an MG with distributed generations is established in Equations (23) and (24):
m i n ( f 1 ) , f 1 = C o O M G
C o O M G = k = 1 T Δ t [ i = 1 N ( C F i + C O M i ) + C B i , k C S i , k ] .
Also, Equation (25) represents the levelized cost of energy ( L C O E M G ) for the MG while supplying energy to distribution grids during outage periods.
L C O E M G = t = 1 n I t + O & M t + F t + T t + E x t t + L t ( 1 + r ) t t = 1 n E t ( 1 + r ) t ,
where L C O E represents the average cost of electricity over the period n; I t denotes the annual investment costs; O & M t stands for the annual operating and maintenance costs; F t represents the annual fuel component costs; T t signifies the annual tax payments; E t indicates the annual volume of electricity production in kWh; r represents the discount rate; t signifies the year of the project; E x t t represents the annual external costs; and L t represents the annual clearing costs.
The estimations for various DERs concerning power capacity are considered. A small wind turbine, ranging from 10 kW to 1 MW, is expected to cause O&M costs of up to USD 5.7 per kW per year. Conversely, a large PV generator, with a power capacity of 50 kW to 500 kW, is estimated to have O&M costs of USD 3.9 3 per kW per year. Meanwhile, a small PV generator is projected to have O&M costs of approximately USD 14.3 per kW per year. These figures illustrate the advantage of incorporating solar PV over diesel generators, which typically have O&M costs ranging from USD 26.5 per kW per year with a lifespan of 12.5 years, compared to renewable energy sources (RESs) with lifespans of at least 20 years [72]. The market prices for system components including PV costs and BESS costs for residential purposes are USD 2950 per kWdc and USD 1503 per kWh, respectively. For commercial applications, PV costs approximately USD 1840 per kWdc, while the BESS costs around USD 610 per kWh. Also, PV costs USD 990 per kWdc, with the BESS priced at USD 446 per kWh for utility-scale applications [73]. Energy storage units (ESUs) serve as the foundation of MGs, crucial for balancing power supply and demand. They ensure system stability, reliability, and power quality. Regarding the cost analysis of batteries, a standard battery with a power density ranging from 0.1 to 10 kW/ m 3 and energy capacity of 20 to 200 Wh/kg is estimated to cost between USD 150 and USD 1300 per kWh.
In common situations, a flexible energy storage system (FESS) is effective for managing peak loads and integrating renewable energy, yet it is limited to local power supply without any mobility. Conversely, a mobile energy storage system (MESS) offers greater flexibility and reliability, making it suitable for various applications and wider coverage areas. However, its capacity is restricted, and the costs are high. Thus, there is a necessity to synergize the strengths of FESSs and MESSs and strategically allocate them to enhance the economic viability and resilience of planning outcomes [33,74].
The Nash bargaining model is utilized to address the trade-off between resilience and economics. In this model, resilience and economics act as negotiating entities engaged in a strategic game. By solving this model, the Nash equilibrium point is determined, achieving a balance between various sub-objectives characterized by differences in probability, magnitude, trend, and impact [75]. In [76], a joint data-driven mechanism is employed to model the failure probability, creating a set of typhoon disaster scenarios for the planning period. The resilience index is established based on the cost of power outages resulting from all typhoons during this period. This outage cost is contingent upon the failure rate of distribution networks and the extent of load recovery after a failure. The failure probability model is constructed using a combination of research concepts and historical data sources. The allocation of FESSs and MESSs is optimized to mitigate typhoon-induced power outage costs and enhance resilience. Furthermore, FESSs and MESSs can contribute to peak load management and planned outages under normal conditions, thus enhancing economic efficiency. Furthermore, the economic index is determined by the difference between the investment and O&M costs of the equipment and the benefits observed in normal scenarios. In normal circumstances, the benefits of ESSs primarily stem from peak shaving with FESSs and the involvement of MESSs in planned outages. The objective of optimization is to minimize this economic index, which is given by Equations (26)–(31):
m i n F c = n f F f F f 1 F f 2 + n m F m F m 1 F m 2
F f = C E f E f + C p f P f + C o m f P f T 1 F f 1 = q = 1 T 1 K q k f q Δ Q f q ( p f q p g q )
F f 2 = K f 2 ( C E f E f + C p f P f )
F m = C E m E m + C P m P m + C o m m P m T 1
F m 1 = T m , i T m p m ( t ) 0 T m , i P m ( t ) d t n m p M e s s ( T m + T R )
F m 2 = K m 2 ( C E m E m + C p m P m ) ,
where F C represents the economic indicator; n f and n m denote the deployment quantities of FESSs and MESSs, respectively; and F f and F m represent the investment costs for a single FESS and MESS, respectively. Additionally, F f 1 denotes the compensation gained from peak shaving with the FESS, while F m 1 represents the benefits accrued from the MESS’s participation in planned outages, including transportation costs. F f 2 and F m 2 indicate the asset recovery gains of the FESS and MESS, respectively, at the end of the planning period. C E f , C P f , C o m f , C E m , C P m , and C o m m represent the costs and the O & M costs of the FESS and MESS, respectively. The purchase cost of the MESS incorporates equipment expenses (e.g., trucks and inverters). K f 2 and K m 2 denote the asset recovery coefficients of the FESS and MESS, respectively. Furthermore, E f , P f , E m , and P m define the maximum rated power and capacity of the FESS and MESS, respectively. T 1 represents the planning period, while K q = 1 / ( 1 + r ) q denotes the limited value coefficient in the year q, with r representing the annual rate. k f q represents the line loss coefficient, and Δ Q f q denotes the electricity consumption of the FESS involved in peak shaving compensation in year q. The peak load price and the load price in low-demand periods in the year q are given by p f q and p g q , respectively. T m and T R represent the average number of planned outages involved in the planning period and the predefined number of extreme events, respectively. T m , i , p m ( t ) , and P m ( t ) are variables representing the planned outage index, the electrical capacity during a planned outage, and the electric power supplied by the MESS during a planned outage, correspondingly. However, the analysis was restricted merely to the evaluation of typhoon disasters. It is imperative to extend this consideration to include other types of disaster events for future direction and comprehensive assessment [76].

5. Conclusions

This review paper provides an in-depth examination of climate-related issues, presenting an analysis that enriches the general discourse found in wider literature surveys. It conducts a detailed investigation into the effects of diverse weather conditions, highlighting the imperative for customized interventions that are delineated into strategies for immediate and future planning. Moreover, it investigates various ML models for determining regions at risk, underlining the critical need for accuracy in confronting the related challenges and employing simulation technologies. This review furnishes researchers with significant knowledge for the advancement and challenges in applying algorithms across a range of climatic scenarios. Also, the critical role of MGs during significant events was emphasized, highlighting their integration with technologies such as the MMGF, V2H, V2G, and mobile power resources. Specifically, their importance in BS restoration sequences was underscored, anticipating their role in mitigating extreme hazards in the future. Moreover, a detailed cost analysis of MGs and ESSs is presented, including quantified figures for residential, commercial, and utility purposes, providing clarity for planning MG operations.
As future work, further explorations into optimizing ML frameworks for identifying vulnerable regions and developing advanced simulation tools can enhance risk-assessment models. Integrating MGs with RESs and smart grid technologies offers opportunities to improve resilience during extreme events. Investigating the role of MGs in supporting community resilience and emergency response efforts is vital for effective disaster preparedness.

Author Contributions

Conceptualization, S.R.K., K.P., A.Z., Y.H., S.L.C. and J.H.; formal analysis, S.R.K., K.P., A.Z., Y.H., S.L.C. and J.H.; writing—original draft preparation, S.R.K., K.P., A.Z., Y.H., S.L.C. and J.H.; writing—review and editing, S.R.K., K.P., A.Z., Y.H., S.L.C. and J.H.; supervision, A.Z., S.L.C. and J.H. All authors have read and agreed to the published version of the manuscript.

Funding

This research received no external funding.

Conflicts of Interest

The authors declare no conflicts of interest.

References

  1. Mujjuni, F.; Betts, T.R.; Blanchard, R.E. Evaluation of Power Systems Resilience to Extreme Weather Events: A Review of Methods and Assumptions. IEEE Access 2023, 11, 87279–87296. [Google Scholar] [CrossRef]
  2. Bhusal, N.; Abdelmalak, M.; Kamruzzaman, M.; Benidris, M. Power System Resilience: Current Practices, Challenges, and Future Directions. IEEE Access 2020, 8, 18064–18086. [Google Scholar] [CrossRef]
  3. Rusco, F. Electricity Grid Resilience—Climate Change Is Expected to Have Far-Reaching Effects and DOE and FERC Should Take Actions; Technical Report; United States Government Accountability Office: Washington, DC, USA, 2021. [Google Scholar]
  4. Ren, H.; Hou, Z.J.; Ke, X.; Huang, Q.; Makatov, Y. Analysis of Weather and Climate Extremes Impact on Power System Outage. In Proceedings of the 2021 IEEE Power & Energy Society General Meeting (PESGM), Washington, DC, USA, 26–29 July 2021; pp. 1–5. [Google Scholar] [CrossRef]
  5. Eggleston, J.; Zuur, C.; Mancarella, P. From Security to Resilience: Technical and Regulatory Options to Manage Extreme Events in Low-Carbon Grids. IEEE Power Energy Mag. 2021, 19, 67–75. [Google Scholar] [CrossRef]
  6. Atrigna, M.; Buonanno, A.; Carli, R.; Cavone, G.; Scarabaggio, P.; Valenti, M.; Graditi, G.; Dotoli, M. A Machine Learning Approach to Fault Prediction of Power Distribution Grids Under Heatwaves. IEEE Trans. Ind. Appl. 2023, 59, 4835–4845. [Google Scholar] [CrossRef]
  7. Panossian, N. Power System Wildfire Risks and Potential Solutions: A Literature Review Proposed Metric; Technical Report; National Renewable Energy Laboratory: Golden, CO, USA, 2023. [Google Scholar]
  8. Panteli, M.; Mancarella, P. Influence of extreme weather and climate change on the resilience of power systems: Impacts and possible mitigation strategies. Electr. Power Syst. Res. 2015, 127, 259–270. [Google Scholar] [CrossRef]
  9. Kandaperumal, G.; Pandey, S.; Srivastava, A. AWR: Anticipate, Withstand, and Recover Resilience Metric for Operational and Planning Decision Support in Electric Distribution System. IEEE Trans. Smart Grid 2022, 13, 179–190. [Google Scholar] [CrossRef]
  10. Ton, D.T.; Wang, W.T.P. A More Resilient Grid: The U.S. Department of Energy Joins with Stakeholders in an R&D Plan. IEEE Power Energy Mag. 2015, 13, 26–34. [Google Scholar] [CrossRef]
  11. Zaboli, A.; Hong, J.; Tuyet-Doan, V.N.; Kim, Y.H. A Machine Learning-based Short-term Load Forecasting Method for Behind-the-meter DERs. In Proceedings of the 2023 IEEE Power & Energy Society General Meeting (PESGM), Orlando, FL, USA, 16–20 July 2023; pp. 1–5. [Google Scholar] [CrossRef]
  12. Zaboli, A.; Tuyet-Doan, V.N.; Kim, Y.H.; Hong, J.; Su, W. An LSTM-SAE-Based Behind-the-Meter Load Forecasting Method. IEEE Access 2023, 11, 49378–49392. [Google Scholar] [CrossRef]
  13. Bentivegna, E. Identifying Extreme Regimes in Climate-Scale Digital Twins: A Roadmap. In Proceedings of the 2022 IEEE International Conference on Big Data (Big Data), Osaka, Japan, 17–20 December 2022; pp. 4833–4834. [Google Scholar] [CrossRef]
  14. Luo, D.; Xia, Y.; Zeng, Y.; Li, C.; Zhou, B.; Yu, H.; Wu, Q. Evaluation Method of Distribution Network Resilience Focusing on Critical Loads. IEEE Access 2018, 6, 61633–61639. [Google Scholar] [CrossRef]
  15. Krishnamurthy, V.; Kwasinski, A. Effects of Power Electronics, Energy Storage, Power Distribution Architecture, and Lifeline Dependencies on Microgrid Resiliency during Extreme Events. IEEE J. Emerg. Sel. Top. Power Electron. 2016, 4, 1310–1323. [Google Scholar] [CrossRef]
  16. Ciapessoni, E.; Cirio, D.; Pitto, A. A Cost–Benefit Analysis Framework for Power System Resilience Enhancement Based on Optimization via Simulation Considering Climate Changes and Cascading Outages. Energies 2023, 16, 5160. [Google Scholar] [CrossRef]
  17. Araújo, K.; Shropshire, D. A meta-level framework for evaluating resilience in net-zero carbon power systems with extreme weather events in the United States. Energies 2021, 14, 4243. [Google Scholar] [CrossRef]
  18. Zafeiropoulou, M.; Sijakovic, N.; Zarkovic, M.; Ristic, V.; Terzic, A.; Makrygiorgou, D.; Zoulias, E.; Vita, V.; Maris, T.I.; Fotis, G. A Flexibility Platform for Managing Outages and Ensuring the Power System’s Resilience during Extreme Weather Conditions. Processes 2023, 11, 3432. [Google Scholar] [CrossRef]
  19. Bayani, R.; Manshadi, S.D. Resilient Expansion Planning of Electricity Grid Under Prolonged Wildfire Risk. IEEE Trans. Smart Grid 2023, 14, 3719–3731. [Google Scholar] [CrossRef]
  20. Sun, N.; Zhang, S.; Peng, T.; Zhou, J.; Sun, X. A Composite Uncertainty Forecasting Model for Unstable Time Series: Application of Wind Speed and Streamflow Forecasting. IEEE Access 2020, 8, 209251–209266. [Google Scholar] [CrossRef]
  21. Emily, B. Extreme Weather Is Causing More U.S. Power Outages. But There Are Solutions. TIME, 24 September 2021. [Google Scholar]
  22. Bie, Z.; Lin, Y.; Li, G.; Li, F. Battling the Extreme: A Study on the Power System Resilience. Proc. IEEE 2017, 105, 1253–1266. [Google Scholar] [CrossRef]
  23. Liang, G.; Jing, J.; Hao, W.; Wang, Z.; Zhou, F.; Wei, Y. Resilience Enhancement Strategy Considering Faulty Equipment Repair and Multiple Resource Dispatch for Power Distribution Networks. In Proceedings of the 2023 International Conference on Power System Technology (PowerCon), Jinan, China, 21–22 September 2023; pp. 1–5. [Google Scholar] [CrossRef]
  24. Chi, Y.; Xu, Y.; Hu, C.; Feng, S. A State-of-the-Art Literature Survey of Power Distribution System Resilience Assessment. In Proceedings of the 2018 IEEE Power & Energy Society General Meeting (PESGM), Portland, OR, USA, 5–10 August 2018; pp. 1–5. [Google Scholar] [CrossRef]
  25. Arif, A.; Wang, Z.; Chen, C.; Chen, B. A Stochastic Multi-Commodity Logistic Model for Disaster Preparation in Distribution Systems. IEEE Trans. Smart Grid 2020, 11, 565–576. [Google Scholar] [CrossRef]
  26. Kotikot, S.M.; Kar, B.; Omitaomu, O.A. A Geospatial Framework Using Multicriteria Decision Analysis for Strategic Placement of Reserve Generators in Puerto Rico. IEEE Trans. Eng. Manag. 2020, 67, 659–669. [Google Scholar] [CrossRef]
  27. Sun, S.; Lyu, Q.; Li, G.; Lin, Y.; Bie, Z.; Wen, W. Resilience Modeling and Assessment for Power Distribution Systems Under Typhoon Disasters. In Proceedings of the 2019 IEEE Sustainable Power and Energy Conference (iSPEC), Beijing, China, 21–23 November 2019; pp. 2413–2418. [Google Scholar] [CrossRef]
  28. Wang, Y.; Huang, T.; Li, X.; Tang, J.; Wu, Z.; Mo, Y.; Xue, L.; Zhou, Y.; Niu, T.; Sun, S. A Resilience Assessment Framework for Distribution Systems Under Typhoon Disasters. IEEE Access 2021, 9, 155224–155233. [Google Scholar] [CrossRef]
  29. Arab, A.; Khodaei, A.; Eskandarpour, R.; Thompson, M.P.; Wei, Y. Three Lines of Defense for Wildfire Risk Management in Electric Power Grids: A Review. IEEE Access 2021, 9, 61577–61593. [Google Scholar] [CrossRef]
  30. Trakas, D.N.; Hatziargyriou, N.D. Optimal Distribution System Operation for Enhancing Resilience Against Wildfires. IEEE Trans. Power Syst. 2018, 33, 2260–2271. [Google Scholar] [CrossRef]
  31. Yao, F.; Chau, T.K.; Zhang, X.; Iu, H.H.C.; Fernando, T. An Integrated Transmission Expansion and Sectionalizing-Based Black Start Allocation of BESS Planning Strategy for Enhanced Power Grid Resilience. IEEE Access 2020, 8, 148968–148979. [Google Scholar] [CrossRef]
  32. Liu, F.; Chen, C.; Lin, C.; Li, G.; Xie, H.; Bie, Z. Utilizing Aggregated Distributed Renewable Energy Sources With Control Coordination for Resilient Distribution System Restoration. IEEE Trans. Sustain. Energy 2023, 14, 1043–1056. [Google Scholar] [CrossRef]
  33. Kim, J.; Dvorkin, Y. Enhancing Distribution System Resilience With Mobile Energy Storage and Microgrids. IEEE Trans. Smart Grid 2019, 10, 4996–5006. [Google Scholar] [CrossRef]
  34. Ghayoor, F.; Ghannadpour, S.F.; Zaboli, A. Power network-planning optimization considering average power not supplied reliability index: Modified by chance-constrained programming. Comput. Ind. Eng. 2022, 164, 107900. [Google Scholar] [CrossRef]
  35. Du, Y.; Tu, H.; Lu, X.; Wang, J.; Lukic, S. Black-Start and Service Restoration in Resilient Distribution Systems with Dynamic Microgrids. IEEE J. Emerg. Sel. Top. Power Electron. 2022, 10, 3975–3986. [Google Scholar] [CrossRef]
  36. Ghayoor, F.; Zaboli, A.; Ghannadpour, S.F. A Coordinated Power Grid optimization Considering Reliability and Chance-Constrained Approaches. In Proceedings of the 2023 IEEE Kansas Power and Energy Conference (KPEC), Manhattan, KS, USA, 27–28 April 2023; pp. 1–6. [Google Scholar] [CrossRef]
  37. Qiu, D.; Wang, Y.; Wang, J.; Zhang, N.; Strbac, G.; Kang, C. Resilience-Oriented Coordination of Networked Microgrids: A Shapley Q-Value Learning Approach. IEEE Trans. Power Syst. 2023, 39, 3401–3416. [Google Scholar] [CrossRef]
  38. Panteli, M.; Mancarella, P. The Grid: Stronger, Bigger, Smarter? Presenting a Conceptual Framework of Power System Resilience. IEEE Power Energy Mag. 2015, 13, 58–66. [Google Scholar] [CrossRef]
  39. Kwasinski, A. Quantitative Model and Metrics of Electrical Grids’ Resilience Evaluated at a Power Distribution Level. Energies 2016, 9, 93. [Google Scholar] [CrossRef]
  40. Liu, X.; Shahidehpour, M.; Li, Z.; Liu, X.; Cao, Y.; Bie, Z. Microgrids for Enhancing the Power Grid Resilience in Extreme Conditions. IEEE Trans. Smart Grid 2017, 8, 589–597. [Google Scholar] [CrossRef]
  41. Panteli, M.; Mancarella, P.; Trakas, D.N.; Kyriakides, E.; Hatziargyriou, N.D. Metrics and Quantification of Operational and Infrastructure Resilience in Power Systems. IEEE Trans. Power Syst. 2017, 32, 4732–4742. [Google Scholar] [CrossRef]
  42. Chanda, S.; Srivastava, A.K.; Mohanpurkar, M.U.; Hovsapian, R. Quantifying Power Distribution System Resiliency Using Code-Based Metric. IEEE Trans. Ind. Appl. 2018, 54, 3676–3686. [Google Scholar] [CrossRef]
  43. Panteli, M.; Pickering, C.; Wilkinson, S.; Dawson, R.; Mancarella, P. Power System Resilience to Extreme Weather: Fragility Modeling, Probabilistic Impact Assessment, and Adaptation Measures. IEEE Trans. Power Syst. 2017, 32, 3747–3757. [Google Scholar] [CrossRef]
  44. Mohamed, M.A.; Chen, T.; Su, W.; Jin, T. Proactive Resilience of Power Systems Against Natural Disasters: A Literature Review. IEEE Access 2019, 7, 163778–163795. [Google Scholar] [CrossRef]
  45. Zhu, X.; Zeng, B.; Li, Y.; Liu, J. Co-Optimization of Supply and Demand Resources for Load Restoration of Distribution System Under Extreme Weather. IEEE Access 2021, 9, 122907–122923. [Google Scholar] [CrossRef]
  46. Poudel, S.; Dubey, A. Critical Load Restoration Using Distributed Energy Resources for Resilient Power Distribution System. IEEE Trans. Power Syst. 2019, 34, 52–63. [Google Scholar] [CrossRef]
  47. Billinton, R.; Wu, C.; Singh, G. Extreme adverse weather modeling in transmission and distribution system reliability evaluation. In Proceedings of the 14th Power Systems Computation Conference, Seville, Spain, 24–28 June 2002. [Google Scholar]
  48. Chaidez, A.; Sang, Y. Optimal Energy Portfolio Planning for Power System Considering the Impact of Winter Storms. In Proceedings of the 2021 North American Power Symposium (NAPS), College Station, TX, USA, 14–16 November 2021; pp. 1–5. [Google Scholar] [CrossRef]
  49. Bhat, R.; Darestani, Y.M.; Shafieezadeh, A.; Meliopoulos, A.; DesRoches, R. Resilience Assessment of Distribution Systems Considering the Effect of Hurricanes. In Proceedings of the 2018 IEEE/PES Transmission and Distribution Conference and Exposition (T&D), Denver, CO, USA, 16–19 April 2018; pp. 1–5. [Google Scholar] [CrossRef]
  50. Yang, Z.; Martí, A.; Chen, Y.; Martí, J.R. Optimal Resource Allocation to Enhance Power Grid Resilience Against Hurricanes. IEEE Trans. Power Syst. 2023, 38, 2621–2629. [Google Scholar] [CrossRef]
  51. Aquino, J.; Nazaripouya, H. Methods Utilized to Improve Resilience of Power Systems Against Ice Storms. In Proceedings of the 2022 IEEE International Conference on Environment and Electrical Engineering and 2022 IEEE Industrial and Commercial Power Systems Europe (EEEIC/I&CPS Europe), Prague, Czech Republic, 28 June–1 July 2022; pp. 1–5. [Google Scholar] [CrossRef]
  52. Norris, T. Power systems in emergencies—From contingency planning to crisis management. IEE Rev. 2001, 47, 28. [Google Scholar]
  53. Shafieezadeh, A.; Onyewuchi, U.P.; Begovic, M.M.; DesRoches, R. Age-Dependent Fragility Models of Utility Wood Poles in Power Distribution Networks Against Extreme Wind Hazards. IEEE Trans. Power Deliv. 2014, 29, 131–139. [Google Scholar] [CrossRef]
  54. Gazijahani, F.S.; Salehi, J.; Shafie-khah, M. Benefiting from Energy-Hub Flexibilities to Reinforce Distribution System Resilience: A Pre- and Post-Disaster Management Model. IEEE Syst. J. 2022, 16, 3381–3390. [Google Scholar] [CrossRef]
  55. Yadav, M.; Pal, N.; Saini, D.K. Microgrid Control, Storage, and Communication Strategies to Enhance Resiliency for Survival of Critical Load. IEEE Access 2020, 8, 169047–169069. [Google Scholar] [CrossRef]
  56. Igder, M.A.; Liang, X. Service Restoration Using Deep Reinforcement Learning and Dynamic Microgrid Formation in Distribution Networks. IEEE Trans. Ind. Appl. 2023, 59, 5453–5472. [Google Scholar] [CrossRef]
  57. Mohan, G.N.V.; Bhende, C.N.; Srivastava, A.K. Intelligent Control of Battery Storage for Resiliency Enhancement of Distribution System. IEEE Syst. J. 2022, 16, 2229–2239. [Google Scholar] [CrossRef]
  58. Ambia, M.N.; Meng, K.; Xiao, W.; Dong, Z.Y. Nested Formation Approach for Networked Microgrid Self-Healing in Islanded Mode. IEEE Trans. Power Deliv. 2021, 36, 452–464. [Google Scholar] [CrossRef]
  59. Guov, V.; Cao, Y.; Beil, I. Islanding of a Topologically Realistic Rural Grid Using Grid-Forming Inverters. In Proceedings of the 2022 IEEE 13th International Symposium on Power Electronics for Distributed Generation Systems (PEDG), Kiel, Germany, 26–29 June 2022; pp. 1–6. [Google Scholar] [CrossRef]
  60. D’silva, S.; Shadmand, M.B.; Abu-Rub, H. Microgrid Control Strategies for Seamless Transition Between Grid-Connected and Islanded Modes. In Proceedings of the 2020 IEEE Texas Power and Energy Conference (TPEC), College Station, TX, USA, 6–7 February 2020; pp. 1–6. [Google Scholar] [CrossRef]
  61. Office of Electricity. Grid Systems. 2024. Available online: https://www.energy.gov/oe/grid-systems (accessed on 20 March 2024).
  62. Udoakah, Y.O.; Sonder, H.B.; Liang, J.; Cipcigan, L. Development of a viable black start restoration pathway and problem formulation sequence. In Proceedings of the 2022 IEEE 7th International Energy Conference (ENERGYCON), Riga, Latvia, 9–12 May 2022; pp. 1–6. [Google Scholar]
  63. Poudel, S.; Mukherjee, M.; Jinsiwale, R.A.; Hanif, S. Resilience Assessment Framework For Distribution Systems Performance Under Extreme Conditions. In Proceedings of the 2023 IEEE Power & Energy Society Innovative Smart Grid Technologies Conference (ISGT), Washington, DC, USA, 16–19 January 2023; pp. 1–5. [Google Scholar]
  64. Tan, Z.; Fan, R.; Liu, Y.; Sun, L. Microgrid black-start after natural disaster with load restoration using spanning tree search. In Proceedings of the 2016 IEEE Power and Energy Society General Meeting (PESGM), Boston, MA, USA, 17–21 July 2016; pp. 1–5. [Google Scholar]
  65. Hamidieh, M.; Ghassemi, M. Microgrids and resilience: A review. IEEE Access 2022, 10, 106059–106080. [Google Scholar] [CrossRef]
  66. El-Faouri, F.S.; Alzahlan, M.W.; Batarseh, M.G.; Mohammad, A.; Za’ter, M.E. Modeling of a microgrid’s power generation cost function in real-time operation for a highly fluctuating load. Simul. Model. Pract. Theory 2019, 94, 118–133. [Google Scholar] [CrossRef]
  67. 1547.4-2011; IEEE Guide for Design, Operation, and Integration of Distributed Resource Island Systems with Electric Power Systems. IEEE: New York, NY, USA, 2011.
  68. Zhao, J.; Li, F.; Mukherjee, S.; Sticht, C. Deep reinforcement learning-based model-free on-line dynamic multi-microgrid formation to enhance resilience. IEEE Trans. Smart Grid 2022, 13, 2557–2567. [Google Scholar] [CrossRef]
  69. Simental, O.Q.; Mandal, P.; Galvan, E.; Wang, Z. Leveraging Distributed EVs and PVs to Assess Networked Microgrids Resilience Against Extreme Weather Event. In Proceedings of the 2022 IEEE Power & Energy Society General Meeting (PESGM), Denver, CO, USA, 17–21 July 2022; pp. 1–5. [Google Scholar]
  70. Wang, Y.; Qiu, D.; Teng, F.; Strbac, G. Towards microgrid resilience enhancement via mobile power sources and repair crews: A multi-agent reinforcement learning approach. IEEE Trans. Power Syst. 2023, 39, 1329–1345. [Google Scholar] [CrossRef]
  71. Denysiuk, S.; Derevianko, D. Optimisation features of energy processes in energy systems with Distributed Generation. In Proceedings of the 2020 IEEE 7th International Conference on Energy Smart Systems (ESS), Kyev, Ukraine, 12–14 May 2020; pp. 211–214. [Google Scholar]
  72. Singh, S.; Gao, D.W.; Giraldez, J. Cost analysis of renewable energy-based microgrids. In Proceedings of the 2017 North American Power Symposium (NAPS), Morgantown, WV, USA, 17–19 September 2017; pp. 1–4. [Google Scholar]
  73. Stevenson, A.; Riggs, H.; Khan, M.A.; Sarwat, A. Estimating Cost of Electricity of Resilient PV-based Grid-Tied Microgrids. In Proceedings of the 2023 IEEE Green Technologies Conference (GreenTech), Denver, CO, USA, 19–21 April 2023; pp. 15–19. [Google Scholar]
  74. Dugan, J.; Mohagheghi, S.; Kroposki, B. Application of Mobile Energy Storage for Enhancing Power Grid Resilience: A Review. Energies 2021, 14, 6476. [Google Scholar] [CrossRef]
  75. Chen, Y.; Pei, W.; Ma, T.; Xiao, H. Asymmetric Nash bargaining model for peer-to-peer energy transactions combined with shared energy storage. Energy 2023, 278, 127980. [Google Scholar] [CrossRef]
  76. Zhang, L.; Huang, J.; Tang, W.; Hou, Y.; Wang, Z.; Xie, F.; Fan, W. Equilibrium allocation of ESSs in multiple UIESs-accessed distribution networks considering the resilience and economic benefits. IEEE Trans. Ind. Appl. 2023, 59, 5230–5242. [Google Scholar] [CrossRef]
Figure 1. A flowchart of the stages of the resilience process.
Sustainability 16 03047 g001
Figure 2. Curve for operational and infrastructural resilience.
Sustainability 16 03047 g002
Figure 3. Short-term vs. long-term resilience strategies.
Sustainability 16 03047 g003
Figure 4. A categorization of various enhancement strategies.
Sustainability 16 03047 g004
Figure 5. An overview of MGs considering their interconnection mechanism to the main grid system.
Sustainability 16 03047 g005
Figure 6. A step-by-step procedure for BS restoration.
Sustainability 16 03047 g006
Table 1. A literature review in distinct frameworks for each weather condition.
Ref.ApplicationFrameworkContributionsConstraints/Challenges
Arif et al. [25]Pre-disasterMixed-integer linear programmingReduced expenses related to depots, crews, equipment, and penalties incurred due to delays in equipment acquisition and restoration.Solving problems on a large scale poses computational challenges.
Kotikot et al. [26]HurricanesMCDAIdentified viable locations for the power storage devices.A thorough assessment is required to avoid conflicting objectives; all places are not suitable for this approach; energy supply and demand analysis is not considered in this framework.
Sun et al. [27]TyphoonsMonte Carlo simulationModeled the fragility of distribution lines and assessed the resilience of distribution systems during typhoon disasters.Due to insufficient data, the fragility modeling of distribution lines has not been tackled.
Wang et al. [28]TyphoonsProbabilistic generation model, spatio-temporal vulnerability model, breadth-first search algorithmThis research quantified the uncertainty associated with typhoons, determined the likelihood of failure for each distribution grid line, and computed the ideal amount of load reduction required for each segment.The impact arising from the interactions between adjacent lines remains a significant issue.
Arab et al. [29]Wildfires3LDA 3LD framework has been established, wherein the primary defense involves wildfire prevention, the secondary defense focuses on wildfire mitigation and proactive response, and the tertiary defense centers on wildfire recovery preparedness.Due to profound uncertainty, risk modeling poses significant challenges, and the physics of wildfires were beyond the paper’s scope.
Trakas et al. [30]WildfiresMonte Carlo simulationA framework for emergency situations has been developed, taking into account the effects of wildfires on the conductor’s temperature and the functionality of the line.This model is limited to constant loads.
Yao et al. [31]All weather conditionsA duality-based column and constraint generation (D-CCG) method is proposed.Integrated planning is conducted for the expansion of transmission and the optimal allocation of BESS resources for sectionalized-based BS.The techniques developed are limited to the transmission level.
Luo et al. [14]Critical loadsMonte Carlo methodThe comparison and analysis involved assessing the load loss rate of the system, either before or after the integration of distributed generation, along with variations in the resilience of the distribution network.This method will not work for transmission and distribution networks simultaneously.
Liu et al. [32]Renewable energy systemsStochastic optimizationConsidered the uncertainty associated with RESs, and loads were also taken into account to enhance the capacity of distributed RESs in supporting critical load restoration.The challenge involves implementing initial decisions for a load-restoration process and continuously adapting to fluctuating RES outputs and load forecast with a rolling optimization method.
Kim et al. [33]Mobile energy storageStochastic optimization with the DSO-DERMS interaction frameDeveloped an approach to enhance the investment efficiency of the distribution system operator in mobile energy storage units.The capacity of ES units is limited. Accommodating more ES units for full load shedding is not economically viable.
Table 2. Proactive measures for weather events: strategies for long-term resilience and preparedness.
Weather ConditionConsequenceRemedial Measures (Hardening/Long-Term Measures)
Temperature effects [8,47]
-
Restrict or decrease the maximum power rating of equipment, consequently leading to an increase in energy losses.
-
Guarantee proper trimming of trees situated beneath overhead lines.
High winds, storms, and hurricanes [48,49,50]
-
May result in faults and damage to overhead lines.
-
Harm to the distribution networks.
-
Diverts overhead lines to circumvent wooded areas.
-
Substitute overhead lines with underground cables in forested regions.
-
Substitute conventional bare conductors in medium- and low-voltage circuits with insulated or covered conductors to minimize faults.
-
Incorporate “weak links” into overhead line conductors to allow falling trees to break the conductors without causing damage to poles or towers.
Ice and snow [51]
-
Conductor galloping, leading to failures in lines or supports.
-
It results in flashover (short-circuit) faults.
-
Insulators designed appropriately.
Lightning [52]
-
Flashover incidents (short-circuit faults).
-
The voltage surge generated by a lightning strike can travel through overhead lines, potentially causing harm to equipment such as transformer windings.
-
Install earth wires above the live conductors to lower the possibility of direct lightning strikes on the live conductors.
-
Implement spark gaps and surge arresters.
-
Incorporate an earth wire above the live conductors on distribution circuits, increasing the line’s cost by approximately 10 % .
-
Enhance the grounding of towers.
-
Attach an earthed bonding wire to wooden poles.
-
Employ more advanced surge arresters.
Rains [8]
-
Flashover faults (short-circuits) occur across insulators.
-
Infiltration of water into high-voltage insulators and switchgear, resulting in internal flashovers and catastrophic failures.
-
Utilize waterproof sealing and conduct regular maintenance on insulators and switchgear to prevent water entry and internal flashovers, while concurrently keeping away from situating the equipment in vulnerable areas.
Floods [8]
-
The primary risk is posed to equipment such as switchgear, transformers, and control cubicles situated at the ground level within substations.
-
Regularly evaluate the risk for existing structures in flood-prone regions to identify and implement necessary flood defenses, while also refraining from locating equipment in these vulnerable assessed areas.
Landslides [8]
-
Inflict harm on overhead lines or underground cables.
-
Result in significant damage to a substation or control center.
-
Avoid placing overhead and underground cables in vulnerable areas.
Droughts [53]
-
Diminish the thermal conductivity of the soil, thereby lowering the capacity of underground cables.
-
Diminish its electrical conductivity.
-
Heighten the risk of fires.
-
Under dry conditions, overhead lines could trigger wildfires.
-
The smoke resulting from fires could lead to recurrent arcing.
-
Faults on an overhead line.
-
Wooden poles have the potential to burn, causing damage to conductors and insulators.
-
The management of vegetation beneath and near overhead lines.
-
Employing covered or insulated conductors on overhead lines can eliminate the risk of ignition.
Disclaimer/Publisher’s Note: The statements, opinions and data contained in all publications are solely those of the individual author(s) and contributor(s) and not of MDPI and/or the editor(s). MDPI and/or the editor(s) disclaim responsibility for any injury to people or property resulting from any ideas, methods, instructions or products referred to in the content.

