Article

Study on the Ecological Compensation Standard in the Xinjiang Uygur Autonomous Region of China under the Perspective of Natural Capital Supply and Demand

College of Science, Shihezi University, Shihezi 832000, China
*
Author to whom correspondence should be addressed.
Sustainability 2024, 16(7), 3078; https://doi.org/10.3390/su16073078
Submission received: 5 March 2024 / Revised: 1 April 2024 / Accepted: 2 April 2024 / Published: 8 April 2024
(This article belongs to the Section Environmental Sustainability and Applications)

Abstract

:
The fundamental component of the ecological compensation system, as well as the crucial basis for its efficient functioning, is calculating the ecological compensation amount and establishing the ecological compensation standard. This study integrates the ecological footprint with natural capital monetization and other methods by introducing a natural capital accounting system. From the standpoint of natural capital supply and demand, it also builds an accounting framework for ecological compensation standards that is standardized, dynamic, and regionally differentiated while taking local socioeconomic aspects into account. We determined the amount of ecological compensation by using Xinjiang as the research object and calculating and analyzing the features of regional and temporal changes in the monetary and physical quantities of natural capital in Xinjiang from 2010 to 2020. The findings show that from 2010 to 2020, Xinjiang’s ecological footprint increased by 1.26 times in physical terms and 1.21 times in monetary terms and that its ecological carrying capacity increased by 4.13% in physical terms and 9.42% in monetary terms. The ecological deficit continues to grow in physical and monetary terms, with a per capita ecological deficit in 2020 of 19.92 s-nha/cap and 70,100 CNY/cap in physical and monetary terms, respectively. The amount of ecological compensation required to be paid in Xinjiang increased from CNY 5659 million to CNY 10,259 million, and the per capita ecological compensation payment standard increased from 259.42 CNY/cap/yr to 396.11 CNY/cap/yr. In summary, Xinjiang’s natural capital supply is insufficient to meet the demand for consumption, and the ecological deficit is growing with time, necessitating the payment of ecological compensation. The study’s results lay the foundation for formulating and implementing ecological compensation policies in Xinjiang and provide theoretical support for constructing ecological civilization in Xinjiang. In addition, the ecological compensation accounting framework constructed in this study organically integrates natural capital theory, ecosystem services, and socioeconomic influencing factors, which enriches the methodology of accounting for ecological compensation standards, and, at the same time, can be used as a paradigm of a dynamic and equitable ecological compensation accounting framework to further promote its use at different scales and regions.

1. Introduction

In recent years, the development of regions and countries at different levels of development at the expense of ecological quality and transitional consumption of natural resources has caused the gradual deterioration of the ecological environment, and the contradiction between the environment and development has reached an unprecedented height in the 21st century [1,2,3]. The key to realizing the harmonious coexistence of humans and nature lies in balancing the relationship between the socioeconomy and the ecological environment [4]. The coordinated and consistent development of the two is directly related to a region’s sustainable development level [5]. In existing practice, it can be proven that ecological compensation is a strategy that can effectively solve the contradiction between environment and development [6]. Determining the ecological compensation standard is the premise and key to implementing the ecological compensation system [7]. However, academics have not proposed a uniform methodology for setting ecological compensation standards [8].
In the current study of ecological compensation, scholars have adopted various methods to scientifically and rationally determine feasible ecological compensation standards [9,10,11]. These methods include the cost method (the opportunity cost method, the ecological damage cost method, and the alternative cost method) [12], WTP/WTA (willingness to pay/willingness to accept) [13], the ecosystem service value assessment method [14], and the ecological footprint method [15]. The cost method is highly operable and versatile. It can provide intuitive market-based economic value accounting for regional ecological compensation. However, it also has the limitations of ignoring the reparability of the ecological environment and making it challenging to quantify ecological impacts [16]. WTP/WTA can objectively reflect ecological value and provide the feasibility of mobilizing funds to calculate compensation standards. However, WTP/WTA results mainly depend on respondents’ perceptions of the importance of the ecological environment and natural resources protection, and it takes work to reach an agreement between the payers and the beneficiaries [17]. Internationally, ecological compensation is known as “PES” (payments for ecosystem/environmental services), the essence of which is to internalize the external costs of the ecosystem based on quantifying the value of ecosystem services [18]. Chinese scholars have also integrated multiple ecosystem services into the valuation process by quantifying the value of ecosystem services to determine the theoretical overall economic and social value of ecological compensation [19]. The ecological footprint model consists of two accounting systems: ecological footprint and ecological carrying capacity [20], which reflect the level of human consumption of natural resources and the supply capacity of ecosystems [21]. Therefore, the ecological footprint model can comprehensively reflect the pressure and sustainability of ecosystems [22] and reveal the supply and demand of regional natural resources [23]. Because of its comprehensive and objective nature, some scholars have used it to study ecological compensation standards [24].
With the introduction of a sustainable development strategy and ecological civilization construction in China, people’s attention to ecological compensation has increased. Scholars from all walks of life have gradually increased the number of studies on ecological compensation standards, which has led to the development of many accounting systems that connect and integrate existing methods and models [25]. Accounting for ecological compensation standards from a supply and demand perspective is becoming widely accepted and used in existing studies [26]. Natural capital provides the material basis and environmental conditions for the survival and development of human beings and is characterized by scarcity, mobility, diversity of values, externality, and commonality [27,28]. Therefore, the natural capital accounting system under the perspective of supply and demand opens up new horizons for determining the ecological compensation standard [29]. The System of Environmental–Economic Accounting–Ecosystem Accounting (SEEA-EA) develops an assessment covering natural capital accounting [30]. It emphasizes the accounting of the physical quantity of environmental resources and, at the same time, proposes a way to account for natural capital monetarily and expresses the importance of ecological services through monetary values [31]. SEEA-EA provides an idea for natural capital accounting by converting different forms of natural capital into capital quantities with the same unit of measurement. The ecological footprint is a comprehensive and effective indicator for assessing the utilization of regional natural capital [32]. However, the ecological footprint model lacks consideration of the diversity of ecosystem services, and ecosystem service valuation can compensate for the shortcomings of the ecological footprint model by monetarily estimating the production value of services provided by natural capital to humans [33]. Fewer studies have integrated the two under a coherent accounting framework with seamless integration [34], affecting the accuracy of ecological compensation standards that also require monetized accounting. In addition, for existing ecological compensation studies that combine ecological footprint and ecosystem service value, we found that there are also some problems, such as the accuracy of accounting, poor optimization of model linkage, and the lack of compensation standards and intra-domain allocation [35]. Therefore, this study will introduce ecosystem service equivalence factors (ESEQs) to combine ecological footprints with ecosystem services to realize a reasonable shift from accounting for the physical amount of natural capital to the monetary amount [36]. Based on accounting for the physical and monetary quantities of natural capital and on the supply and demand characteristics of the monetary quantities of natural capital, we will determine the ecological compensation payment areas and beneficiary areas and combine them with regional socioeconomic indicators to determine the ecological compensation standard.
Xinjiang has obvious geographical advantages as a window for China’s “Belt and Road” to open to the West [37]. However, its natural resource endowment is poor. With the development of regional urbanization and industrialization, the consumption of natural capital in the region has surged, and ecological security has been threatened [38]. Therefore, realizing ecological and economic sustainable development is still essential in Xinjiang. On this basis, the research on ecological compensation in Xinjiang was carried out. Firstly, this study improved the ecological footprint model based on regional characteristics, which enhanced the understanding of local ecological conditions. Secondly, introducing the ESEQs to realize the reasonable conversion of natural capital accounting from physical quantities to monetary quantities helped improve the accuracy of natural capital accounting. Thirdly, based on the dynamic changes and spatial heterogeneity of natural capital supply and demand in Xinjiang, this study constructed a research framework for ecological compensation standards, which provided a differentiated payment standard for the ecological compensation standard scheme of various prefectures in Xinjiang and also provided a scientific basis for balancing the interests between regional ecological environment protection and economic development. We hope that the ecological compensation we have studied and determined can provide some constructive references for the coordinated development of the ecological economy in Xinjiang and enrich the framework and methodological system of calculating ecological compensation standards against the background of promoting regional sustainable development.

2. Materials and Methods
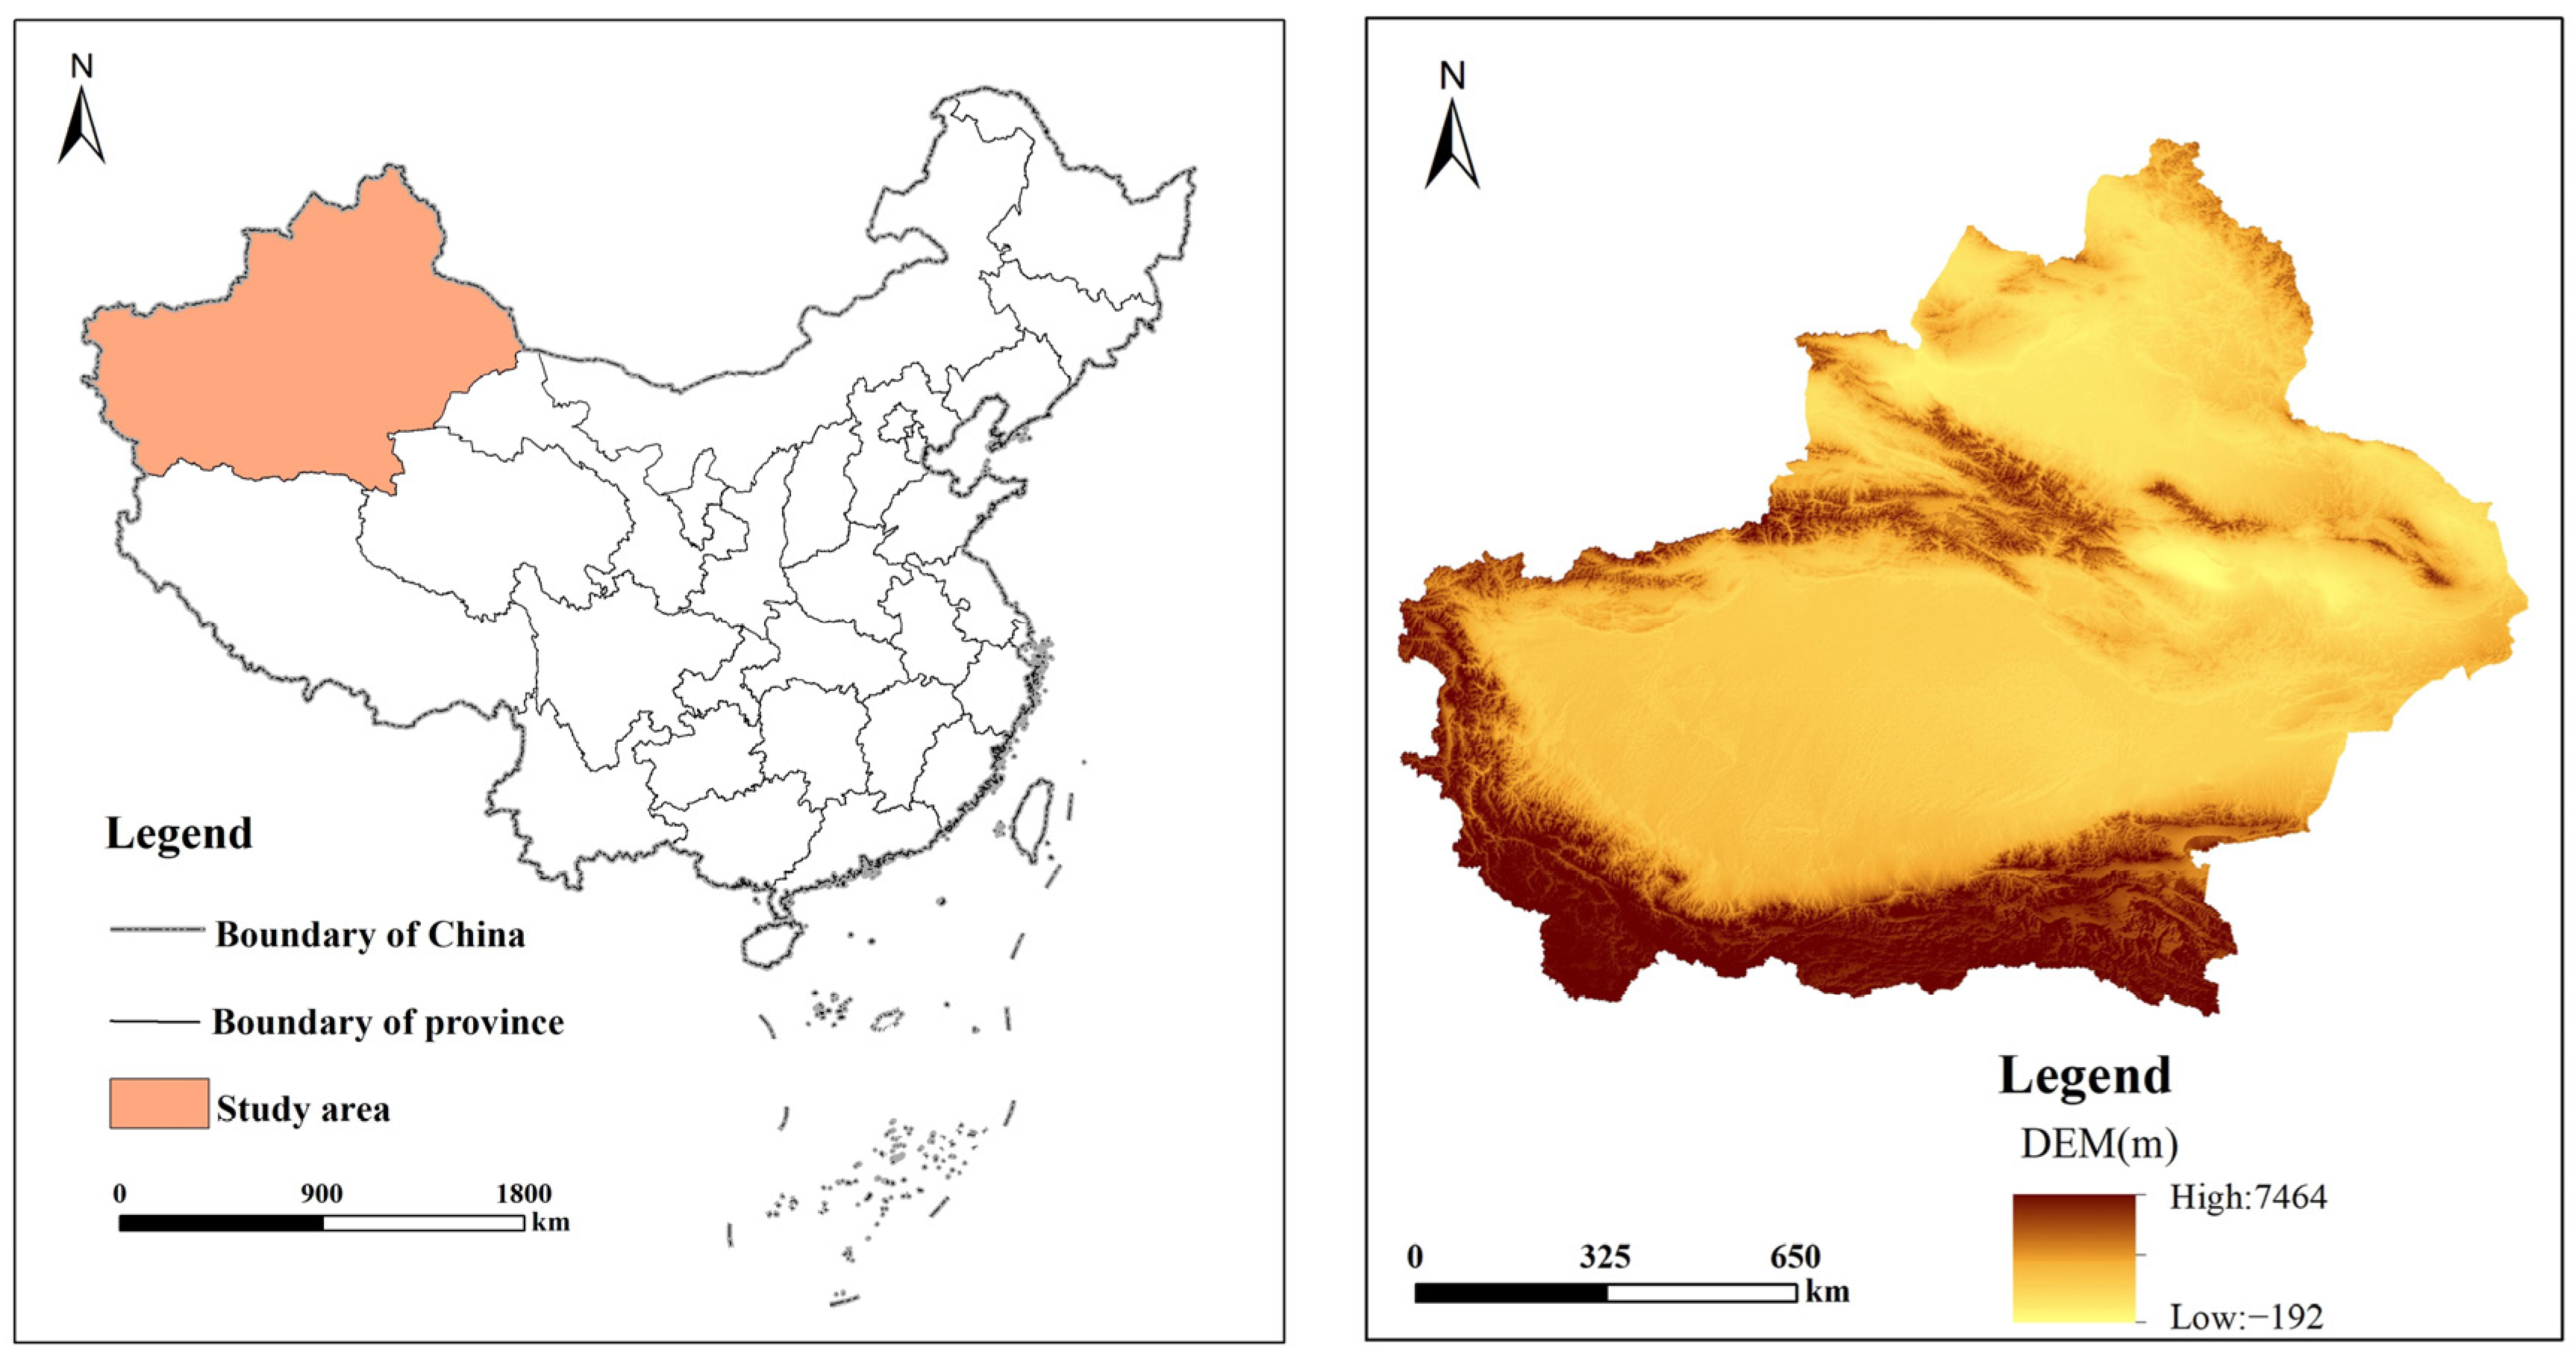
2.1. Study Area

The Xinjiang Uygur Autonomous Region is located in the northwest of China (34°25′–49°10′ N, 73°40′–96°23′ E), with a total area of about 1.66 × 10⁶ km2, accounting for about one-sixth of China’s land area (Figure 1). It is the largest province in China [39]. North of the Tianshan Mountains in Xinjiang is the Junggar Basin, in the south is the Tarim Basin, in the northernmost part are the Altai Mountains, and in the southernmost part are the Kunlun Mountains. Xinjiang is deep inland and far from the ocean. The region is a typical semi-arid and arid area with low precipitation, intense evaporation, a fragile ecological environment, and strong sensitivity. The average annual temperature range is −4.11 °C–17.22 °C, and the precipitation is relatively small. The average annual precipitation is 10.02 mm–588.93 mm [40]. With the development of large-scale and high-intensity industrialization and urbanization in the region in recent years, the consumption rate of natural capital in Xinjiang has exceeded the speed of ecosystem renewal and regeneration [41]. Coordinating the development of ecological construction and economic growth is still arduous. The existing research needs to pay more attention to the ecological compensation in Xinjiang [42]. Therefore, based on the improved natural capital accounting framework, combined with regional socioeconomic indicators, this paper evaluates the utilization of natural capital in Xinjiang from 2010 to 2020, tries to calculate the regional ecological compensation amount, and determines the ecological compensation standard.

2.2. Data Source

In this study, data on biological resources (products produced by biologically productive land), water resources, energy consumption, various pollution emissions, and the socioeconomy were obtained from the 2011–2021 Xinjiang local government statistical yearbook. The land use data and other data were obtained from the results of existing scientific studies (Table 1).

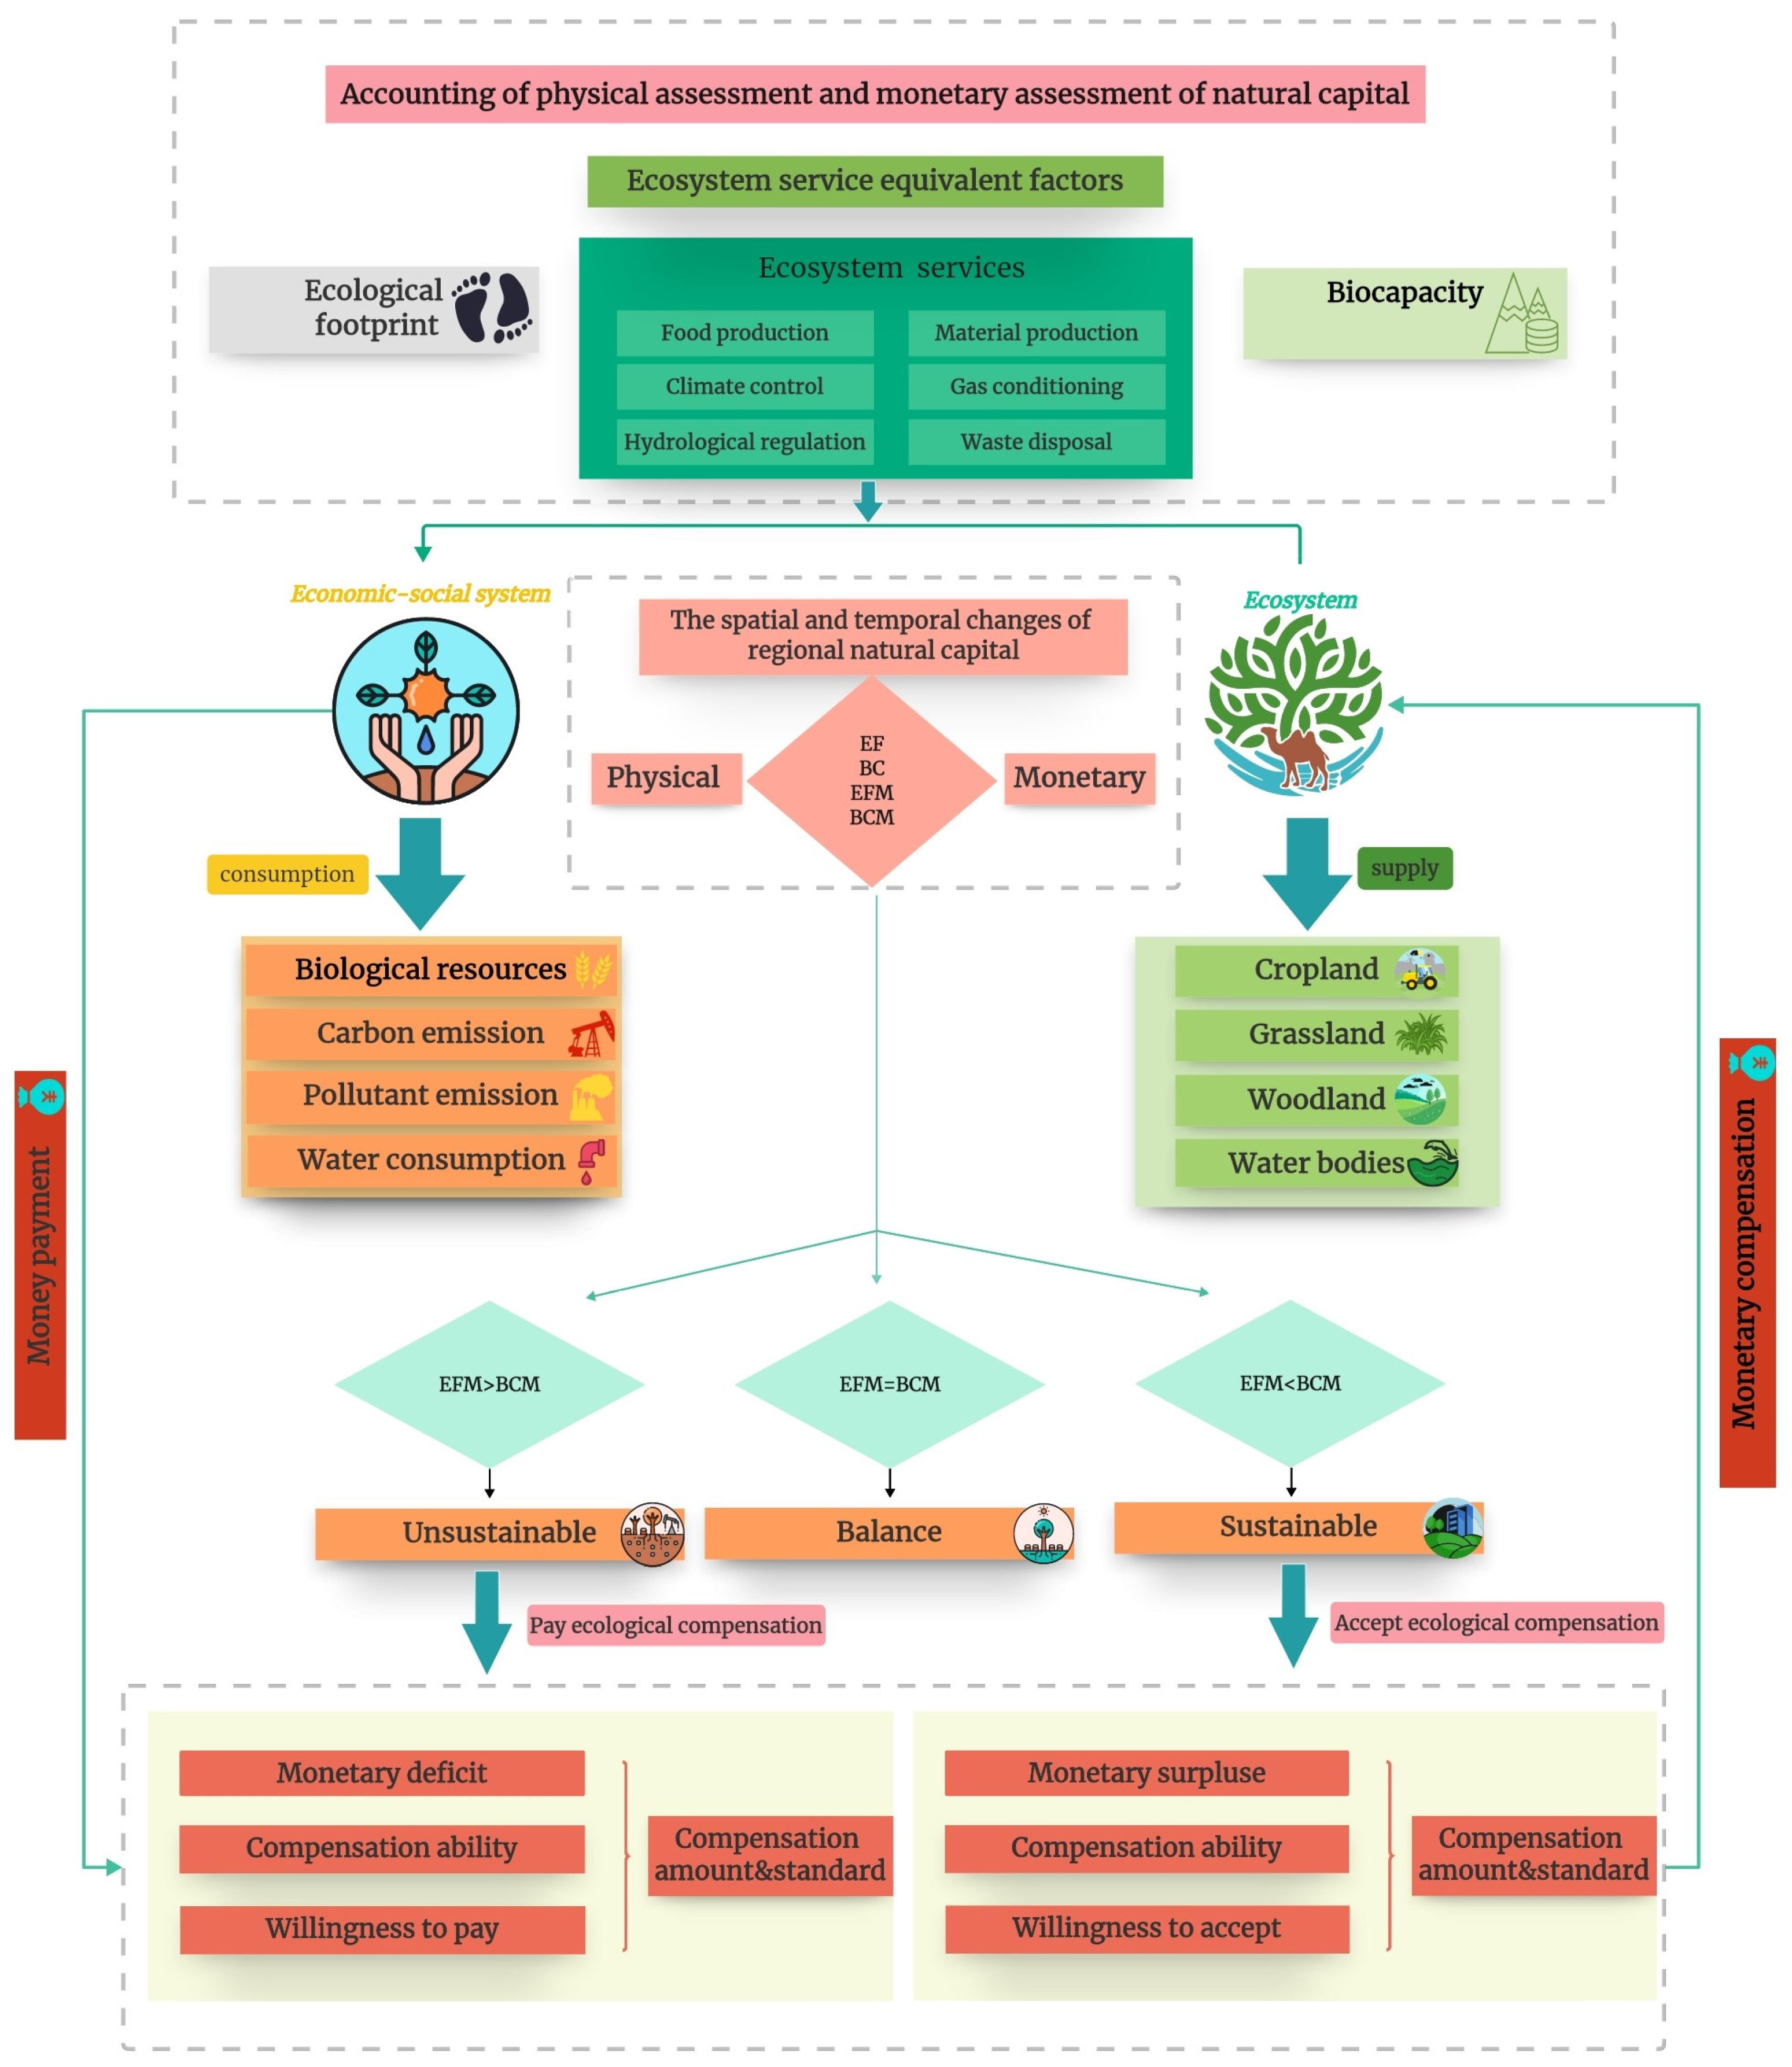
2.3. Research Methodology

Figure 2 shows the basic framework and process of this study, which mainly includes the following parts: First, we included biological accounts, carbon footprint accounts, pollution footprint accounts, and freshwater footprint accounts at the same time, which showed the physical consumption level of natural capital in the economic and social system more comprehensively. Secondly, we introduced the index of ESEQs to connect the value of ecosystem services with the ecological footprint to realize the natural capital monetary (EFM: ecological footprint monetary; BCM: ecological carrying capacity monetary) accounting. In selecting ecosystem service categories, we selected six ecosystem services, namely, food production, material production, gas conditioning, climate control, hydrological regulation, and waste disposal, to correspond to the content of the ecological footprint project. Finally, we judged the compensation method (pay or accept) based on the accounting results of natural capital currency and proposed differentiated ecological compensation standards based on the level of regional social and economic development.

2.3.1. Physical Accounting of the Ecological Footprint

Determination of Critical Factors

The global hectare (gha) refers to the global production of biological products per unit of land area. Similar to the global hectare, the sub-national hectare (s-nha) represents the average productivity of a province’s land. Compared with the global hectare and the national hectare (nha), the sub-national hectare can more accurately reflect the land productivity of specific regions [41]. Therefore, local biological production data in Xinjiang were selected to determine s-nha values in this study. On this basis, the two critical factors of the ecological footprint model, the equivalence factor (EQF) and the yield factor (y), were calculated with reference to the method of Zhang et al. [46]. The EQF is the function of converting various types of biologically productive land into standard areas that can be directly compared. The multi-year average EQFs of Xinjiang’s cropland (EQFc), grassland (EQFg), woodland (EQFo), and water bodies (EQFf) were calculated to be 2.25, 0.49, 0.98, and 0.27, respectively. The yield factor is used to convert areas of the same type of biologically productive land in different regions. The multi-year average yield factors for each land type for each prefecture are shown in Table 2.

Total Ecological Footprint Accounting

The total regional ecological footprint (EF) is the sum of the biological ecological footprint (EFB), the carbon footprint (EFC), the freshwater footprint (EFW), and the pollution footprint (EFP) [32]:
e f = E F N = E F B + E F C + E F W + E F P N
where ef is the ecological footprint per capita and N is the total regional population.

Biological Ecological Footprint Accounting

The biological ecological footprint calculates the total amount of biologically productive land given over to the regional production of biological resources, which is reflected at the production end. Biologically productive land includes cropland, woodland, grassland, and water bodies; the calculation formula is as follows:
E F B = j = 1 4   E Q F j i   c i p i
where EFB is the biological ecological footprint, EQFj is the equivalence factor, ci is the production of biological resources in category i, pi is the average productivity of biological resources in category i, j is the biologically productive land type, and i is the biological resource type.

Carbon Footprint Accounting

The carbon footprint accounting in this paper uses the carbon absorption method [47]. That is, it directly accounts for the area of biologically productive land associated with regional carbon emissions [48]. The traditional carbon sequestration method is characterized by calculating the area of woodland required to absorb the CO2 produced in the region [49]. Since the total area of grassland in Xinjiang accounts for a relatively large area and is much higher than that of several other types of biologically productive land, we used the grassland area for characterization with the following equation:
E F C = Q · E Q F g M g
where EFC denotes the total carbon footprint, EQFg denotes the equivalence factor of grassland, Q denotes the total regional carbon emission, and Mg denotes the carbon sequestration capacity of grassland in Xinjiang. In the most recent study, the Mg in Xinjiang is 0.952 t C/ha/year [40].

Freshwater Footprint Accounting

The freshwater footprint is the direct human use of water resources, including water used for agriculture, industry, domestic use, and artificial ecosystems (water used for artificial ecosystems refers to the water requirements for maintaining and restoring artificial ecosystems under the direct or indirect influence of human activities, which includes the amount of water needed for a variety of ecosystems that have been interfered with or created by humans, e.g., for the irrigation of artificial forests and grasslands, water replenishment of urban green spaces, and the maintenance of artificial wetlands or landscape water bodies), and is calculated by the following formula:
E F W = E Q F W i 4 W i p w
where EFW is the freshwater footprint, EQFW is the water resource equivalence factor (0.192) [32], Wi is the amount of water used by water use category i, i is an indication of the water use category, and pw is the national average production capacity of water resources [50].

Pollution Footprint Accounting

The pollution footprint is an ecological footprint based on pollutant absorption, typically characterized as unavoidable for the region, and must be absorbed by the region. It is characterized by the area of biologically productive land required for total pollutant absorption in the region. Referring to the study of Hong et al. [51], industrial wastewater pollutants (chemical oxygen demand (COD) and ammonia nitrogen (NH3-N)), atmospheric pollutants (sulfur dioxide (SO2) and nitrogen oxides), and solid pollutants were selected. COD and NH3-N were accounted for as water body pollutants, while SO2 and nitrogen oxides, as well as solid pollutants, were accounted for as land-based pollutants. The calculation formula is as follows:
E F P = i u i e i
where EFP is the pollution footprint, ui is the total amount of pollutants for the pollution accounting items of category i, ei is the decontamination coefficient of the pollution items of category i, and i denotes various types of pollution projects. The decontamination coefficients were all obtained by reference to the studies of Bai et al. [52] and Peng et al. [53]. The adsorption capacity of SO2 and NOx per unit area of forest land is 152.05 and 380 kg/ha, respectively. The average amount of wastewater consumed per unit area of water body is 365 t/ha, and the amount of solid waste that can be deposited per unit area of land is 1.09 × 10⁵ t/ha.

Biological Carrying Capacity Accounting

The biological carrying capacity (BC) represents the total amount of biologically productive land that a region can provide for human production and livelihoods [54], and the formula used to calculate BC is as follows:
b c = B C N = ( 1 12 % ) ( S j E Q F j y j ) N
where bc denotes the regional per capita biocapacity, Sj is the actual area of biologically productive land in category j, and EQFj and yj denote the equivalence and yield factors; the final biocapacity should be reduced by 12% to balance the ecological biocapacity base in order to conserve biodiversity [32].

Ecological Deficit/Surplus

When EF is more significant than BC, it is indicated that the regional ecological environment is overloaded and in ecological deficit, and the degree of deficit is characterized by ecological deficit (ED) and vice versa for ecological surplus (ES).
e d = E D N = B C E F N < 0
e s = E S N = B C E F N > 0
where ed and es denote the ecological deficit and the ecological surplus per capita, respectively.

2.3.2. Ecological Footprint Monetary Volume Accounting

Determining the Ecosystem Service Equivalence Factors (ESEQs)

We introduced ESEQs according to Zhang et al. [36] in order to realize the matching of the biological production capacity and the ecosystem service value for each category, referring to the study of Niccolucci et al. [33], where analogous equivalence factors recalculated different land types into comparable land areas with biological productivity. The market value of bioproductive cropland, woodland, grassland, and water bodies is highly correlated with the production value of four types of industries: agriculture, forestry, animal husbandry, and fishery. Therefore, ESEQs derived from the ratio of the production value per unit area of a specific industry to the average production value of all industries allow for converting all biologically productive land areas into comparable market values. The formula for ESEQs is as follows:
E S E Q j = V j V
where ESEQj is the ecosystem service equivalence factor of land category j, Vj is the output value per unit area of the jth industry, and V denotes the total output value per unit area of agriculture, forestry, animal husbandry, and fishery.

Determining the Sub-National Hectare in Monetary Terms

Based on the ESEQs and ecosystem service value accounting mentioned above, we calculated the provincial hectare values of different land categories. Six ecosystem services were chosen to determine the ecosystem service value per unit area, with reference to the research conducted by Xie et al. [55] on ecosystem service equivalent variables (Table 3). According to Xie et al. [56], the average economic value of grain production per unit area in the region equals one-seventh of the ecological service value of a standard equivalent factor. In order to eliminate the impact of inflation, the regional GDP deflator was used to adjust the calculation results to the comparable price in 2010 [57]. The calculation formula is as follows:
t V j = E S V j P G D P y E S E Q j
E S V j = i n k i j E a
where tVj is the value of ecosystem services for the sub-national hectare of land category j (CNY/s-nha), ESVj is the value of ecosystem services per unit area of land category j (CNY/s-nha), PGDPy is the GDP deflator of year y, ki denotes the sum of the equivalence factors for each ecosystem service function of land category j, and Ea is the amount of ecosystem service value of an equivalence factor.

Monetary Accounting of the Ecological Footprint

The ecological footprint monetary volume is accounted for using the results of the ecological footprint physical volume accounting and the provincial hectare monetary value with the following accounting formulas:
e f m = E F M N = j E F j t V j N
b c m = B C M N = j B C j t V j N
e d m = E D M N = j E D j t V j N
e s m = E S M N = j E S j t V j N
where efm, bcm, esm, and edm are the monetary amounts for per capita ecological footprint, biological carrying capacity, ecological surplus, and ecological deficit and EFM, BCM, ESM, and EDM are the total monetary amounts for ecological footprint, ecological carrying capacity, ecological surplus, and ecological deficit.

2.3.3. Accounting for Ecological Compensation Standards

Reasonable ecological compensation should consider economic and ecological dimensions [35], so this study comprehensively applied the theoretical methods of ecological footprint cargo, ecosystem service value, and ecosystem service equivalence factors. Based on the monetary value of the regional ecological footprint, the deficit and surplus states of its monetary volume were used to express the regional resource utilization level. An ecological compensation model was constructed to calculate the total amount of regional ecological compensation by combining the ecological compensation coefficients and the level of regional socioeconomic development, and the model formulas are as follows:
e c p = E C p N = | E D M | K θ δ N
e c g = E C g N = E S M K θ λ N
K θ = L θ e ε e ε + 1 = e ε G D P θ ( e ε + 1 ) G D P
where ecp and ecg represent the regional per capita ecological compensation payment and accepted standards; ECp and ECg denote the total amount of regional ecological compensation payment and the total compensation; Kθ, Lθ, and GDPθ are the ecological compensation coefficient, the ecological compensation capacity, and the regional gross domestic product of area θ, respectively; ε is the regional Engel’s coefficient; e is a natural constant; and δ denotes the coefficient of regional willingness to pay for ecological compensation. Considering that the overall socioeconomic development of the study area is relatively backward, δ was taken as 10%. λ denotes the coefficient of regional willingness to accept ecological compensation, and obtaining ecological compensation is in the interests of the local government and residents, so λ was taken as 1 [15].

3. Results

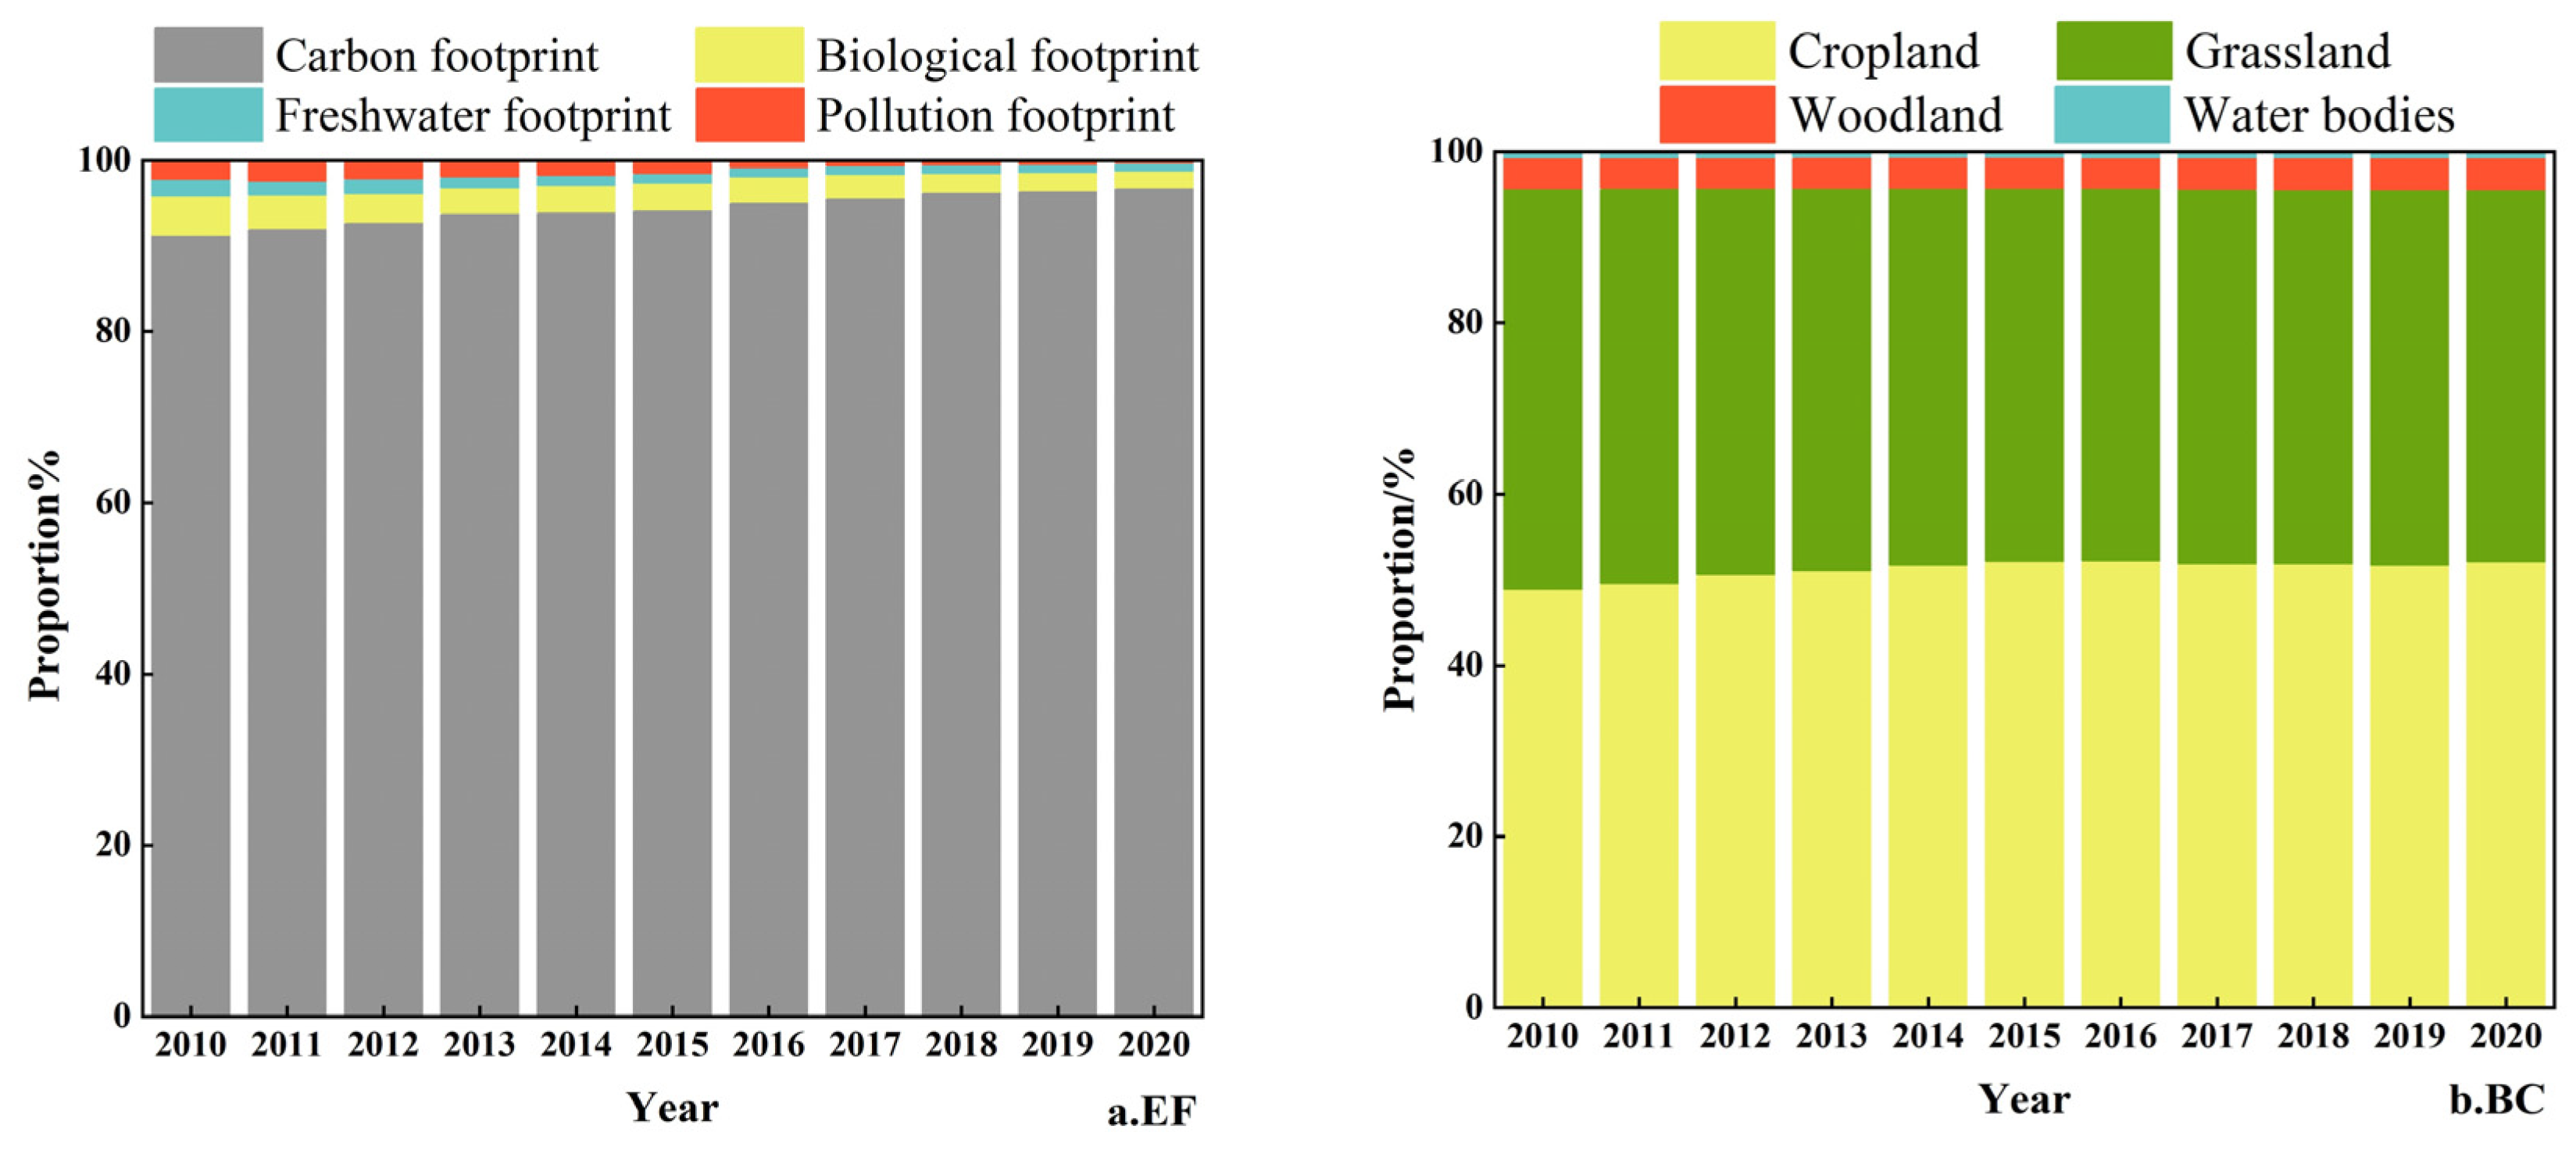
3.1. Changes in EF and BC Dynamics in Xinjiang

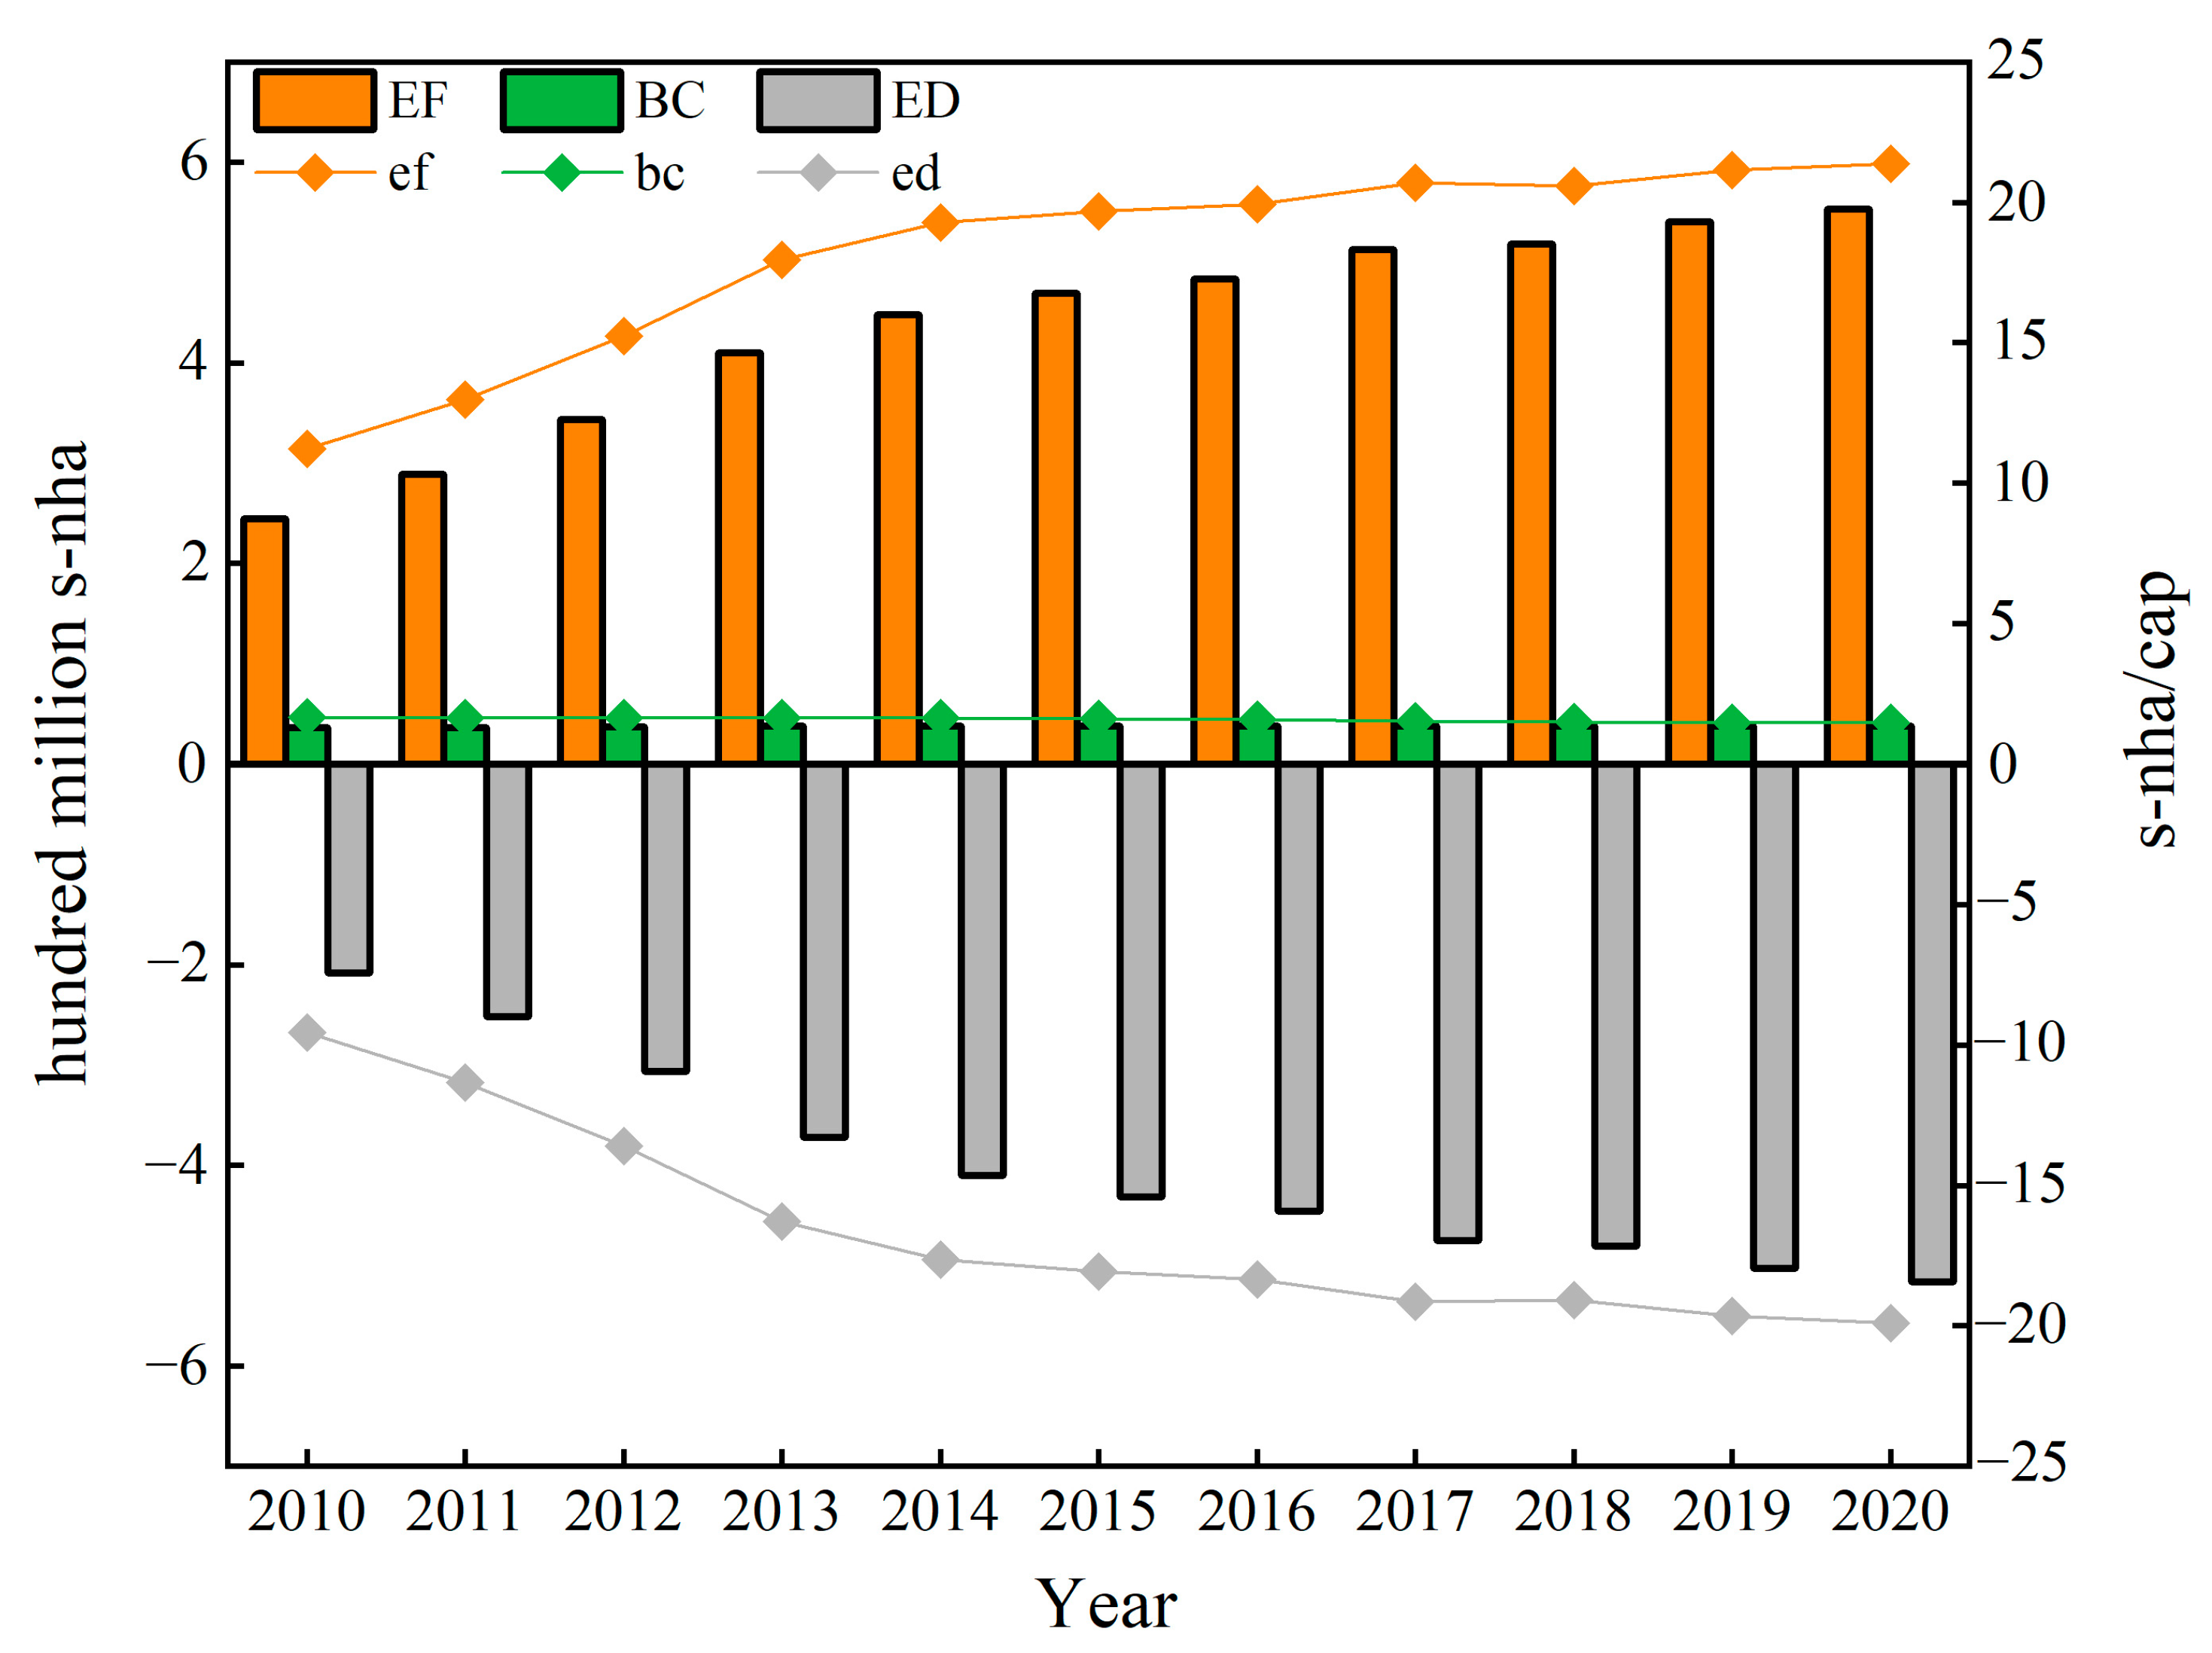
3.1.1. Changes in Total and Per Capita EF, BC, and ED in Xinjiang

The EF in Xinjiang increased year by year, with an average annual growth rate of 28.18 million s-nha/a (Figure 3). The BC increased slightly (1.48 million s-nha) over 11 years. The BC fluctuated above and below the mean value of 37.26 million s-nha, with fluctuations ranging from −0.56% to 1.39%. The ED grew from −209 million s-nha in 2010 to −516 million s-nha in 2020, with an average annual growth rate of −0.28 million s-nha/year. In terms of per capita numbers, the ef grew from 11.22 s-nha/cap in 2010 to 21.37 s-nha/cap in 2020 (an average annual growth rate of 8.22%) and the bc stabilized at 1.46–1.66 s-nha/cap and showed a decreasing trend year by year. The ed increased year by year during the study period, but the growth rate slowed down significantly after 2014, increasing 1.08 times in 11 years.
Figure 4 shows the structural changes in the EF and BC in Xinjiang from 2010 to 2020, with the carbon footprint representing the largest share of EF, followed by the biological footprint, the freshwater footprint, and the pollution footprint. The share of the carbon footprint increased yearly during the study period. The share of the biological footprint showed a fluctuating downward trend, with an average annual decrease of 0.23%. From 1.99% in 2010 to 0.89% in 2020, the freshwater footprint share declined yearly, exhibiting a total decline of 1.10%. The percentage of the pollutant footprint declined annually, from 2.18% in 2010 to 0.30% in 2020. The structures of the BC and EF were also stable, with cropland having the largest share of the carrying capacity, followed by grassland, woodland, and water bodies. The cropland, grassland, woodland, and water body carrying capacity ratios in 2020 were 48.90%, 46.80%, 3.63%, and 0.67%. The carrying capacity ratios for arable land, woodland, and water bodies increased by 3.16%, 0.09%, and 0.05%, respectively, and the ecological carrying capacity ratio of grassland decreased by 3.3% during the study period.

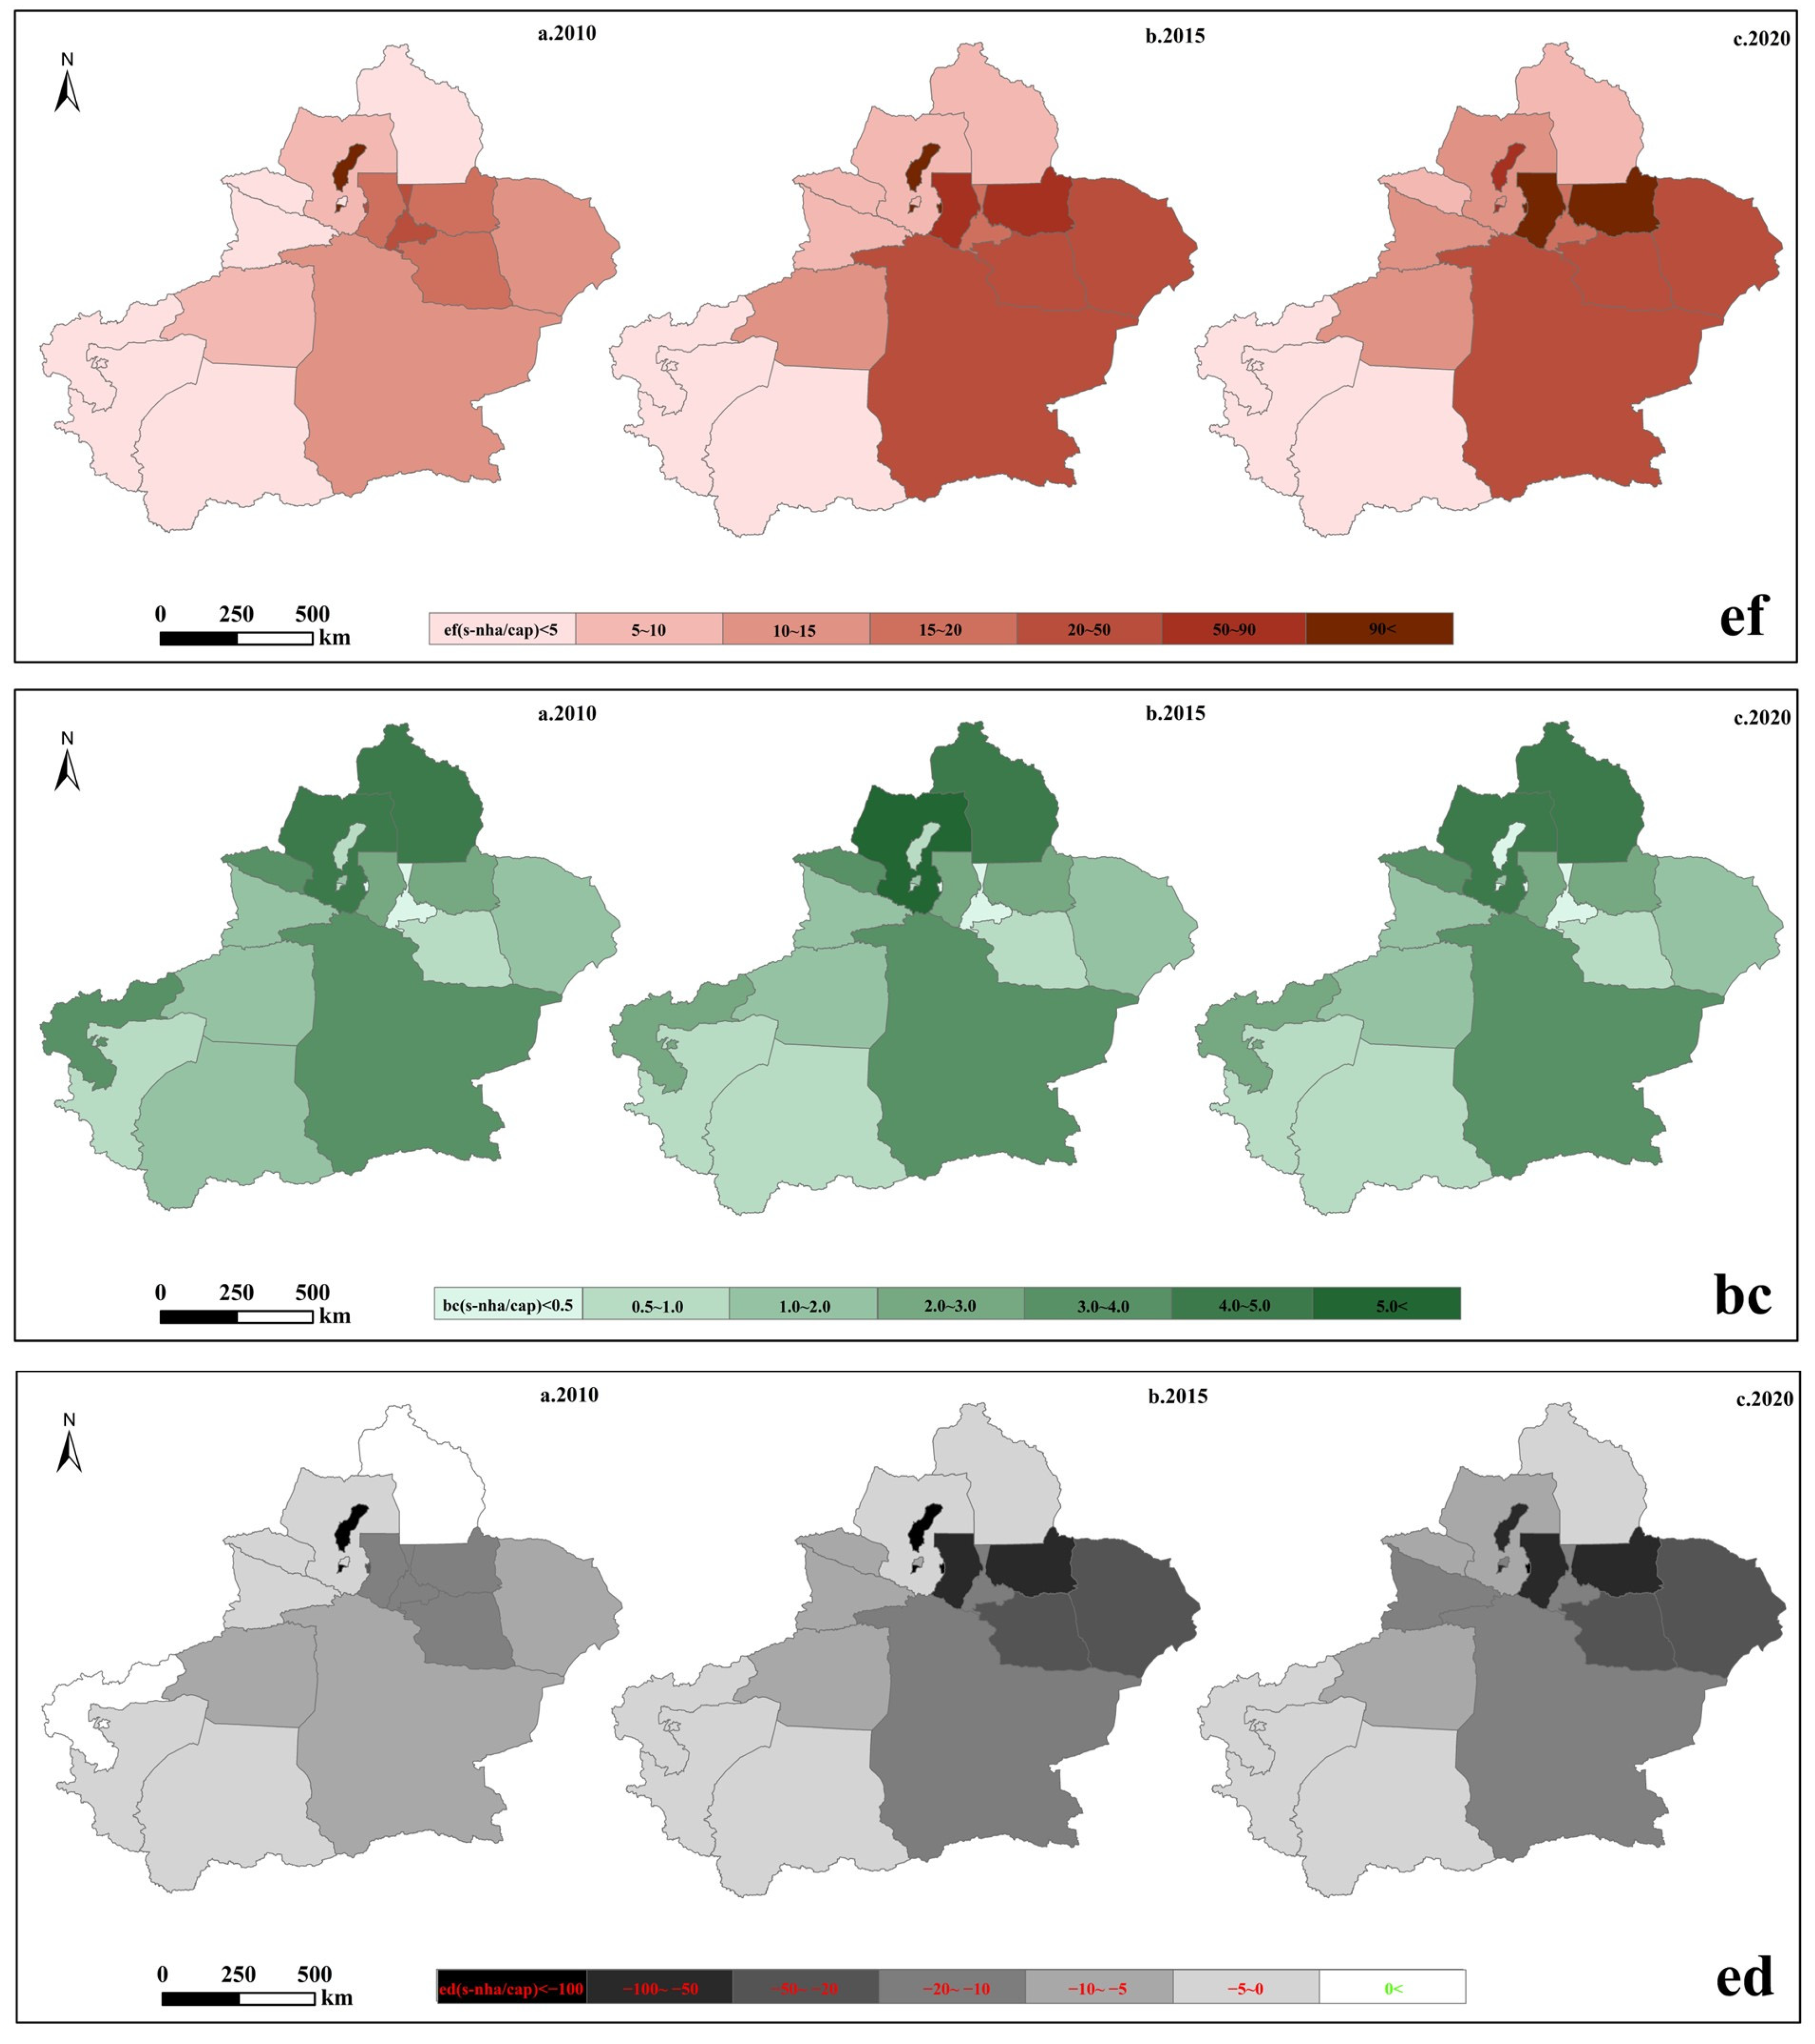
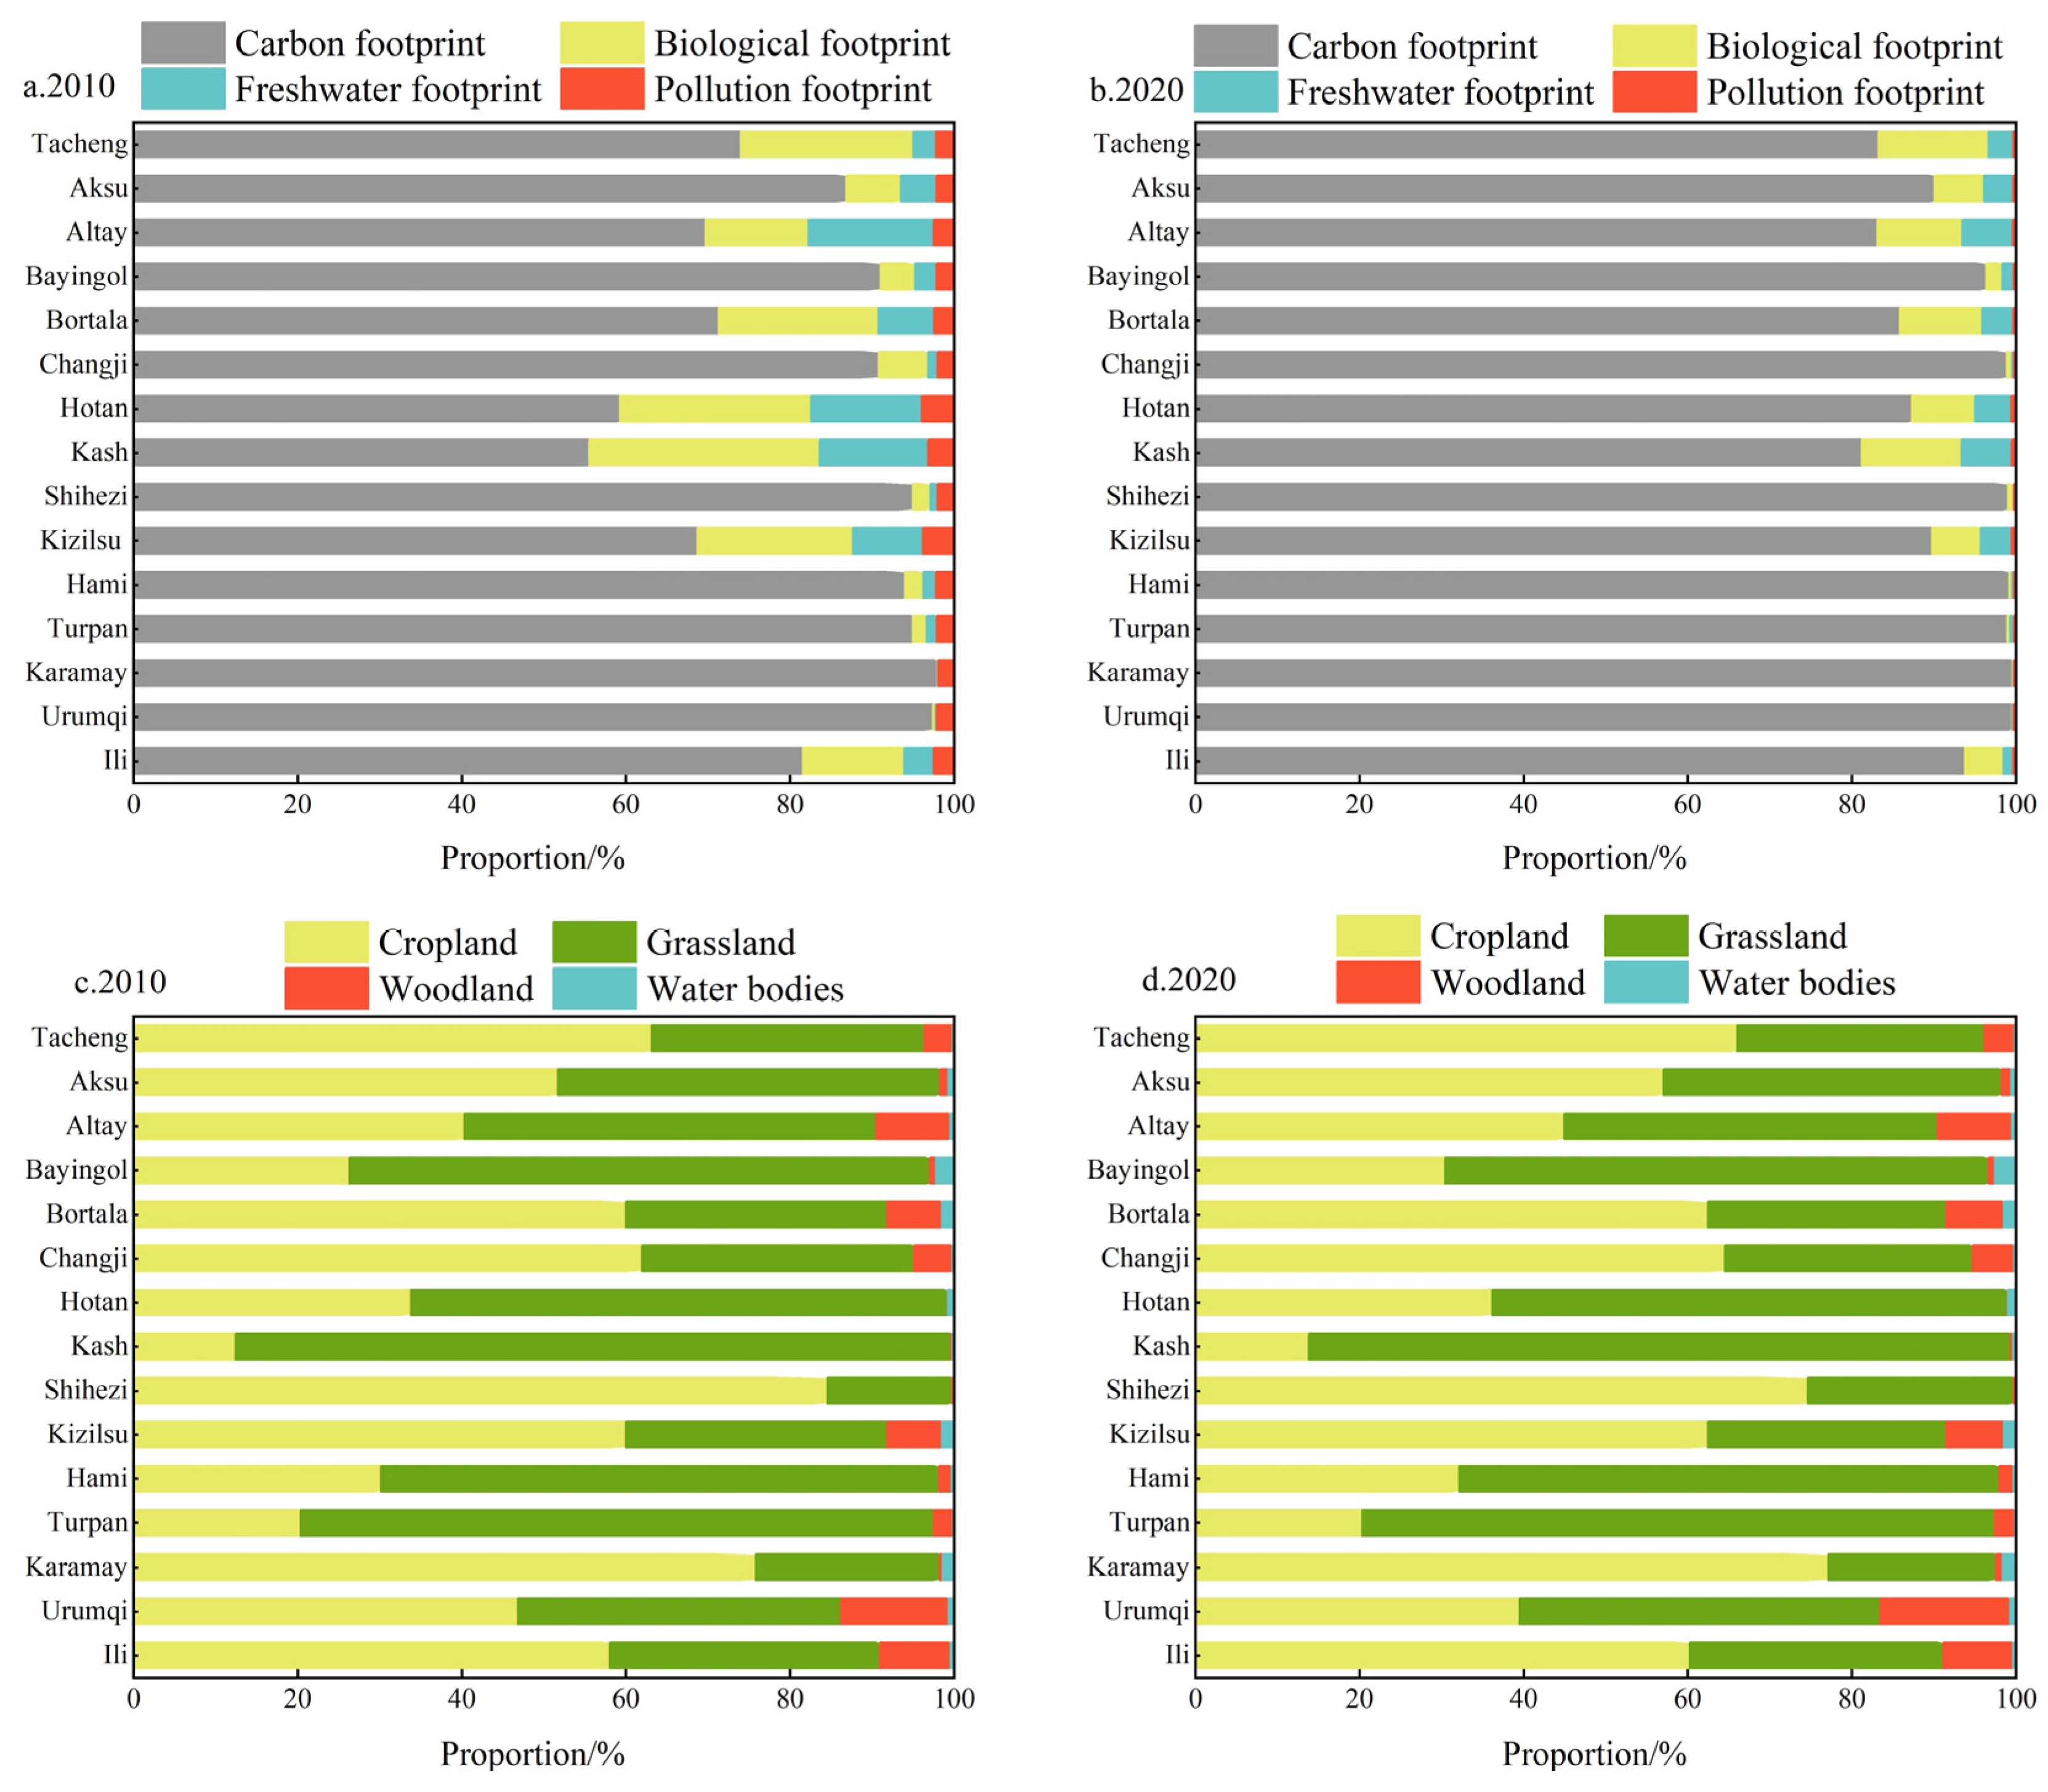
3.1.2. Partitioning Analysis of ef, bc, and ed in Xinjiang

On the whole area scale, Xinjiang’s ef and ed showed an upward trend, its bc showed a downward trend, and there was a significant difference in the changes between the prefectures. Among them, the efs of Changji, Hami, Shihezi, Ili, Kizilsu, and Turpan grew faster (Figure 5), with annual average growth rates of 40.14%, 35.78%, 35.72%, 16.00%, 14.5%, and 12.72%. The efs of Hotan, Bortala, Kash, Altay, Tacheng, Bayingol, and Aksu grew relatively slowly, with average annual growth rates of 11.45%, 9.40%, 7.69%, 7.13%, 7.05%, and 6.84%. Urumqi’s and Keramay’s efs displayed a declining trend; Keramay’s ef had an average yearly shrinkage rate of −2.86%, while Urumqi’s ef exhibited only a slight variation at −0.24%. In terms of ef average annual growth, the rankings over the study period were as follows: Shihezi > Changji > Hami > Turpan > Bayingol > Ili > Tacheng > Bortala > Altay > Kizilsu > Hotan > Kashi > Aksu > Urumqi > Karamayi. Most of Xinjiang’s prefectures showed a decreasing trend in bc, with only Bortala and Altay increasing their bcs from 3.09, 4.25 s-nha/cap in 2010 to 3.27, 4.33 s-nha/cap in 2020. In contrast to ef, the magnitude of change in bc was relatively small, with its average annual change of no more than 4.31%. The ec rankings for the Xinjiang prefectures in 2020 were as follows: Tacheng > Altay > Bortala > Bayingol >Kizilsu > Changi > Aksu > Ili > Hami > Turpan > Hotan > Kash > Karamay > Urumqi > Shihezi. While the other prefectures were always in ecological deficits over the study period, Kizilsu and Altay were in ecological surplus in 2010, and both turned into ecological deficits after 2014. Tacheng, Changji, Hami, and Hotan had faster negative growth in ed, with average annual growth rates of 60.24%, 46.62%, 40.48%, 39.66%. The ranking of the remaining prefectures with respect to ed negative growth rate was as follows: Bortala (36.57%) > Shihezi (35.85%) > Ili (25.35%) > Turpan (13.58%) > Kash (13.10%) > Bayingol (10.39%) > Aksu (1.66%) > Urumqi (−0.19%) > Karamay (−2.87%).
There are differences in the composition of ef across Xinjiang (Figure 6). However, the carbon footprint still represents highest share because the development of regional energy-consumption-related industries is growing much faster than that of other industries. Each prefecture’s average share of the carbon footprint grew from 81.86% in 2010 to 92.38% in 2020. Among them, Karamay is the prefecture with the highest carbon footprint, with 99.57% in 2020, while Tacheng has the lowest carbon footprint, with 81.18% in 2020. The carbon footprint share of the South Xinjiang region grew faster, the fastest rate being observed in Hotan, whose carbon footprint share grew from 59.23% in 2010 to 87.27% in 2020. The freshwater, pollution, and biological footprint shares were lower than the carbon footprint share and showed a decreasing trend. The composition of bc in all Xinjiang prefectures is dominated by cropland and grassland, but there are significant differences in the composition proportions. The prefectures where grassland contributes more to bc include Kash, Turpan, Bayingol, Hami, and Hotan, with grassland bc accounting for 85.58%, 77.07%, 66.22%, 65.83%, and 62.79% in 2020. All the others are prefectures where cropland contributes more to bc, and cropland bc in Karamay had the largest bc share of 77.13% in 2020. The prefecture with the highest proportion of woodland bc is Urumqi, and the prefecture with the highest proportion of water body bc is Bayingol.

3.2. Changes in EFM and BCM Dynamics in Xinjiang

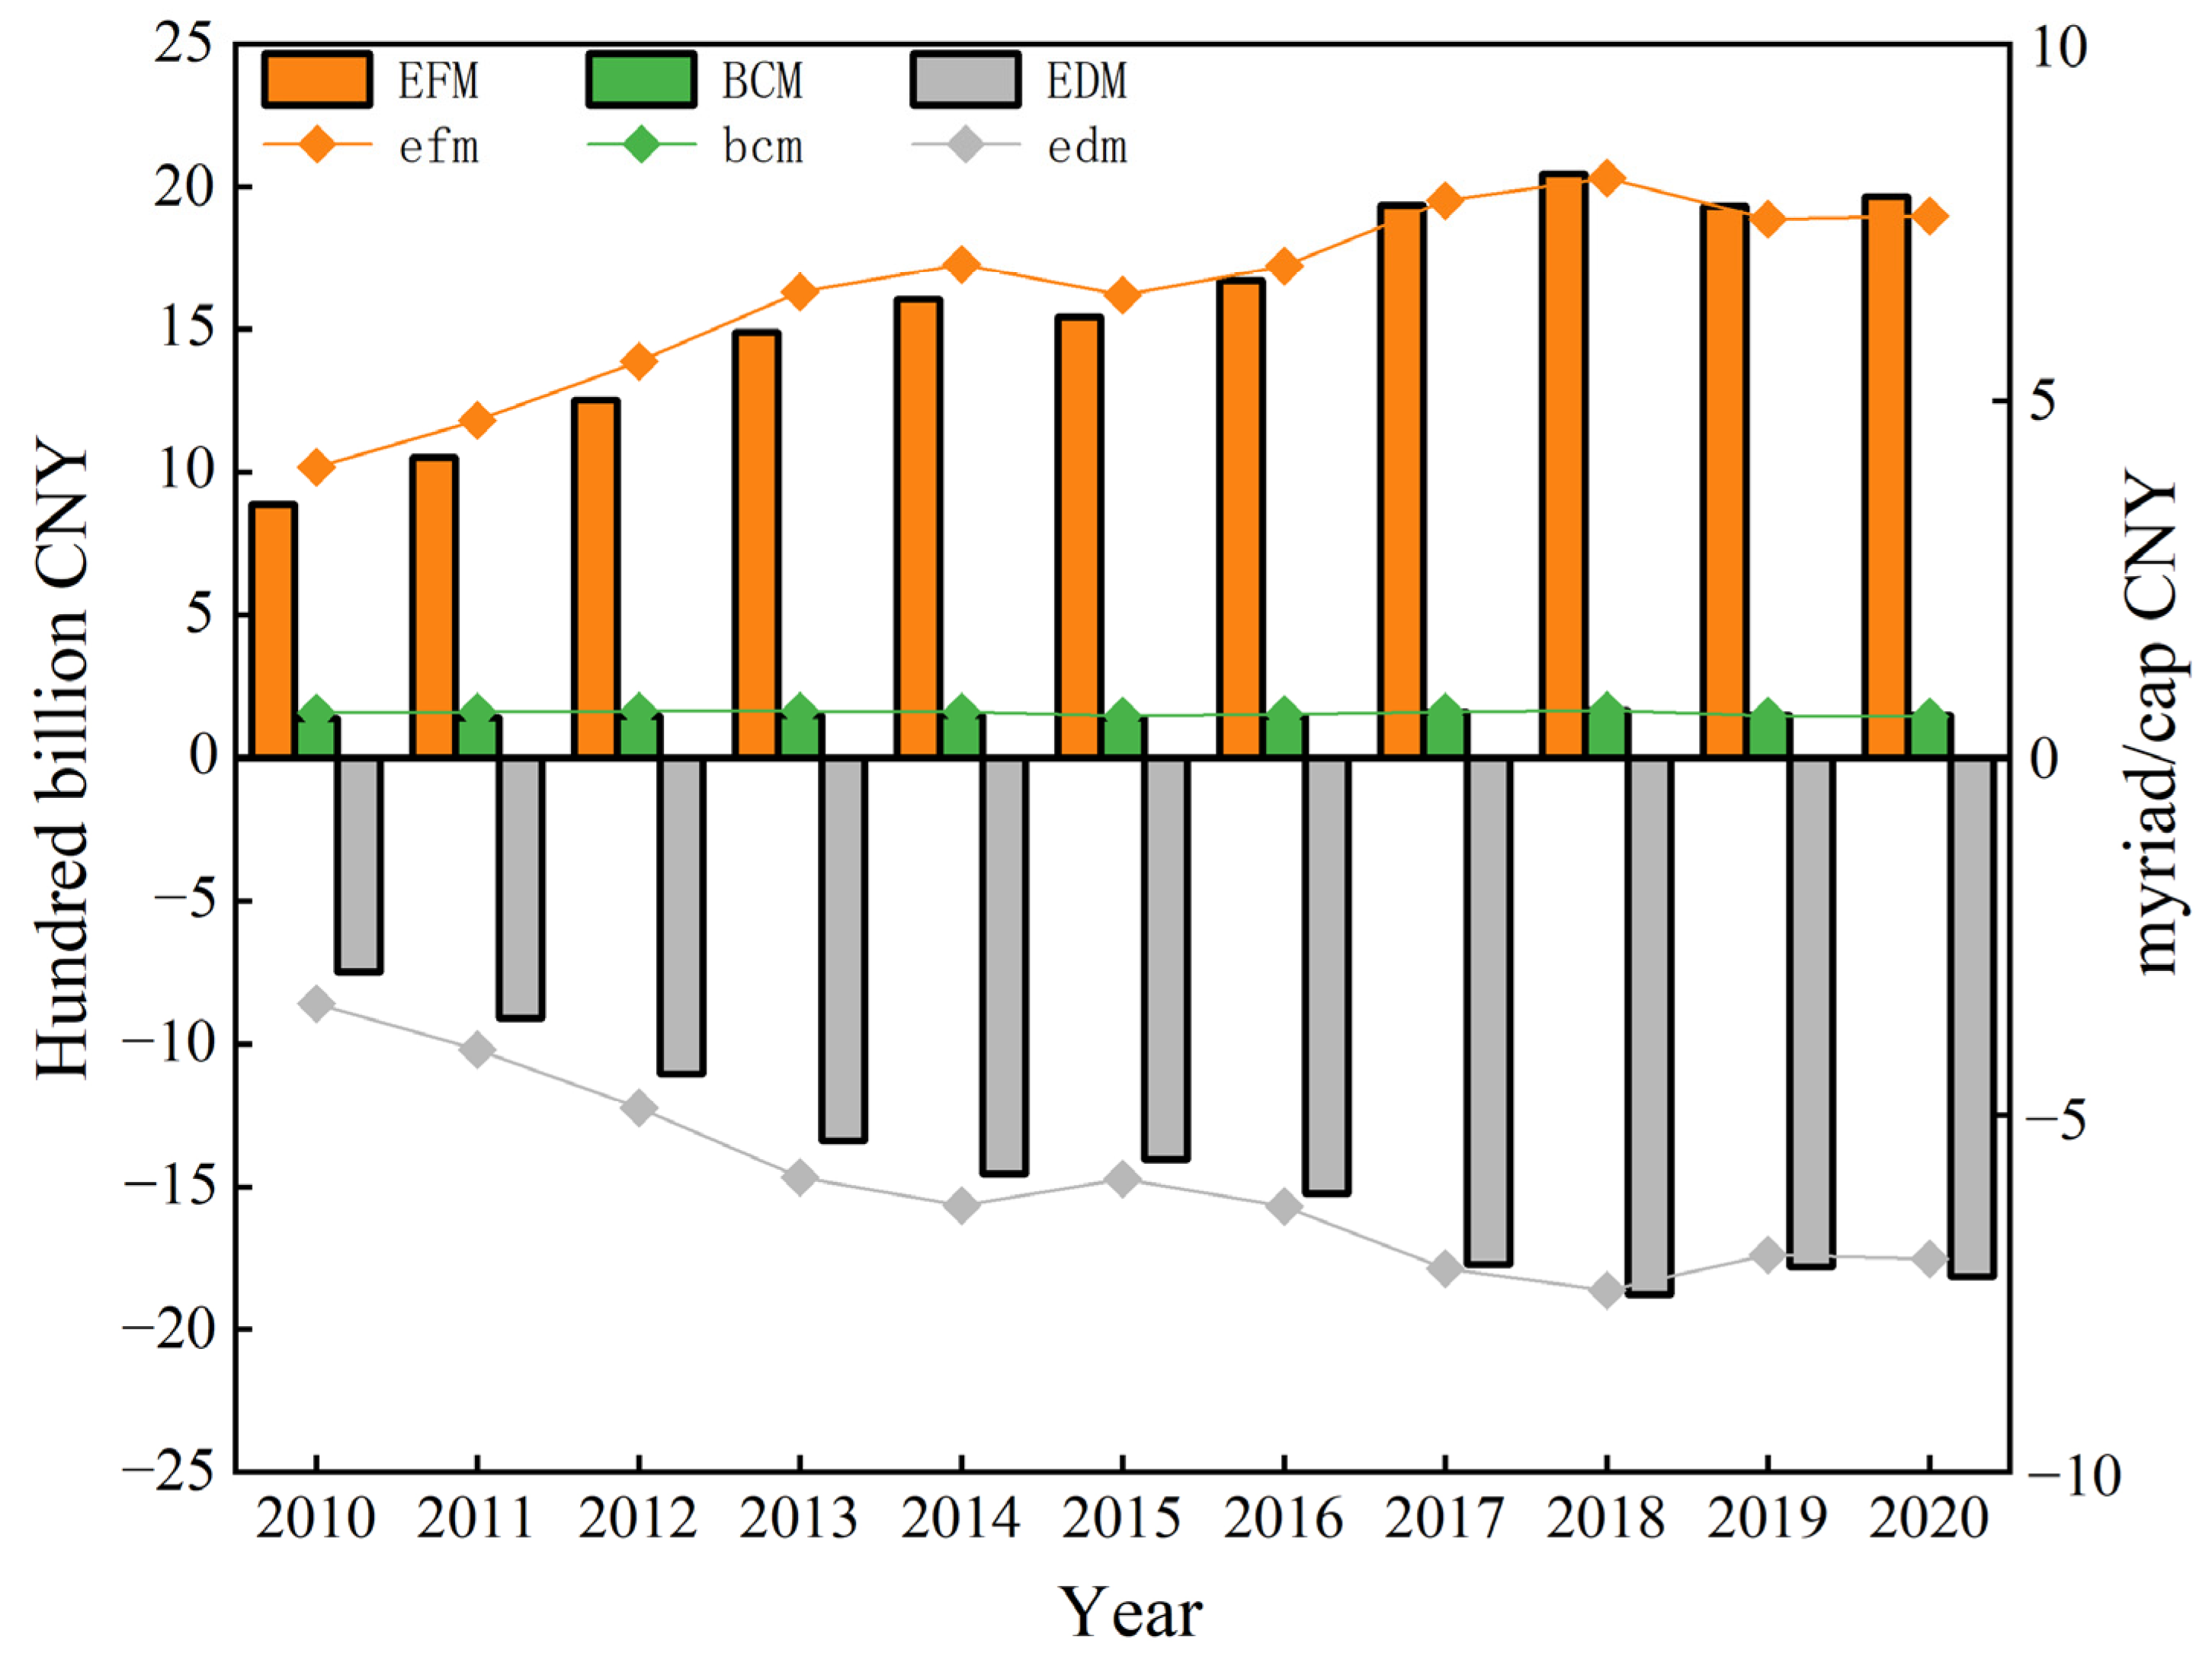
3.2.1. Changes in Total and per Capita Volumes of EFM, BCM, and EDM

Monetized accounting of EF, BC, and ED in Xinjiang from 2010 to 2020 was carried out according to Equations (9)–(15), and the results are shown in Figure 7. EFM grew from CNY 887.923 billion in 2010 to CNY 1.96 trillion in 2020, a total increase of 1.20 times. BCM grew from CNY 138,560 million in 2010 to CNY 150,642 million in 2020, a relatively small change of only 8.72%. The size of the ecological deficit in Xinjiang was higher than the size of the biological carrying capacity during the study period, and the size of the deficit increased negatively from CNY −749 billion in 2010 to CNY −1815 billion in 2020, with the peak of the total deficit monetary amount peaking at CNY −1878 billion in 2018. Regarding per capita efm, it grew from 40.7 thousand CNY/cap in 2010 to 75.9 thousand CNY/cap in 2020, with two growth periods, 2010~2014 and 2016~2018, peaking at 81.2 thousand CNY/cap in 2018. Regional population growth was significantly faster than the rate of environmental improvement, with bcm shrinking from 6.4 thousand CNY/cap in 2010 to 0.58 thousand CNY/cap in 2020. edm negative growth tended to converge with efm, increasing from −34.4 thousand CNY/cap in 2010 to −70.1 thousand CNY/cap in 2020, which shows that Xinjiang has consumed a large amount of ecological capital during its development in recent years. However, the deficit in 2018 slowed down after reaching its peak, indicating that the impairment of natural capital at the monetary level had been curbed and improved to some extent.

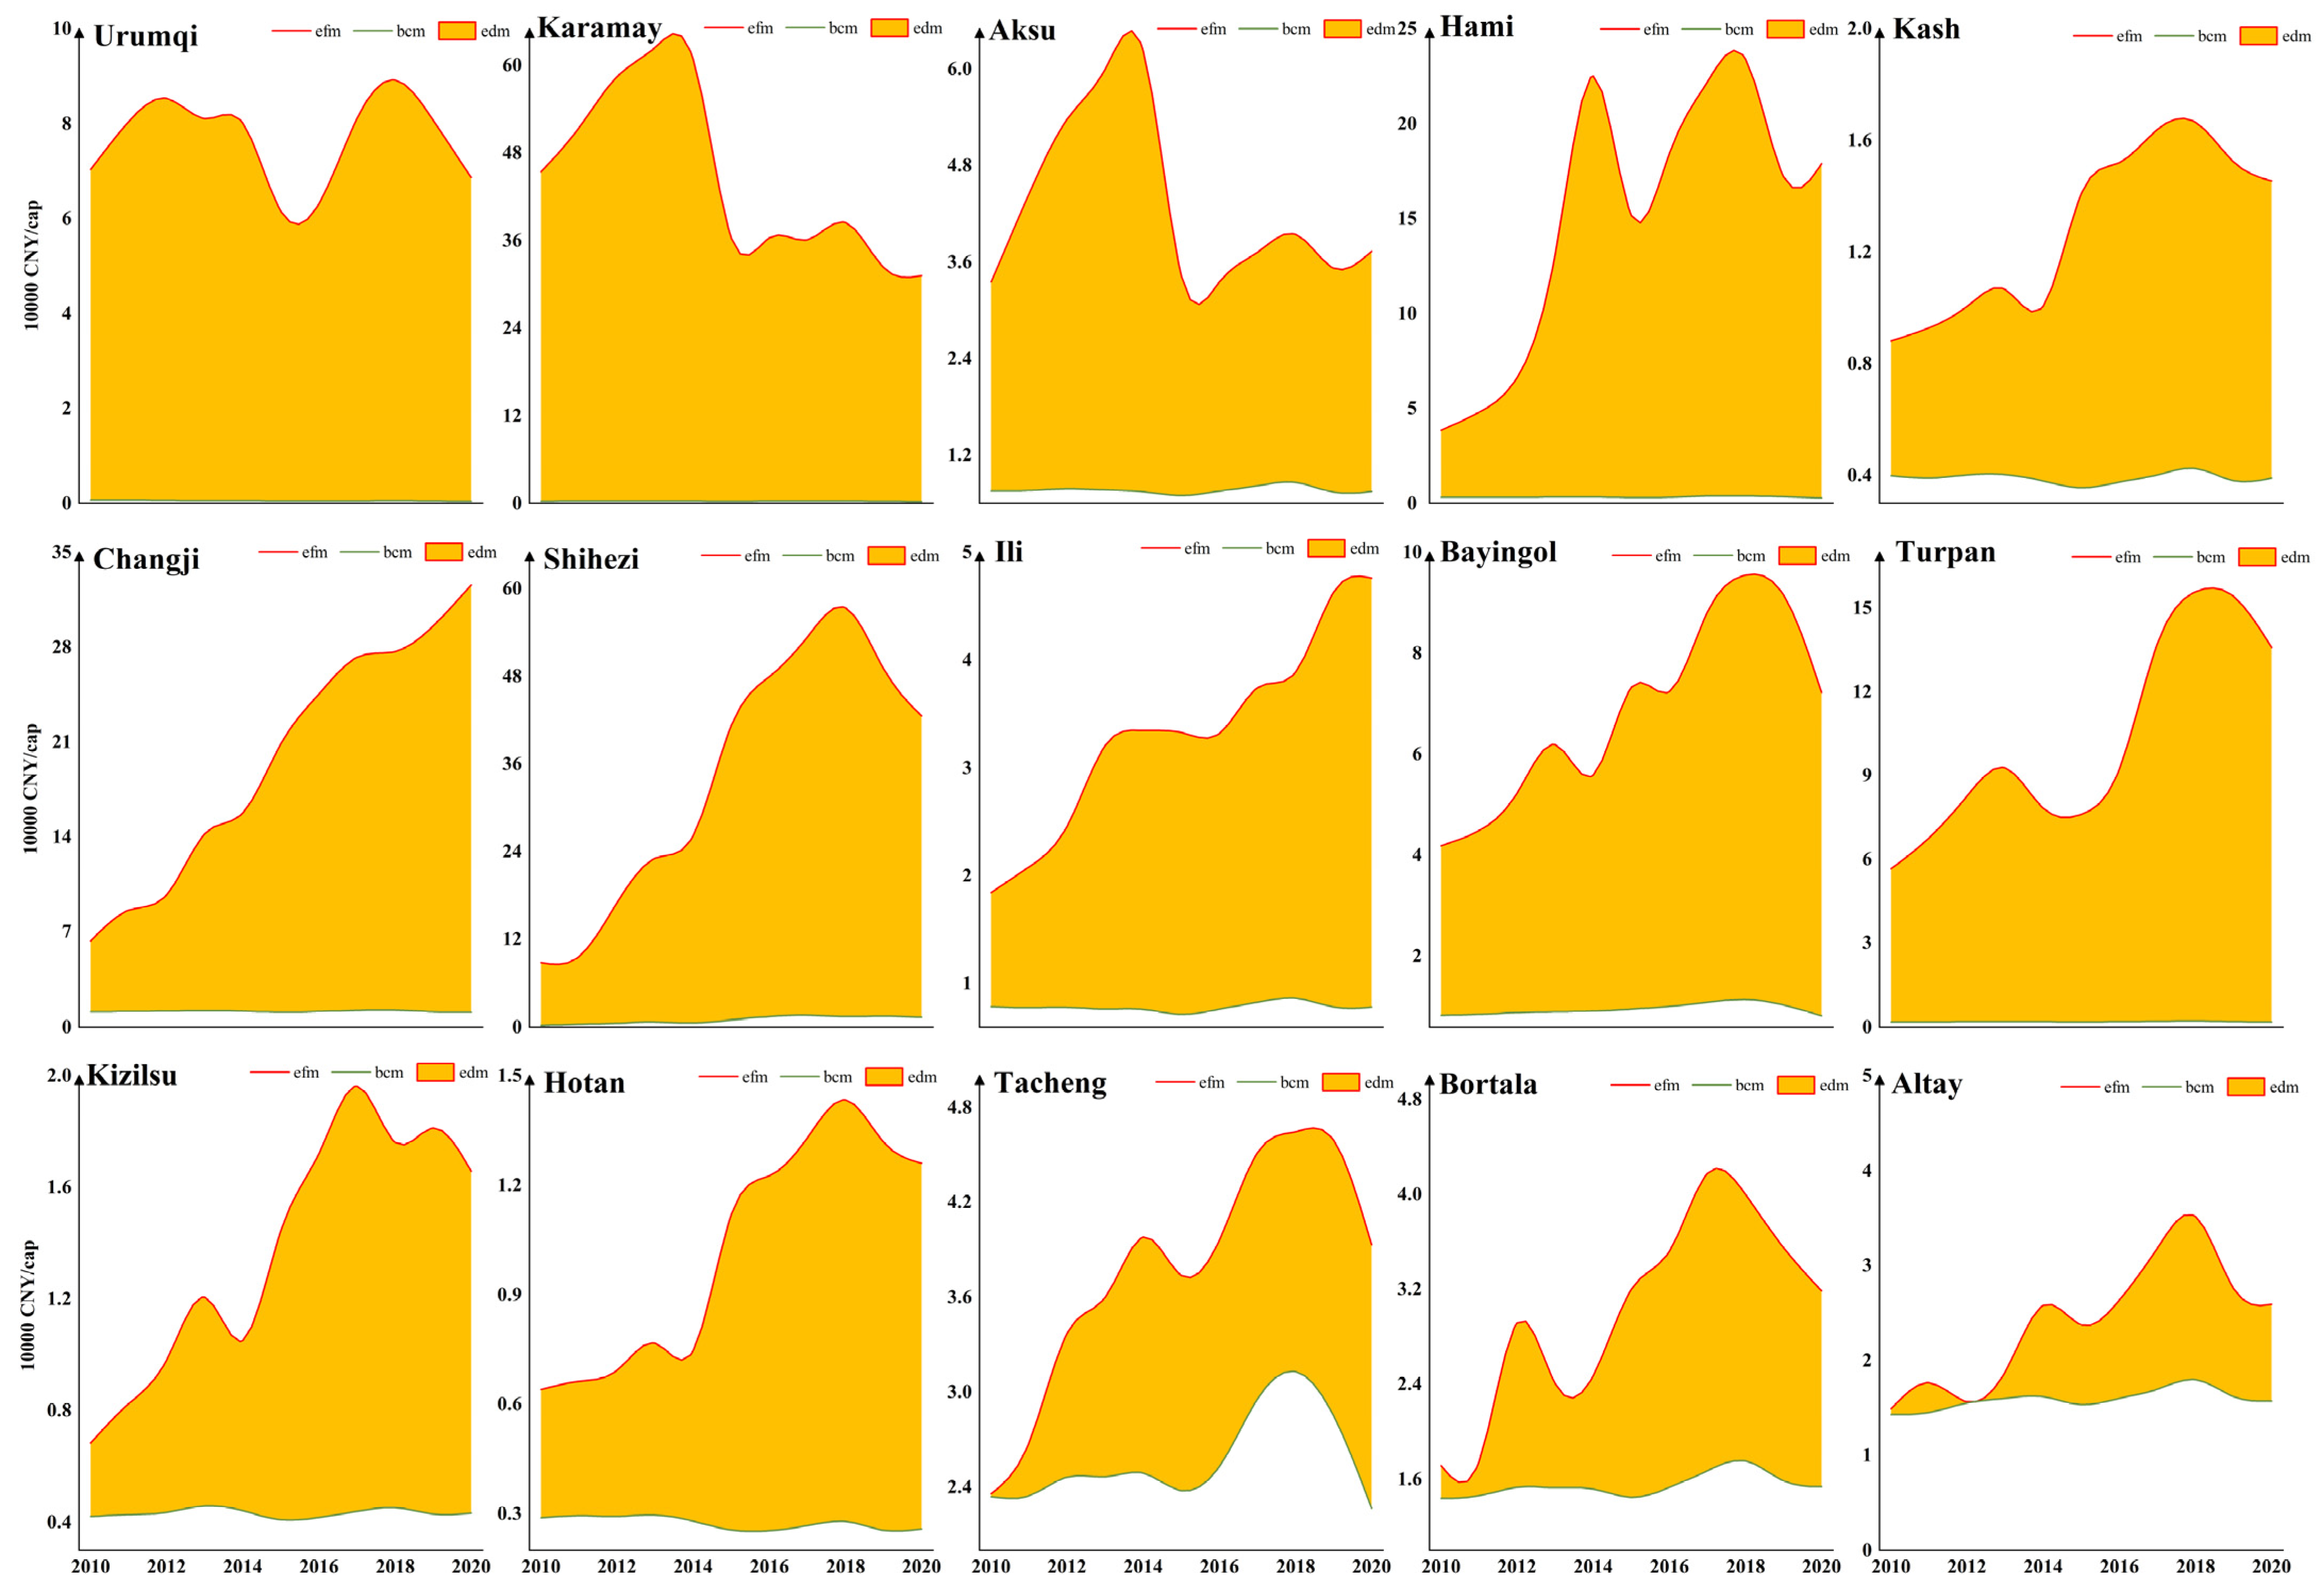
3.2.2. efm, bcm, and edm Partition Analysis

During the study period, the efms in the Urumqi and Karamay prefectures decreased from 70.4 thousand CNY/cap and 454.1 thousand CNY/cap in 2010 to 68.7 thousand CNY/cap and 311.8 thousand CNY/cap in 2020 (Figure 8). The efms in the rest of the prefectures realized growth, and Changji’s efm grew the fastest, with a growth rate of 23.9 thousand CNY/cap/yr. Aksu’s efm had the slowest growth rate, with a 345 CNY/cap/yr growth rate. The average annual growth rates for efm across Xinjiang, from high to low, were as follows: Changji > Shihezi > Hami > Ili > Kizilsu > Turpan > Hotan > Bortala > Altay > Bayingol > Tacheng > Kash > Aksu > Urumqi > Karamayi. Shihezi, Altay, Bortala, and Kizilsu realized growth in bcm during the study period, with Shihezi having the most significant increment and the fastest growth rate, from 2.2 thousand CNY/cap in 2010 to 12.9 thousand CNY/cap in 2020. The rest of the prefectures’ bcms showed different degrees of reduction, with Tacheng’s shrinking the most, with a total of 0.07 thousand CNY/cap; the rate of shrinkage, from high to low, was as follows: Urumqi (70.28%) > Karamayi (22.90%) > Hotan (11.84%) > Hami (8.50%) > Turpan (3.67%) > Tacheng (3.15%) > Changji (2.38%) > Kash (2.09%) > Aksu (1.21%) > Bayingol (0.66%) > Ili (0.27%).
From the perspective of monetary volume, all Xinjiang’s prefectures were in ecological deficit during the study period, Shihezi having the most negative growth, with a total growth of −327.5 thousand CNY/cap. Aksu had the smallest negative growth, with a total growth of −3.9 thousand CNY/cap in the study period. Unlike the others, Urumqi’s and Karamay’s edms increased positively. The edm negative growth multiples, from highest to lowest, were as follows: Tacheng (85.29) > Altay (15.17) > Changji (5.06) > Bortala (4.92) > Hami (3.97) > Shihezi (3.84) > Kizilsu (3.65) > Ili (2.77) > Hotan (1.85) > Turpan (1.45) > Kash (1.20) > Bayingol (0.90) > Aksu (0.15) > Urumqi (−0.02) > Karamayi (−0.31).

3.3. Analysis of Ecological Compensation Standards

This study took the physical and monetary value of natural capital in Xinjiang as the research object. It calculated the amount of ecological compensation based on the region’s natural capital supply and demand. The results of the calculations are as follows: At the regional scale, the amount of ecological compensation payment in Xinjiang grew from CNY 5.659 billion in 2010 to CNY 10.259 billion in 2020 (Figure 9), with an average annual growth rate of 7.39%. The average per capita ecological compensation payment standard grew from 259.42 CNY/cap/yr in 2010 to 396.11 CNY/cap/yr, with an average annual increase of 4.79%. On the prefecture scale, the amount of ecological compensation payment in Karamay and Aksu showed a fluctuating downward trend. In contrast, the rest of the prefectures fluctuated upwardly. The ecological compensation payments and payment standards in the southern border region were lower than those in the northern border region. In 2020, Urumqi had the highest ecological compensation payment amount of CNY 3.850 billion; Kizilsu had the lowest ecological compensation payment amount of CNY 5.510 million. The average annual ecological compensation payment standard of Karamay was the highest at 2178.97 CNY/cap/yr, which was 6.01 times higher than that of the whole region’s average annual ecological compensation payment standard (362.49 CNY/cap/yr). The lowest average annual compensation payment standard was 5.37 CNY/cap/yr, in Kizilsu.

4. Discussion

4.1. Advantages and Feasibility of Ecological Compensation Standards in this Study

Compared with existing studies, we did not consider the cost of ecological damage [9] or judge the degree of export or outward consumption based on the value of ecosystem services singularly [4]. In contrast, we took into account the damage to the environment caused by pollution in the accounting process of the footprint account and included the pollution footprint in the accounting system. Additionally, we realized the realistic monetization of the footprint model and, based on this, provided a model paradigm of ecological and monetary compensation by effectively combining the biological productivity of the land and the value of ecosystem services through the use of ESEQs. The introduction of the ecosystem service equivalence factor solves the problem of different unit representations of ecological footprint and ecosystem service value, and embedding the value of ecosystem services into the ecological footprint model provides a new way of thinking about accounting for the monetary value of natural capital and ecological compensation. We selected the types of ecosystem services corresponding to the ecological footprint account to make them consistent at the actual situation and account level.
In this study, BC grew slowly, but EF grew exceptionally rapidly in Xinjiang, consistent with JIN and Yue’s findings [41,58]. The mean ecological deficit per capita in Xinjiang during the study period was 16.61 s-nha/cap, which is closer to the mean ecological deficit per capita of 16.172 gha/cap in Xinjiang from 2009 to 2020 calculated by GUAN et al. [40]. This paper used provincial hectares, a localized unit of measurement, which more accurately quantifies Xinjiang’s natural capital utilization in Xinjiang over the past 11 years. The study also found that there were differences in ecological compensation standards at the whole area scale and the prefecture scale; for example, at the whole area scale, the per capita payment of ecological compensation in 2016 was 351.15 CNY/cap/yr, which is closer to the figure of 365.3 CNY/cap/yr derived from the study of residents’ willingness to pay for ecological compensation in the Tarim River Basin by Zhang et al. [59] for the same period. However, at the prefecture scale, there was a high value of 1505.75 CNY/cap/yr in Changji and a low value of 7.53 CNY/cap/yr in Kizilsu during the same period. Our calculated regional ecological compensation amount is about 1.07–0.73% of the total regional GDP in the same period, slightly lower than the international research standard of 2–3%.

4.2. Policy Recommendations

This study explains the physical and monetary state of natural capital consumption in Xinjiang between 2010 and 2020. It is of great theoretical and practical significance to construct an ecological compensation standard accounting framework based on this from the perspective of natural capital supply and demand combined with socioeconomic indicators and to put forward a compensation scheme to determine the ecological compensation standard in Xinjiang. In theory, the ecological compensation standard is reasonably calculated based on regional natural capital utilization dynamics. In practice, this research can provide a reference for implementing ecological compensation policy and ecological environmental protection planning in Xinjiang. The following suggestions are made for the sustainable development of Xinjiang: (1) The primary factor influencing Xinjiang’s ecological footprint is its carbon footprint. Therefore, the best ways to improve the province’s ecological efficiency are to speed up industrial transformation, optimize the industrial structure, cut energy consumption, and concentrate on the growth of low-consumption new energy sectors like solar energy. (2) Cropland and grassland mainly provide the ecological carrying capacity of Xinjiang, so the first step is to focus on the protection of existing basic cropland, guaranteeing the area of cropland while promoting the development of eco-agriculture and enhancing the ecological resilience of cropland. The proportion of high-quality and high-standard cropland should be increased to improve the ecological carrying capacity of cropland. Secondly, it is necessary to consider grassland restoration and management and strengthen the utilization efficiency of existing pastureland while increasing the protection and improvement of natural grassland. The area of natural vegetation should be increased as much as possible to improve regional ecological quality and efficiency. (3) Another recommendation is to incorporate more indirect use and non-use values provided by ecosystems under the framework of accounting for ecological compensation that comprehensively considers the depletion of natural capital and the multiple service functions of ecosystems. A regular testing and assessment mechanism should be established to track these factors dynamically. (4) The establishment of market-based eco-compensation mechanisms under this framework, such as trading ecological products, carbon emission rights, and pollution emission rights, should be explored. Multi-region promotion and the expansion of horizontal ecological compensation case studies should also be carried out to promote the virtuous cycle of ecological protection and economic development. (5) It is suggested to improve the existing ecological compensation system, perfect supporting ecological compensation laws and regulations, and implement regulatory testing. The government should take the leading role, apply compensation funds and reward and punishment mechanisms, and mobilize enterprises and the public to explore and carry out diversified compensation models.

4.3. Limitations of this Study

The limitations of this study include the following: First, the import and export transactions of interregional products were ignored in the accounting of regional footprint accounts, such that the partial impact on regional natural resource appropriation was ignored, thus affecting the accuracy of the calculations [60]. Second, the ecosystem service equivalence factors cited in this paper effectively combined the value of ecosystem services and biological productivity, making a compelling connection between natural resource measurement and monetary measurement. However, the distortion of benefits caused by the ecological bias of ecosystem service value itself still exists [61], which will impact the ecological compensation accounting conducted afterward and should be continuously improved in subsequent studies. Finally, the accounting and correction of ecological compensation standards based on socioeconomic indicators and the proposal of ecological standard compensation schemes still need to be considered for transportation, culture, and other factors. Therefore, in the future, relevant revised indicators should also be added with regional development characteristics to make the results more reasonable [62].

5. Conclusions

In this study, we incorporate the freshwater and pollution footprints into the ecological footprint accounting framework and make carbon footprint localization improvements, complete the accounting of the physical amount of natural capital, and then introduce ESEQs to account for the monetary amount of regional natural capital. Based on this, we determine the differential compensation standards from different scales and calculate the regional dynamic ecological compensation amount from the perspective of the supply and demand of natural capital monetary volume combined with regional socioeconomic factors. This further improves the diversified construction of regional ecological compensation and offers new concepts for accounting for regional ecological comprehensive compensation. Our research conclusions are as follows:
(1)
During the study period, Xinjiang’s ef grew from 11.22 s-nha/cap to 21.37 s-nha/cap, and only the growth rates of the ecological footprints of Altay, Tacheng, Bayingol, and Aksu were lower than the average level of the whole region (8.22%). bc declined from 1.66 to 1.46 s-nha/cap, with an average annual decline of 1.10%. Kizilsu and Altay were still in ecological surplus in 2010, and both transformed into ecological deficit after 2014. All of Xinjiang and the rest of the prefectures were in an ecological deficit during the study period.
(2)
From 2010 to 2020, the BCM in Xinjiang increased by 8.74%, but the EFM increased by 1.21 times. During the study period, the whole region and all prefectures were in ecological deficit of monetary volume. Shihezi’s EFM increased the fastest (35.13%), Urumqi and Karamay EFM showed signs of contraction, and the EFMs of the rest of the prefectures increased to varying degrees.
(3)
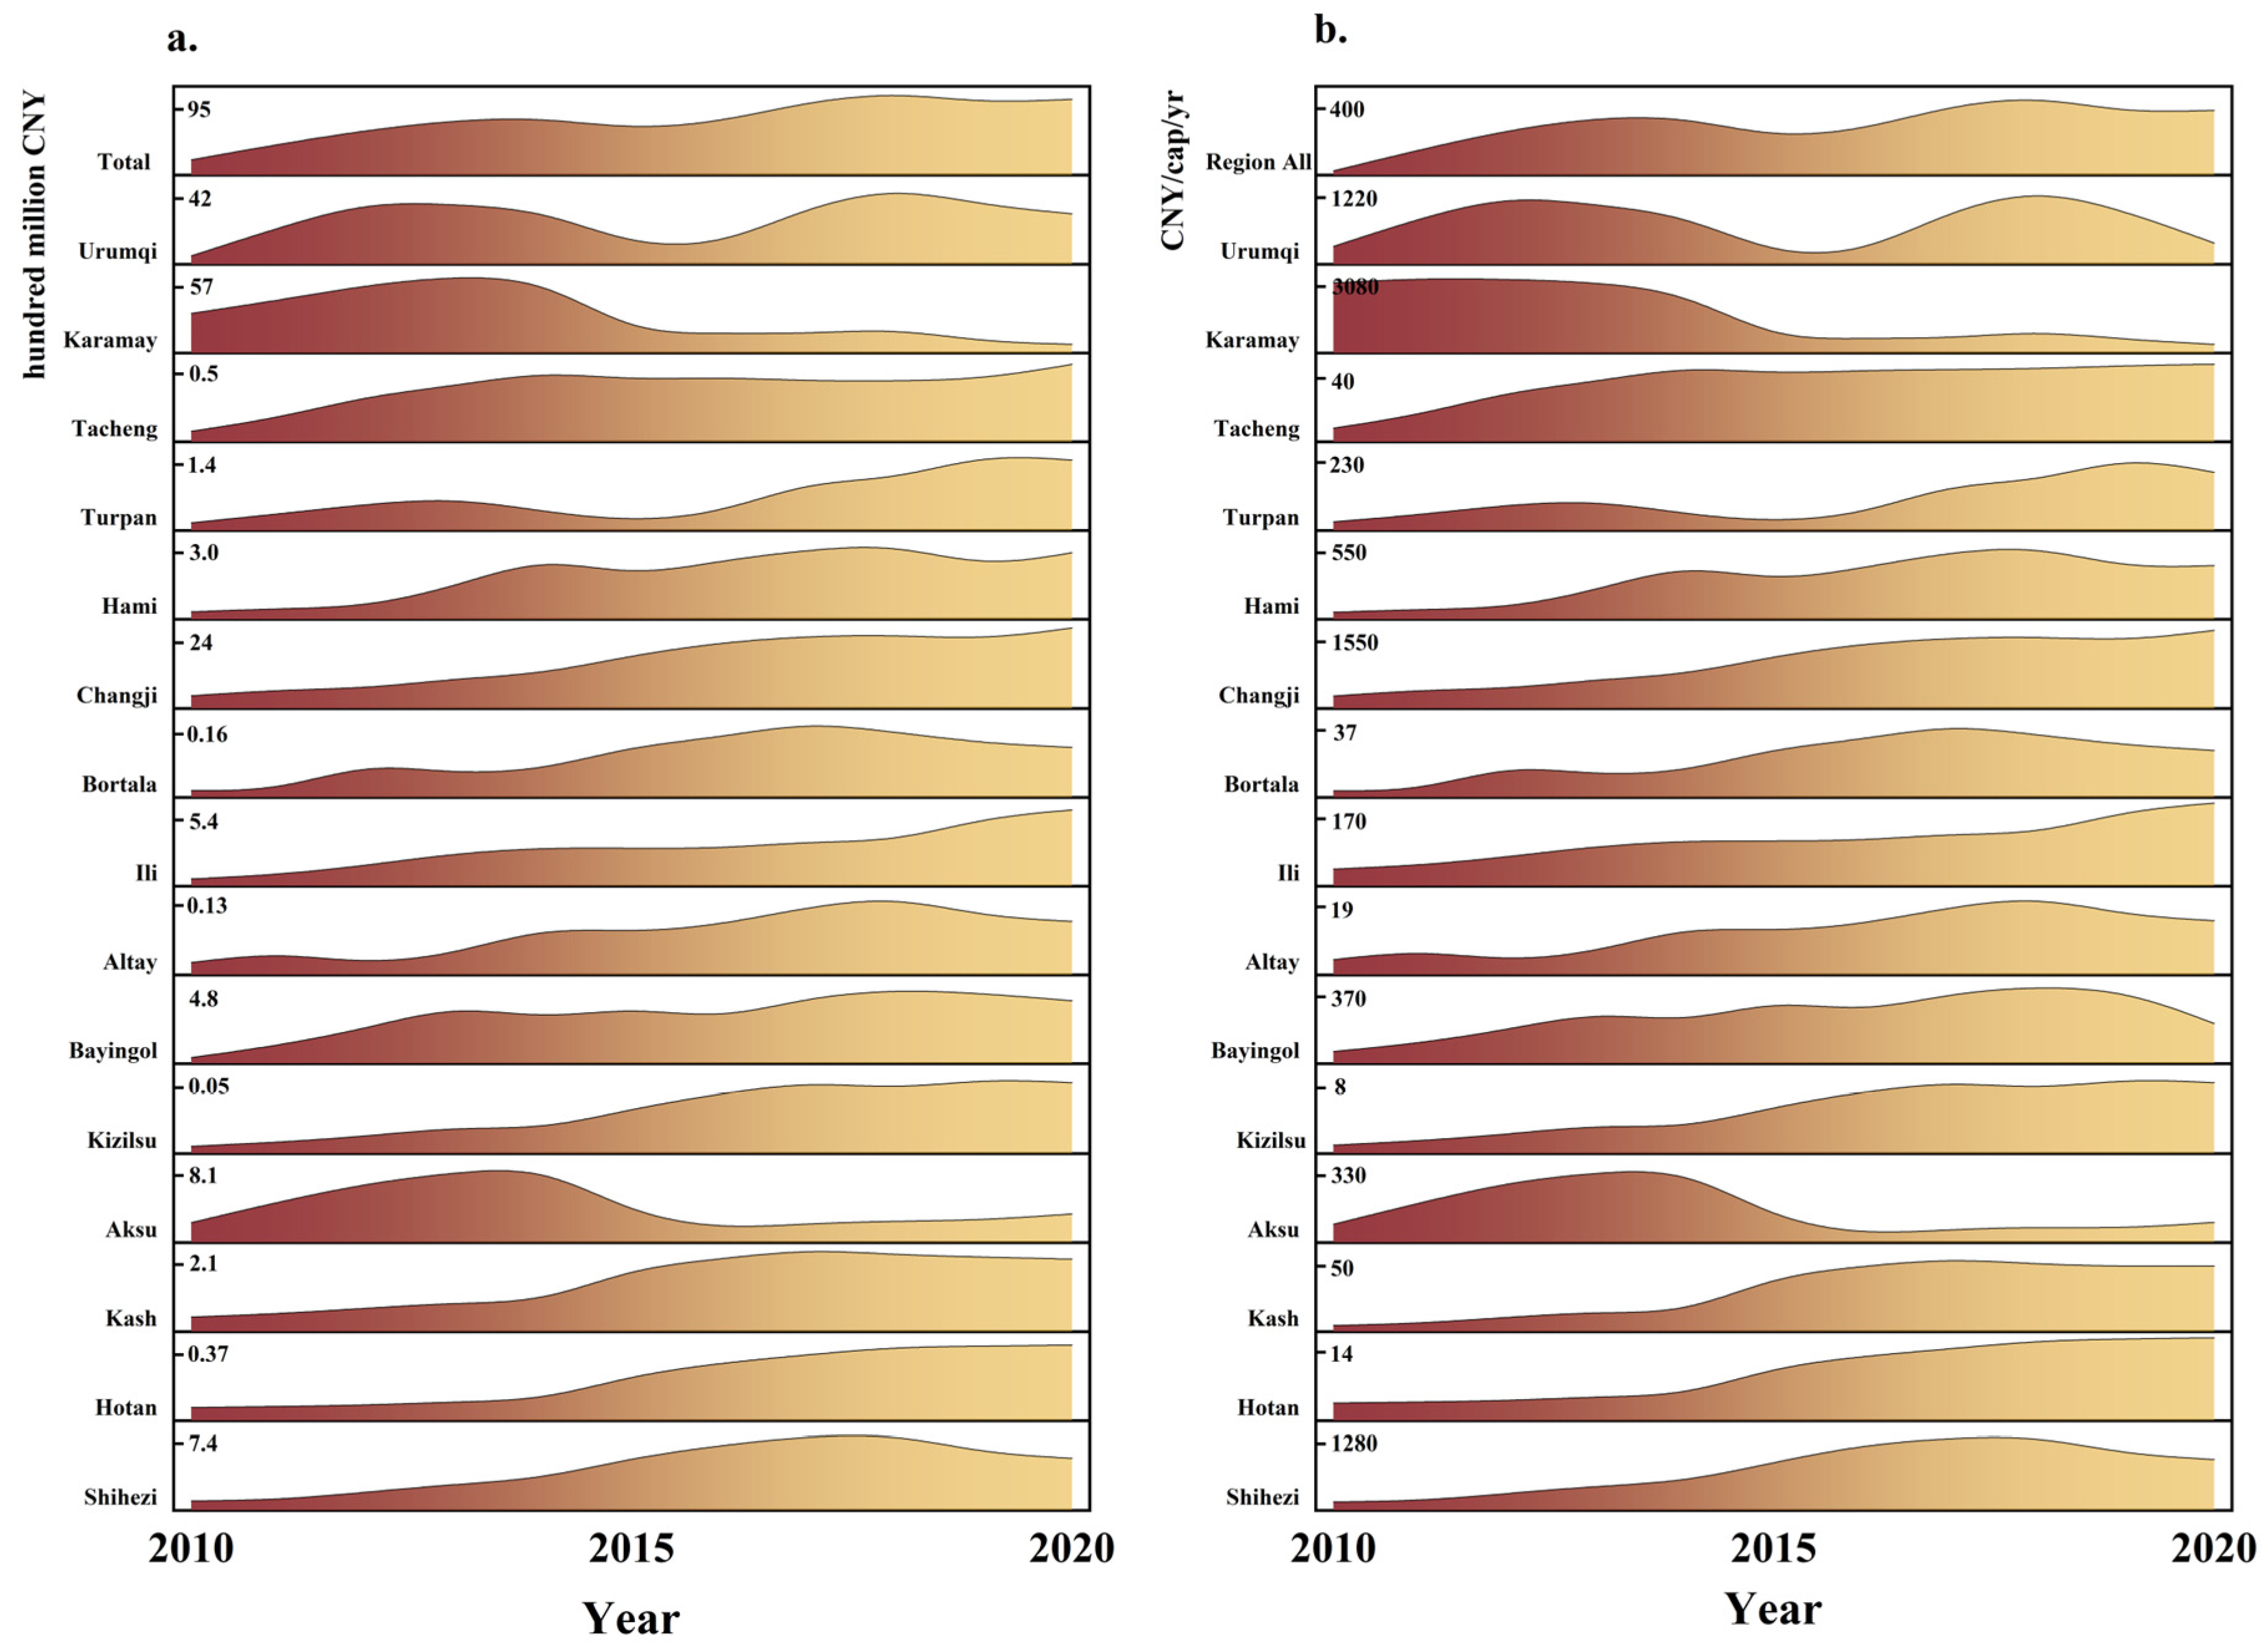
From 2010 to 2020, the total amount of ecological compensation to be paid in the whole region of Xinjiang grew from CNY 5.659 billion to CNY 10.259 billion. In 2020, the per capita payment of ecological compensation in the whole region of Xinjiang was 396.11 CNY/cap/yr. There were apparent differences in ecological compensation standards among the local prefectures, with the highest per capita payment in 2020 in Changji, at 1821.78 CNY/cap/yr, and Kizilsu had the lowest per capita payment standard of 8.63 CNY/cap/yr.

Author Contributions

Conceptualization, J.S. and T.W.; Data curation, J.S., T.W. and Y.Z.; Formal analysis, J.S., T.W. and Y.L.; Funding acquisition, L.X. and Z.G.; Investigation, L.X.; Methodology, J.S. and T.W.; Project administration, L.X.; Resources, T.W.; Software, J.S.; Supervision, L.X.; Validation, L.X.; Visualization, J.S. and C.C.; Writing—original draft, J.S.; Writing—review and editing, J.S., Z.G., C.C., Y.L. and Y.X. All authors have read and agreed to the published version of the manuscript.

Funding

This research was funded by the National Social Science Youth Fund Project: 21CGL008.

Institutional Review Board Statement

Not applicable.

Informed Consent Statement

Not applicable.

Data Availability Statement

The data that support the findings of this study are available from the corresponding author, Liping Xu, upon reasonable request.

Conflicts of Interest

The authors declare that they have no known competing financial interests or personal relationships that could have appeared to influence the work reported in this paper.

References

  1. Baste, I.A.; Watson, R.T.; Brauman, K.I.; Samper, C.; Walzer, C. Making Peace with Nature: A Scientific Blueprint to Tackle the Climate, Biodiversity and Pollution Emergencies; Wildlife Conservation Society: New York, NY, USA, 2021. [Google Scholar]
  2. Chen, L.; Yang, H.; Huang, H. How do natural and socio-economic factors influence the sustainable development of the ecological environment in the World Natural Heritage Sites? Evidence from the Jiuzhaigou, China. J. Clean. Prod. 2023, 428, 139238. [Google Scholar] [CrossRef]
  3. Balsalobre-Lorente, D.; Shahbaz, M.; Roubaud, D. How economic growth, renewable electricity and natural resources contribute to CO2 emissions? Energy Policy 2018, 113, 356–367. [Google Scholar] [CrossRef]
  4. Du, H.; Zhao, L.; Zhang, P. Ecological compensation in the Beijing-Tianjin-Hebei region based on ecosystem services flow. J. Environ. Manag. 2023, 331, 117230. [Google Scholar] [CrossRef] [PubMed]
  5. Li, W.; Yi, P.; Zhang, D. Assessment of coordinated development between social economy and ecological environment: Case study of resource-based cities in Northeastern China. Sustain. Cities Soc. 2020, 59, 102208. [Google Scholar] [CrossRef]
  6. Solomon, N.; Segnon, A.C.; Birhane, E. Ecosystem service values changes in response to land-use/land-cover dynamics in dry afromontane forest in northern Ethiopia. Int. J. Environ. Res. Public Health 2019, 16, 4653. [Google Scholar] [CrossRef] [PubMed]
  7. Ma, L.; Pang, D.; Gao, J. Ecological Asset Assessment and Ecological Compensation Standards for Desert Nature Reserves: Evidence from Three Different Climate Zones in China. Sustainability 2023, 15, 10679. [Google Scholar] [CrossRef]
  8. Gastineau, P.; Mossay, P.; Taugourdeau, E. Ecological compensation: How much and where? Ecol. Econ. 2021, 190, 107191. [Google Scholar] [CrossRef]
  9. Wu, Z.; Guo, X.; Lv, C. Study on the quantification method of water pollution ecological compensation standard based on emergy theory. Ecol. Indic. 2018, 92, 189–194. [Google Scholar] [CrossRef]
  10. Guan, X.; Liu, W.; Chen, M. Study on the ecological compensation standard for river basin water environment based on total pollutants control. Ecol. Indic. 2016, 69, 446–452. [Google Scholar] [CrossRef]
  11. Sheng, W.; Zhen, L.; Xie, G. Determining eco-compensation standards based on the ecosystem services value of the mountain ecological forests in Beijing, China. Ecosyst. Serv. 2017, 26, 422–430. [Google Scholar] [CrossRef]
  12. Lu, S.; Li, J.; Xiao, B. Analysis of standard accounting method of economic compensation for ecological pollution in watershed. Sci. Total Environ. 2020, 737, 138157. [Google Scholar] [CrossRef] [PubMed]
  13. Zhang, Z.; Cui, Y.; Wang, L. Determining the ecological compensation standards based on willingness to accept (WTA) for intensive agricultural production areas: A case in China. Appl. Geogr. 2023, 158, 103051. [Google Scholar] [CrossRef]
  14. Gao, X.; Shen, J.; He, W. Spatial-temporal analysis of ecosystem services value and research on ecological compensation in Taihu Lake Basin of Jiangsu Province in China from 2005 to 2018. J. Clean. Prod. 2021, 317, 128241. [Google Scholar] [CrossRef]
  15. Yang, Y.; Yao, C.; Xu, D. Ecological compensation standards of national scenic spots in western China: A case study of Taibai Mountain. Tour. Manag. 2020, 76, 103950. [Google Scholar] [CrossRef]
  16. Wang, L.; Lv, T.; Zhang, X. Global research trends and gaps in ecological compensation studies from 1990 to 2020: A scientometric review. J. Nat. Conserv. 2022, 65, 126097. [Google Scholar] [CrossRef]
  17. Liu, M.; Liu, W.; Yang, L. A dynamic eco-compensation standard for Hani Rice Terraces System in southwest China. Ecosyst. Serv. 2019, 36, 100897. [Google Scholar] [CrossRef]
  18. Sangha, K.K.; Ahammad, R.; Russell-Smith, J.; Costanza, R. Payments for Ecosystem Services opportunities for emerging Nature-based Solutions: Integrating Indigenous perspectives from Australia. Ecosyst. Serv. 2024, 66, 101600. [Google Scholar] [CrossRef]
  19. Zhou, Y.; Zhou, J.; Liu, H. Study on eco-compensation standard for adjacent administrative districts based on the maximum entropy production. J. Clean. Prod. 2019, 221, 644–655. [Google Scholar] [CrossRef]
  20. Rees, W.E. Ecological footprints and appropriated carrying capacity: What urban economics leaves out. Environ. Urban. 1992, 4, 121–130. [Google Scholar] [CrossRef]
  21. Wackernagel, M.; Rees, W.E. Perceptual and structural barriers to investing in natural capital: Economics from an ecological footprint perspective. Ecol. Econ. 1997, 20, 3–24. [Google Scholar] [CrossRef]
  22. Wei, Z.; Jian, Z.; Sun, Y. Ecological sustainability and high-quality development of the Yellow River Delta in China based on the improved ecological footprint model. Sci. Rep. 2023, 13, 3821. [Google Scholar] [CrossRef] [PubMed]
  23. Li, P.; Zhang, R.; Xu, L. Three-dimensional ecological footprint based on ecosystem service value and their drivers: A case study of Urumqi. Ecol. Indic. 2021, 131, 108117. [Google Scholar] [CrossRef]
  24. Liu, C.; Liu, W.; Lu, D. A study of provincial differences in China’s eco-compensation framework. J. Geogr. Sci. 2017, 2, 115–131. [Google Scholar] [CrossRef]
  25. Zhang, Y.; Guan, D.; Wu, L. How can an ecological compensation threshold be determined? A discriminant model integrating the minimum data approach and the most appropriate land use scenarios. Sci. Total Environ. 2022, 852, 158377. [Google Scholar] [CrossRef]
  26. Lv, C.; Xu, X.; Guo, X. Basin water ecological compensation interval accounting based on dual perspectives of supply and consumption: Taking Qingyi River Basin as an example. J. Clean. Prod. 2023, 385, 135610. [Google Scholar] [CrossRef]
  27. Vardon, M.J.; Keith, H.; Burnett, P. From natural capital accounting to natural capital banking. Nat. Sustain. 2021, 4, 832–834. [Google Scholar] [CrossRef]
  28. Kyriakopoulos, G.L. Land use planning and green environment services: The contribution of trail paths to sustaninable development. Land 2023, 12, 1041. [Google Scholar] [CrossRef]
  29. Yang, H.; Wei, Q.; Chen, J. Quantifying the payments for ecosystem services and the value of natural resources based on the indicator of optional capacity value: A case study on water resources supply in Zhujiang River Basin, China. Acta Ecol. Sin. 2020, 40, 3218–3228. [Google Scholar]
  30. UN. System of Environmental Economic Accounting 2012—Central Framework; United Nations: New York, NY, USA, 2014. [Google Scholar]
  31. UNSD. System of Environmental-Economic Accounting—Ecosystem Accounting Final Draft. 2021. Available online: https://unstats.un.org/unsd/statcom/52nd-session/documents/BG-3f-SEEA-EA_Final_draft-E.pdf (accessed on 29 March 2024).
  32. Li, P.; Zhang, R.; Wei, H. Assessment of physical quantity and value of natural capital in China since the 21st century based on a modified ecological footprint model. Sci. Total Environ. 2022, 806, 150676. [Google Scholar] [CrossRef] [PubMed]
  33. Niccolucci, V.; Coscieme, L.; Marchettini, N. Benefit transfer and the economic value of Biocapacity: Introducing the ecosystem service Yield factor. Ecosyst. Serv. 2021, 48, 101256. [Google Scholar] [CrossRef]
  34. Mancini, M.S.; Galli, A.; Niccolucci, V. Stocks and flows of natural capital: Implications for Ecological Footprint. Ecol. Indic. 2017, 77, 123–128. [Google Scholar] [CrossRef]
  35. Niu, J.; Mao, C.; Xiang, J. Based on ecological footprint and ecosystem service value, research on ecological compensation in Anhui Province, China. Ecol. Indic. 2024, 158, 111341. [Google Scholar] [CrossRef]
  36. Zhang, R.; Li, P.; Xu, L. Reconciling ecological footprint and ecosystem services in natural capital accounting: Applying a novel framework to the Silk Road Economic Belt in China. J. Environ. Manag. 2023, 330, 117115. [Google Scholar] [CrossRef] [PubMed]
  37. Li, D.; Zuo, Q.; Jiang, L. An integrated analysis framework for water resources sustainability considering fairness and decoupling based on the water resources ecological footprint model: A case study of Xinjiang, China. J. Clean. Prod. 2023, 383, 135466. [Google Scholar] [CrossRef]
  38. Zheng, Z.; Ma, Z.; Li, M. Regional water budgets and hydroclimatic trend variations in Xinjiang from 1951 to 2000. Clim. Chang. 2017, 144, 447–460. [Google Scholar] [CrossRef]
  39. Xia, N.; Hai, W.; Tang, M. Spatiotemporal evolution law and driving mechanism of production–living–ecological space from 2000 to 2020 in Xinjiang, China. Ecol. Indic. 2023, 154, 110807. [Google Scholar] [CrossRef]
  40. Guan, M.; Jiang, Y.; Du, W. A modified ecological footprint calculation method for drylands and its application to Xinjiang Uygur Autonomous Region, China. J. Clean. Prod. 2023, 419, 138176. [Google Scholar] [CrossRef]
  41. Yue, Z.; Liu, H.; Xu, Z. Evaluation of sustainability in northern Xinjiang based on ecological footprint-planetary boundary system framework. Ecol. Indic. 2023, 150, 110270. [Google Scholar] [CrossRef]
  42. Li, Z.; Su, B.; Liu, M. Research Progress on the Theory and Practice of Grassland Eco-Compensation in China. Agriculture 2020, 12, 721. [Google Scholar] [CrossRef]
  43. China Statistics Press. Xinjiang Statistical Yearbook; China Statistics Press: Beijing, China, 2011–2021.
  44. China Statistics Press. Xinjiang Production and Construction Corps Statistical Yearbook; China Statistics Press: Beijing, China, 2011–2021.
  45. Yang, Y.; Cai, Z. Ecological security assessment of the Guanzhong Plain urban agglomeration based on an adapted ecological footprint model. J. Clean. Prod. 2020, 260, 120973. [Google Scholar] [CrossRef]
  46. Zhang, H.; Liu, W.; Lin, Y.; Shan, N. Calculation and analysis of equivalence factor and yield factor of ecological footprint based on sub-national hectare: A case study of Zhejiang. Acta Ecol. Sin. 2009, 24, 82–92. [Google Scholar]
  47. Ferng, J.J. Toward a scenario analysis framework for energy footprints. Ecol. Econ. 2002, 40, 53–69. [Google Scholar] [CrossRef]
  48. Xiong, Z.; Li, H. Ecological deficit tax: A tax design and simulation of compensation for ecosystem service value based on ecological footprint in China. J. Clean. Prod. 2019, 230, 1128–1137. [Google Scholar] [CrossRef]
  49. Browne, D.; O’Regan, B.; Moles, R. Use of carbon footprinting to explore alternative household waste policy scenarios in an Irish city-region. Resour. Conserv. Recycl. 2009, 54, 113–122. [Google Scholar] [CrossRef]
  50. Huang, L.; Zhang, W.; Jiang, C. Ecological footprint method in water resources assessment. Acta Ecol. Sin. 2008, 28, 1279–1286. [Google Scholar]
  51. Hong, S.F.; Guo, Q.H.; Li, D.W. Spatiotemporal dynamics ofecological supply and demand based on ecological footprint theory. Resour. Sci. 2020, 42, 980–990. [Google Scholar]
  52. Bai, Y.; Zeng, H.; Wei, J.B.; Zhang, W.J.; Zhao, H.W. Optimization of ecological footprint model based on environmental pollution accounts: A case study in Pearl River Delta urban agglomeration. Chin. J. Appl. Ecol. 2008, 8, 1789–1796. [Google Scholar]
  53. Peng, J.; Wang, Y.; Chen, Y. Economic Value of Urban Ecosystem Services: A Case Study in Shenzhen. Acta Sci. Nat. Univ. Pekin. 2005, 41, 594. [Google Scholar]
  54. Zhang, Z.; Hu, B.; Jiang, W. Construction of ecological security pattern based on ecological carrying capacity assessment 1990–2040: A case study of the Southwest Guangxi Karst-Beibu Gulf. Ecol. Model. 2023, 479, 110322. [Google Scholar] [CrossRef]
  55. Xie, G.D.; Zhen, L.; Lu, C.X.; Xiao, Y.; Chen, C. Expert knowledge based valuation method of ecosystem services in China. J. Nat. Resour. 2008, 5, 911–919. [Google Scholar]
  56. Xie, G.D.; Lu, C.X.; Leng, X.F. Valuation of ecological assets on the Tibetan Plateau. Nat. Resour. 2003, 2, 189–196. [Google Scholar]
  57. Shen, L.; Wang, H. How Does GDP Data Revision Affect Its Deflator. J. Quant. Technol. Econ. 2008, 5, 155–160. [Google Scholar]
  58. Jin, M.; Xu, L.; Li, P. Spatial and temporal evolution of natural utilization in the three-dimensional ecological footprint under the regional economic differentiation in north and south Xinjiang. Acta Ecol. Sin. 2020, 40, 4327–4339. [Google Scholar]
  59. Zhang, P.; Li, Q.; Xue, Z. Research on Tarim River Bsain Resdengs’ Willingness to Pay and Willngness to Accpet Differences. Resour. Dev. Mark. 2017, 33, 423–429. [Google Scholar]
  60. Yang, Y.; Yang, H.; Cheng, Y. Why is it crucial to evaluate the fairness of natural capital consumption in urban agglomerations in terms of ecosystem services and economic contribution? Sustain. Cities Soc. 2021, 65, 102644. [Google Scholar] [CrossRef]
  61. Zhu, W.B.; Li, S.C.; Zhu, L.Q. Ecosystem service footprint flow and the influencing factors within provinces, China. Geogr. Res. 2019, 28, 337–347. [Google Scholar]
  62. Yu, Y.; Li, J.; Han, L. Research on ecological compensation based on the supply and demand of ecosystem services in the Qinling-Daba Mountains. Ecol. Indic. 2023, 154, 110687. [Google Scholar] [CrossRef]
Figure 1. Overview of study area. The map was downloaded from the standard map service website of the China National Bureau of Surveying, Mapping and Geoinformation.
Sustainability 16 03078 g001
Figure 2. Research framework.
Sustainability 16 03078 g002
Figure 3. Total and per capita changes in ecological footprint, carrying capacity, and deficit in Xinjiang.
Sustainability 16 03078 g003
Figure 4. The composition changes in EF (a) and BC (b) in Xinjiang from 2010 to 2020.
Sustainability 16 03078 g004
Figure 5. Spatial variation in ef, bc, and ed in prefectures of Xinjiang.
Sustainability 16 03078 g005
Figure 6. Composition of Xinjiang prefectures ef 2010 (a), 2020 (b), bc2010 (c), and 2020 (d).
Sustainability 16 03078 g006
Figure 7. Changes in the total and per capita amounts of natural capital monetary volume in Xinjiang.
Sustainability 16 03078 g007
Figure 8. Changes in efm, bcm, and edm in different prefectures of Xinjiang.
Sustainability 16 03078 g008
Figure 9. (a) Amount of ecological compensation payments in Xinjiang. (b) Per capita ecological compensation payments in Xinjiang and prefectures.
Sustainability 16 03078 g009
Table 1. Data and sources.
DataSource
Biological resource data, water resource data, energy consumption data, and various pollution emission dataXinjiang Statistical Yearbook 2011–2021 [43]
Xinjiang Production and Construction Corps Statistical Yearbook 2011–2021 [44]
Calorific value data of biological productsHandbook of Agricultural Technology and Economics (Revised Edition)
GDP, demographic dataGovernment Statistical Bulletin on National Economic and Social Development (2010–2020)
Xinjiang Statistical Yearbook (2011–2021) [43]
Land use/land cover map dataSpatial resolution of 30 m per pixel (2010–2020) [45]
Table 2. Multi-year average yield factors for various land types in Xinjiang prefectures.
Type of Land Use\PrefecturesUrumqiKaramayTurpanHamiChangjiBortalaIliTachengAltayBayingolKizilsu AksuKashHotanShihezi
Cropland1.340.830.500.791.171.211.511.251.170.831.020.790.861.040.68
Woodland1.451.631.540.400.891.500.671.130.570.500.671.050.900.941.16
Grassland0.680.951.630.590.940.630.920.710.630.971.031.550.941.061.78
Water bodies1.241.041.880.331.100.362.540.580.121.040.912.280.260.880.44
Urumqi: Urumqi City; Karamay: Karamay City; Turpan: Turpan City; Hami: Hami City; Changji: Changji Hui Autonomous Prefecture; Bortala: Bortala Mongol Autonomous Prefecture; Ili: Direct-administered county (city) of Ili; Tacheng: Tacheng Region; Altay: Altay Region; Bayingol: Bayingol Mongol Autonomou Prefecture; Kizilsu: Kyzylsu Kirghiz Autonomous Prefecture; Aksu: Aksu Region; Kash: Kash Region; Hotan: Hotan Region; Shihezi: Shihezi City.
Table 3. Ecosystem service value equivalent per unit area.
Type of Ecosystem Service/Land UseCroplandGrasslandWater BodiesWoodland
Food production10.430.530.33
Material production0.390.360.352.98
Gas conditioning0.721.50.514.32
Climate control0.971.562.064.07
Hydrological regulation0.771.5218.774.09
Waste disposal1.391.3214.851.72
Sum5.246.6937.0717.51
Food production: converting solar energy into edible plant and animal products. Material production: converting solar energy into bioenergy for human use in buildings and other applications. Gas conditioning: ecosystems maintain the balance of chemical components in the atmosphere, absorbing SO2 and NOx. Climate control: moderating effects on regional climate, such as increasing precipitation and decreasing temperatures. Hydrological regulation: freshwater filtration, retention and storage functions of ecosystems, and the supply of freshwater. Waste disposal: the role of vegetation and organisms in the removal and decomposition of excess nutrients and compounds and the retention of dust.
Disclaimer/Publisher’s Note: The statements, opinions and data contained in all publications are solely those of the individual author(s) and contributor(s) and not of MDPI and/or the editor(s). MDPI and/or the editor(s) disclaim responsibility for any injury to people or property resulting from any ideas, methods, instructions or products referred to in the content.

