Article

Design, Economic, and Environmental Accounting Assessment of a Solar-Powered Cold Room for Fish Storage in Traditional Markets

Ecole Supérieure de Technologie de Fès, Université Sidi Mohamed Ben Abdellah, Route d’Imouzzer, Fez BP 2427, Morocco
*
Author to whom correspondence should be addressed.
Sustainability 2024, 16(7), 3080; https://doi.org/10.3390/su16073080
Submission received: 8 February 2024 / Revised: 24 March 2024 / Accepted: 1 April 2024 / Published: 8 April 2024

Abstract

:
The food industry, crucial for emerging economies, faces challenges in refrigeration, particularly in fish storage. High energy consumption, environmental impact, and improper cooling methods leading to food waste are significant issues. Addressing these challenges is vital for economic and environmental sustainability in the food sector, especially concerning fish storage where spoilage rates are high. In this context, this research proposes a sizing methodology, evaluation, and parametric simulations based on multi-criteria attributes for a solar PV-powered cold room for storing fish in traditional markets in Morocco. To identify the cooling load of the system, TRNSYS 16 was utilized to simulate the transient behavior, while the PV array specifications were determined using SAM 2017.9.5 software. The design process introduced a cold room coupled to a refrigeration unit powered by a 15.3 m2 PV array with a 1.8 kWp nameplate capacity. Finally, yearly and life cycle metrics including self-sufficiency, self-consumption, Levelized Cost of Cooling (LCOC), discounted payback period (DPP), CO2 emissions avoided and total environmental penalty cost savings (TEPCS) are evaluated to assess the performance of the system and a sensitivity analysis was conducted on these metrics. The proposed system has an attractive LCOC of 0.131 $/kWhCold and a DPP of 3.511 years. Using the PV array proved to avoid 437.56 tons of CO2 emissions and generated TEPCS from $100.59 to $866.66. The results of this study highlight the potential for utilizing renewable energy sources in the refrigeration sector to improve both economic and environmental sustainability.

1. Introduction

The food industry is a crucial sector for the growth and development of many emerging economies. Efficient food refrigeration processes are extremely important to advance the food industry. However, food refrigeration faces three significant challenges that impede its effectiveness. The primary obstacle is the high energy consumption of refrigeration units. Secondly, the environmental impact of the refrigeration process, which involves either the release of CO2 emissions or the use of hydrofluorocarbon fluids (HFC), poses a significant challenge. Finally, improper cooling methods contribute to an alarming amount of global food waste. Thereby, there is an urgent need for the exploration of alternative sustainable refrigeration solutions [1,2,3].
In 2018, the cooling sector which comprises refrigeration, freezing, air conditioning and heat pumps consumed 3900 TWh globally, equivalent to 3.4% of the global energy demand [4]. However, this sector’s impact on the environment is not limited to energy consumption, HFC fluids, commonly used in refrigeration and air conditioning systems, have a significant greenhouse effect. If the Kigali amendment is not respected, HFC emissions are projected to cause a temperature increase of 0.3–0.5 °C by 2100 [5]. Additionally, emissions from the cooling sector amounted to approximately 4 GT of CO2 emissions in 2018 [4]. The cold chain, defined by ASHRAE Terminology, ensures the refrigerated preservation of perishable foodstuffs from production to consumption [6]. In China, which has the third-largest capacity of refrigerated warehouses [7], cold chain activities potentially constitute 1–3% of national greenhouse gasses (GHG) [8]. In the UK, greenhouse gas annual emissions related to the food cooling industry amounted to 12.9 Mtons CO2 during 2019/2020, which represents around 3.2% of UK annual GHG emissions [9]. However, the environmental impact of the cold chain extends beyond greenhouse gas emissions. The International Institute of Refrigeration (IIR) estimates that insufficient colds contribute to 12% of global food waste, equivalent to 526 million tons of food production [10]. To further emphasize the gravity of the issue, the Food and Agriculture Organization (FAO) reported that between 702 and 828 million people faced hunger in 2021 [11]. In this regard, optimizing the cold chain will not only reduce its negative environmental impact but could also help solve world hunger and improve food quality [1].
Efforts to reduce energy consumption and improve efficiency in the refrigeration sector have been the focus of numerous studies in recent years. Evans et al. [12] performed an online survey on more than 329 cold stores to compare multiple factors that could affect energy consumption. The results proved that the shape factor was the most impactful parameter on energy consumption. Using the regression method, the results showed that the store’s volume causes an energy variation of 93%, 56%, and 67% for 126 chilled stores, 132 frozen stores, and 36 mixed stores, respectively. Another area of research involves using computational fluid dynamics (CFD) simulations to study the impact of air circulation on temperature uniformity in cold rooms [13,14,15]. While some studies have focused on air velocity and cooling unit location [16], others have considered the impact of fan rotation velocity and the number of axial fans [17]. Maintaining the appropriate relative humidity (RH) is also important for preserving food quality and reducing energy demand. Paull [18] reviewed RH’s effects on food appearance, shelf life, texture, and nutrition, recommending critical RH values for different food types. Techniques like fogging can prevent dehydration [19,20]. These studies underscore the importance of considering various factors affecting energy consumption and food preservation in cold storage. Optimizing air circulation, humidity, and other parameters could reduce energy demand and enhance food quality. Another study [21] explored a rotating triplex-tube latent heat thermal energy storage system. Using the Aguchi design and response surface method, researchers optimized the fin structure to improve heat absorption efficiency and melting duration. This optimization resulted in a 7.37% decrease in overall melting duration and a 7.23% increase in average heat absorption rate by adjusting parameters like fin length, width, and rotation angle.
In terms of refrigeration systems powered by solar energy, two types of solar cooling are available. The first type is driven by photovoltaic energy, while the second one makes use of solar thermal energy as the heat source such as absorption and adsorption [22]. Alrwashdeh and Ammari [23] introduced a comparison between photovoltaic cooling and thermally driven refrigeration employing solar-evacuated tube collectors. The results demonstrated that both systems are beneficial compared to their prices. However, the photovoltaic system proved to have more benefits, such as availability, simplicity, and ease of maintenance.
Dai et al. [24] proposed a hybrid system that uses solar thermal energy and waste heat from a gas cooler instead of a traditional CO2 booster refrigeration system. The authors compared four configurations. Overall, the results showed that the hybrid absorption system is more beneficial. For example, the COP is 3.05–42.30% higher than that of the baseline model. Similarly, the annual coefficient of the performance enhancement rate reached 13.65% and 14.47% in Guangzhou and Haikou, respectively. Another study developed a solar-driven compression-assisted desorption/chemisorption refrigeration/cold energy storage system [25]. The authors stated that the proposed system can work with hot water above 70 °C as the heat source. When using water with a temperature of 90 °C, the system could supply an evaporative temperature of −10 °C, a condensing temperature of 40 °C, and a COP of 5.5. The purpose of the system is to be used in refrigerated warehouses to precool freshly harvested fruits and vegetables. Sur et al. [26] proposed a milk chilling system that utilizes solar heat adsorption. The results showed that for a desorber bed temperature at 80 °C, the specific cooling power is 52–57 kW/kg. In another study [27], solar adsorption cooling was evaluated across four sites in sub-Saharan Africa. The findings revealed that Beitbridge emerged as the most suitable location, with a specific cooling power of 3.18 W/kg and a solar coefficient of performance of 0.131. Xu et al. [28] studied an absorption subcooled compression used for cold storage. An evacuated tube collector was employed. The results indicated an annual peak energy savings of 68.8 kWh/m2 per collector surface. As for the economic results, the authors demonstrated a minimum payback period of 4.96 years and an internal rate of return of 15.4%.
With respect to cold storage facilities powered by photovoltaic (PV) energy, research shows that it holds a promising future. The work conducted by Liu et al. [29] discusses the potential of PV power-based energy systems for cold storage facilities in the Ningbo region of China. The study considered three main scenarios for electricity generation: PV only, PV with electric energy storage (EES), and PV with cold energy storage (CES). The assessment considered economic, energy, and environmental factors. The authors concluded that adopting a PV-based energy system offers significant benefits for the region. The advantages include avoiding 26.2582 million tons of pollutant emissions, decreasing 60.89% of electricity purchased from the power grid, and 6.64 billion RenMinBi of economic value. Another study by Luerssen et al. [30] evaluated three different load profiles for cooling a resort, a hotel, and a storage warehouse located in the Indonesian Rau Islands province. The results found that a diesel generator and PV coupled with batteries is the most cost-effective option. However, a combination of battery storage and cooling storage could prove to be slightly beneficial in the case of the resort since it requires cooling only in the nighttime. In another study, Ikram et al. [31] investigated a banana storage facility located in Mardan, Pakistan. The products need to be maintained at a temperature of 15 °C for 4 to 5 days after being preheated to 25 °C. The authors proposed a 161 m2 PV array with 48 modules. The payback period of the proposed system is 5.2 years. Du et al. [32] analyzed the cooling process of a warehouse powered by PV power. Instead of using batteries, the electricity generated is directly used in the vapor compression refrigeration cycle to cool the warehouse. The excess cooling generated will be used for a separate cold water storage unit. The proposed system uses thermal storage as a backup system. Experimental analyses validated simulation results, showing the system capable of producing daily cold energy of 155.36 MJ, 135.90 MJ, and 107.78 MJ for sunny, partly cloudy, and cloudy conditions, respectively. Another study [33] investigated a cold room powered by PV used for fish storage across 18 African sites, and the research encompassed technical, economic, environmental, and social metrics. Tripoli, Libya, had the lowest Levelized Cost of Cooling at $0.1279/kWth, while Yamoussoukro, Ivory Coast, had the shortest discounted payback period at 1.84 years. Kinshasa, Congo, and Accra, Ghana, showed the highest employment potential, with 53.47 and 53.617 jobs, respectively.
After a thorough review of the existing literature, it is evident that photovoltaic-generated power has great potential for use in cold storage facilities. For further details on various solar refrigeration processes, readers are referred to comprehensive review papers such as [34]. This study specifically focuses on studying a cold room in a local market in Fez, Morocco, for fish storage. The research questions addressed in this paper are as follows:
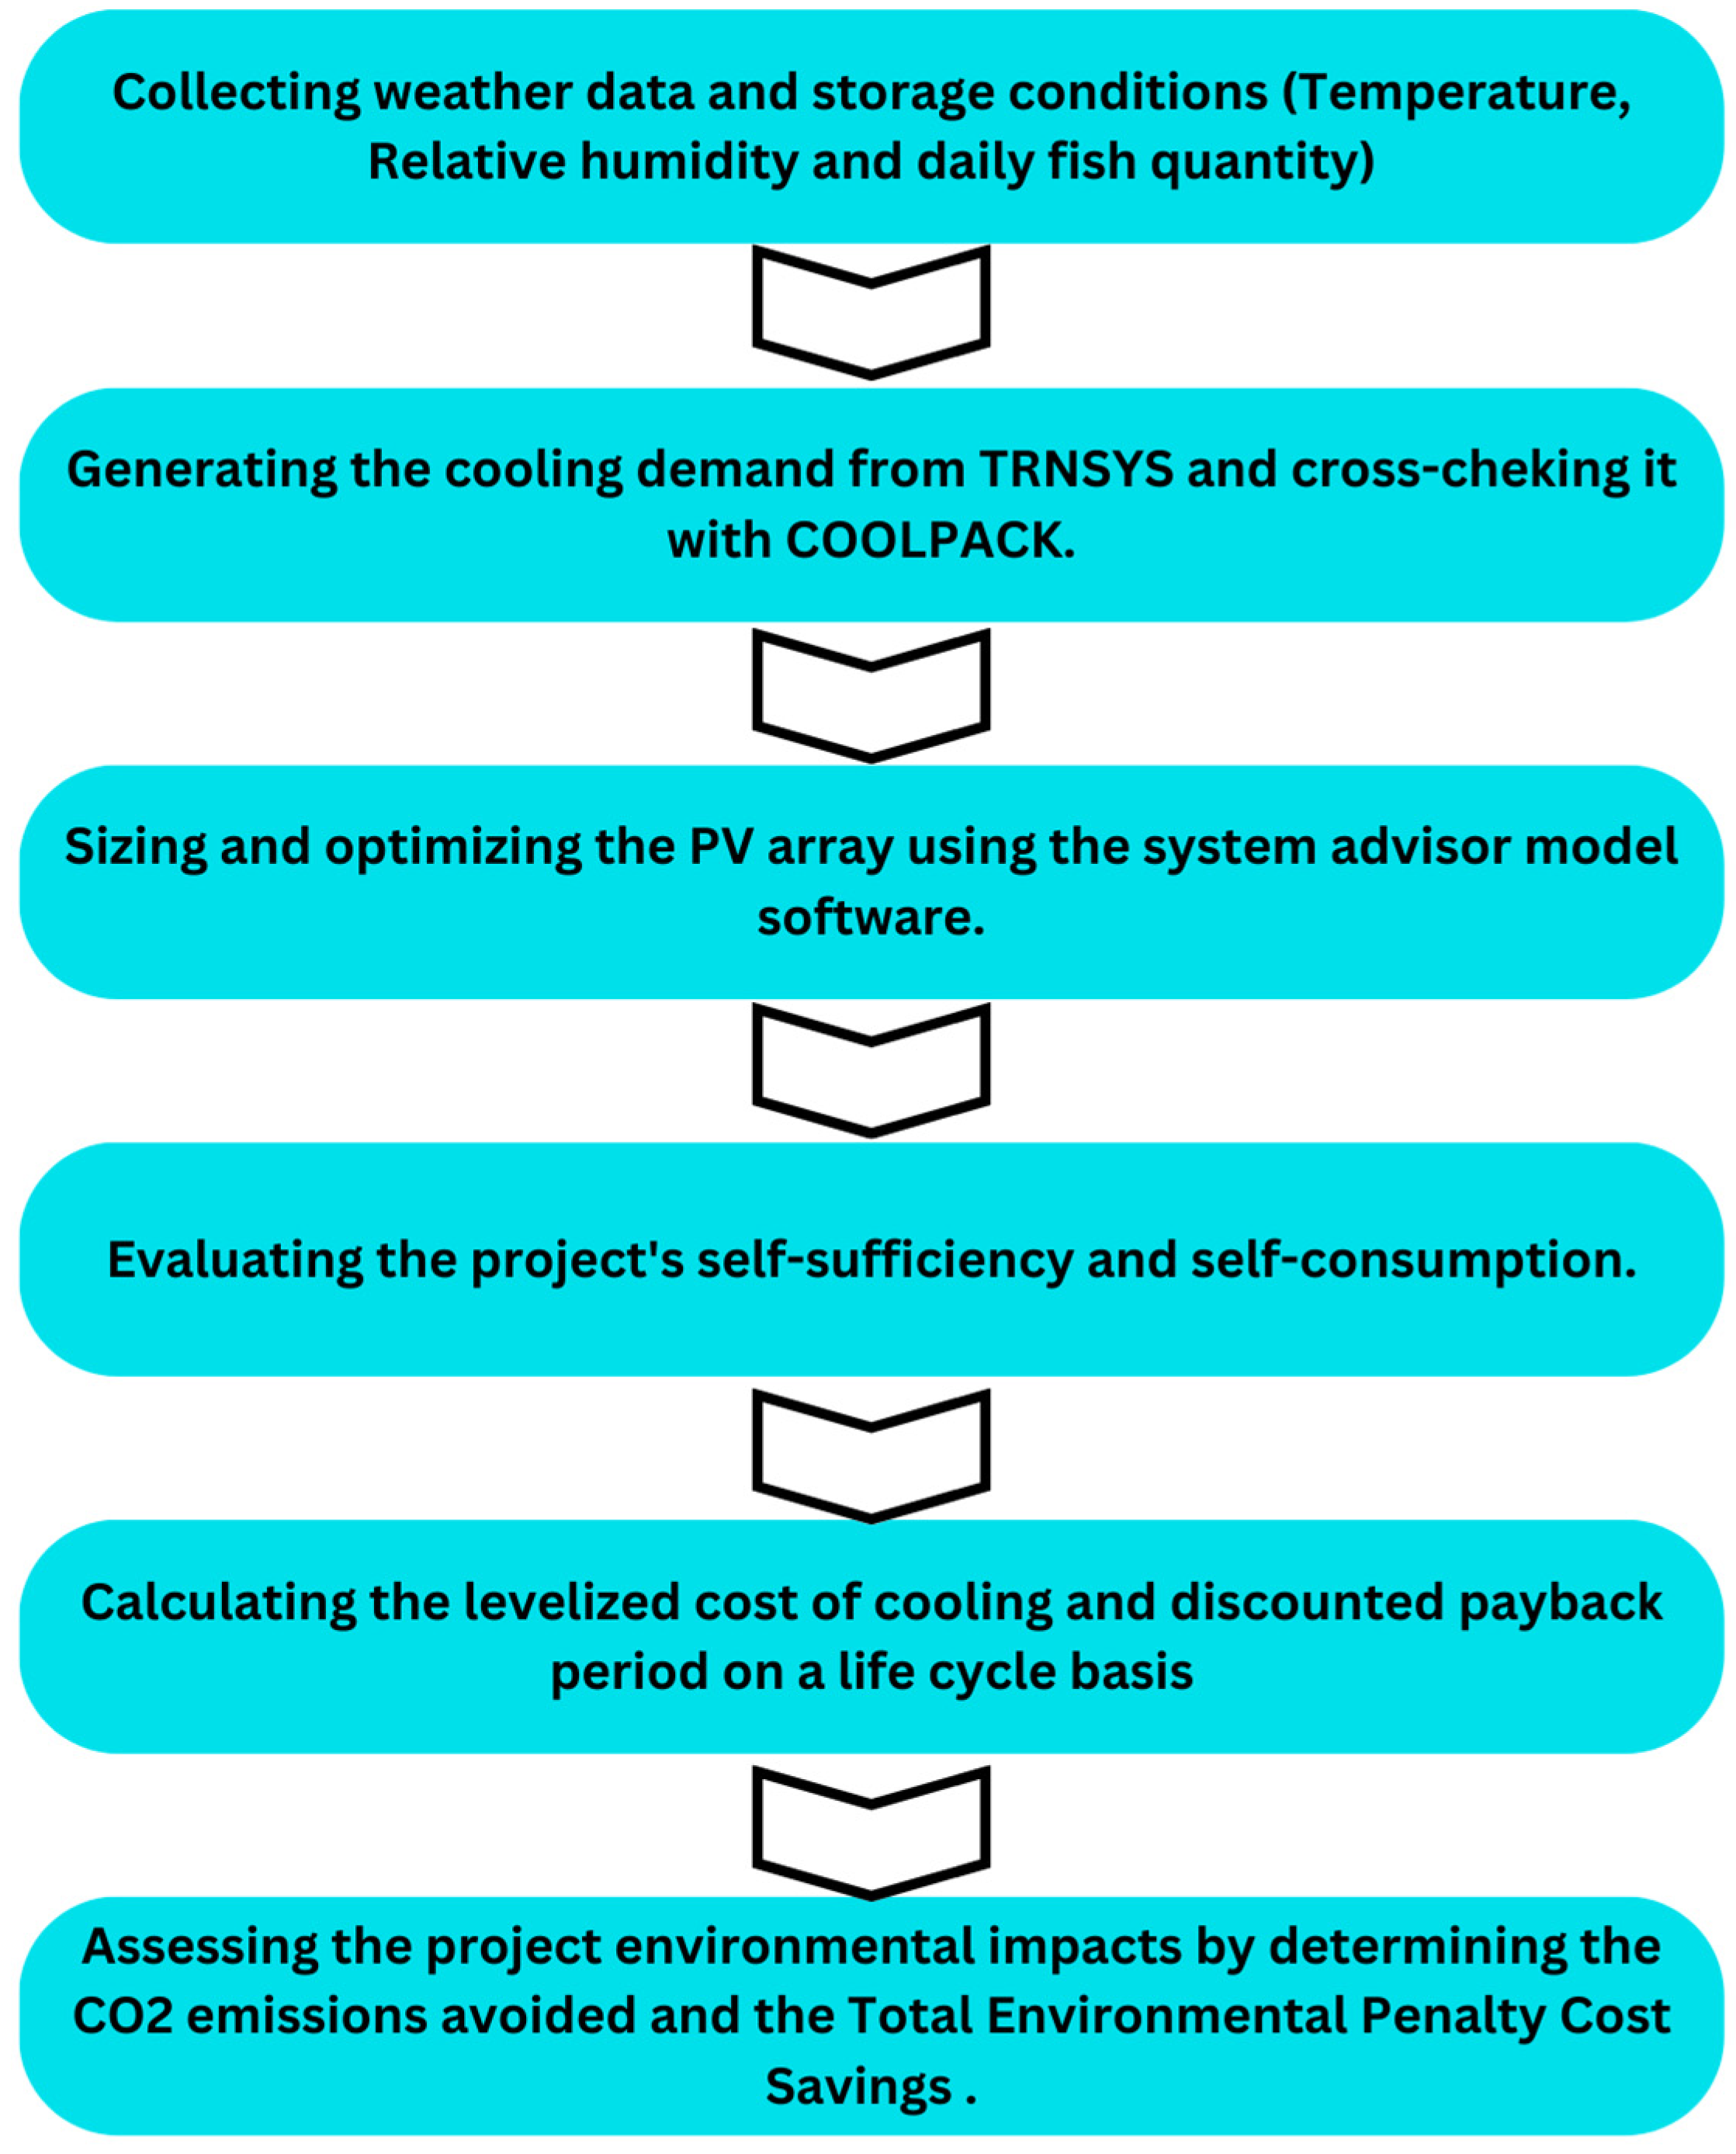
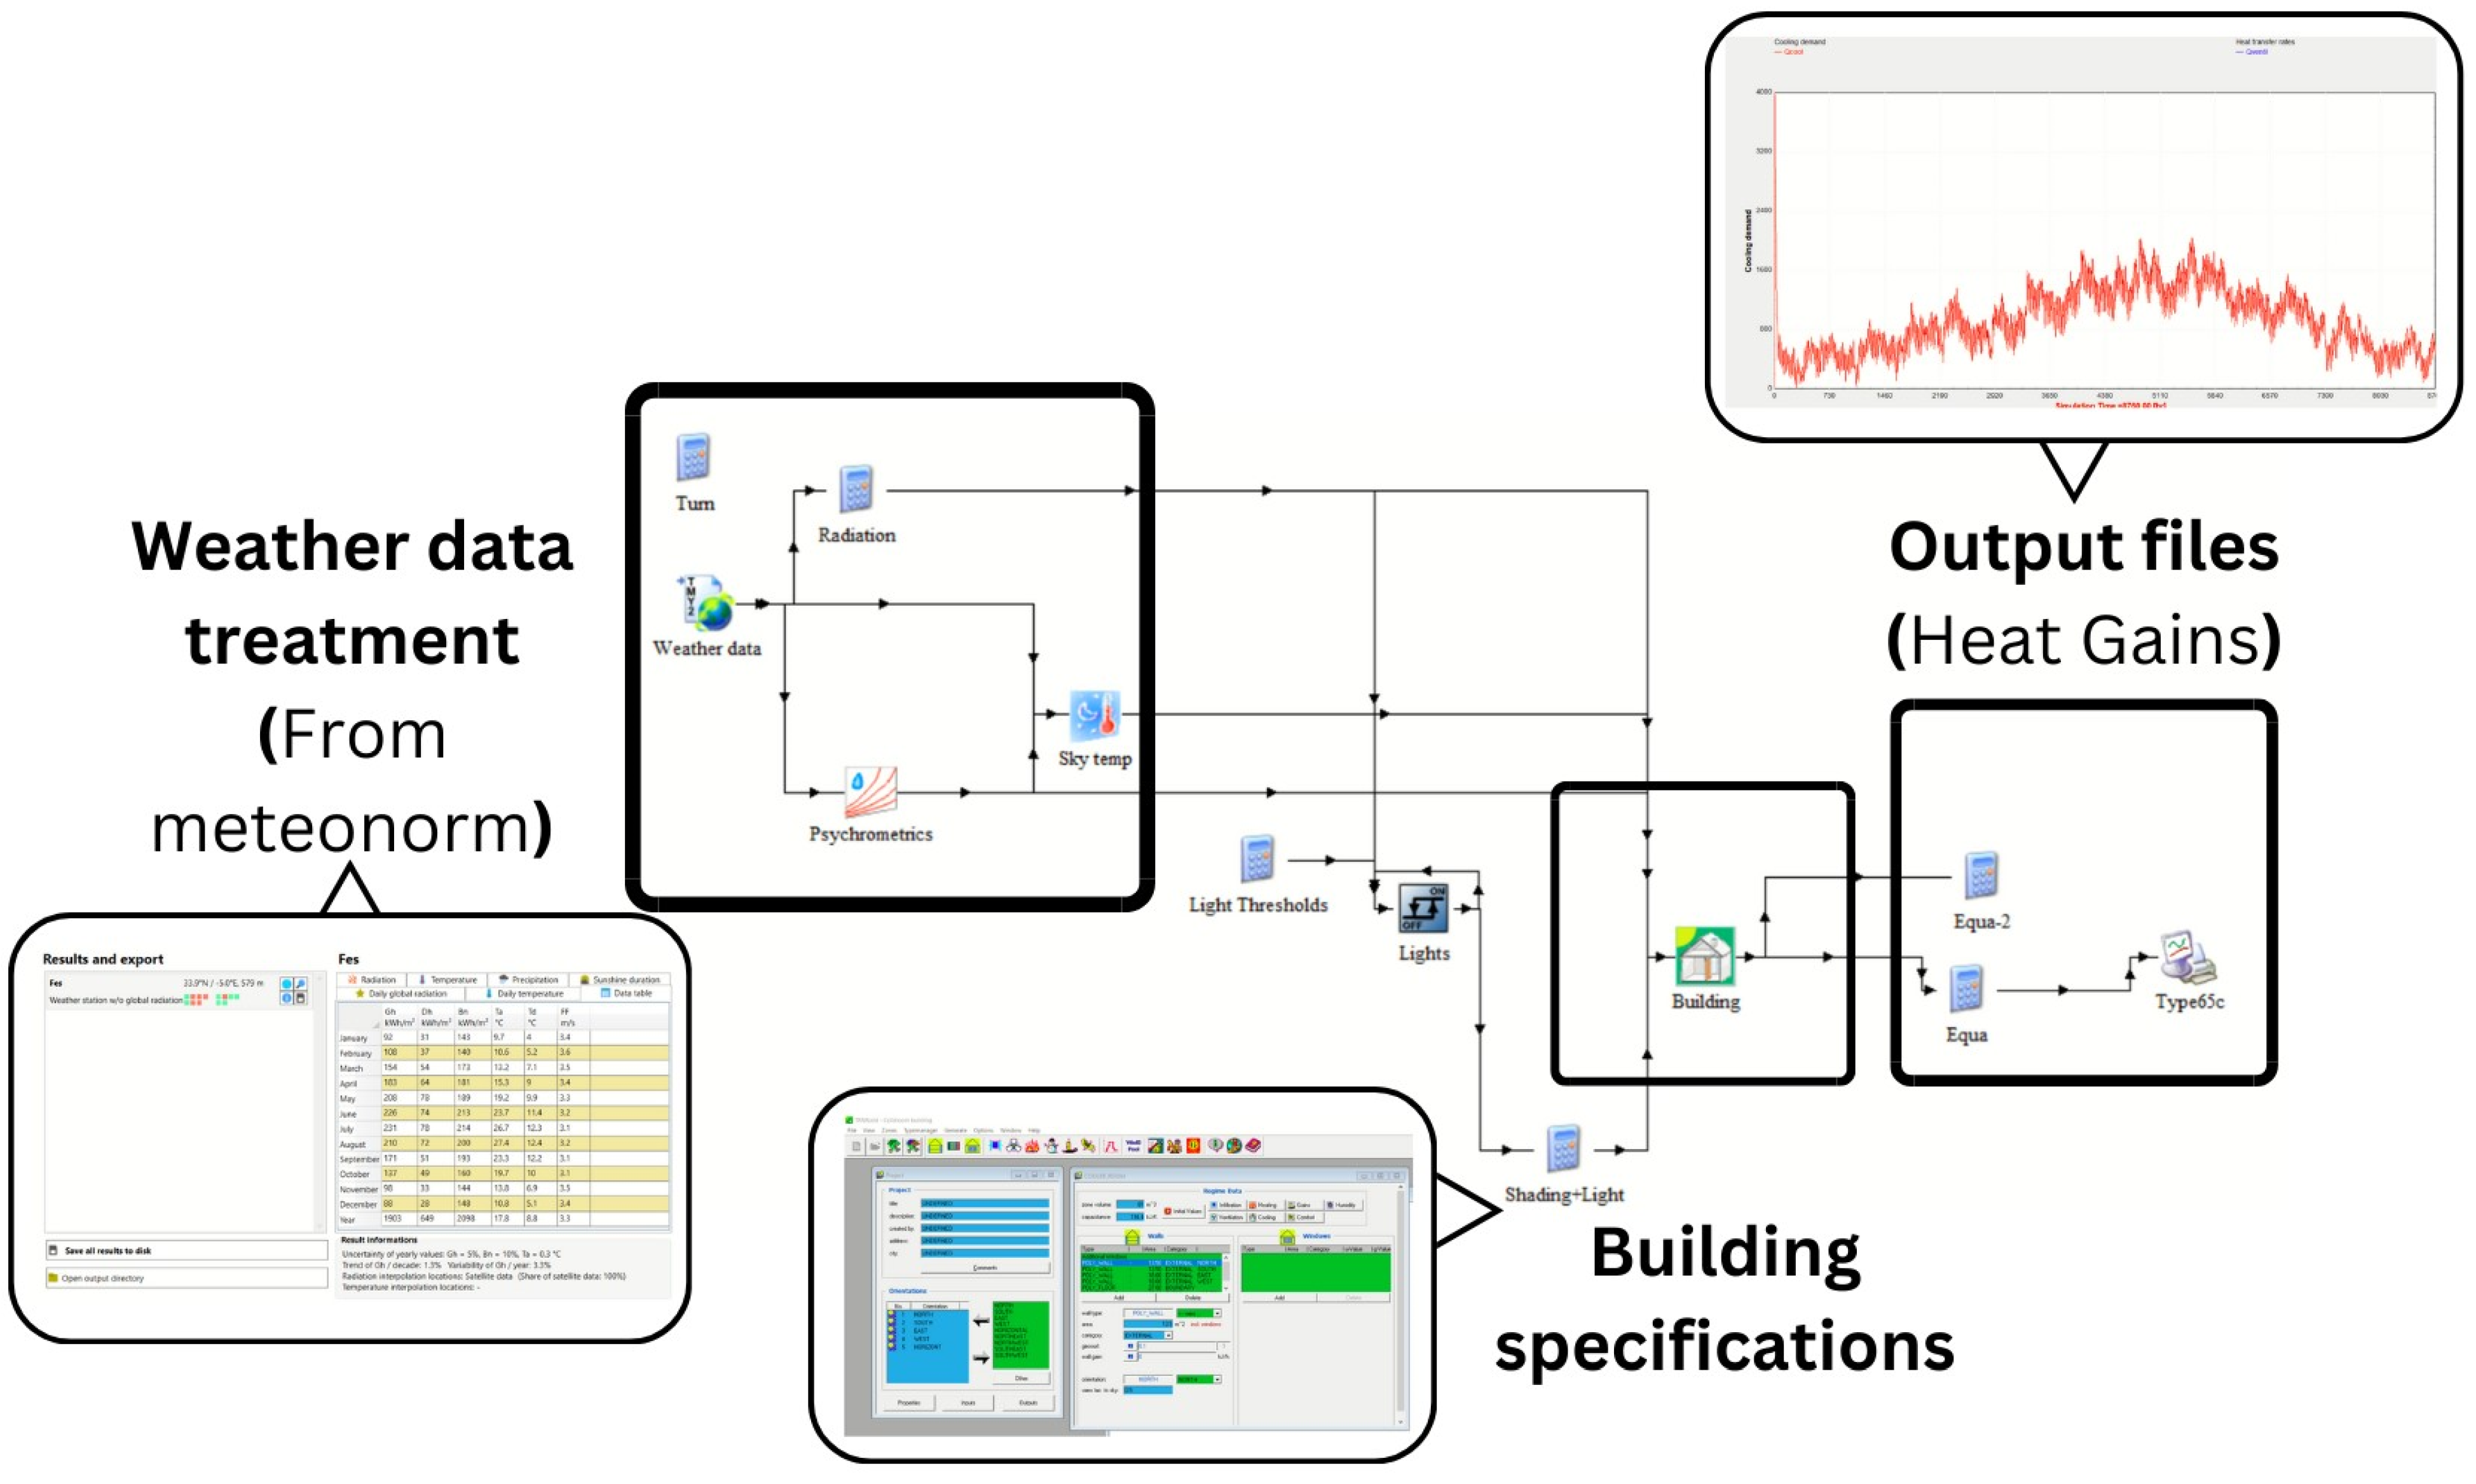
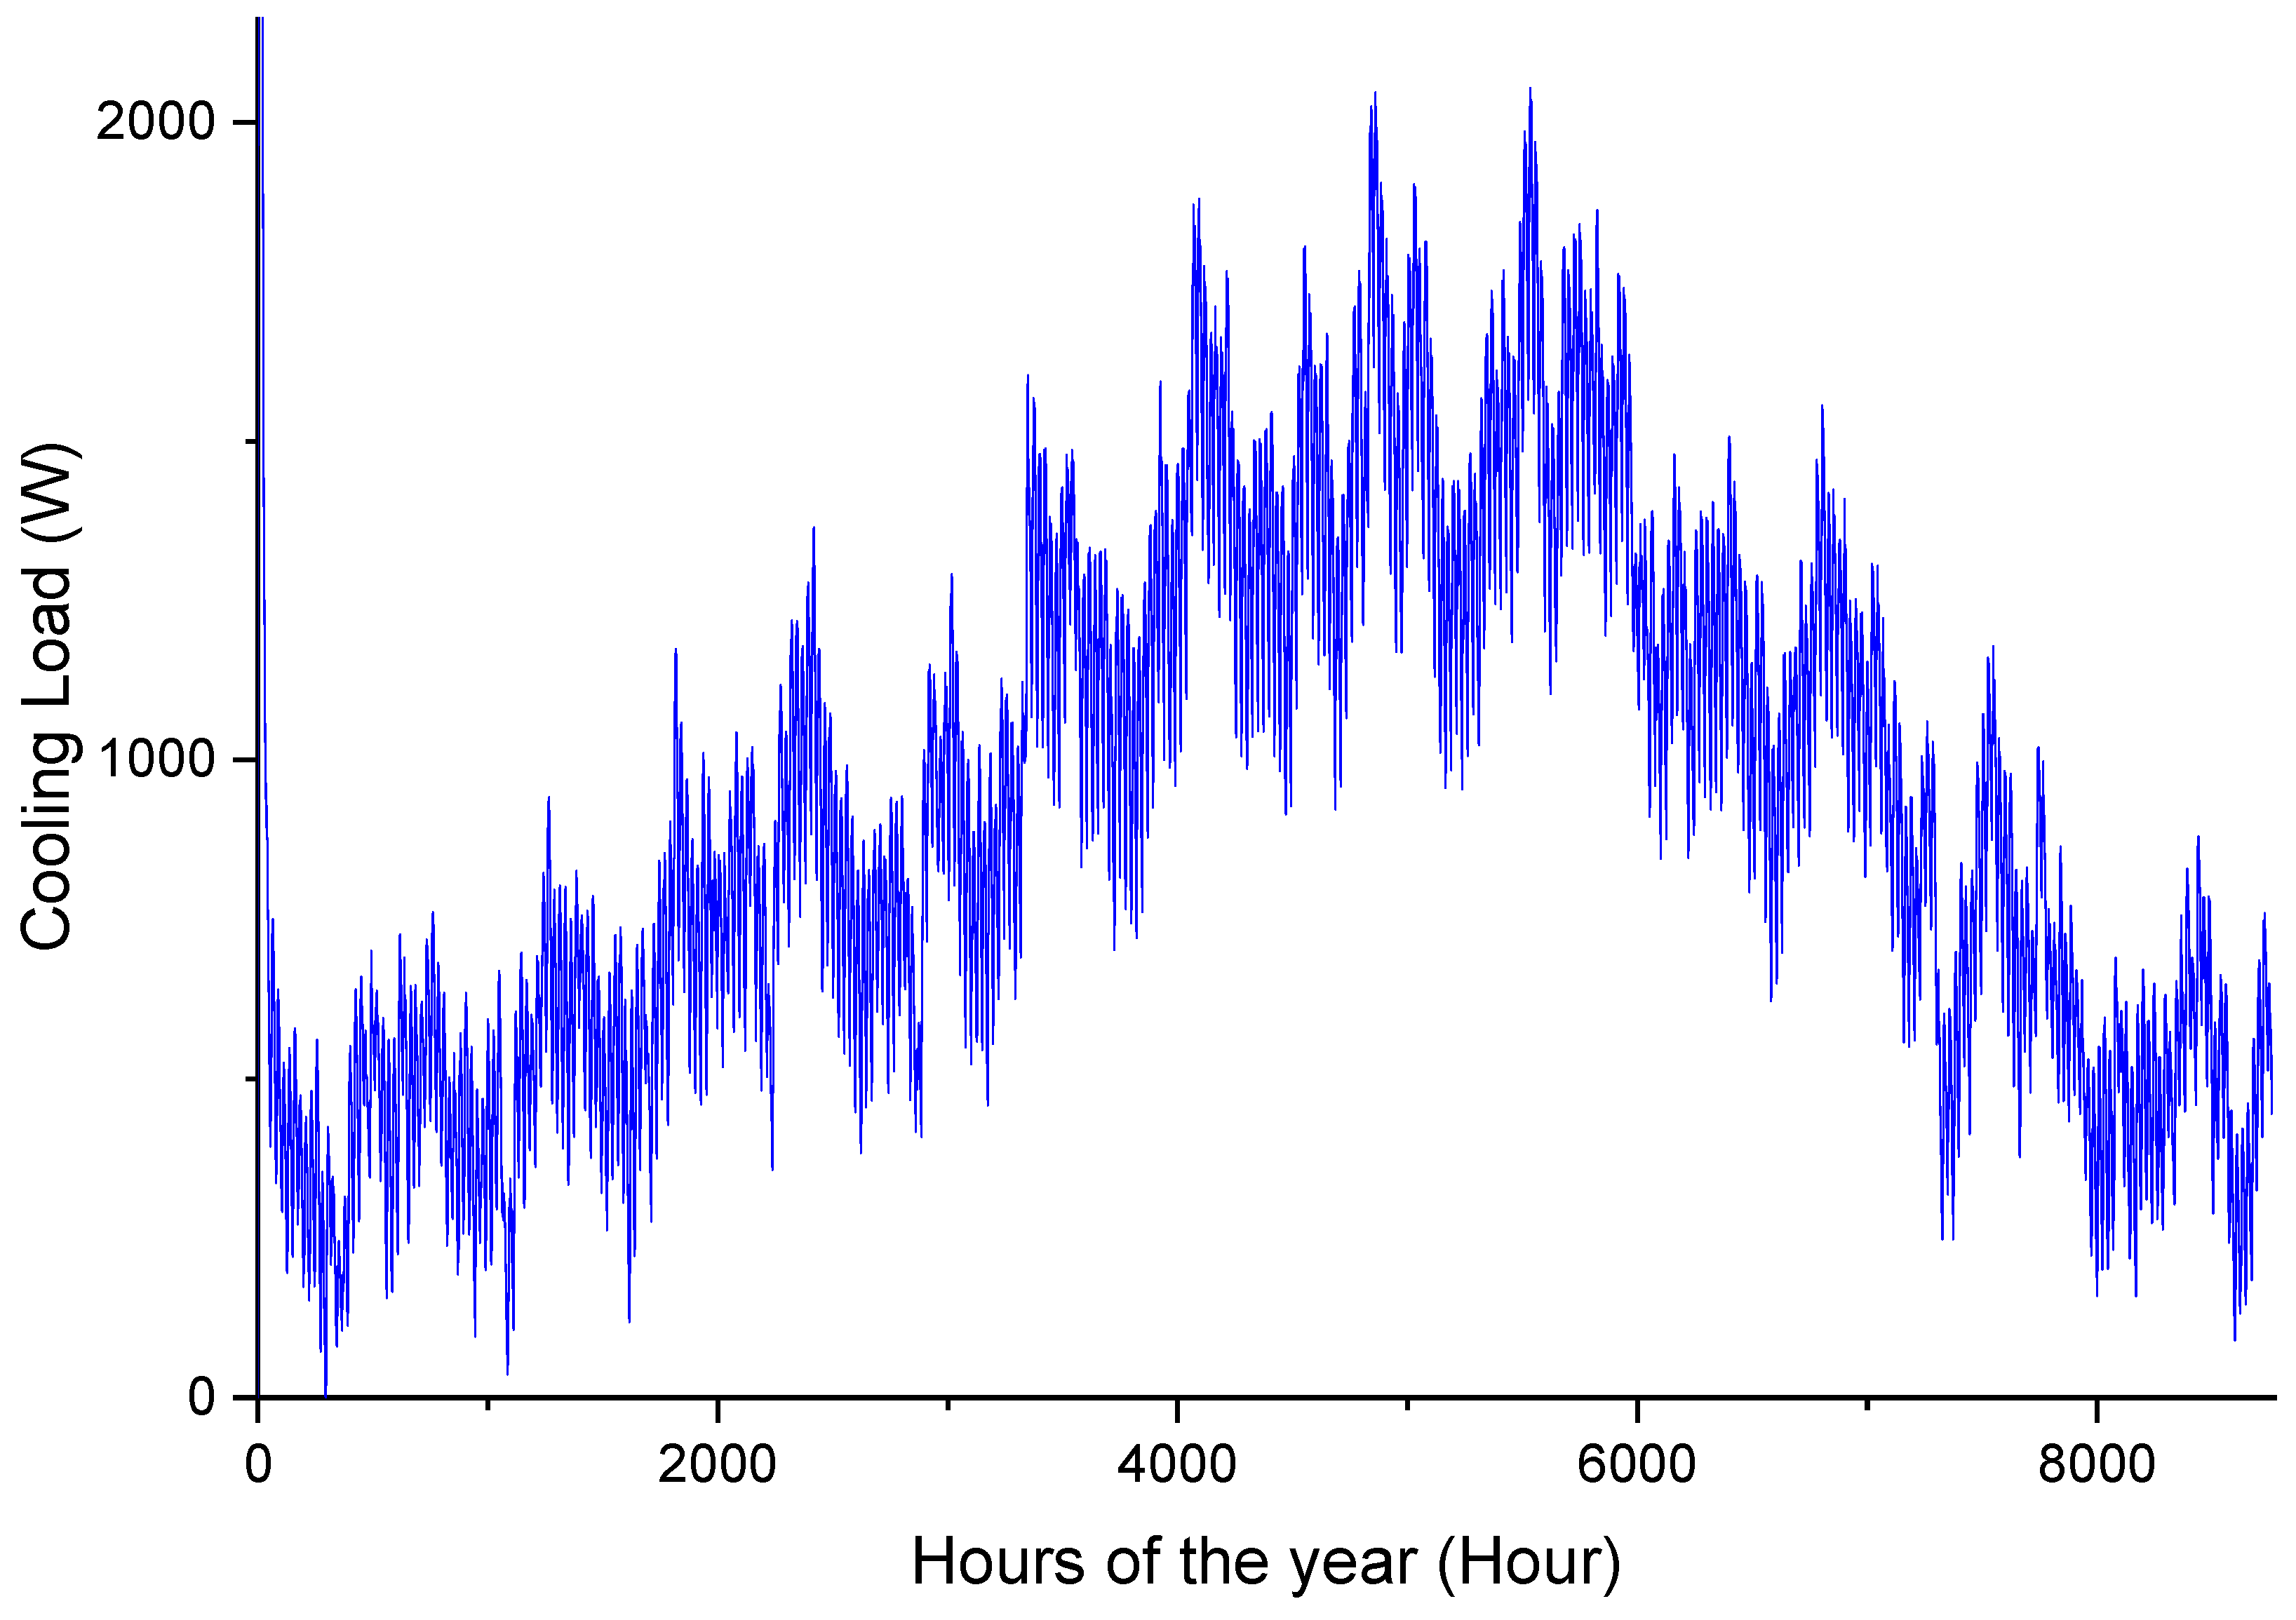
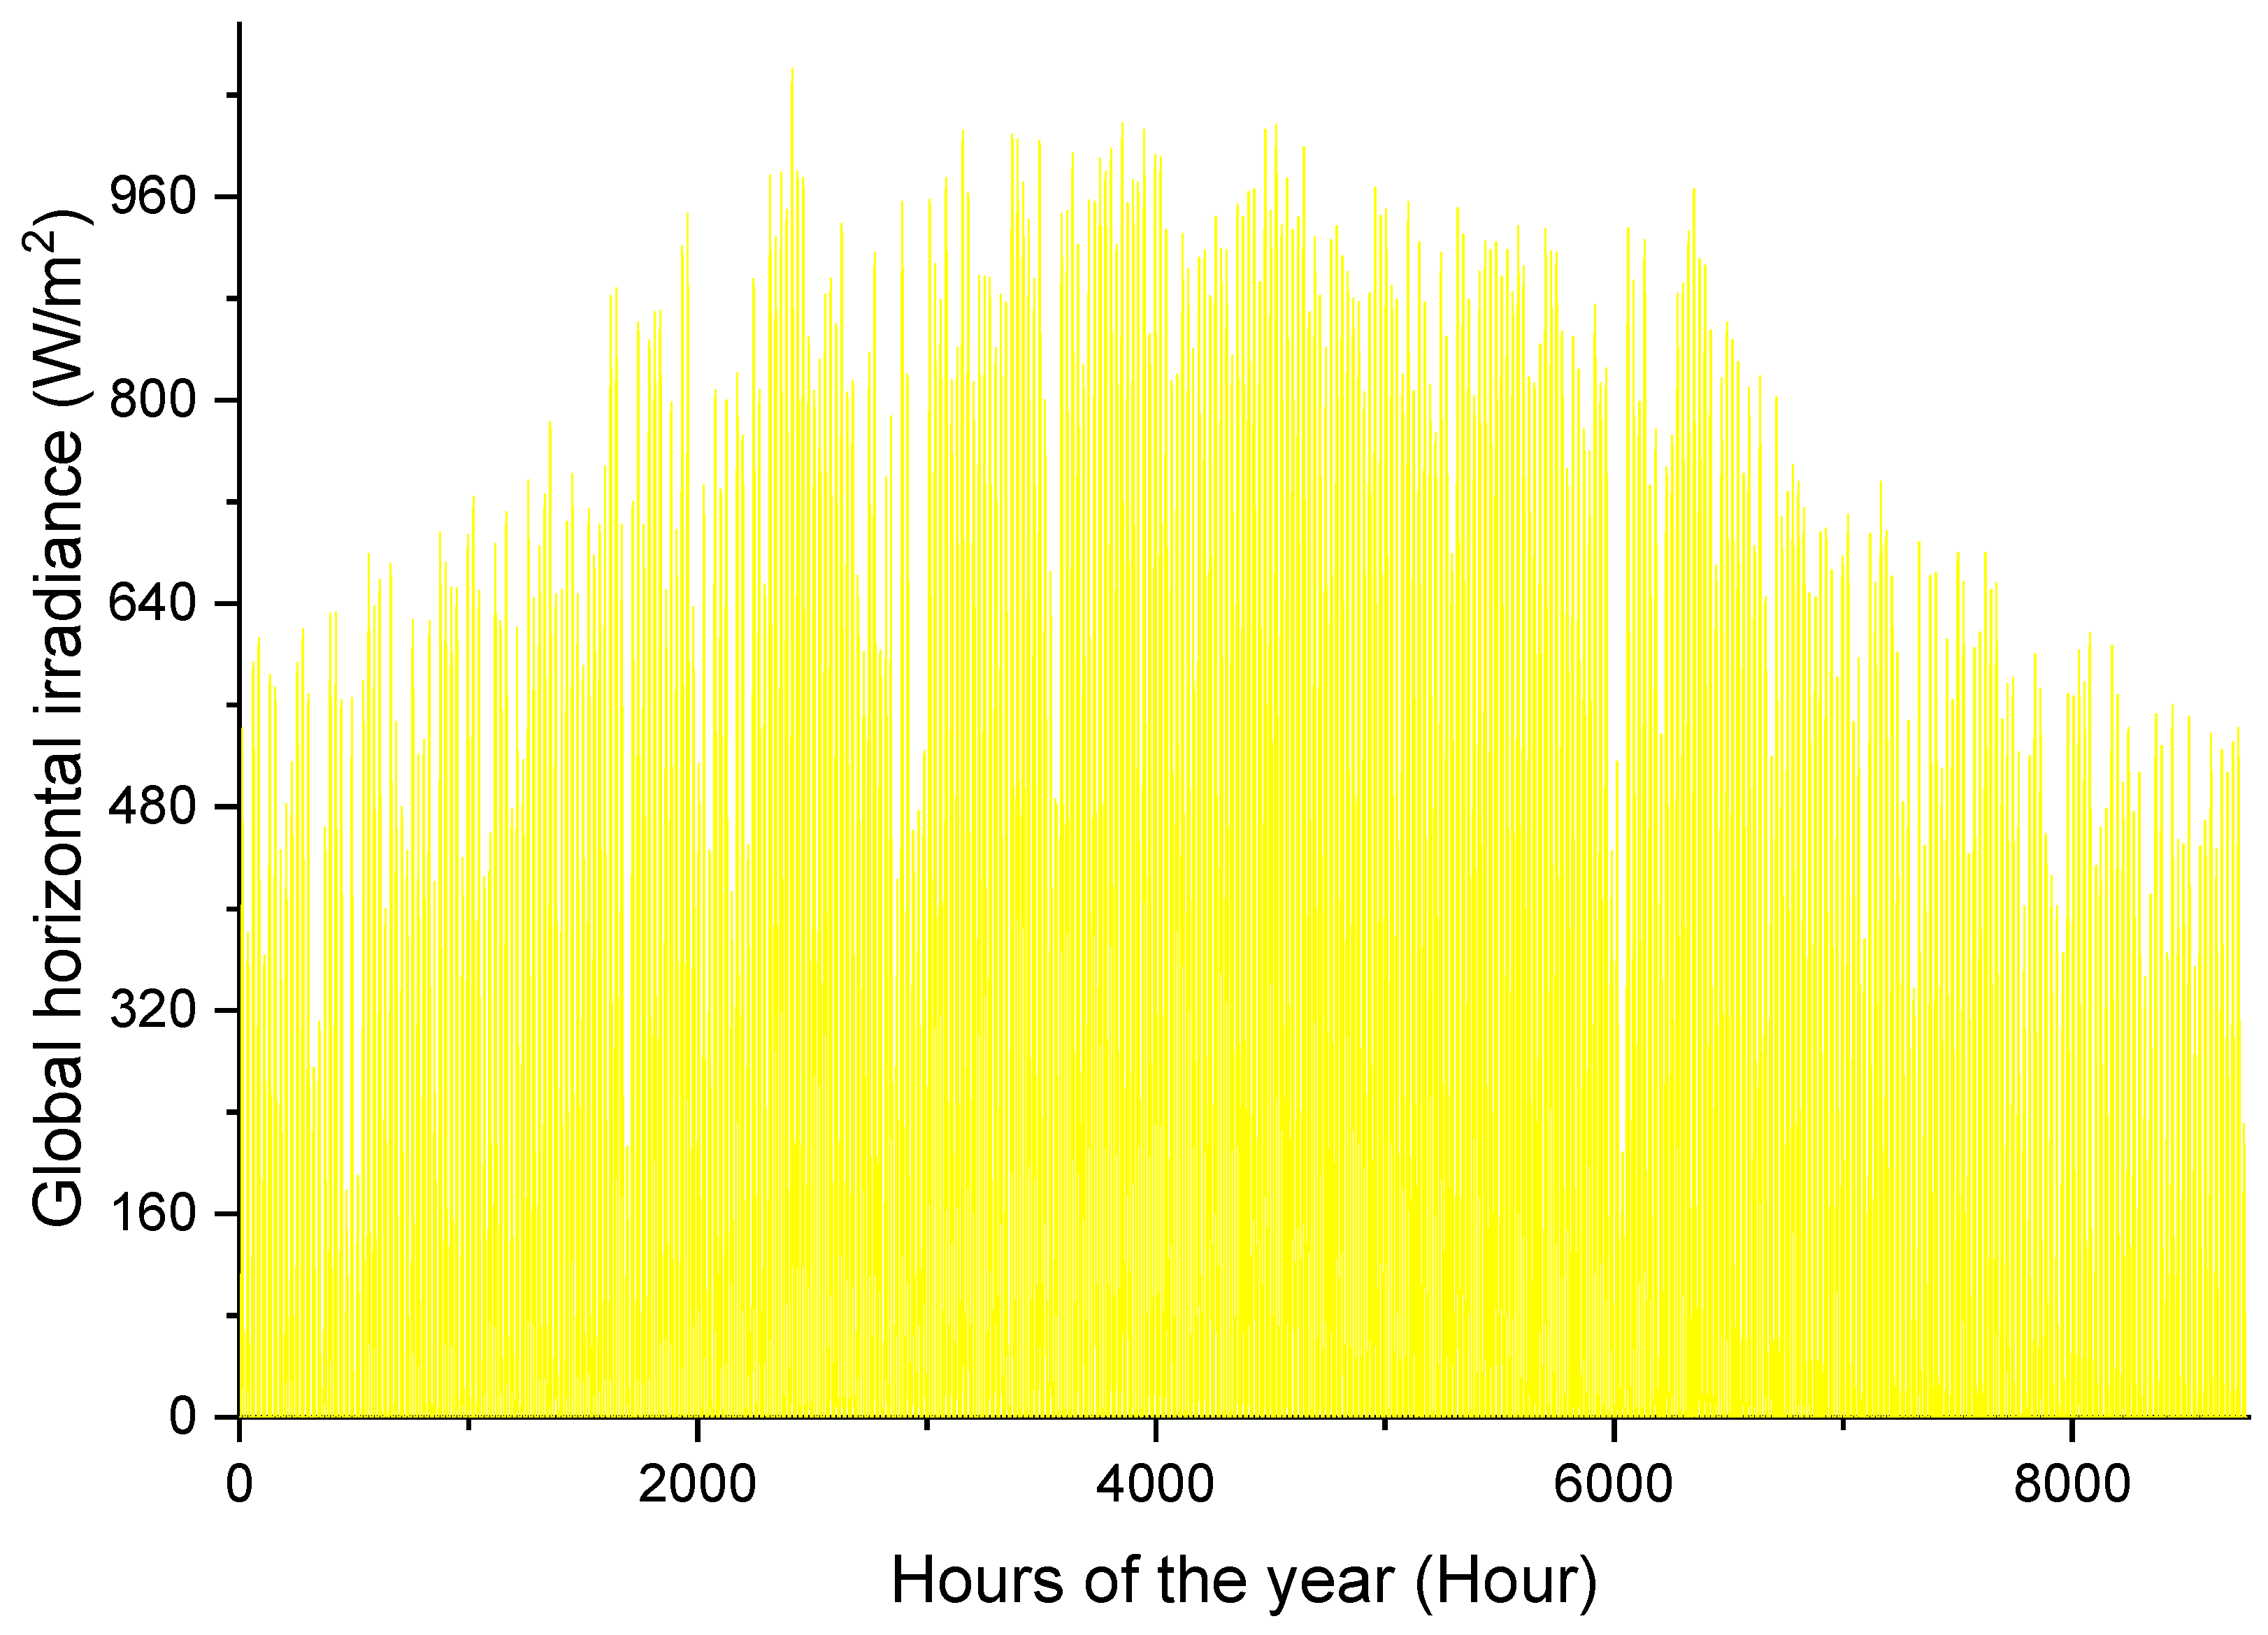
  • A comprehensive investigation to highlight the dynamic behavior of the cold room, using TRNSYS 16 software, which effectively generates hourly cooling load profiles, adapted to the prevalent weather conditions.
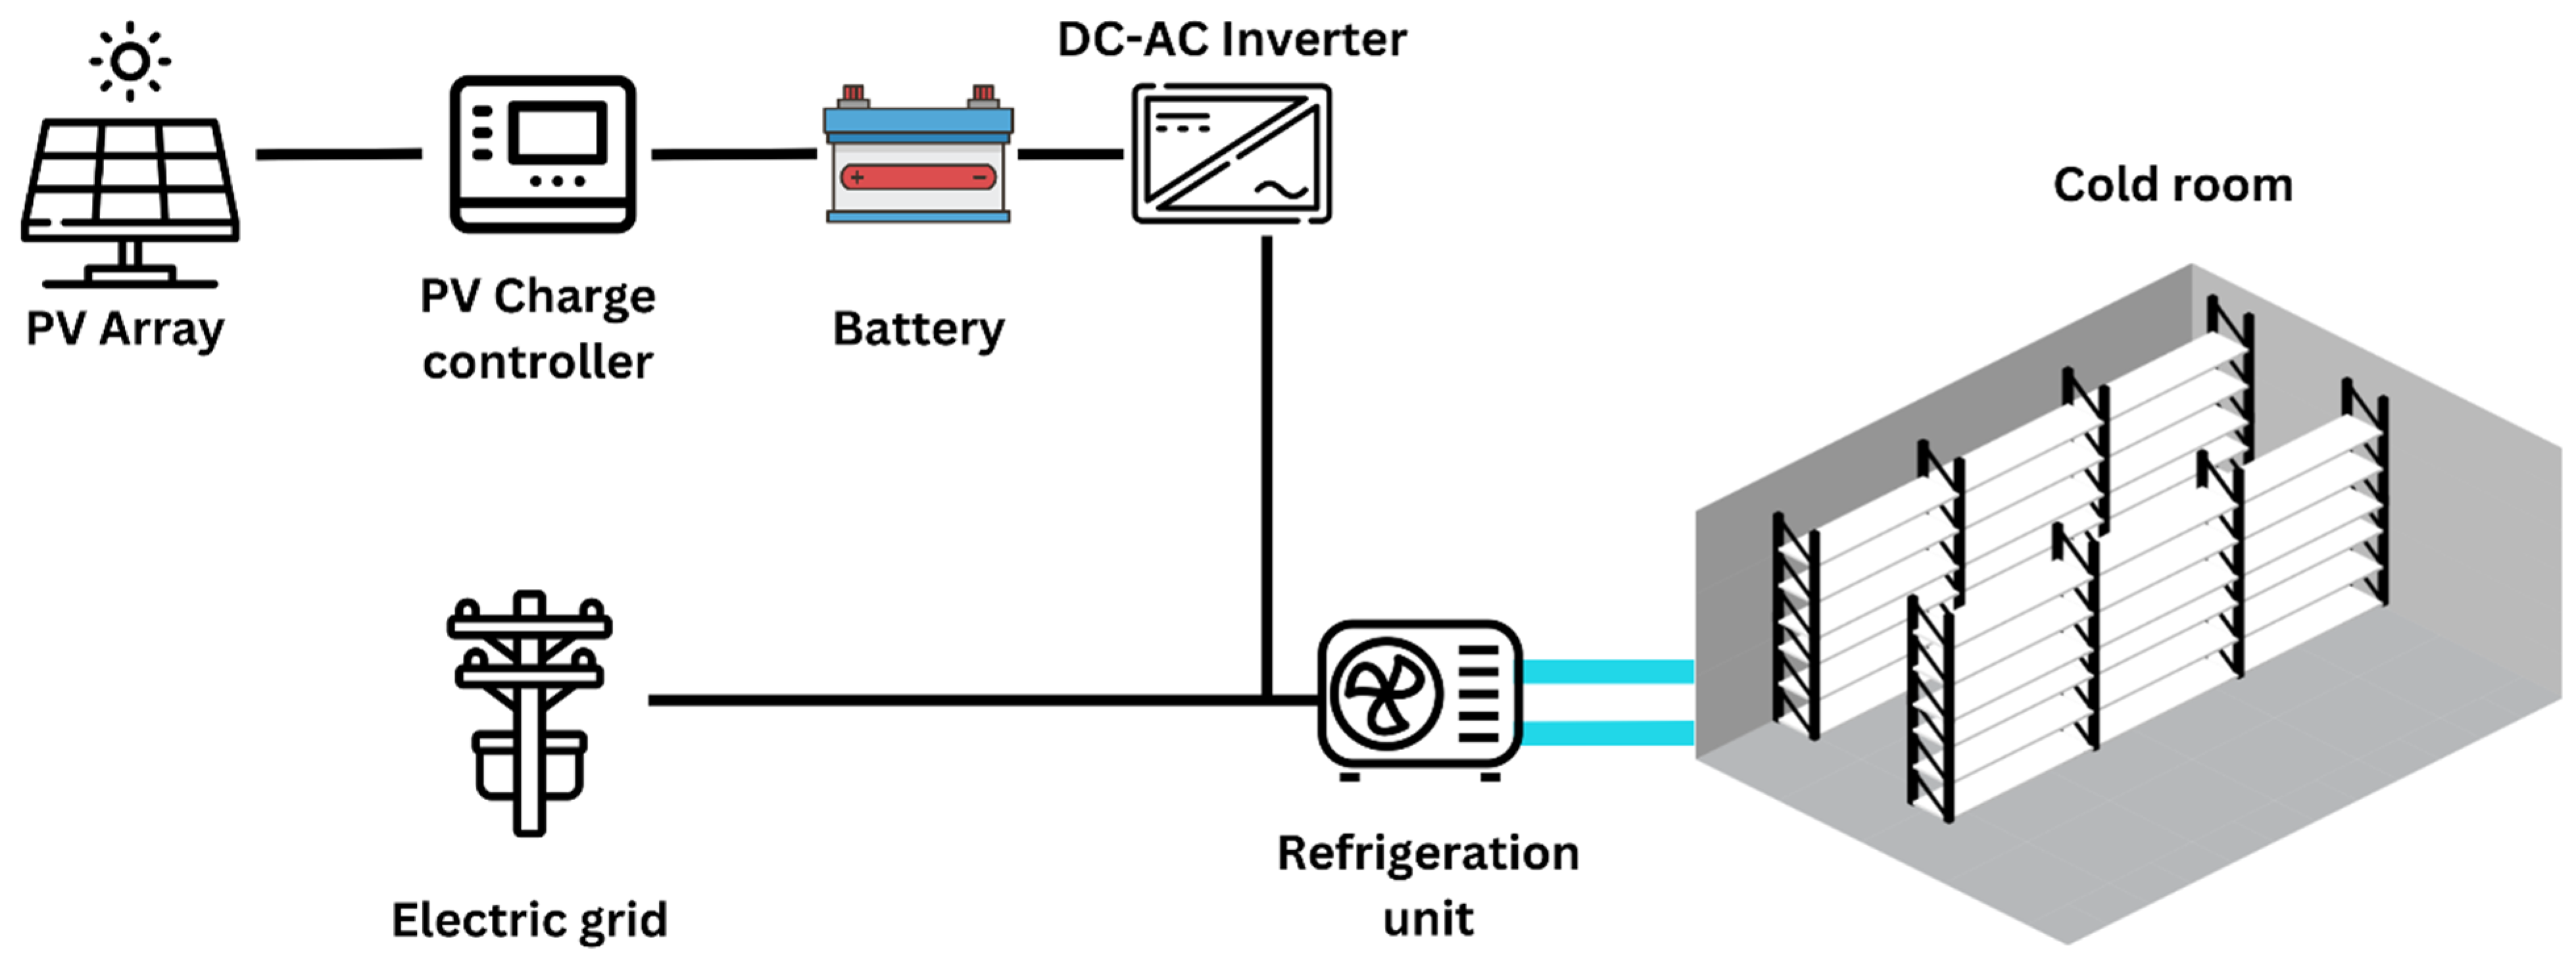
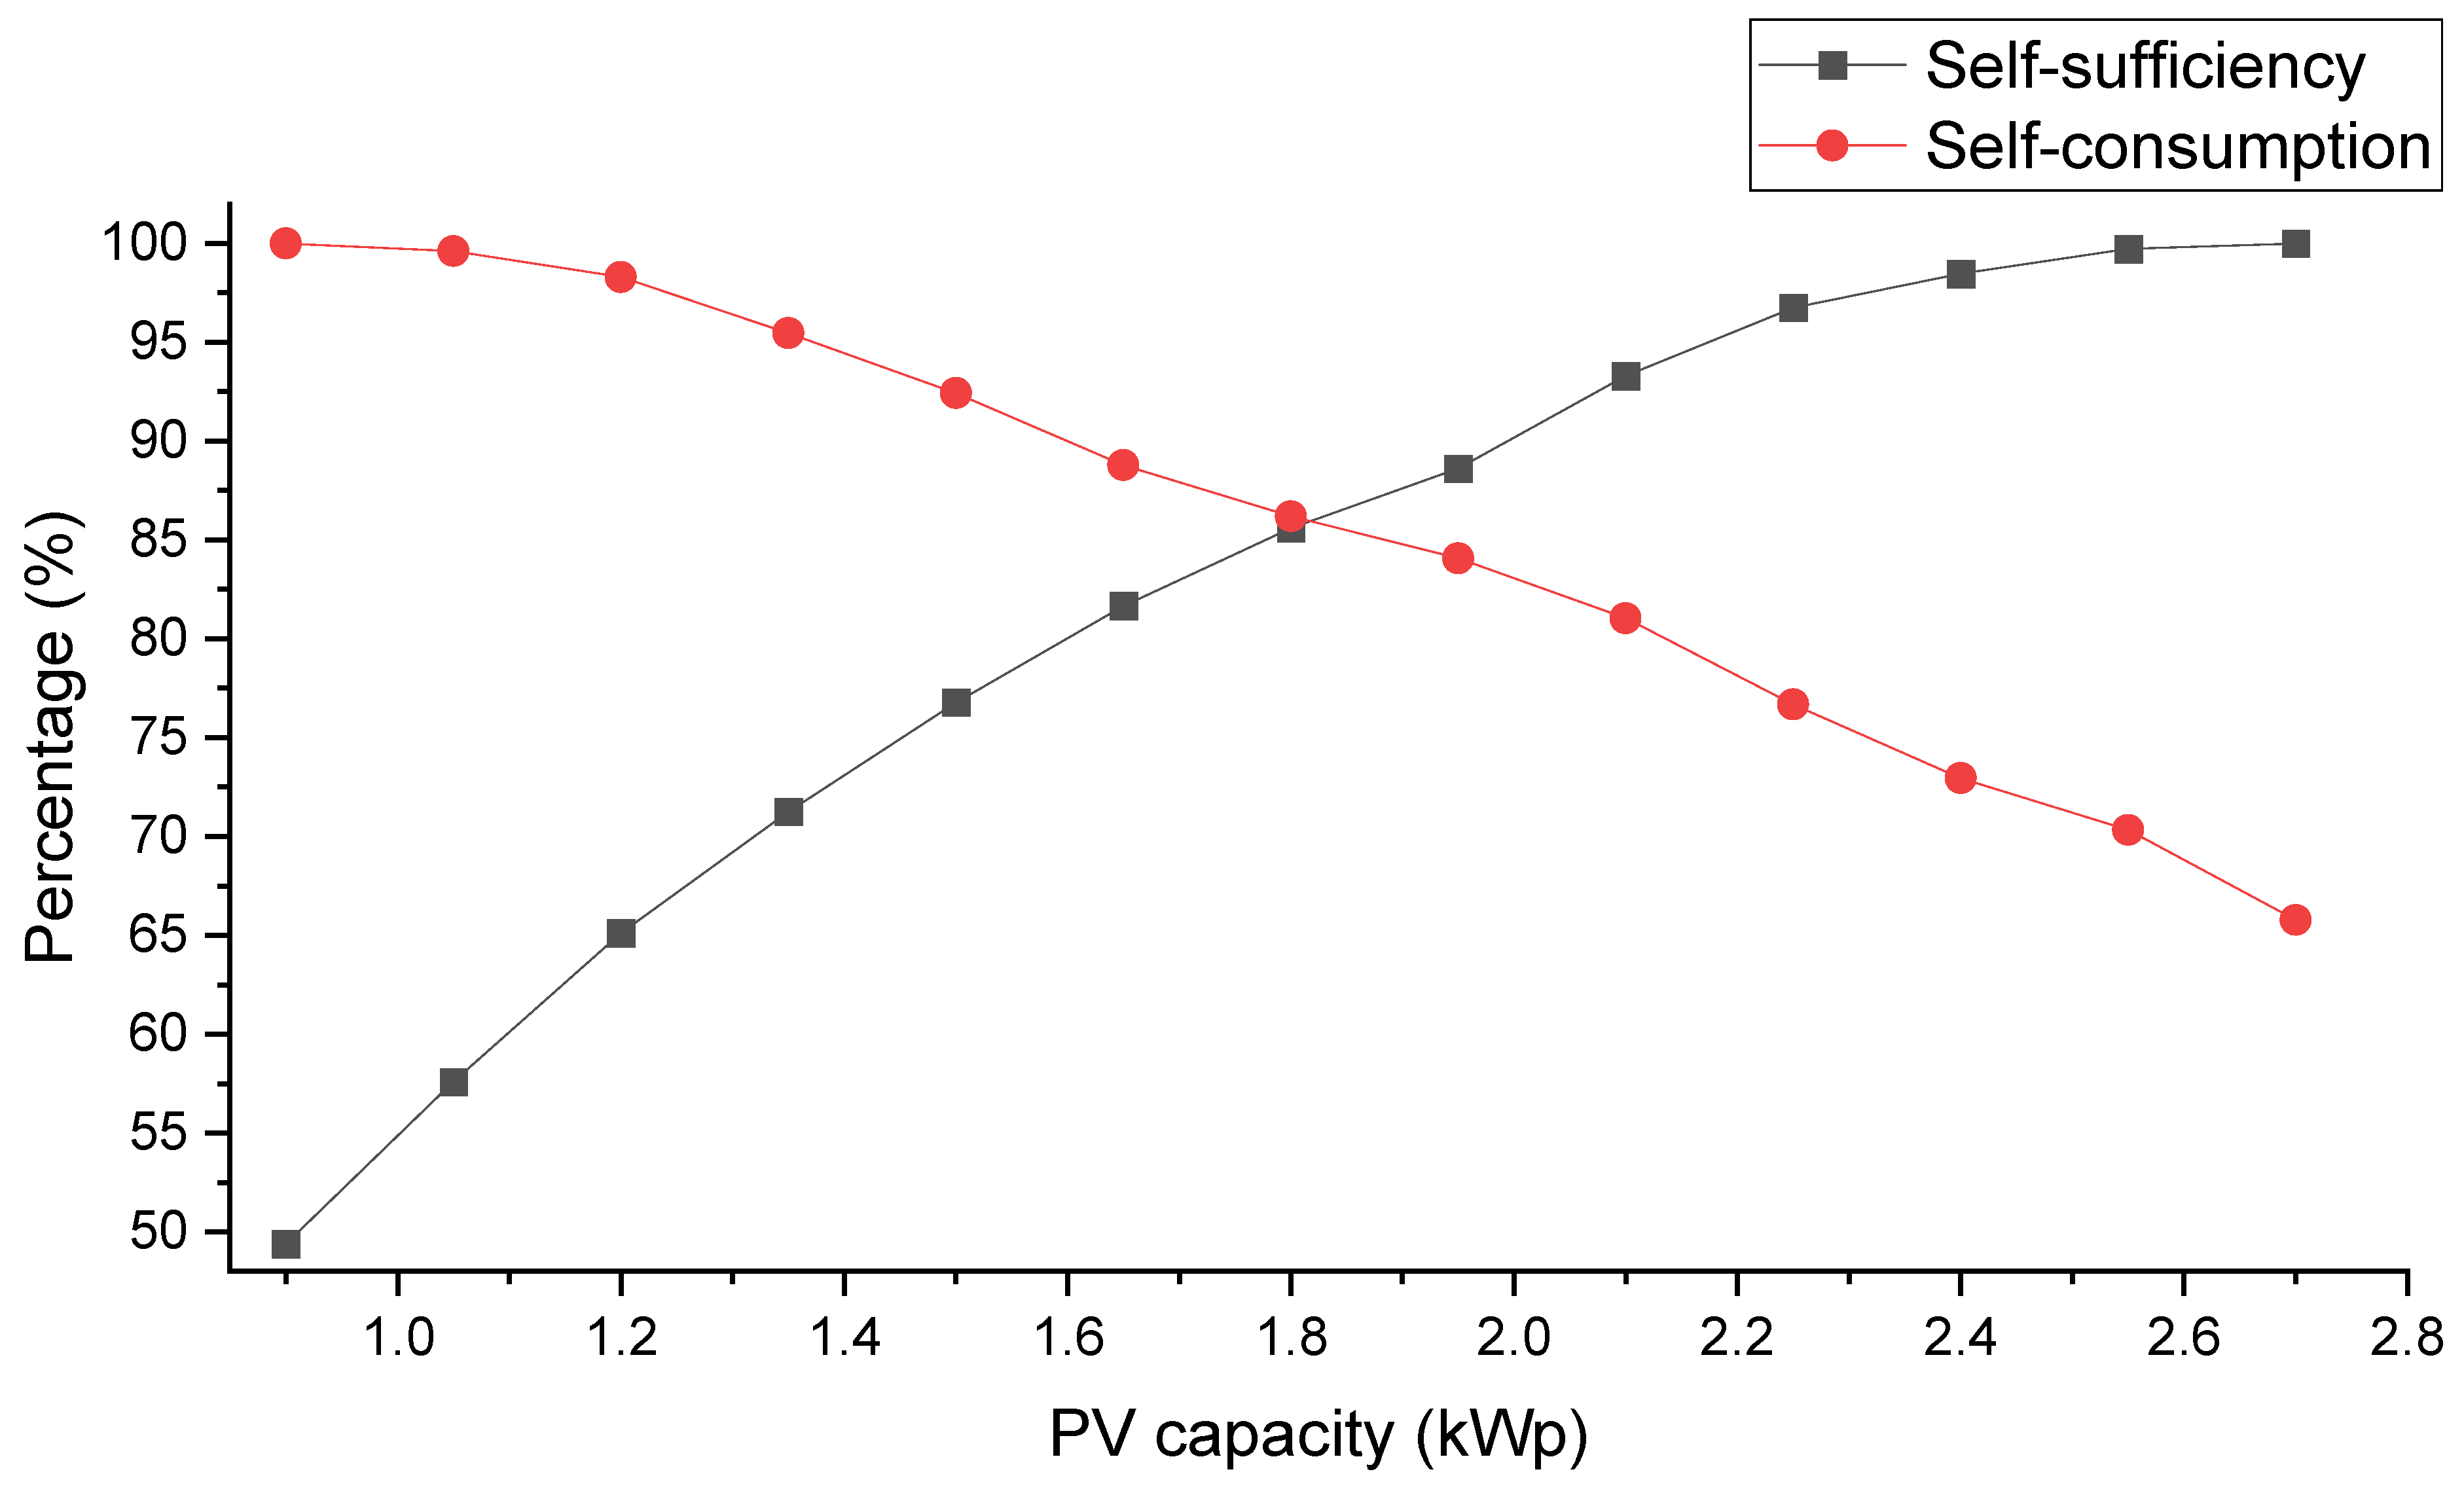
  • Design and simulation of the PV arrays via SAM 2017.9.5 software, which offers a precise quantification of the electricity generation capability to power cold rooms. Energy performance involving pertinent annual metrics such as self-sufficiency and self-consumption is also conducted.
  • An incisive assessment of the project’s economic viability, hinging on an extensive life cycle assessment encompassing significant metrics including the Levelized Cost of Cooling and the discounted payback period, which collectively portray the system’s long-term financial feasibility.
  • Determining the environmental impact by calculating the total CO2 emissions avoided and the consequent total environmental penalty cost savings, offering insight into the system’s contribution towards sustainability.
The outcomes of this study have a clear impact, by illustrating the benefits of shifting from conventional local markets towards environmentally sustainable and ecologically conscious marketplaces in Morocco. The proposed methodology incorporates the updated cost data for diverse subsystems while including the concept of environmental accounting in the analysis. The insights and methodologies developed here have the potential to extend beyond Fez, Morocco, and support transitions in other Moroccan and African markets.

2. Methods

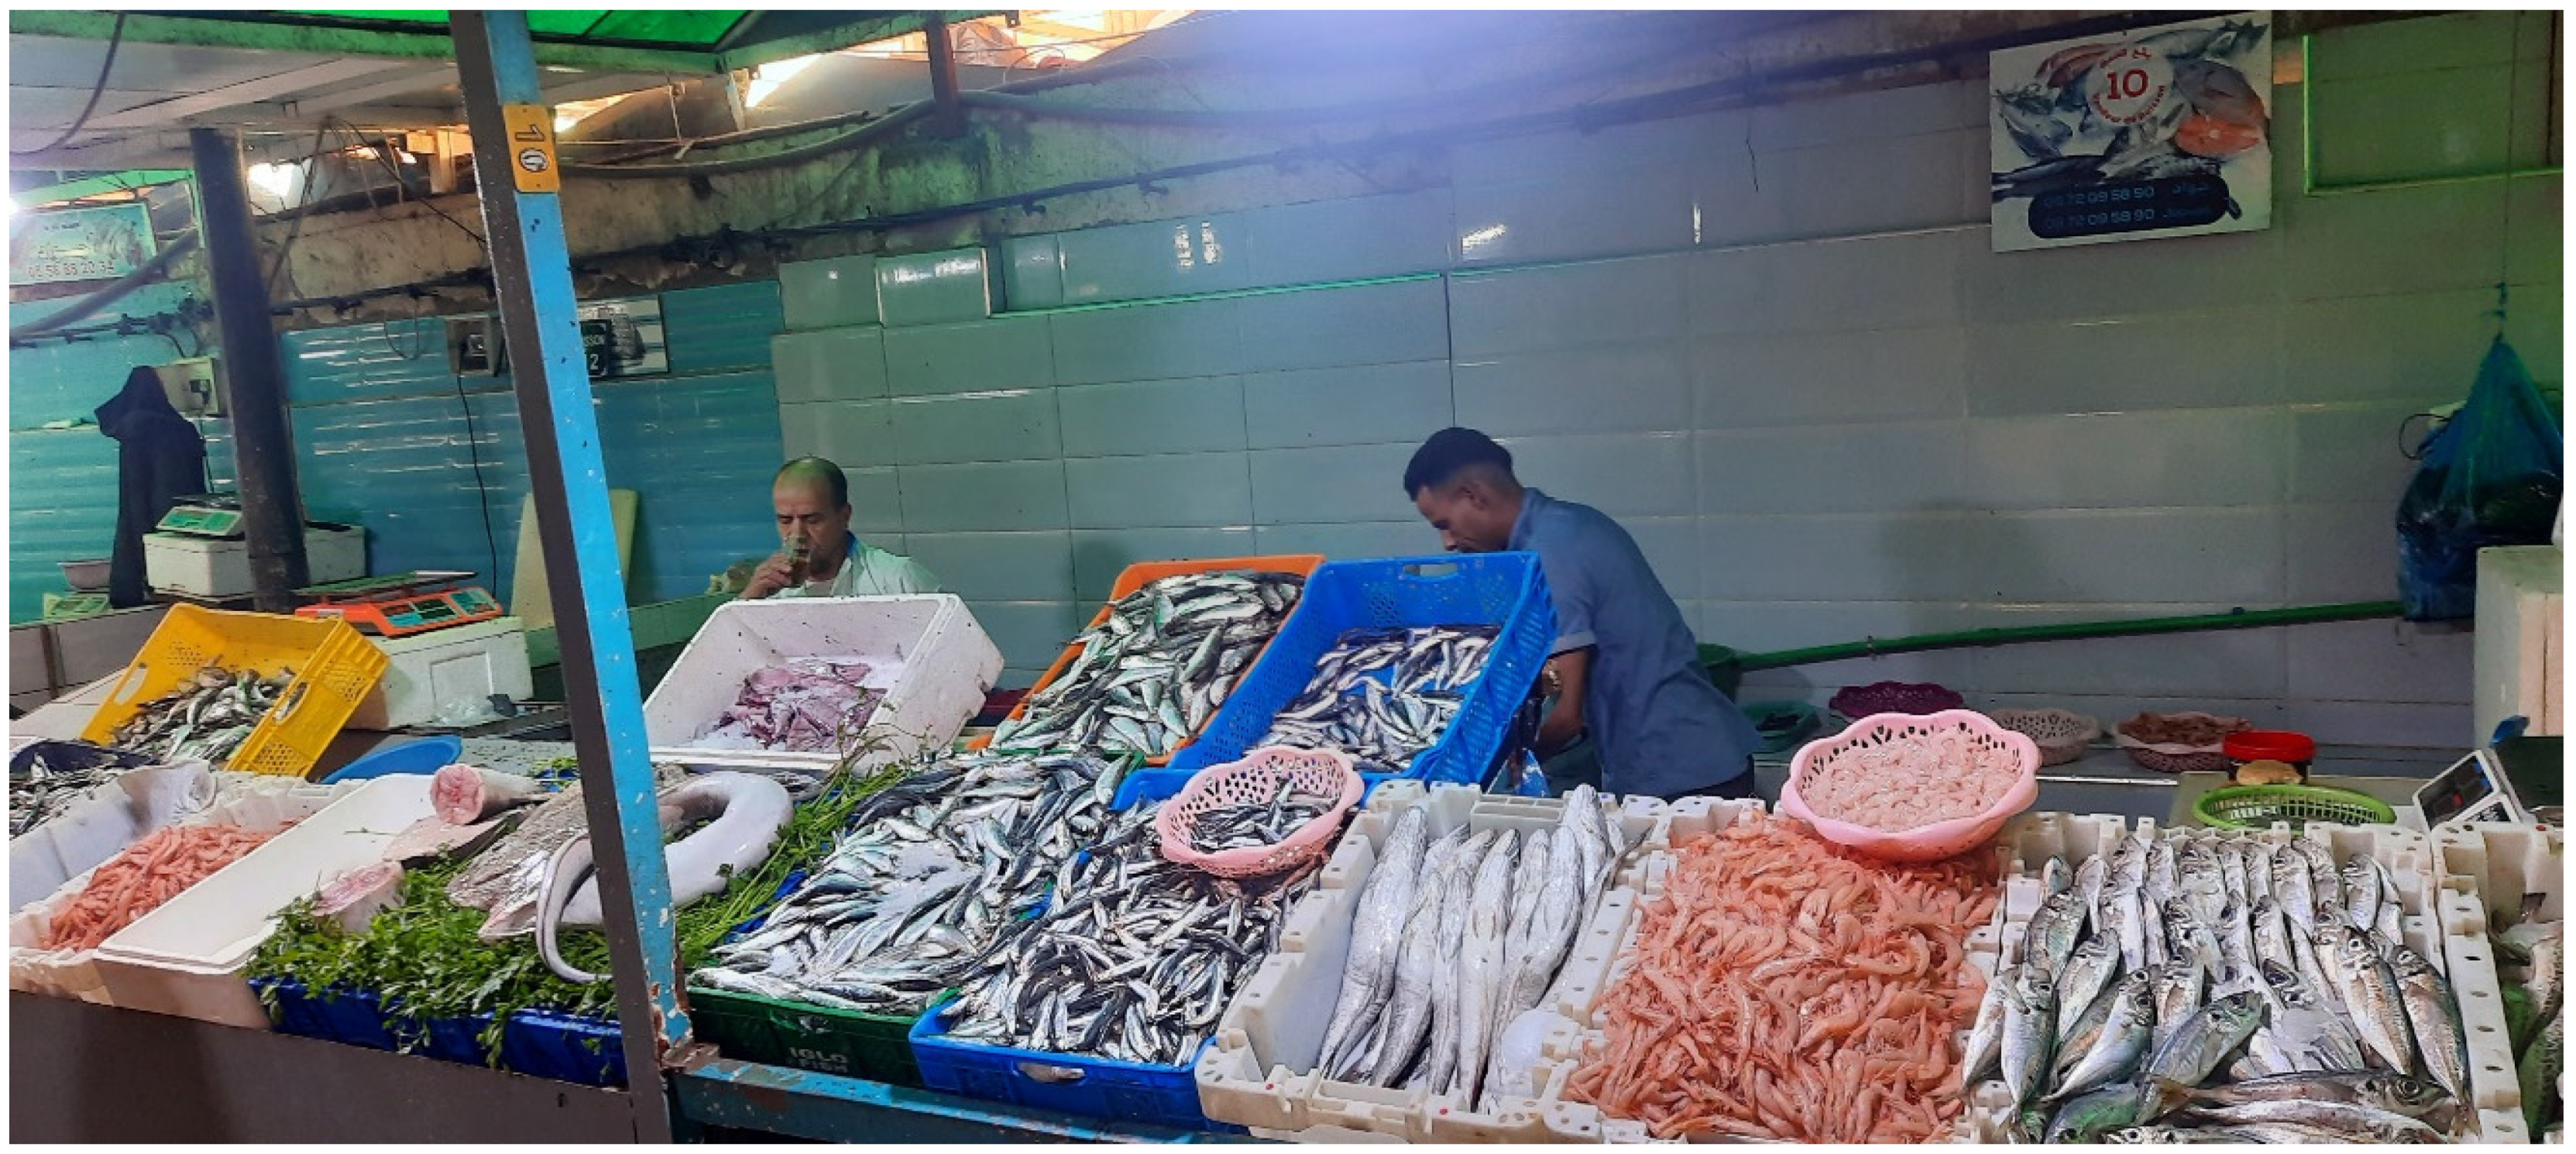
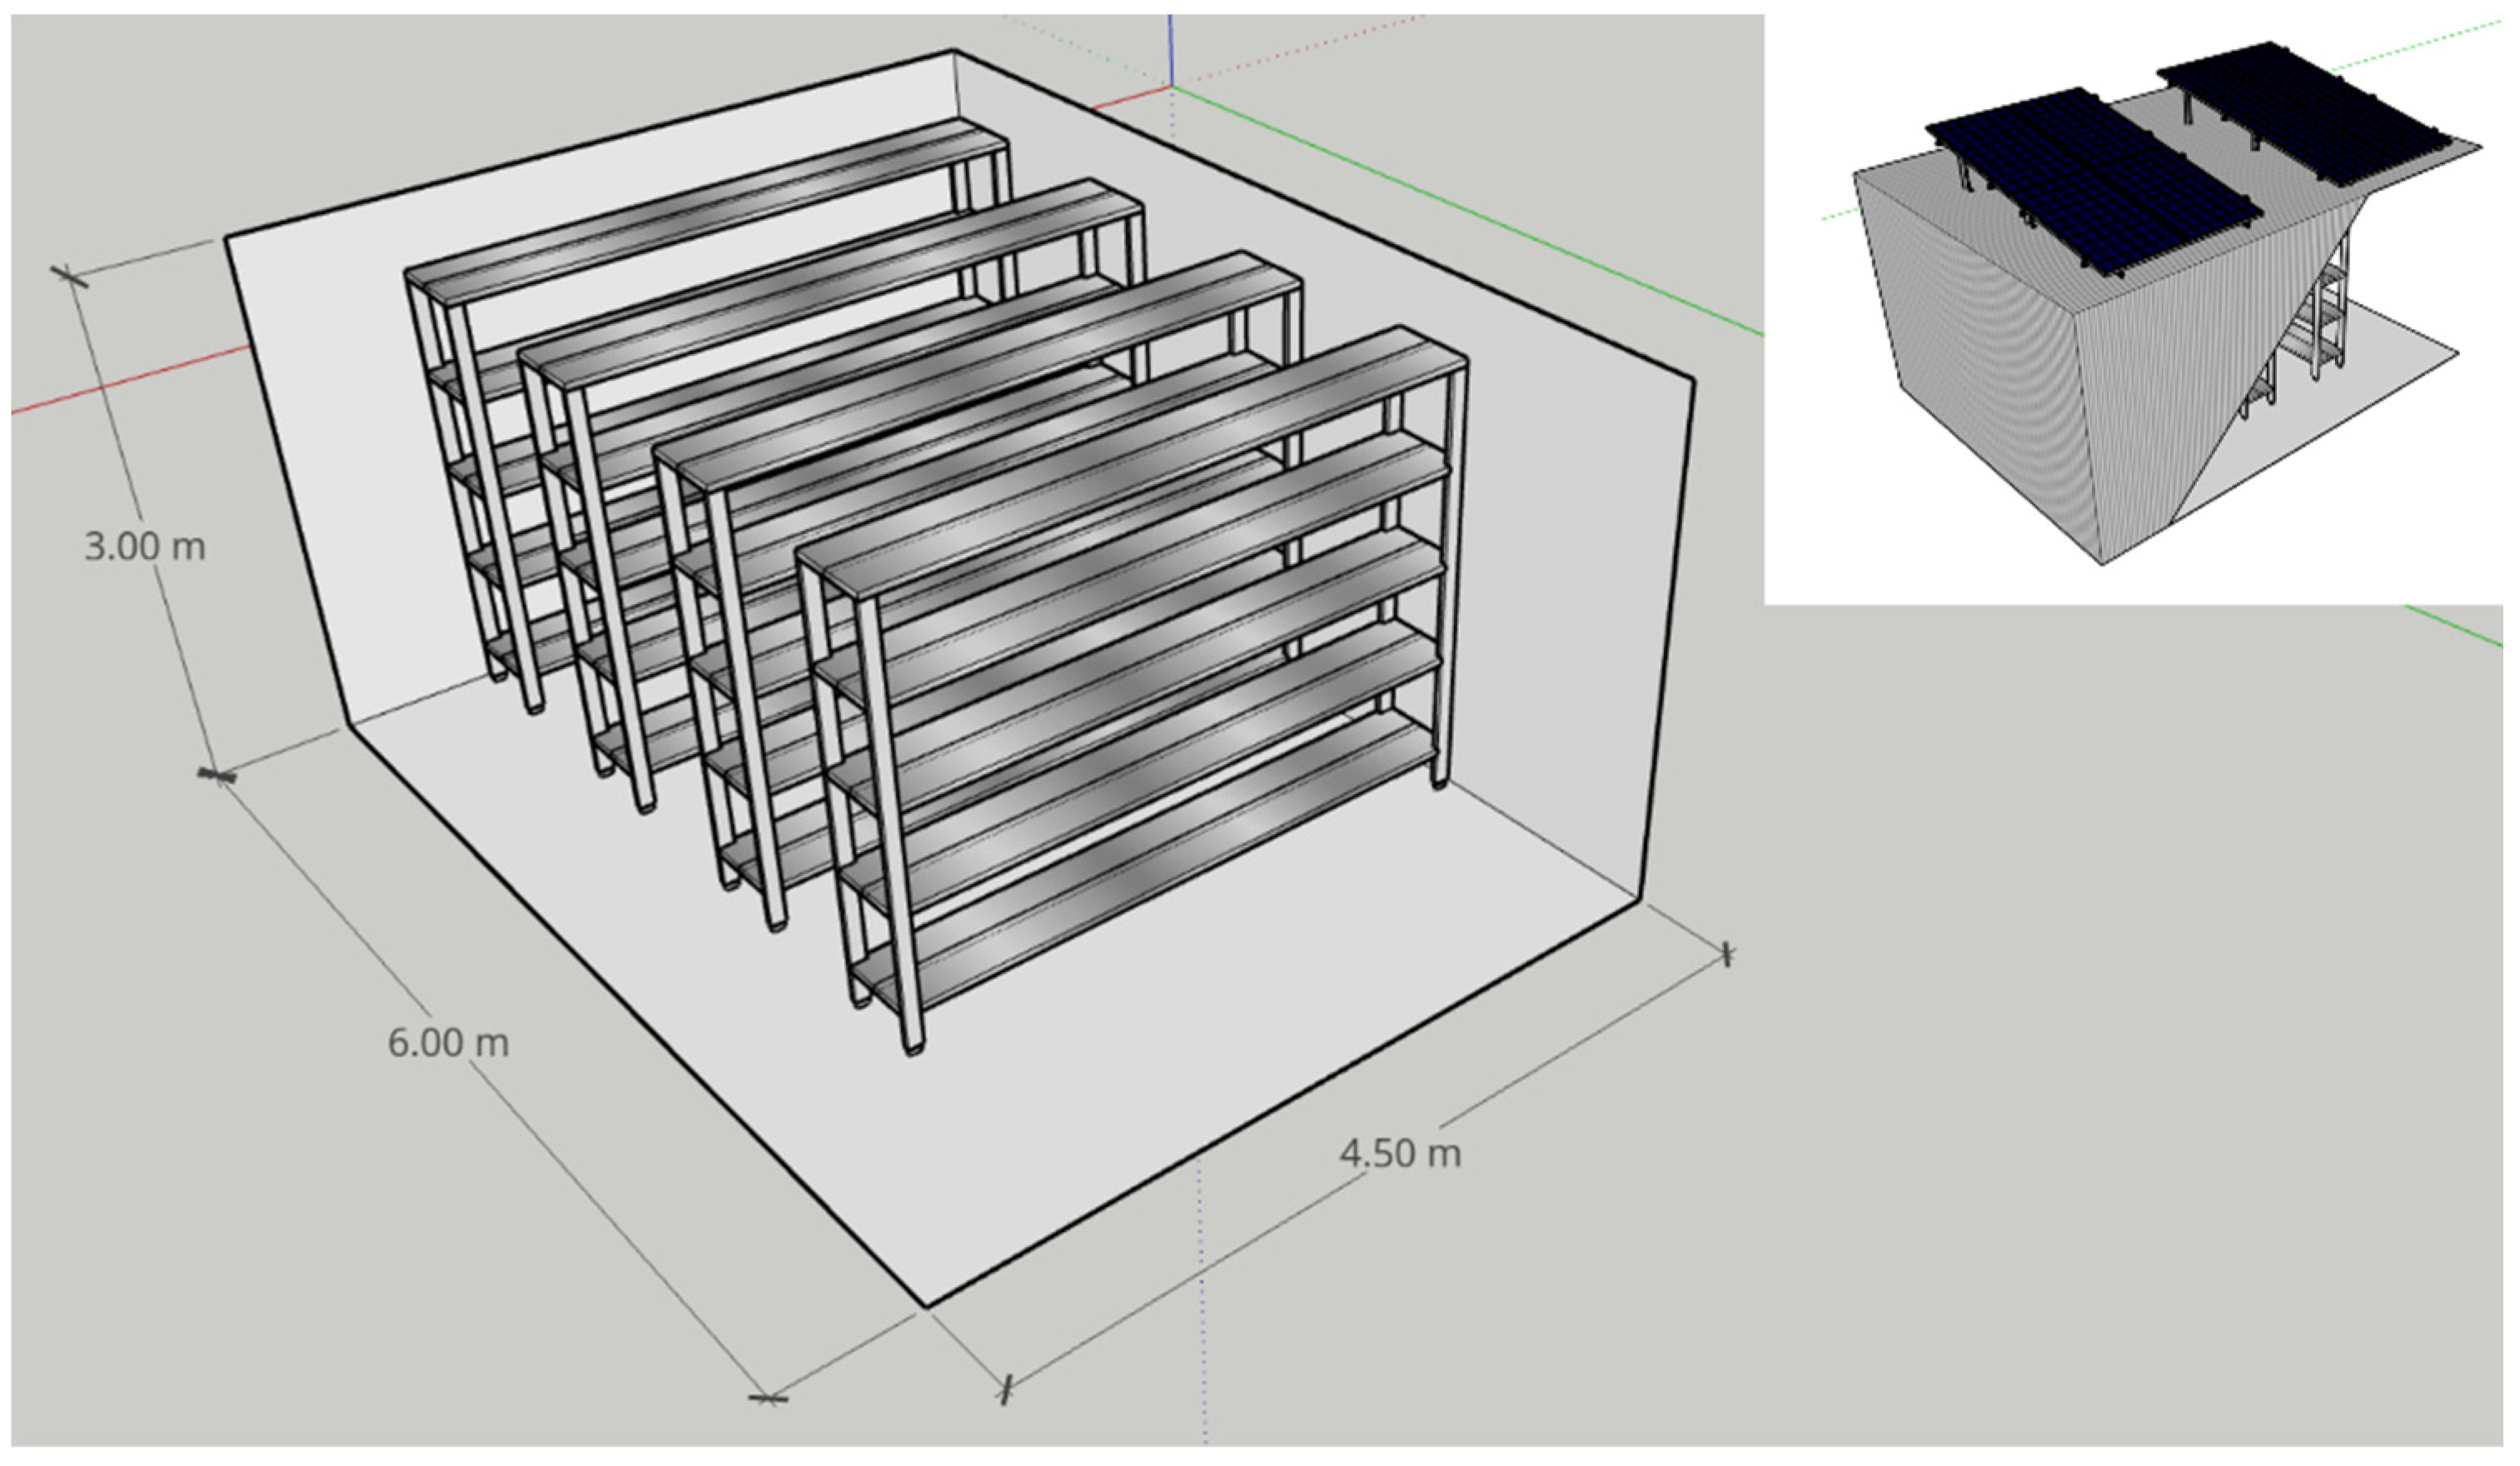
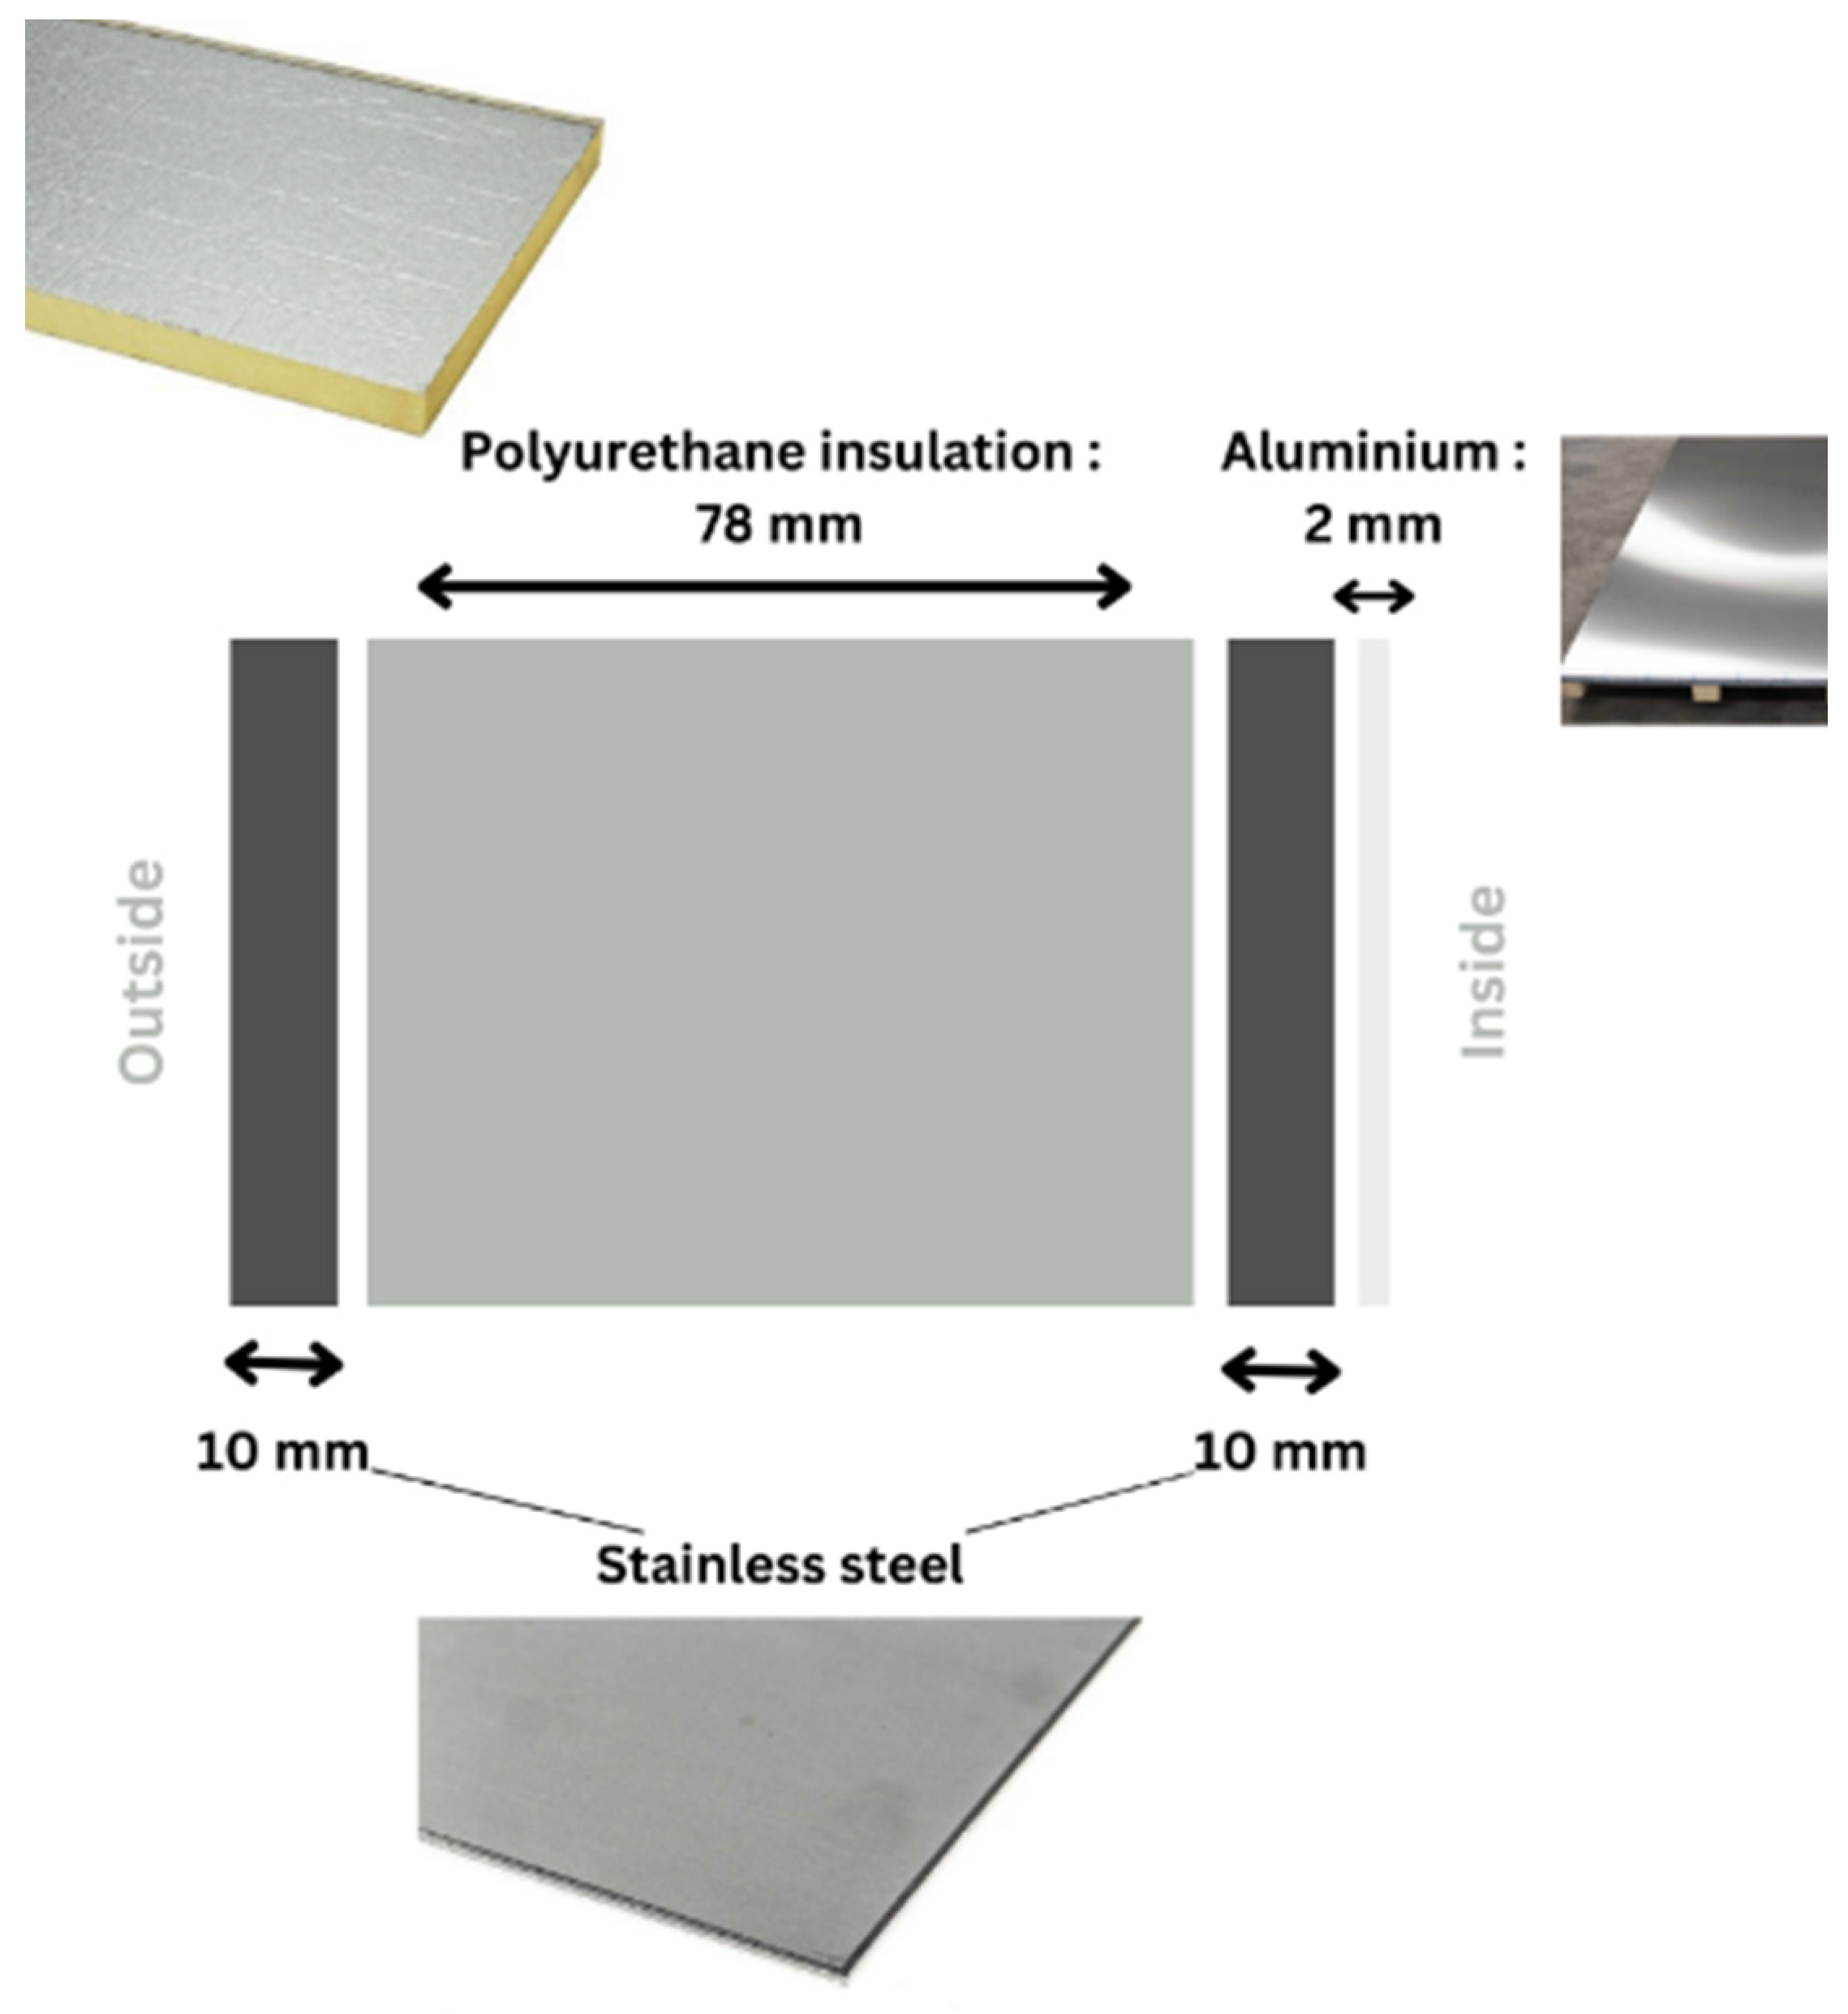
2.1. Fish Storage Unit
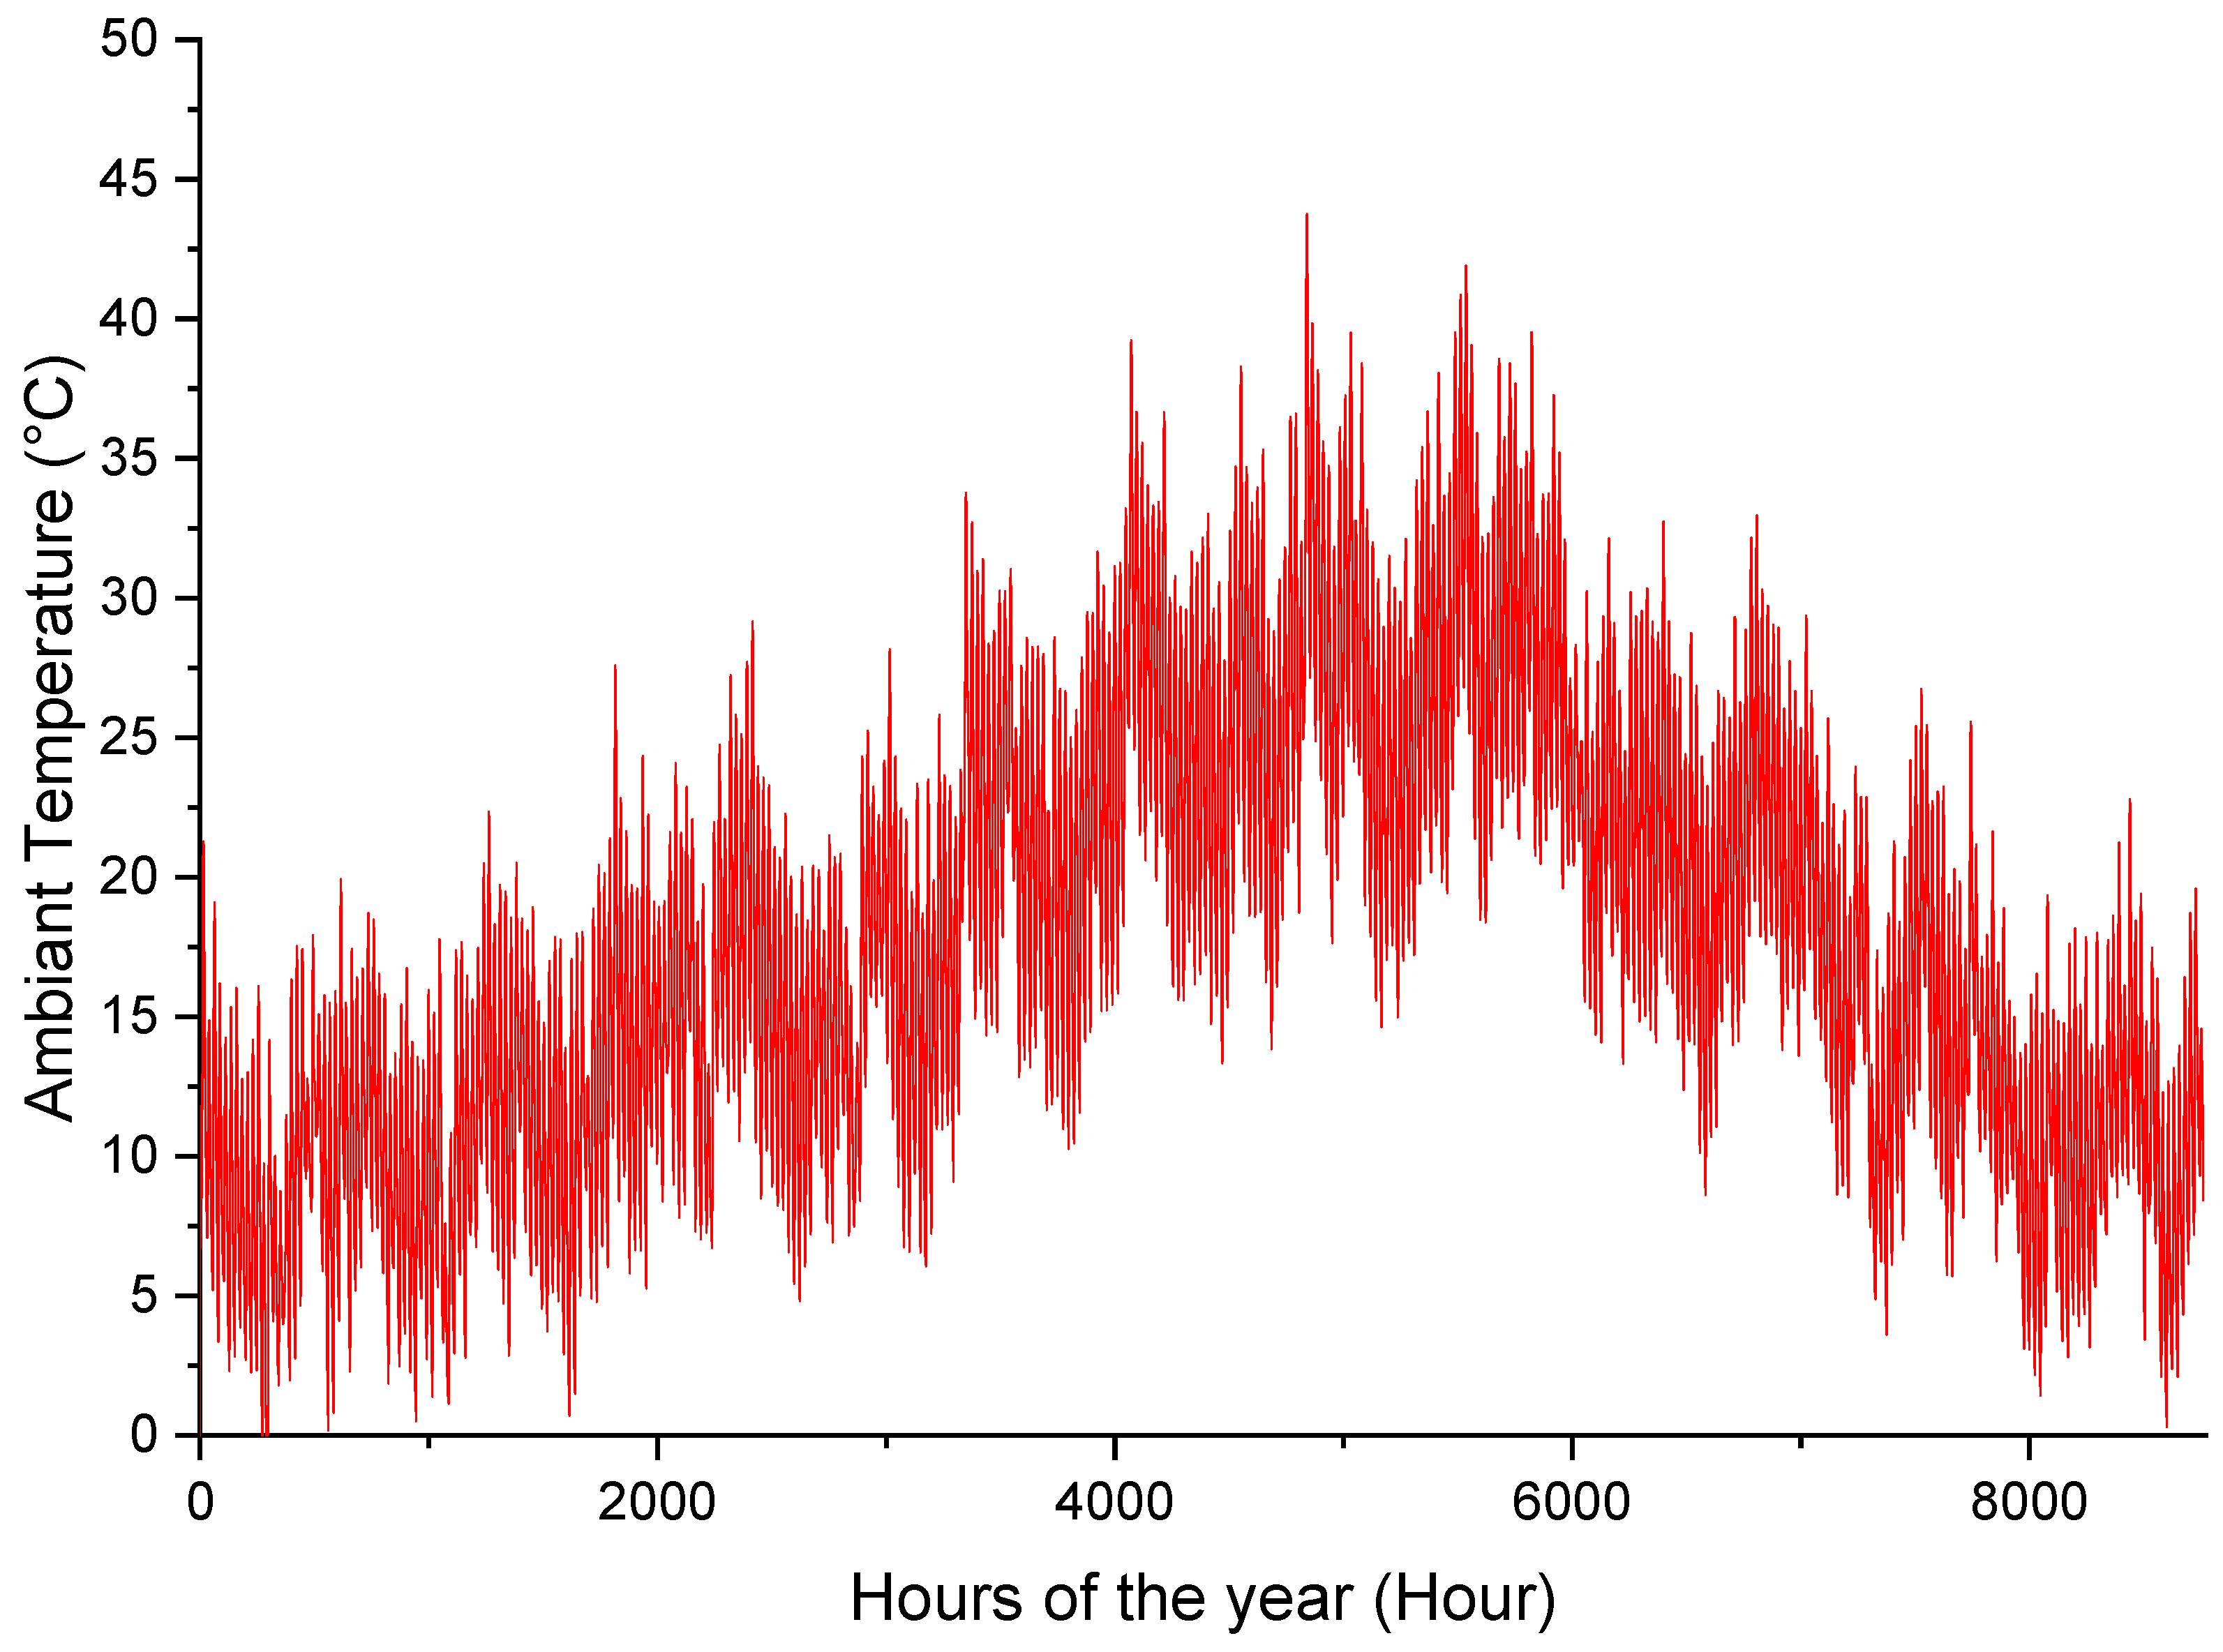
The objective of this research is to develop a simulation model for a cold room in the local market of Fez, Morocco (33.9° N/−5.0° E), specifically designed for fish storage in 10 selling stands as presented in Figure 1. The proposed refrigerated storage unit is a standard container with dimensions of 6 m × 4.5 m × 3 m. These dimensions were determined based on on-site surveys, which indicated that each of the local market’s fish merchants sell an average of 200 kg of fish daily. The storage capacity is organized into 4 rows, as depicted in Figure 2. A flowsheet displaying the different steps of this research can be seen in Figure 3.
The walls, roof, and floor of the cold room are constructed using stainless steel with polyurethane insulation, a commonly utilized material in food storage units [35,36,37], as illustrated in Figure 4. The walls consist of four layers, namely stainless steel, polyurethane, stainless steel and aluminum, with the properties shown in Table 1.

2.2. TRNSYS Model

To overcome the limitations posed by conventional computation techniques that rely on steady-state formulas, TRNSYS 16 [38] software was employed to generate a more accurate estimation through dynamic thermal modeling of the cold room. Figure 5 presents the flowsheet of the following simulation methodology in TRNSYS 16.
The simulation model utilizes the TYPE56a component to simulate the cold room’s temperature behavior. The weather file, generated by the software METEONORM 8 [39], provides hourly ambient data in the TMY2 file format for the city of Fez (for example ambient temperature, wind speed, solar irradiation and relative humidity). Regarding the building specifications, the structure walls, roof and ceiling construction materials are entered using materials from the TRNSYS 16 internal libraries following Table 1.
The schedule used as an input for the system aligns with the daily work program of the sellers. The fish sellers work six days a week, with Friday being the only non-working day. On a typical working day, the process of storing fish in the cold room occurs between 6 and 9 AM, lasting for one and a half hours. Subsequently, the market activity starts at 9 AM and finishes by 1 PM. Throughout the working day, the sellers periodically restock their supplies, with the restocking activity assumed to take one hour, divided into separate segments.
For the infiltration rate, the cold room is well insulated so there are only two ways that ambient air enters the cold room, either through a refrigeration unit or when the door opens. The door opening is a function of the schedule discussed before. The infiltration rate is 30% (Vol/h) of the total volume.
As for the cooling conditions, a technical guideline [40] recommends that fish must be stored at temperature and relative humidity conditions equal to 1.6 °C and 90%, respectively. These values are the set points used in the simulation setup.
TRNSYS 16 incorporates the impact of internal heat gains on the cooling demand load calculation in addition to the heat lost when inside air is exchanged with outside air. These internal gains arise from various sources such as lighting, people, and other personalized gains. In this study, two types of internal heat gains are considered: First, lights with a total surface of 2 m2, a 40% convective part, and a total heat gain of 5 W/m2. The lights are scheduled to operate when the sellers are in the cold room, as per the schedule proposed earlier. Second, additional heat gains are accounted for, resulting from the presence of occupants.

2.3. PV Array Sizing

The electricity load of the given system is ensured by a PV array as presented in Figure 6. The sizing of the PV array is conducted using the System Advisor Model (SAM) 2017.9.5 [41] software. Hourly outputs generated by SAM 2017.9.5 depend on the weather file, which was also used in the transient calculations carried out by TRNSYS 16 software.
The electric load of the system can be calculated using Equation (1):
P L o a d t = Q ˙ c o l d t C O P
where P L o a d (kW) is the electricity demanded by the system for a time segment, Q ˙ c o l d (kW) is the cooling load calculated by TRNSYS 16 for a time segment and COP is the refrigeration coefficient of performance.
These values, along with the PV module’s capacity, serve as input. The software uses these inputs to simulate the behavior of the PV array. The software algorithm takes into consideration the power generated by the PV and then compares it with the electric load. If there is an excess of energy generated, it is stored in the battery, and if electricity is needed, it can be then extracted either from the batteries or directly from the grid. It is important to emphasize that in this study, the refrigeration system used is a conventional vapor compression cycle that employs R134a refrigerant and has a coefficient of performance of 2.7.

2.4. Performances Indexes

While evaluating the performance of the energy system, it is crucial to consider both the profitability and environmental impact, along with the energy generation capability. For this reason, in this study, yearly metrics and life cycle assessment metrics are calculated. These metrics must entail the effect of inflation, initial capital cost, and yearly costs.
The energy generated by the PV array over a t f i n a l time period (a year for this study) in (kWh) is as follows:
E P V = 0 t f i n a l P P V ( t ) d t
where P P V t energy produced by the PV system for a given t time segment (kW).
The electricity load (kWh) is determined from the cooling load ( Q ˙ c o l d ) calculated by TRNSYS 16 software, and it can be integrated over a t f i n a l period:
E L o a d = 0 t f i n a l P L o a d ( t ) d t
where P L o a d t energy demanded by the cold room for a given t time period in (kW).
The PV electricity in (kWh) utilized by the cold room for a selected time segment t is as follows [42]:
P P V L o a d ( t ) = m i n P P V ( t ) ; P L o a d ( t )
The energy in (kWh) provided by the PV array to the cooling demand is
E P V L o a d = 0 t f i n a l P P V L o a d ( t ) d t
Finally, the electric power (kW) consumed from the electric grid for a selected time segment can be calculated following two conditions:
P G r i d L o a d ( t ) = P L o a d t P P V ( t )   i f   P L o a d t > P P V ( t )   0   i f   P L o a d t P P V ( t )

2.4.1. PV Self-Sufficiency Rate

The self-sufficiency rate is the proportion of electricity drawn directly from the PV array compared to the energy needed by the cold room. It can be calculated as follows [43]:
S S = E n e r g y   c o n s u m e d   f r o m   P V T o t a l   E n e r g y   d e m a n d e d   b y   t h e   l o a d = E P V l o a d E l o a d

2.4.2. PV Self-Consumption

The self-consumption is the ratio of electricity generated by the PV system that is consumed by the cold room compared to the total amount of PV energy produced. It can be calculated by following [44,45]:
S C = E n e r g y   c o n s u m e d   f r o m   P V T o t a l   E n e r g y   p r o d u c e d   b y   P V = E P V l o a d E P V

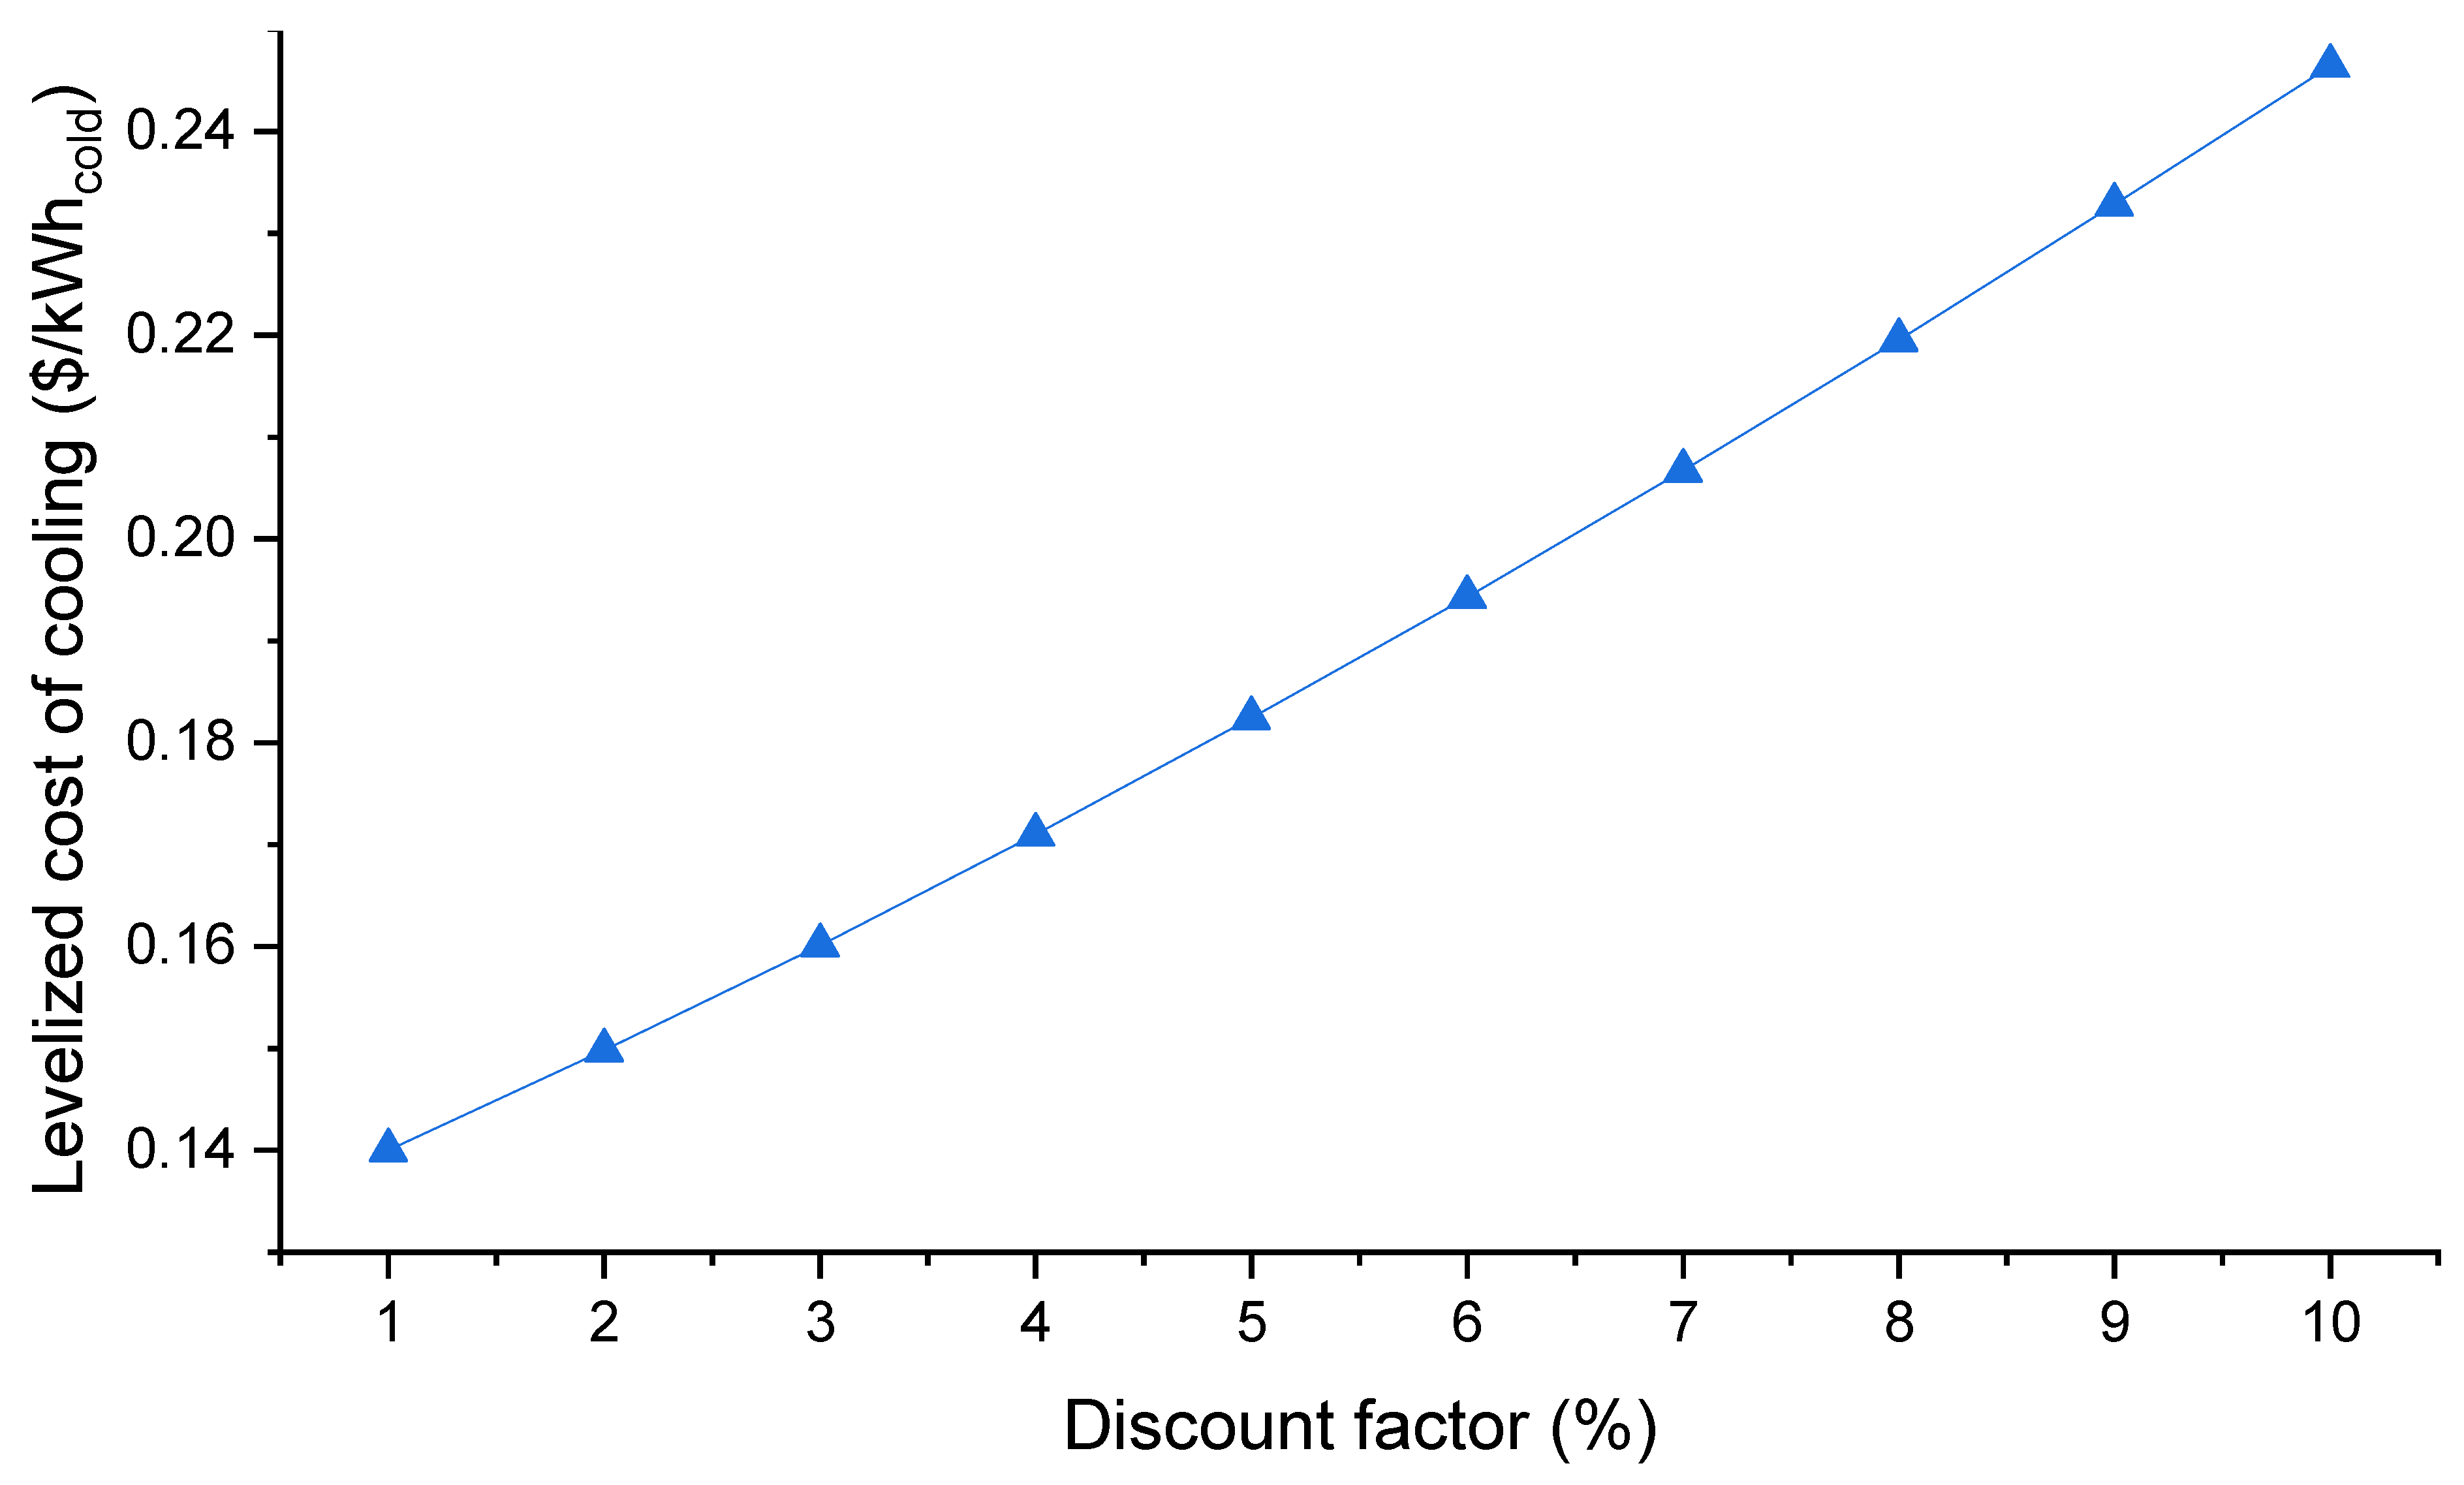
2.4.3. Levelized Cost of Cooling

Levelized Cost of Cooling (LCOC) is a commonly used indicator in the literature for assessing the project costs of various technologies over their anticipated operating lifetimes [46]. It takes into consideration the capital recovery costs, capital costs for construction, operating costs, interest on loans, maintenance, discount rate and inflation. LCOC represents the cost per kilowatt hour of cooling (kWhCold) demanded by the project. It is calculated following this formula [47]:
L C O C = I n v e s t m e n t + t = 1 n A n n u a l   c o s t s ( t ) ( 1 + r ) t t = 1 n Q ˙ A n n u a l ( 1 + r ) t  
where the investment is
I n v e s t m e n t = C P V + C R e f + C C o l d R o o m
The project capital cost will be based on three main parts of the system: Firstly, the cold room, which entails the lateral walls, the floor, the ceiling, the shelves and the door. Secondly, the refrigeration system, which consists of different cooling apparatuses. And thirdly, the PV array, which encompasses the PV modules, batteries, and inverters.
The annual costs are for a year n take into consideration the operational and maintenance costs, as well as the electricity cost for a given year [43]:
A n n u a l   c o s t s t = O t + M t + ( E l o a d E P V l o a d × 1 d t ) × c k w h g r i d
Equation (9) considers the capital cost of the project calculated using Equation (10) and annual indexes considered in this system are calculated using Equation (11).

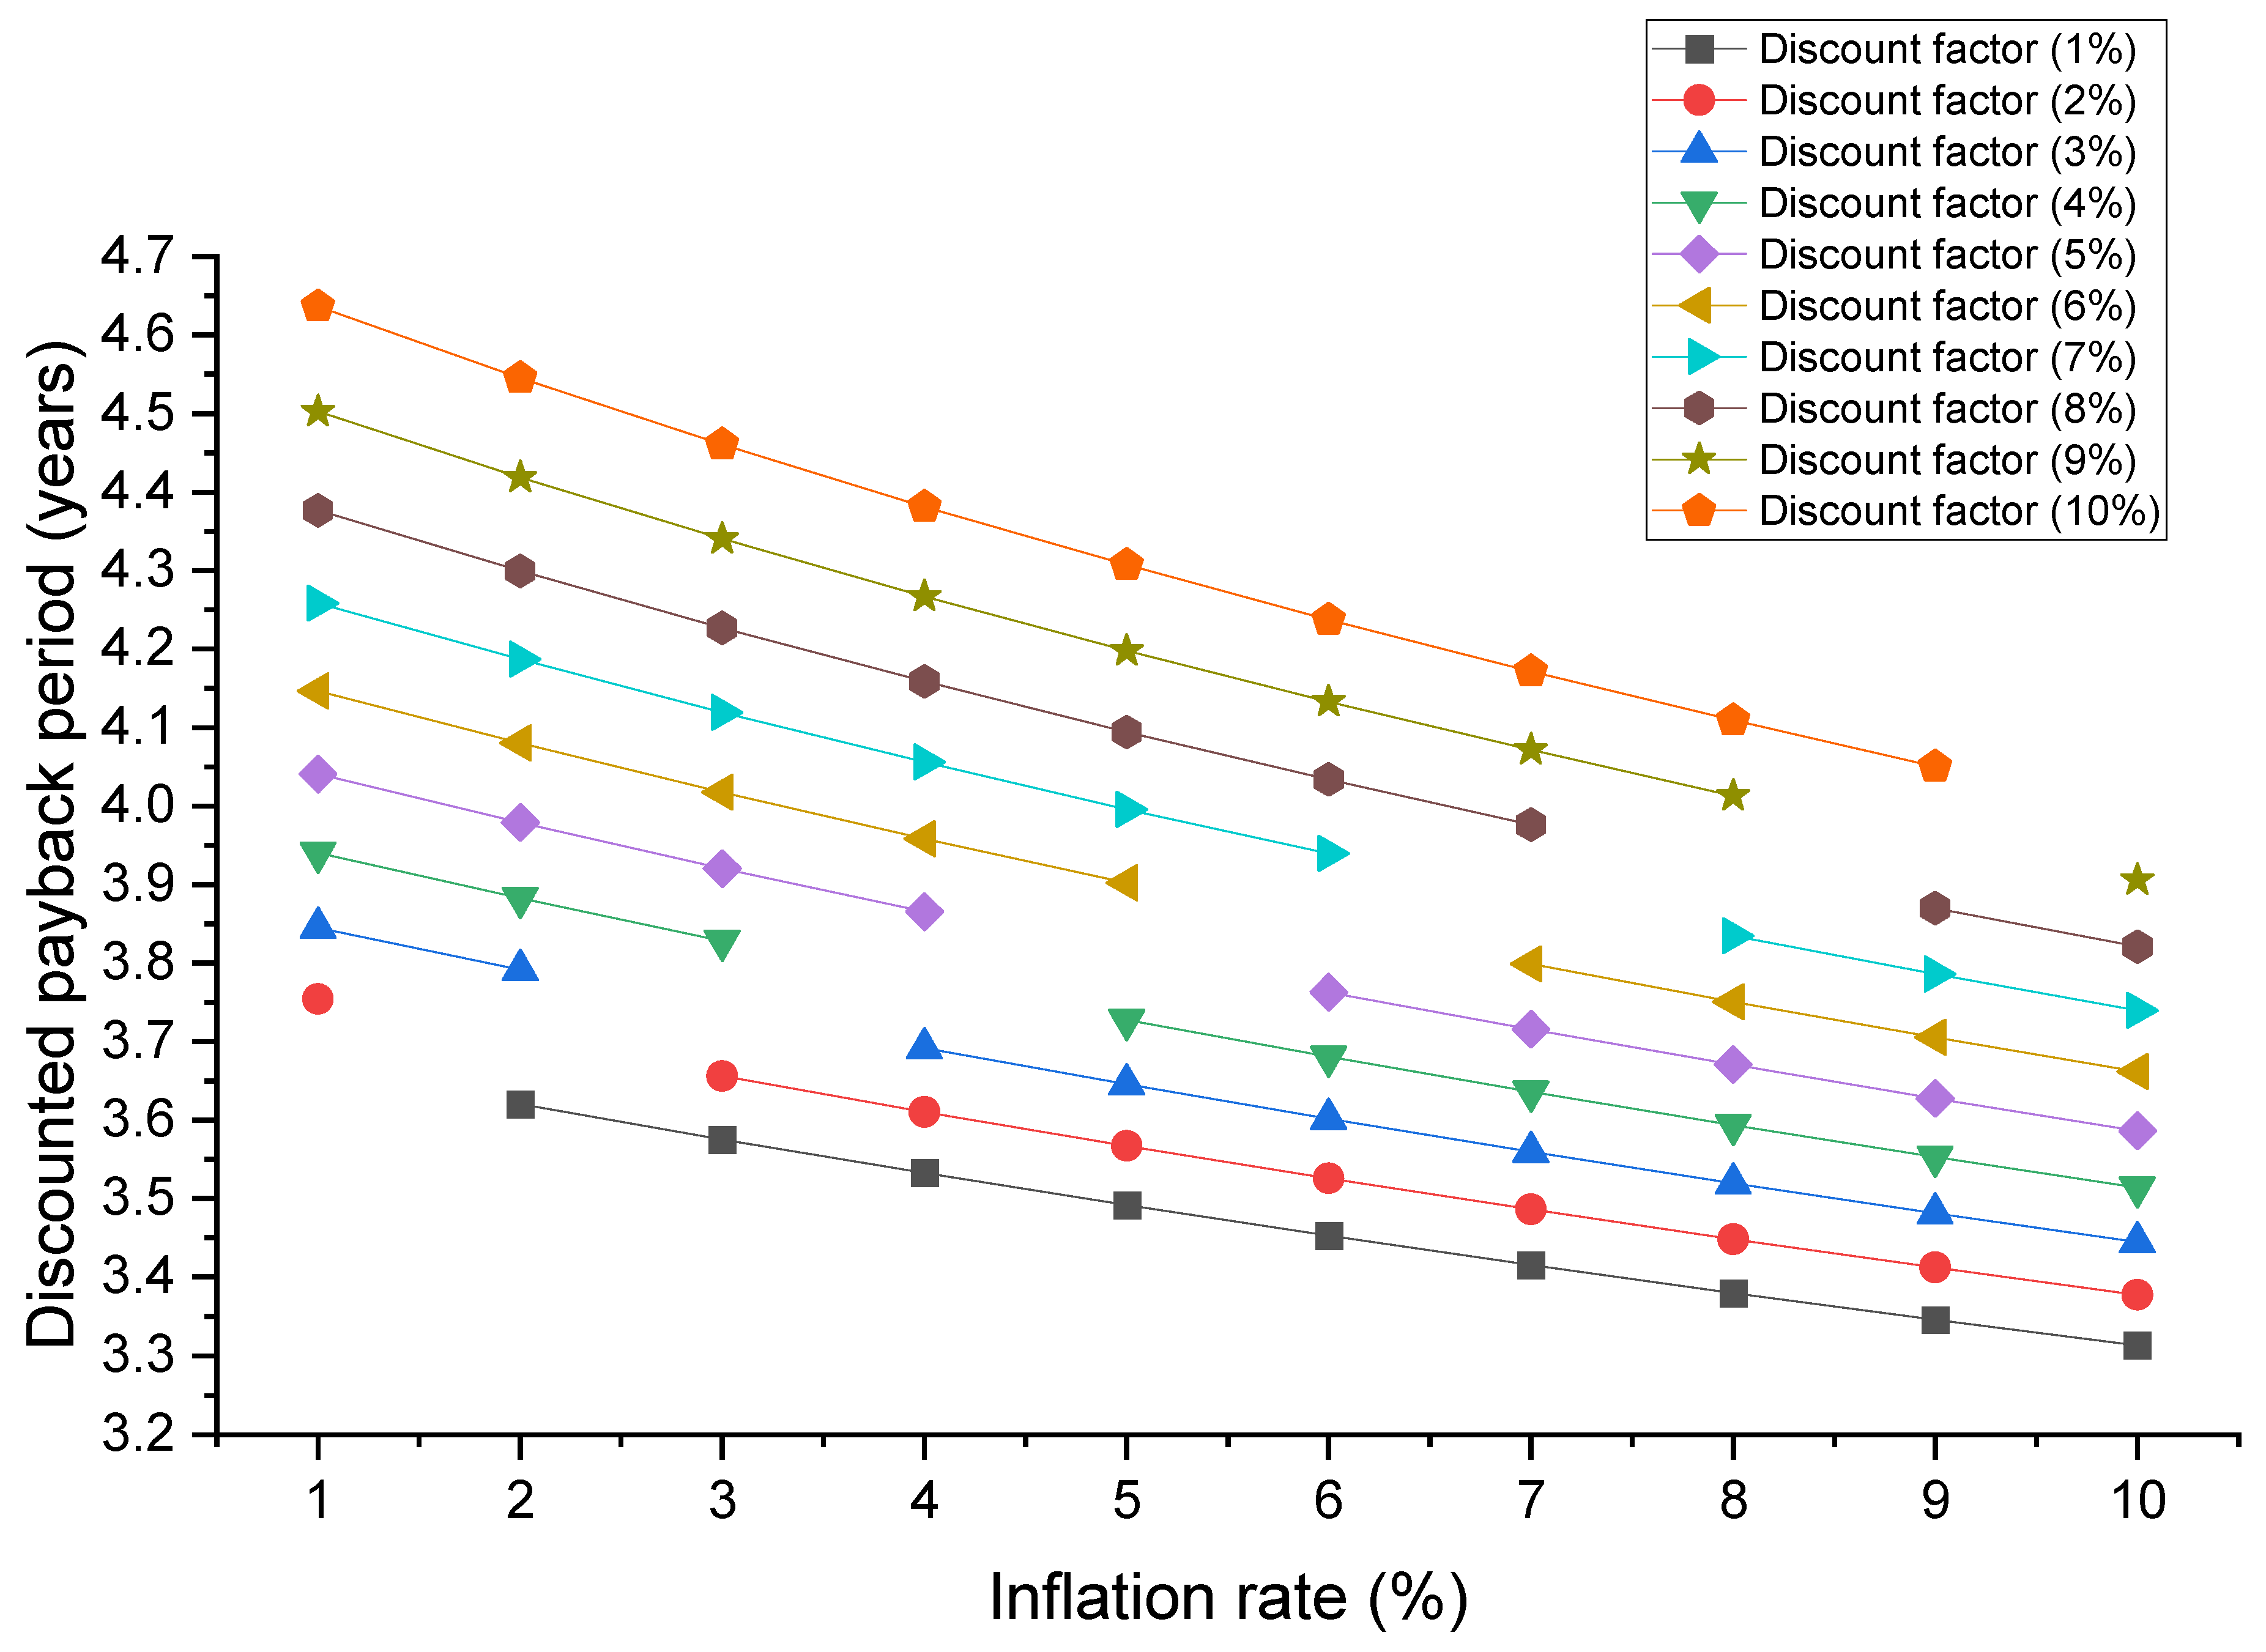
2.4.4. Discounted Payback Period

Payback time can be defined [48] as the duration needed for the cumulative savings to become equal to the total initial investment. It is a technique that measures the economic performance of an investment. Specifically, the discounted payback period presents the number of years required to pay back the initial capital while discounting future cash flows and the rate of inflation (iinf). The discount rate plays a crucial role in determining the present value of future cash flows from the project. It reflects the cost of capital, or the expected return on investment, and takes into account factors such as inflation, risk, and the time value of money. DPP (discounted payback period) can be calculated as [49] follows [49]:
D P P = l n I n v e s t m e n t A n n u a l   s a v i n g s × i i n f r + 1 l n 1 + i i n f 1 + r
The annual savings entail the cost of electricity consumed by the ice machine. Firstly, the thermal energy necessary for producing a specific mass of ice ( J / k g I c e ) is
Q ^ T h = C p w a t e r × T i T f r e e z + l + C p i c e × T f r e e z T f
where C p w a t e r is the water-specific heat capacity ( J / k g I c e · ° C ), C p i c e is the ice-specific heat capacity ( J / k g I c e · ° C ), l is the latent heat for water solidification (J/kg), T i is the initial ice temperature ( ° C ), T f r e e z is the freezing point temperature of water ( ° C ) and T f is the ice’s final temperature ( ° C ).
The electricity needed to produce a specific mass of ice ( k W h / k g I c e ) is calculated in
Q ^ E l I c e = Q ^ T h C O P I c e m a c h i n e
where C O P I c e m a c h i n e is the ice machine coefficient of performance.
The savings achieved from the project are the ice machine electricity cost avoided; hence, the annual savings are as follows:
A n n u a l   s a v i n g s = Q ^ E l I c e × m ˙ d a i l y i c e × c k w h g r i d × N S e l l e r s × N d a y s
where m ˙ d a i l y i c e is the daily ice consumption ( k g I c e / d a y s ), N S e l l e r s is the number of sellers, and N d a y s is the number of days the market is open in a year (days).

2.4.5. Total Equivalent Warming Potential

The TEWI is an index that is used to evaluate and quantify the environmental impact of greenhouse gases from refrigeration systems [50]. It takes into account the direct warming effect of refrigerant losses, the indirect effect due to the combustion of fossil fuels for electrical power generation, or the carbon footprint of PV power generation for this study case. The total equivalent warming potential when using the PV array ( T E W I P V ) and the reference system (ice machine) ( T E W I I c e m a c h i n e ) can be calculated using Equations (16) and (17), respectively.
T E W I P V = F L e a k × L × n + t = 1 n E l o a d E P V l o a d × 1 d t × F E l e c t r i c g r i d + E P V l o a d × 1 d t × F P V
T E W I I c e m a c h i n e = ( F L e a k × L + F E l e c t r i c g r i d × E I c e m a c h i n e ) × n
where FLeak, FElectric-grid, FPV, L, n and E I c e m a c h i n e stand for GWP values for refrigerant leakage (kgCO2/kg), GWP for electricity production (kgCO2/kWh), the carbon footprint of PV power generation (kgCO2/kWh), leakage rate (% per year), project duration (years) and ice machine electricity consumption (kWh), respectively.

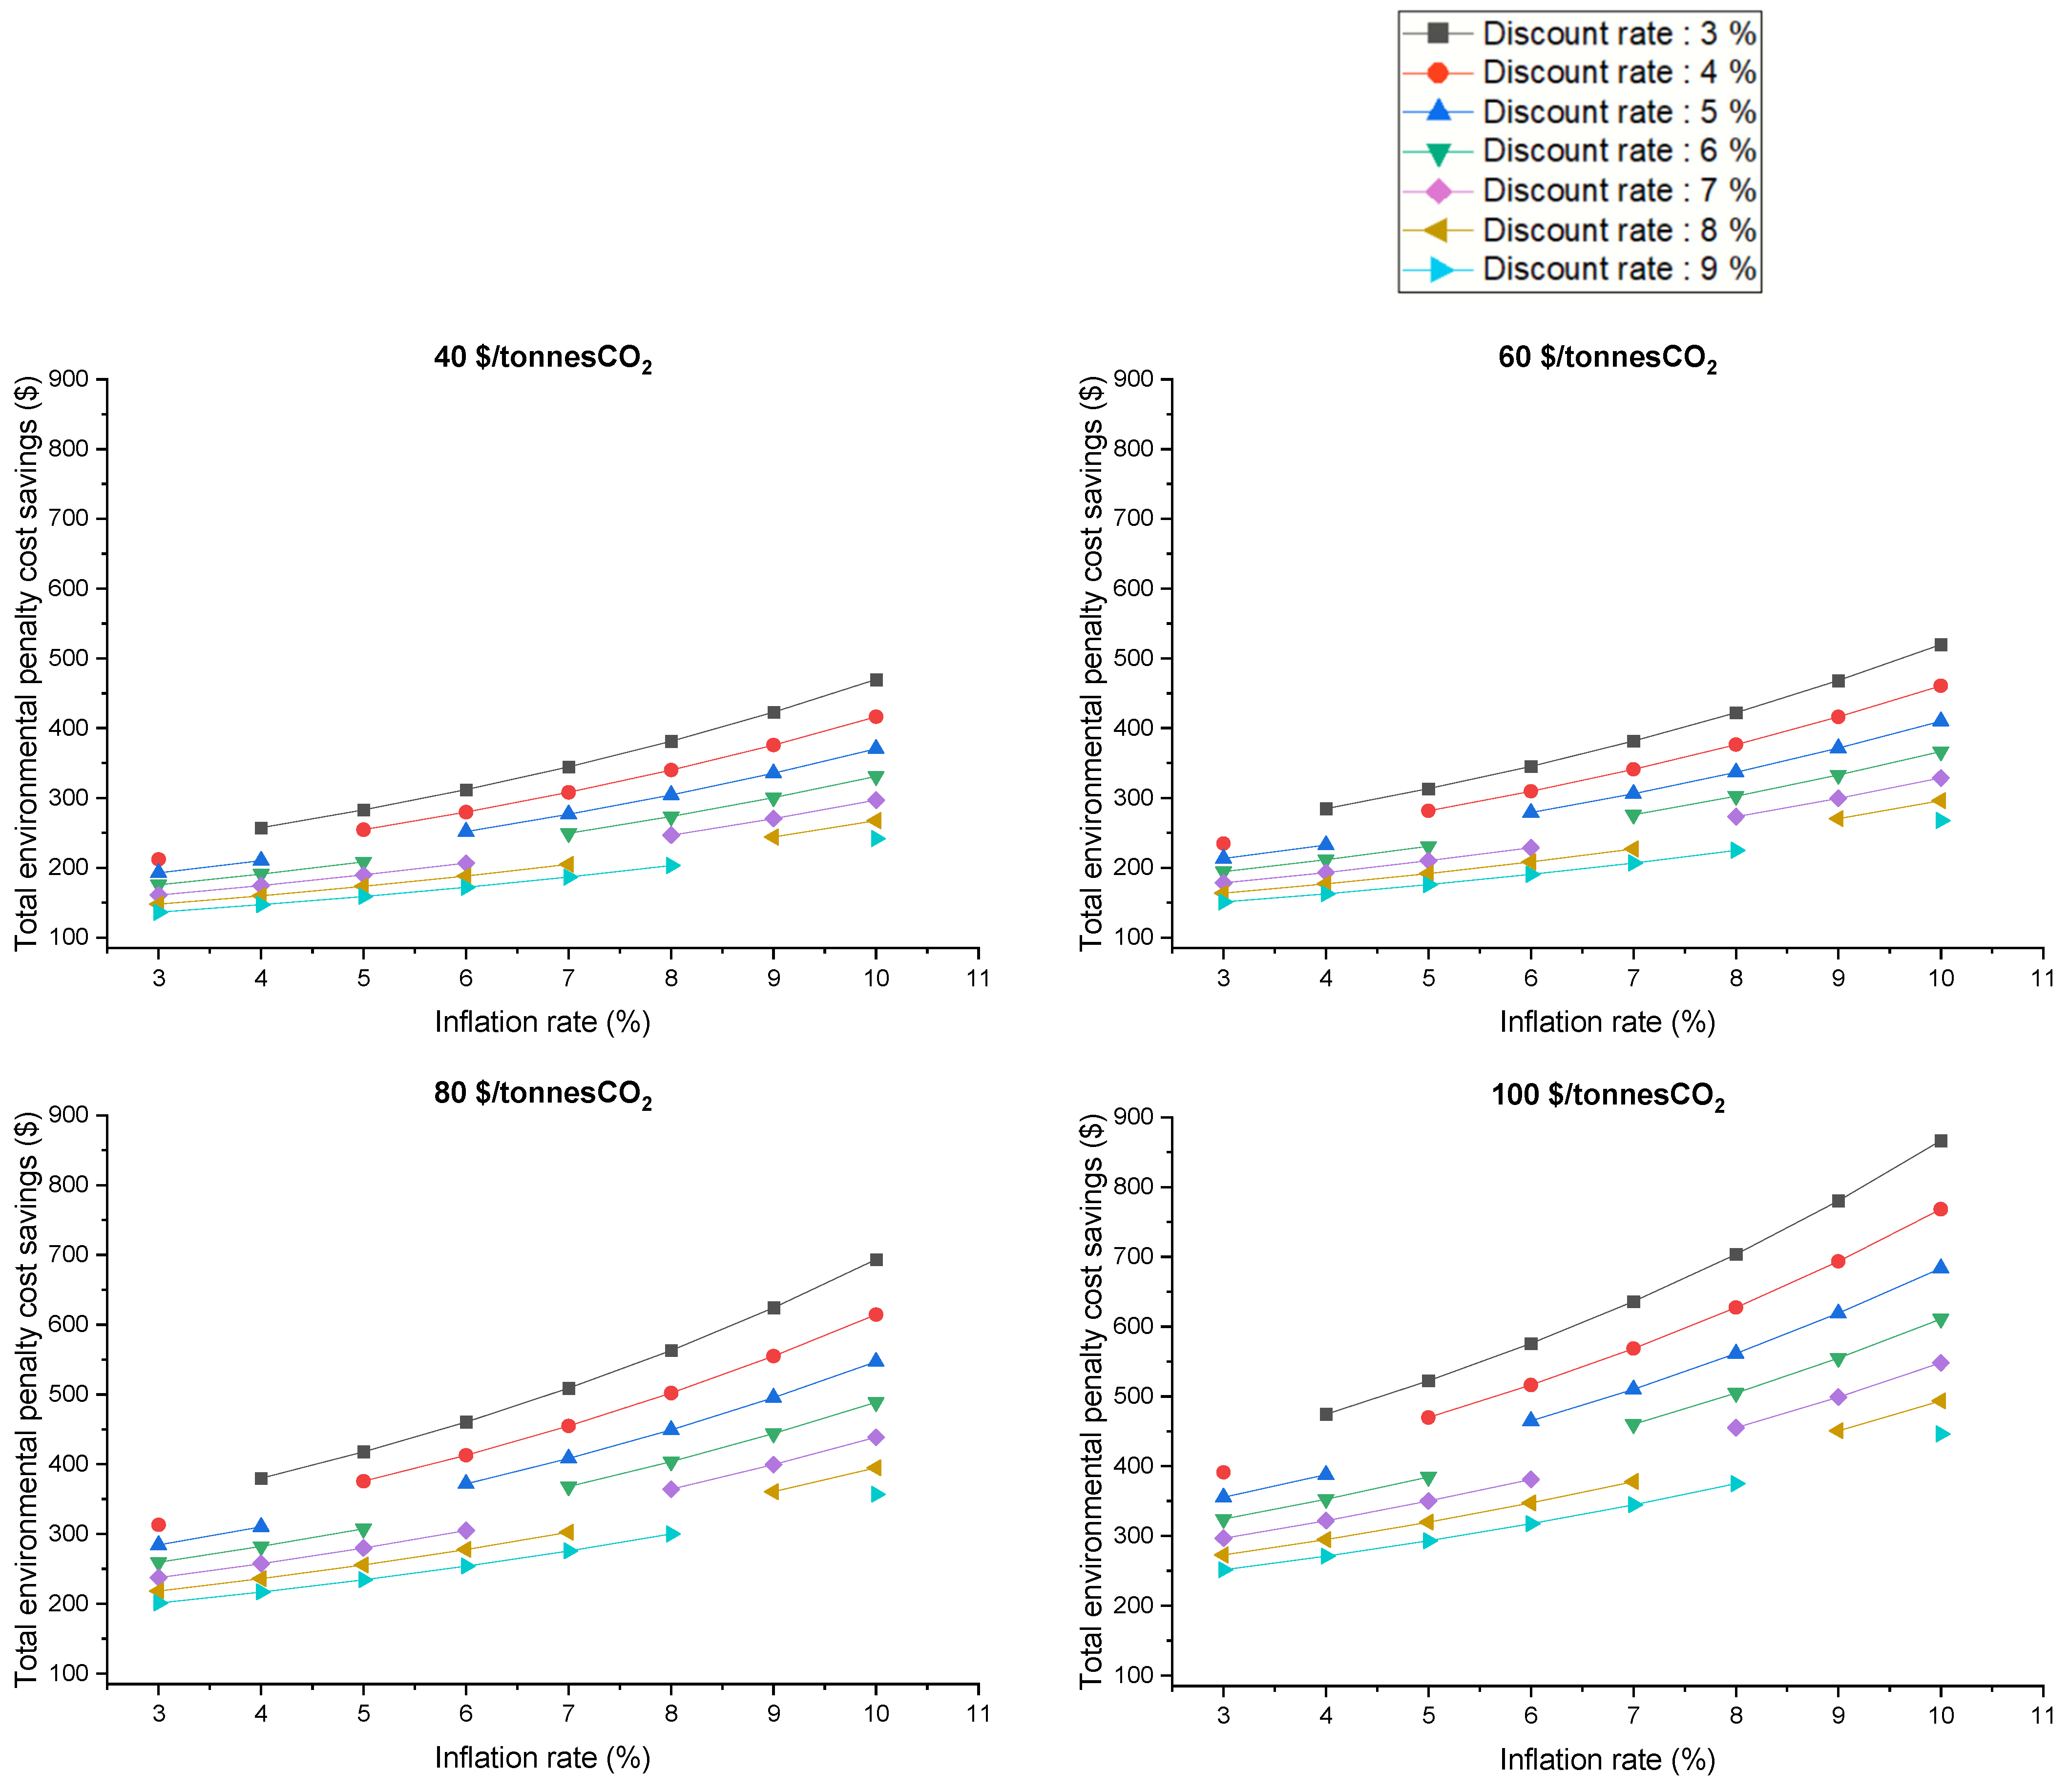
2.4.6. Total Environmental Penalty Cost Savings

Total environmental penalty cost saving (TEPCS) serves as a crucial metric within environmental accounting. It quantifies the cost savings resulting from renewable energy projects’ capacity to mitigate CO2 emissions. These savings are directly linked to carbon pricing initiatives, as renewable energy presents an effective avenue for reducing environmental costs through emission reduction. The following equation is used [49]:
T E P C S = F E l e c t r i c g r i d × E I c e m a c h i n e F E l e c t r i c g r i d × E g r i d l o a d + F P V × E P V × c C O 2 r i i n f 1 1 + i i n f 1 + r n
where c C O 2 is the penalty cost for carbon emissions ($/kgCO2).

2.5. Study Assumptions

Estimation of previously mentioned metrics is carried out by considering the set of assumptions summarized in Table 2.
The calculation of the cold room cost was determined by examining multiple commercially available cold rooms online [63,64,65,66,67] with an additional 10% for installation costs for a conservative approach. Based on this analysis, the projected cost of the cold room was approximated to be 102.06 $/m3.
The PV array parameters are represented in Table 3:

3. Results and Discussion

The next section is dedicated to presenting key sizing results, simulation outputs, and evaluation of the different system results in terms of energy, economy, and environment indexes. Also, it serves to provide sensitivity analyses of main parameters affecting overall performance such as the PV capacity, inflation rate, discount factor, initial investment and the penalty cost for CO2 emissions.

3.1. Cold Room Cooling Load

Using TRNSYS 16, Figure 7 displays the hourly cooling load of the cold room in Fez, Morocco. As expected, the outcomes demonstrate that the cooling load rises during the hotter months of the year, making it favorable for energy systems that rely on solar power generation because irradiation is more prevalent during the warm periods, as shown in Figure 8. Figure 9 represents the ambient temperature for all hours of the year. It can be observed that the heat load follows a similar pattern to the ambient temperature, indicating that the ambient temperature significantly influences the cooling load.
It must be pointed out that the cold room’s initial temperature state is set to the ambient temperature. Hence, the initial values depicted in Figure 7 for the cooling load are significant, as they indicate that the refrigeration system requires additional energy to lower the cold room temperature to the desired level.
The maximum hourly cooling load in a year is 2053.61 W. This value corresponds to the cooling load target to be met by the solar-driven cold unit. By numerically integrating these loads, the cumulative cooling load is determined to be 8230.17 kWh/year.

3.2. Model Verification

To prove the validity of the simulation process, COOLPACK 1.5 software was used to verify the results. Five simulations were conducted with various cold room set temperatures (1.0 °C, 1.5 °C, 2.0 °C, 2.5 °C and 3.0 °C) during the hottest day with a maximum ambient temperature of 43.7 °C. COOLPACK 1.5 [68] is a commercial software that comprises a set of tools associated with refrigeration that can be employed to size different refrigeration systems. These programs were created employing the Engineering Equation Solver (EES).
Table 4 illustrates the peak cooling load (W) obtained from both TRNSYS 16 and COOLPACK 1.5 simulations at varying cold room set temperatures (°C). To verify the accuracy of the results, the same ambient temperature of 43.7 °C was set throughout the entire year in the TRNSYS 16 software, just like in COOLPACK 1.5. The errors ranged from 5.19% to 6.06%, which confirms the accuracy of our model. It should be noted that this set ambient temperature is only used for the validation and the other calculations were based on a transient annual simulation.

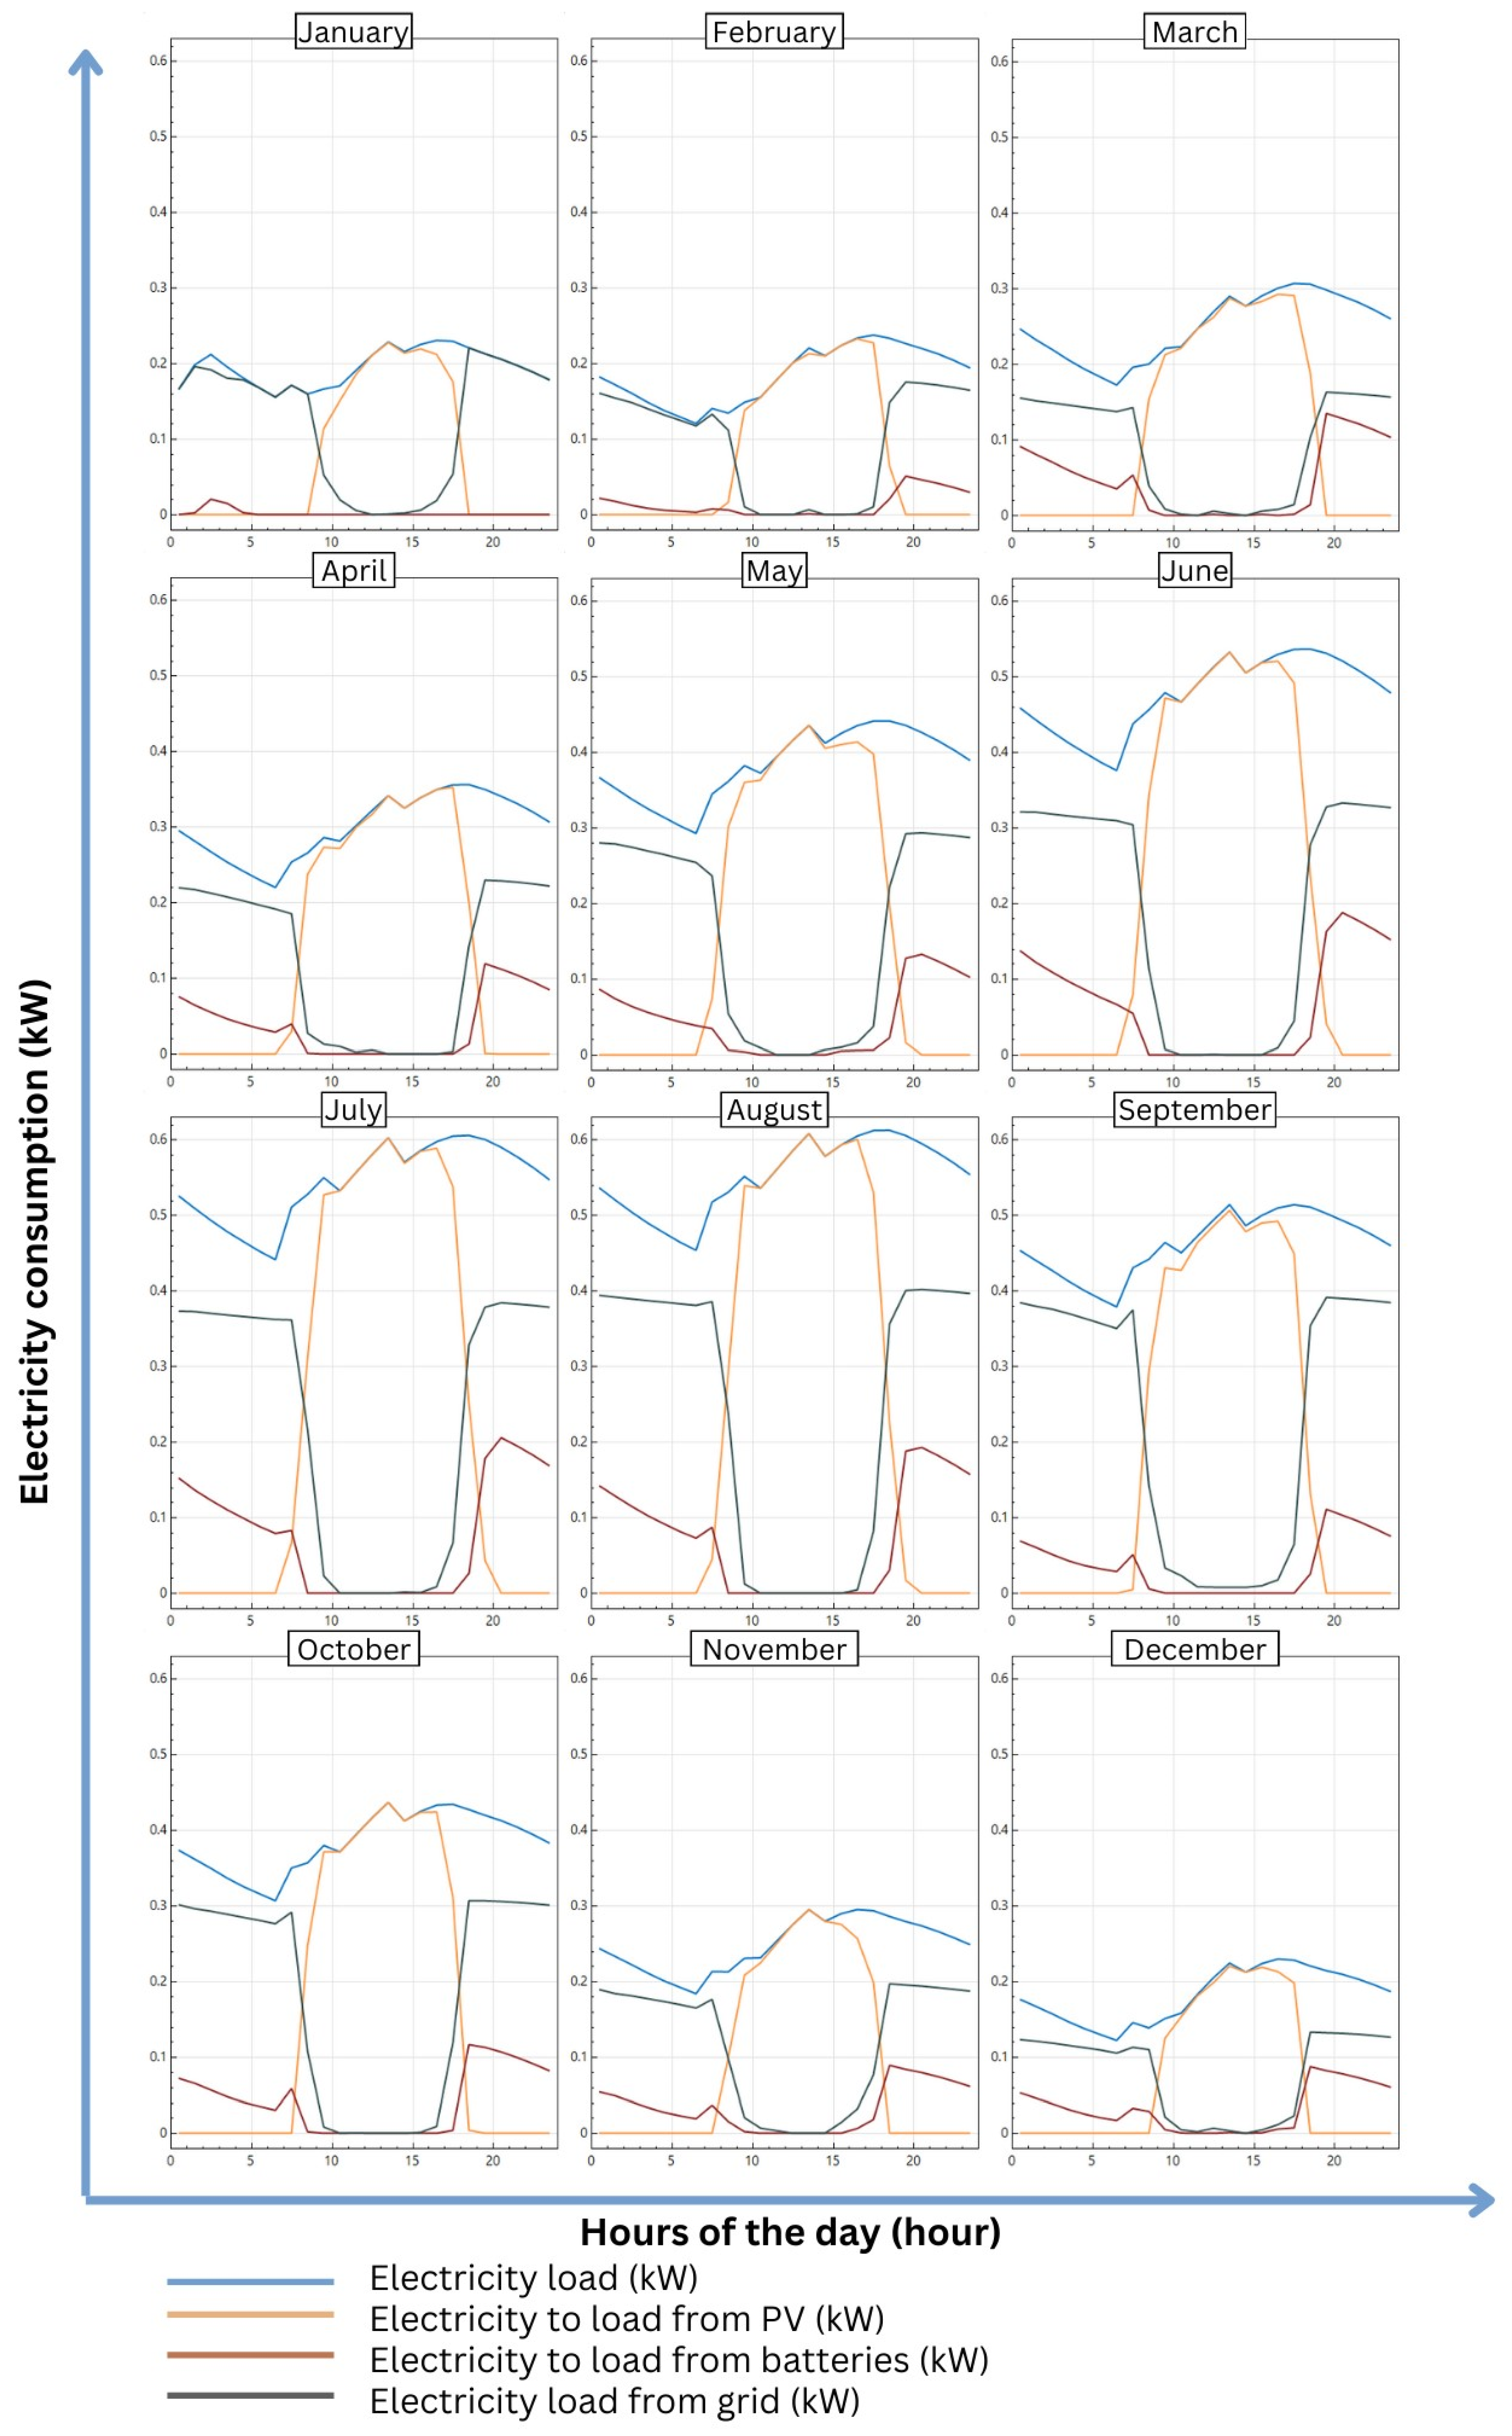
3.3. Energy Output of the PV Panels

The selection of an appropriate PV array capacity is a crucial aspect of this study, as it depends on several factors such as the electricity demand of the system and weather conditions. Therefore, PV capacities ranging from 0.9 kWp to 2.7 kWp are simulated. Choosing the adequate capacity is based on self-sufficiency and self-consumption metrics.
Figure 10 presents the variation of self-sufficiency and self-consumption as a function of different PV capacities. Self-consumption starts at 100% because all the energy produced by the PV array is consumed. However, it starts to decrease gradually because not all the energy generated is consumed by the electric load because of the incompatibility between the load and PV generation profiles. With regard to self-sufficiency, the reverse tendency is observed. The intersection between the two curves is an ideal configuration that can be recommended as the final design. The intersection point has self-sufficiency and self-consumption equal to 85.6% and 86.19%, respectively. This configuration entails 3 strings of 4 modules with a total capacity of 1.8 kWp. Figure 11 displays the average daily profile of PV energy production for each month of the year using the results obtained from the SAM 2017.9.5 software. It can be seen that for a selected month, for example, June, during the early morning hours, a part of the electricity demand is generated by the PV array. However, because there are low irradiation values, the remaining electricity is provided by either the electric grid or the batteries. As the day progresses, the system directly consumes the electricity generated by the PV array, while any excess energy is stored in the batteries for later use. As the nighttime period approaches and sun irradiation decreases, the remaining electricity demand is provided by the batteries charged before, or by the electric grid when there is insufficient energy stored.

3.4. Project Profitability

Figure 12 displays the LCOC as a function of different parameters, including PV capacity and discount rate. When varying the discount rate, the LCOC values range from 0.14 $/kWhCold to 0.2464 $/kWhCold. It can be observed that LCOC increases with PV capacity. When reviewing the literature [69,70], both proved that the discount rate highly impacts the LCOE in a similar way to the results of the study presented. Nevertheless, an interesting finding was that LCOC remained relatively lower than what is reported in the literature [71,72,73]. For the chosen PV capacity (1.8 kWp), the LCOC is 0.131 $/kWhCold.
One more crucial factor to consider when assessing the profitability of a given system is the discounted payback period (DPP). Figure 13 further evidences the impact of inflation and discount rate on the DPP for a PV capacity of 1.8 kWp. This configuration results in a discounted payback period equal to 3.511 years. It is seen that inflation rate increases cause a reduction in DPP, meaning there is more competitiveness of the proposed design compared to a conventional ice machine that relies on electricity for the grid.

3.5. Environmental Metrics

In order to accurately assess the environmental impact of the proposed solution, both the total equivalent warming potential (TEWI) and the total environmental penalty cost savings (TEPCS) are calculated. Using the solar-driven cold proves to avoid a total of 437.56 tons of CO2 emissions, as shown in Table 5. To understand the environmental benefits of this system, the TEPCS metric is used to present its economic benefits. Figure 14 represents the total environmental penalty cost savings as a function of different parameters such as the inflation rate, discount rate, and different values for a penalty for CO2 emissions for the PV capacity of 1.8 kWp. When considering the penalty of 40 $/tons CO2, the savings are at least $100.59, and the savings could reach $346.66, $520, $693.33 and $866.66 for the 40, 60, 80 and 100 $/tons CO2 penalty costs, respectively. For the chosen capacity, the TEPCS is equal to $287.36 and $718.41 for the 40 $/tons CO2 and 100 $/tons CO2 penalties, respectively. These savings are relatively low compared to the literature [49,74], the reason is that the electricity load is very small. If the local market is subjected to extension, the electric load of the cooling system will be more significant, implying a larger PV plant.

4. Conclusions

Refrigeration is a critical process in the food industry and improving its efficiency can have significant economic and environmental benefits. This study focuses on the conception and assessment of an economically and ecologically optimized solar-powered cold storage facility, dedicated to the preservation of fish within a traditional marketplace in Fez, Morocco. The cold room’s energy requirements are provided via a PV array, battery storage, and electrical grid. This PV-driven approach not only promotes the adoption of clean, renewable energy in traditional markets but also ensures sustainability. Utilizing advanced simulation tools like TRNSYS 16 to model thermal behavior and SAM 2017.9.5 to analyze PV energy generation, this research offers a clear vision of the future of sustainable refrigeration solutions. Through rigorous yearly and life cycle metrics, this study substantiates the system’s prowess. The key findings are as follows:
  • The cold room’s peak hourly cooling load is 2053.61 W, with a yearly cumulative cooling demand of 8230.17 kWh/year.
  • The designed solar PV array consisted of 3 strings of 4 modules and had a nameplate capacity of 1.8 kWp. Results from hourly simulations indicated that the proposed PV system has self-sufficiency and self-consumption equal to 85.6% and 86.19%, respectively.
  • The Levelized Cost of Cooling and the discounted payback period are equal to 0.131 $/kWhCold and 3.511 years, respectively.
  • Regarding environmental metrics, when using the PV array to generate electricity for the cooling system instead of fully powering it using the electric grid, 437.56 tons of CO2 emissions can be avoided.
  • When considering a 40 $/ton CO2 carbon dioxide penalty, at least $100.59 can be saved, and up to $866.66 when considering a 100 $/ton CO2 penalty.

Author Contributions

Y.R.: Conceptualization, Software, Data Curation and Writing. A.A.: Conceptualization, Methodology, Review and Editing and Supervision. All authors have read and agreed to the published version of the manuscript.

Funding

This research received no external funding.

Institutional Review Board Statement

Not applicable.

Informed Consent Statement

Not applicable.

Data Availability Statement

Data will be made available on request.

Acknowledgments

The first author would like to thank the National Center for Scientific and Technical Research (CNRST) for its financial support received within the framework of the “PhD-Associate Scholarship–PASS” Program.

Conflicts of Interest

The authors of this paper declare no conflicts of interest that could have influenced the conduct, results, or interpretation of the research presented in this article.

Nomenclature

c C O 2 Penalty cost for carbon emissions ($/kgCO2)
C c o l d r o o m Cold room cost ($)
c k w h g r i d Electricity delivered from the grid cost ($/kWh)
c p i c e Ice specific heat (J/Kgice.°C)
c p w a t e r Water specific heat (J/Kgice.°C)
C P V Cost of the PV system ($)
C r e f Cost of the refrigeration unit ($)
d PV modules degradation (%)
E G r i d l o a d Yearly electricity consumed from the electric grid (kWh)
E I c e m a c h i n e Yearly ice machine electricity consumption (kWh)
E l o a d Electricity load (kWh)
E P V Yearly value of electricity generated by the PV array (kWh)
E P V l o a d Yearly value of electricity consumed by the load from the PV (kWh)
F E l e c t r i c g r i d GWP for electricity production (kgCO2/kWh)
F l e a k GWP values for refrigerant leakage (kgCO2/kg)
F P V PV electricity generation carbon footprint (kgCO2/kWh)
i i n f Inflation rate (%)
l Latent heat for water solidification (J/kg)
L Leakage rate (% per year)
m ˙ d a i l y i c e Daily ice consumption ( k g I c e / d a y s )
M t Maintenance costs ($)
n Project duration (years)
N d a y s Number of days when the market operates
N S e l l e r s Fish sellers’ number
O t Operation cost ($)
P G r i d l o a d Electricity consumed by the load from the electric grid for a time segment (kW)
P L o a d Electricity demanded by the system for a time segment (kW)
P P V Electricity generated by the PV array for a time segment in (kW)
P P V L O A D Electricity consumed by the load from the PV array for a time segment (kW)
Q ˙ c o l d Yearly cooling load determined by TRNSYS (kWh/year)
Q ^ E l I c e Electricity needed to produce a specific mass of ice ( k W h / k g I c e . ° C )
Q ^ T h Thermal energy needed to produce a specific mass of ice ( J / k g I c e . ° C )
r Discount rate (%)
T i Initial water temperature (°C)
T f Ice final set temperature (°C)
T f r e e z Water freezing temperature (°C)

Abbreviations

DPPDiscounted payback period (years)
GHGGreenhouse gases
GWPGlobal warming potential
HFCHydrofluorocarbon fluid
LCOCLevelized Cost of Cooling ($/kWhcold)
RHRelative humidity (%)
SCPV array self-consumption rate (%)
SSPV array self-sufficiency rate (%)
T E W I I c e m a c h i n e Total equivalent warming potential of the ice machine (tons CO2)
T E W I P V Total equivalent warming potential of the PV array (tons CO2)

References

  1. Coulomb, D.; Dupont, J.-L.; Morlet, V. The Impact of the Refrigeration Sector on Climate Change—35. Informatory Note on Refrigeration Technologies. 1 November 2017. Available online: https://inis.iaea.org/search/search.aspx?orig_q=RN:51010282 (accessed on 9 May 2023).
  2. Coulomb, D. Refrigeration and cold chain serving the global food industry and creating a better future: Two key IIR challenges for improved health and environment. Trends Food Sci. Technol. 2008, 19, 413–417. [Google Scholar] [CrossRef]
  3. Xue, M.; Kojima, N.; Zhou, L.; Machimura, T.; Tokai, A. Dynamic analysis of global warming impact of the household refrigerator sector in Japan from 1952 to 2030. J. Clean. Prod. 2017, 145, 172–179. [Google Scholar] [CrossRef]
  4. A Cool World Defining the Energy Conundrum of Cooling for All. Available online: www.brookings.edu/wp-content/uploads/2017/02/global_20170228_global-middle-class.pdf (accessed on 13 May 2023).
  5. IEA. Cooling Emissions and Policy Synthesis Report; IEA: Paris, France, 2020. [Google Scholar]
  6. ASHRAE Terminology—Terminology. Presentation. Available online: https://terminology.ashrae.org/ (accessed on 13 May 2023).
  7. Salin, V. 2018 GCCA Global Cold Storage Capacity Report i Acknowledgements. 2018. Available online: http://AFCERC.tamu.edu (accessed on 13 May 2023).
  8. Dong, Y.; Miller, S.A. Assessing the lifecycle greenhouse gas (GHG) emissions of perishable food products delivered by the cold chain in China. J. Clean. Prod. 2021, 303, 126982. [Google Scholar] [CrossRef]
  9. Alan, F.; Tim, B.; Judith, E. Carbon emissions from refrigeration used in the UK food industry. Int. J. Refrig. 2023, 150, 297–303. [Google Scholar] [CrossRef]
  10. Sarr, J.; Dupont, J.L.; Guilpart, J. The Carbon Footprint of the Cold Chain, 7th Informatory Note on Refrigeration and Food. 2021. Available online: https://iifiir.org/fr/fridoc/l-empreinte-carbone-de-la-chaine-du-froid-7-lt-sup-gt-e-lt-sup-gt-note-143457 (accessed on 7 February 2024). [CrossRef]
  11. FAO. The State of Food Security and Nutrition in the World 2022; FAO: Rome, Italy, 2022. [Google Scholar] [CrossRef]
  12. Evans, J.; Foster, A.; Huet, J.-M.; Reinholdt, L.; Fikiin, K.; Zilio, C.; Houska, M.; Landfeld, A.; Bond, C.; Scheurs, M.; et al. Specific energy consumption values for various refrigerated food cold stores. Energy Build. 2014, 74, 141–151. [Google Scholar] [CrossRef]
  13. Delele, M.A.; Ngcobo, M.E.K.; Getahun, S.T.; Chen, L.; Mellmann, J.; Opara, U.L. Studying airflow and heat transfer characteristics of a horticultural produce packaging system using a 3-D CFD model. Part I: Model development and validation. Postharvest Biol. Technol. 2013, 86, 536–545. [Google Scholar] [CrossRef]
  14. Laguerre, O.; Duret, S.; Hoang, H.M.; Guillier, L.; Flick, D. Simplified heat transfer modeling in a cold room filled with food products. J. Food Eng. 2015, 149, 78–86. [Google Scholar] [CrossRef]
  15. O’Sullivan, J.; Ferrua, M.; Love, R.; Verboven, P.; Nicolaï, B.; East, A. Airflow measurement techniques for the improvement of forced-air cooling, refrigeration and drying operations. J. Food Eng. 2014, 143, 90–101. [Google Scholar] [CrossRef]
  16. Ho, S.H.; Rosario, L.; Rahman, M.M. Numerical simulation of temperature and velocity in a refrigerated warehouse. Int. J. Refrig. 2010, 33, 1015–1025. [Google Scholar] [CrossRef]
  17. Wang, G.-B.; Zhang, X.-R. Enhanced airflow by additional axial fans for produce cooling in a cold room: A numerical study on the trade-off between cooling performance and irreversibility. Int. J. Refrig. 2021, 130, 452–465. [Google Scholar] [CrossRef]
  18. Paull, R. Effect of temperature and relative humidity on fresh commodity quality. Postharvest Biol. Technol. 1999, 15, 263–277. [Google Scholar] [CrossRef]
  19. Tirawat, D.; Flick, D.; Mérendet, V.; Derens, E.; Laguerre, O. Combination of fogging and refrigeration for white asparagus preservation on vegetable stalls. Postharvest Biol. Technol. 2017, 124, 8–17. [Google Scholar] [CrossRef]
  20. Brown, T.; Corry, J.E.L.; James, S.J. Humidification of chilled fruit and vegetables on retail display using an ultrasonic fogging system with water/air ozonation. Int. J. Refrig. 2004, 27, 862–868. [Google Scholar] [CrossRef]
  21. Huang, X.; Li, F.; Li, Y.; Meng, X.; Yang, X.; Sundén, B. Optimization of melting performance of a heat storage tank under rotation conditions: Based on taguchi design and response surface method. Energy 2023, 271, 127100. [Google Scholar] [CrossRef]
  22. Allouhi, A.; Kousksou, T.; Jamil, A.; El Rhafiki, T.; Mourad, Y.; Zeraouli, Y. Economic and environmental assessment of solar air-conditioning systems in Morocco. Renew. Sustain. Energy Rev. 2015, 50, 770–781. [Google Scholar] [CrossRef]
  23. Alrwashdeh, S.S.; Ammari, H. Life cycle cost analysis of two different refrigeration systems powered by solar energy. Case Stud. Therm. Eng. 2019, 16, 100559. [Google Scholar] [CrossRef]
  24. Dai, B.; Yang, H.; Liu, S.; Liu, C.; Wu, T.; Li, J.; Zhao, J.; Nian, V. Hybrid solar energy and waste heat driving absorption subcooling supermarket CO2 refrigeration system: Energetic, carbon emission and economic evaluation in China. Solar Energy 2022, 247, 123–145. [Google Scholar] [CrossRef]
  25. Gao, P.; Hu, H.; Jin, S.; Wang, S.; Chen, Y.; Wu, W.; Yang, Q.; Zhu, F.; Wang, L. Solar-driven compression-assisted desorption chemisorption refrigeration/cold energy storage system. Energy Convers. Manag. 2022, 258, 115474. [Google Scholar] [CrossRef]
  26. Sur, A.; Sah, R.P.; Pandya, S. Milk storage system for remote areas using solar thermal energy and adsorption cooling. Mater. Today Proc. 2020, 28, 1764–1770. [Google Scholar] [CrossRef]
  27. Allouhi, A.; Kousksou, T.; Jamil, A.; Agrouaz, Y.; Bouhal, T.; Saidur, R.; Benbassou, A. Performance evaluation of solar adsorption cooling systems for vaccine preservation in Sub-Saharan Africa. Appl. Energy 2016, 170, 232–241. [Google Scholar] [CrossRef]
  28. Xu, Y.; Li, Z.; Chen, H.; Lv, S. Assessment and optimization of solar absorption-subcooled compression hybrid cooling system for cold storage. Appl. Therm. Eng. 2020, 180, 115886. [Google Scholar] [CrossRef]
  29. Liu, H.; Deng, S.; Habib, S.; Shen, B. Emission reduction constrained optimal strategy for refrigeration field: A case study of Ningbo in China. J. Clean. Prod. 2022, 379, 134667. [Google Scholar] [CrossRef]
  30. Luerssen, C.; Gandhi, O.; Reindl, T.; Sekhar, C.; Cheong, D. Life cycle cost analysis (LCCA) of PV-powered cooling systems with thermal energy and battery storage for off-grid applications. Appl. Energy 2020, 273, 115145. [Google Scholar] [CrossRef]
  31. Ikram, H.; Javed, A.; Mehmood, M.; Shah, M.; Ali, M.; Waqas, A. Techno-economic evaluation of a solar PV integrated refrigeration system for a cold storage facility. Sustain. Energy Technol. Assess. 2021, 44, 101063. [Google Scholar] [CrossRef]
  32. Du, W.; Li, M.; Wang, Y.; Ma, X.; Hu, C.; Zhang, Y.; Zhang, Z. Dynamic energy efficiency characteristics analysis of a distributed solar photovoltaic direct-drive solar cold storage. Build. Environ. 2021, 206, 108324. [Google Scholar] [CrossRef]
  33. Rami, Y.; Allouhi, A. A comprehensive multi-criteria assessment of solar-driven refrigeration systems for fish preservation in Africa based on energy, economic, environmental and social dimensions. Energy Convers. Manag. 2024, 306, 118183. [Google Scholar] [CrossRef]
  34. Allouhi, A.; Kousksou, T.; Jamil, A.; Bruel, P.; Mourad, Y.; Zeraouli, Y. Solar driven cooling systems: An updated review. Renew. Sustain. Energy Rev. 2015, 44, 159–181. [Google Scholar] [CrossRef]
  35. Amaral, C.; Vicente, R.; Eisenblätter, J.; Marques, P.A.A.P. Thermal characterization of polyurethane foams with phase change material. Ciên. Tecnol. Mater. 2017, 29, 1–7. [Google Scholar] [CrossRef]
  36. Ahmadi, Y.; Kim, K.-H.; Kim, S.; Tabatabaei, M. Recent advances in polyurethanes as efficient media for thermal energy storage. Energy Storage Mater. 2020, 30, 74–86. [Google Scholar] [CrossRef]
  37. Alsuhaibani, A.M.; Refat, M.S.; Qaisrani, S.A.; Jamil, F.; Abbas, Z.; Zehra, A.; Baluch, K.; Kim, J.-G.; Mubeen, M. Green buildings model: Impact of rigid polyurethane foam on indoor environment and sustainable development in energy sector. Heliyon 2023, 9, e14451. [Google Scholar] [CrossRef]
  38. Welcome | TRNSYS: Transient System Simulation Tool. Available online: https://www.trnsys.com/ (accessed on 13 May 2023).
  39. Intro—Meteonorm (en). Available online: https://meteonorm.com/en/ (accessed on 14 May 2023).
  40. American Society of Heating, Refrigerating and Air-Conditioning Engineers. ASHRAE Handbook: Refrigeration; ASHRAE: Peachtree Corners, GA, USA, 2006; Available online: https://books.google.co.ma/books?id=touHPwAACAAJ (accessed on 7 February 2024).
  41. Home—System Advisor Model—SAM. Available online: https://sam.nrel.gov/ (accessed on 14 May 2023).
  42. Luthander, R.; Widén, J.; Nilsson, D.; Palm, J. Photovoltaic self-consumption in buildings: A review. Appl. Energy 2015, 142, 80–94. [Google Scholar] [CrossRef]
  43. Kalogirou, S.A. Solar Economic Analysis. In Solar Energy Engineering; Elsevier: Amsterdam, The Netherlands, 2014; pp. 701–734. [Google Scholar] [CrossRef]
  44. Beck, T.; Kondziella, H.; Huard, G.; Bruckner, T. Assessing the influence of the temporal resolution of electrical load and PV generation profiles on self-consumption and sizing of PV-battery systems. Appl. Energy 2016, 173, 331–342. [Google Scholar] [CrossRef]
  45. Zhan, S.; Dong, B.; Chong, A. Improving energy flexibility and PV self-consumption for a tropical net zero energy office building. Energy Build. 2023, 278, 112606. [Google Scholar] [CrossRef]
  46. Filimonova, I.V.; Kozhevin, V.D.; Provornaya, I.V.; Komarova, A.V.; Nemov, V.Y. Green energy through the LCOE indicator. Energy Rep. 2022, 8, 887–893. [Google Scholar] [CrossRef]
  47. Chaiyat, N.; Chaongew, S.; Ondokmai, P.; Makarkard, P. Levelized energy and exergy costings per life cycle assessment of a combined cooling, heating, power and tourism system of the San Kamphaeng hot spring, Thailand. Renew. Energy 2020, 146, 828–842. [Google Scholar] [CrossRef]
  48. Maghsoudi, P.; Sadeghi, S. A novel economic analysis and multi-objective optimization of a 200-kW recuperated micro gas turbine considering cycle thermal efficiency and discounted payback period. Appl. Therm. Eng. 2020, 166, 114644. [Google Scholar] [CrossRef]
  49. Allouhi, A. Techno-economic and environmental accounting analyses of an innovative power-to-heat concept based on solar PV systems and a geothermal heat pump. Renew. Energy 2022, 191, 649–661. [Google Scholar] [CrossRef]
  50. Gao, E.; Zhang, Z.; Deng, Q.; Jing, H.; Wang, X.; Zhang, X. Techno-economic and environmental analysis of low-GWP alternative refrigerants in cold storage unit under year-round working conditions. Int. J. Refrig. 2022, 134, 197–206. [Google Scholar] [CrossRef]
  51. Chiller Monoblock Refrigeration—Straddle Unit—16.4 m3. Available online: https://ukcoldroomspares.co.uk/refrigeration/chiller-monoblock-refrigeration-straddle-unit/ (accessed on 11 May 2023).
  52. Solar Price Index & Solar Module Price Development. Available online: https://www.pvxchange.com/Price-Index (accessed on 9 May 2023).
  53. Allouhi, A. Solar PV integration in commercial buildings for self-consumption based on life-cycle economic/environmental multi-objective optimization. J. Clean. Prod. 2020, 270, 122375. [Google Scholar] [CrossRef]
  54. Choukai, O.; El Mokhi, C.; Hamed, A.; Errouhi, A.A. Feasibility study of a self-consumption photovoltaic installation with and without battery storage, optimization of night lighting and introduction to the application of the DALI protocol at the University of Ibn Tofail (ENSA/ENCG), Kenitra—Morocco. Energy Harvest. Syst. 2022, 9, 165–177. [Google Scholar] [CrossRef]
  55. Grant, F.; Sheline, C.; Sokol, J.; Amrose, S.; Brownell, E.; Nangia, V.; Winter, A.G. Creating a Solar-Powered Drip Irrigation Optimal Performance model (SDrOP) to lower the cost of drip irrigation systems for smallholder farmers. Appl. Energy 2022, 323, 119563. [Google Scholar] [CrossRef]
  56. Verma, J.K.; Dondapati, R.S. Techno-economic Sizing Analysis of Solar PV System for Domestic Refrigerators. Energy Procedia 2017, 109, 286–292. [Google Scholar] [CrossRef]
  57. Morocco Electricity Prices, September 2022 | GlobalPetrolPrices.com. Available online: https://www.globalpetrolprices.com/Morocco/electricity_prices/ (accessed on 9 May 2023).
  58. Morocco Interest Rate—2023 Data—1995–2022 Historical—2024 Forecast—Calendar. Available online: https://tradingeconomics.com/morocco/interest-rate (accessed on 11 May 2023).
  59. BANK AL-MAGHRIB—Inflation et Inflation Sous-Jacente—Mars 2023. Available online: https://www.bkam.ma/Actualites/2023/Inflation-et-inflation-sous-jacente-mars-2023 (accessed on 11 May 2023).
  60. Anthropogenic and Natural Radiative Forcing. In Climate Change 2013—The Physical Science Basis; Cambridge University Press: Cambridge, UK, 2014; pp. 659–740. [CrossRef]
  61. Islam, M.A.; Srinivasan, K.; Thu, K.; Saha, B.B. Assessment of total equivalent warming impact (TEWI) of supermarket refrigeration systems. Int. J. Hydrogen Energy 2017, 42, 26973–26983. [Google Scholar] [CrossRef]
  62. Heath, G.; Sandor, D. Life Cycle Greenhouse Gas Emissions from Solar Photovoltaics (Fact Sheet); NREL (National Renewable Energy Laboratory): Jefferson County, CO, USA, 2012.
  63. Cold Room Price Calculator. Available online: https://www.bluecoldref.com/company/cold-room-price (accessed on 9 May 2023).
  64. Modular Coldrooms—Paneltech.eu. Available online: https://paneltech.eu/coldrooms (accessed on 9 May 2023).
  65. Cold Rooms for Sale Cold Room Price Frozen Lobster with Condensing Unit CE Approved—China Cold Room and Cold Room for Sale. Available online: https://coldroomcn.en.made-in-china.com/product/KSsJolvcSVUC/China-Cold-Rooms-for-Sale-Cold-Room-Price-Frozen-Lobster-with-Condensing-Unit-CE-Approved.html (accessed on 9 May 2023).
  66. High Density Polyurethane Foam Sandwich Panels Price | Lazada. Available online: https://www.lazada.com.my/products/high-density-polyurethane-foam-sandwich-panels-price-i1311832093.html (accessed on 9 May 2023).
  67. Cold Room for Sale—Cold Room—Freezer Room for Sale. Available online: https://mortuaryfridge.co.za/product/cold-room-for-sale/ (accessed on 9 May 2023).
  68. CoolPack—IPU. Available online: https://www.ipu.dk/products/coolpack/ (accessed on 12 May 2023).
  69. Zhao, Z.Y.; Chen, Y.L.; Thomson, J.D. Levelized cost of energy modeling for concentrated solar power projects: A China study. Energy 2017, 120, 117–127. [Google Scholar] [CrossRef]
  70. Walraven, D.; Laenen, B.; D’haeseleer, W. Minimizing the levelized cost of electricity production from low-temperature geothermal heat sources with ORCs: Water or air cooled? Appl. Energy 2015, 142, 144–153. [Google Scholar] [CrossRef]
  71. Setiawan, E.A.; Thalib, H.; Maarif, S. Techno-Economic Analysis of Solar Photovoltaic System for Fishery Cold Storage Based on Ownership Models and Regulatory Boundaries in Indonesia. Processes 2021, 9, 1973. [Google Scholar] [CrossRef]
  72. Alrobaian, A.A. Impact of optimal sizing and integration of thermal energy storage in solar assisted energy systems. Renew Energy 2023, 211, 761–771. [Google Scholar] [CrossRef]
  73. Liang, Y.; Zhu, Y.; Sun, Z.; Ye, K.; Wu, J.; Lu, J. Feasibility assessment of a CO2 based power, cooling, and heating system driven by exhaust gas from ocean-going fishing vessel. J. Clean. Prod. 2023, 406, 137058. [Google Scholar] [CrossRef]
  74. Wang, K.; Herrando, M.; Pantaleo, A.M.; Markides, C.N. Technoeconomic assessments of hybrid photovoltaic-thermal vs. conventional solar-energy systems: Case studies in heat and power provision to sports centres. Appl. Energy 2019, 254, 113657. [Google Scholar] [CrossRef]
Figure 1. On-site picture of a fish stand in the market.
Sustainability 16 03080 g001
Figure 2. 3D model of the cold room.
Sustainability 16 03080 g002
Figure 3. Flowsheet representing the followed methodology in the present research.
Sustainability 16 03080 g003
Figure 4. 2D schematic of the wall layers.
Sustainability 16 03080 g004
Figure 5. TRNSYS 16 simulation flowsheet.
Sustainability 16 03080 g005
Figure 6. PV array system representation.
Sustainability 16 03080 g006
Figure 7. Hourly cooling load for a year (W).
Sustainability 16 03080 g007
Figure 8. Hourly global horizontal irradiance (W/m2).
Sustainability 16 03080 g008
Figure 9. Hourly ambient room temperature (°C).
Sustainability 16 03080 g009
Figure 10. Self-sufficiency and self-consumption for different PV capacities.
Sustainability 16 03080 g010
Figure 11. Different energy profiles for every month of the year.
Sustainability 16 03080 g011
Figure 12. Levelized Cost of Cooling ($/kWhCold) in function of different PV capacities and discount rates (%).
Sustainability 16 03080 g012
Figure 13. Discounted payback period (years) for the PV capacity 1.8 kWp in function of inflation rates and discount factor.
Sustainability 16 03080 g013
Figure 14. Total environmental penalty cost savings ($) for different CO2 penalties is the function of inflation and discount rates.
Sustainability 16 03080 g014
Table 1. Wall layers thermal parameters.
MaterialThickness (mm)Conductivity (W/m K)Density (kg/m3)
Steel10157800
Polyurethane780.030540
Steel10157800
Aluminium22002700
Table 2. The research assumptions.
Parameter Value
Set temperature [40]1.6 °C
Set relative humidity [40]90%
Project duration20 years
Cold room refrigeration coefficient of performance2.7
Cold room cost$8270
Refrigeration unit [51]$2580
PV module cost [52]0.33 $/Wp
Inverter cost [53]0.43 $/Wp
Battery cost [54,55]327.6 $/kWh
PV panels’ annual degradation rate [56]0.05%
Annual operation and maintenance costs [31]1% of the initial investment
Cost for Moroccan electricity consumption from the grid [57]0.106 $/kWh
Discount rate [58]3%
Inflation rate [59]8.2%
Ice inlet temperature20 °C
Ice final temperature−10 °C
Ice machine coefficient of performance 2
Daily ice consumption ( k g I c e / d a y s ) 200   k g I c e / d a y s
GWP for R134a [60]1300 kgCO2/kg
Annual R134a refrigeration leakage [61]10%
Initial refrigerant charging amount per cooling load [61]2 kg/kW
Carbon footprint for PV [62]40 gCO2/kWh
Carbon footprint for electric grid [62]627.4 gCO2/kWh
Table 3. PV array parameters.
PV Array SpecificationsInverter Specifications
PV module maximum power Pmp (Wdc)149.988Maximum AC power (Wac)1490
PV module max power voltage Vmp (Vdc)34.8Maximum DC power (Wdc)1552.7
PV module max power current Imp (Adc)4.3max DC voltage (Vdc)400
Nominal efficiency11.7361%
Battery specifications
Desired bank capacity (kWh)5
Table 4. Cooling load (W) in function of different set temperatures (°C).
Temperature (°C)TRNSYS Peak Cooling Load (W)COOLPACK (W)Relative Error (%)
1.02662.9225225.29%
1.52627.3824915.19%
2.02620.2824345.16%
2.52591.8524036.09%
3.02556.3123726.00%
Table 5. Direct and indirect CO2 emissions (kg CO2).
Total Equivalent Warming Potential
Direct emissions (tons CO2)10.400
Indirect emissions (tons CO2) of the reference system463.767
Indirect emissions (tons CO2) using renewable energy system26.204
Disclaimer/Publisher’s Note: The statements, opinions and data contained in all publications are solely those of the individual author(s) and contributor(s) and not of MDPI and/or the editor(s). MDPI and/or the editor(s) disclaim responsibility for any injury to people or property resulting from any ideas, methods, instructions or products referred to in the content.

