Article

Towards Carbon Neutrality in Agglomeration: Impact of Eco-Industry Development on Urban Carbon Emission Efficiency

1
School of Economics and Management, Nanchang University, Nanchang 330031, China
2
School of Qianhu, Nanchang University, Nanchang 330031, China
*
Author to whom correspondence should be addressed.
Sustainability 2024, 16(8), 3159; https://doi.org/10.3390/su16083159
Submission received: 20 March 2024 / Revised: 5 April 2024 / Accepted: 8 April 2024 / Published: 10 April 2024

Abstract

:
Ecological industrial parks (EIPs) play a pivotal role as primary drivers of China’s industrial green transformation, facilitating the enhancement of urban carbon emission efficiency (UCEE) and the realization of green sustainable development. This study empirically investigates the effects of EIP policies on UCEE through quasi-natural experiments, utilizing data from 282 prefecture-level cities in China spanning from 2006 to 2021. Employing a multi-period difference-in-difference (DID) method, the findings are as follows: (1) The implementation of EIP policies leads to a 2.5% average increase in UCEE. (2) Event analysis reveals certain lagging characteristics in the promoting effect of EIP policies on the carbon emission efficiency of pilot cities. (3) EIP construction primarily enhances UCEE by reinforcing agglomeration effects and elevating innovation ability. (4) The promoting effect of EIP construction is more pronounced in the eastern and central regions, as well as in non-resource-based cities within different regions. Drawing from the empirical results, this study provides pertinent recommendations for EIP construction, offering theoretical guidance to policymakers and managers in crafting sustainable development strategies.

1. Introduction

Since the onset of the Industrial Revolution, there has been a pronounced trend of rapid economic expansion attributed to the proliferation of diverse manufacturing and production activities [1,2]. However, the exacerbation of global climate warming is becoming increasingly acute due to heightened greenhouse gas emissions stemming from human activities [3]. Fossil fuel production for industrial purposes stands out as the primary contributor to carbon emissions [4]. Scientific studies indicate that burning fossil fuels accounts for over 80% of the total carbon emissions [5]. Notably, approximately 75% of worldwide carbon dioxide emissions emanate from urban centers. Hence, mitigating carbon emissions is imperative in addressing the challenges precipitated by climate change in urban areas [6,7,8].
Accounting for 30 percent of the world’s emissions, China presently stands as the foremost emitter of carbon dioxide [9,10]. With a concerted emphasis on ecological environmental governance, the Chinese government has delineated strategic objectives aimed at achieving carbon peaking by 2030 and carbon neutrality by 2060 [11]. These goals not only underscore China’s steadfast commitment and sense of responsibility but also present a litmus test for its capacity to curtail carbon emissions. The burgeoning environmental industry has emerged as an indispensable avenue for realizing a symbiotic relationship between economic prosperity and environmental preservation, with the EIPs assuming a pivotal role in nurturing the expansion of eco-friendly enterprises [12,13]. To address the challenges posed by excessive energy consumption, heightened carbon emissions, and pervasive pollution within traditional sectors, China has been actively establishing EIPs since 2001 [13,14].
The concept of an EIP traces back to the 1960s, when industrial facilities began embracing regional cooperation strategies aimed at optimizing resource utilization, minimizing waste, and fostering recycling efforts [15]. In the 21st century, the EIP concept has evolved into a multifaceted approach that integrates principles of industrial ecology, clean production, and waste management. It serves as a paradigm for fostering geographic proximity-based interactions, planning, and development among proximate enterprises. This evolution signals a pivotal shift for businesses away from a competitive mindset toward embracing symbiotic, collaborative, and synergistic industrial ecosystems to achieve objectives centered around reducing environmental footprints, bolstering economic efficiency, and advancing social well-being [16,17,18]. The inception of the “Industrial Symbiosis” initiative in Kalundborg, Denmark, in 1970, stands as a landmark event marking the initial meaningful implementation of EIPs on a global scale [19]. Since then, numerous developed countries, including Austria, the United States, the United Kingdom, Japan, and South Korea, have embarked on EIP initiatives of their own. While the global count of EIP projects stood at less than 50 in the year 2000, there has been a remarkable surge in their proliferation over the past decade. As of 2018, the tally had surged to 250 EIPs either operational or in various stages of development worldwide [20,21,22].
Among the myriad of human activities driving economic growth in China, industrial parks have played a pivotal role. Over the past 30 years, China has established over 2000 industrial parks, accounting for over 60% of industrial output value and over 50% of GDP [23,24]. Driven by the dual objectives of economic growth and environmental protection, the government recognized the significance of EIPs as a win–win strategy at the industrial park level, thus joining the construction trend [22,25]. In 2000, the National Environmental Protection Agency initiated collaboration between the government and universities to explore EIP construction. In 2001, the first pilot EIP, the Guangxi Guigang Sugar Factory Eco-Industrial Park, was approved by the government [24]. In 2003, the National Environmental Protection Agency issued the “Provisional Regulations on Declaration, Naming, and Management of National Eco-Industrial Parks” and the “Guidelines for the Trial Planning of Eco-Industrial Demonstration Parks”, marking the formal establishment of this policy [26,27]. As of December 2020, China had 93 EIPs distributed across all mainland provinces except Tibet and Qinghai [23]. The construction of EIPs is promoted by the central government through pilot projects, where local governments must voluntarily apply for provincial-level EIPs, which are then reviewed and approved by the central government to decide on the pilot national EIPs in different cities [
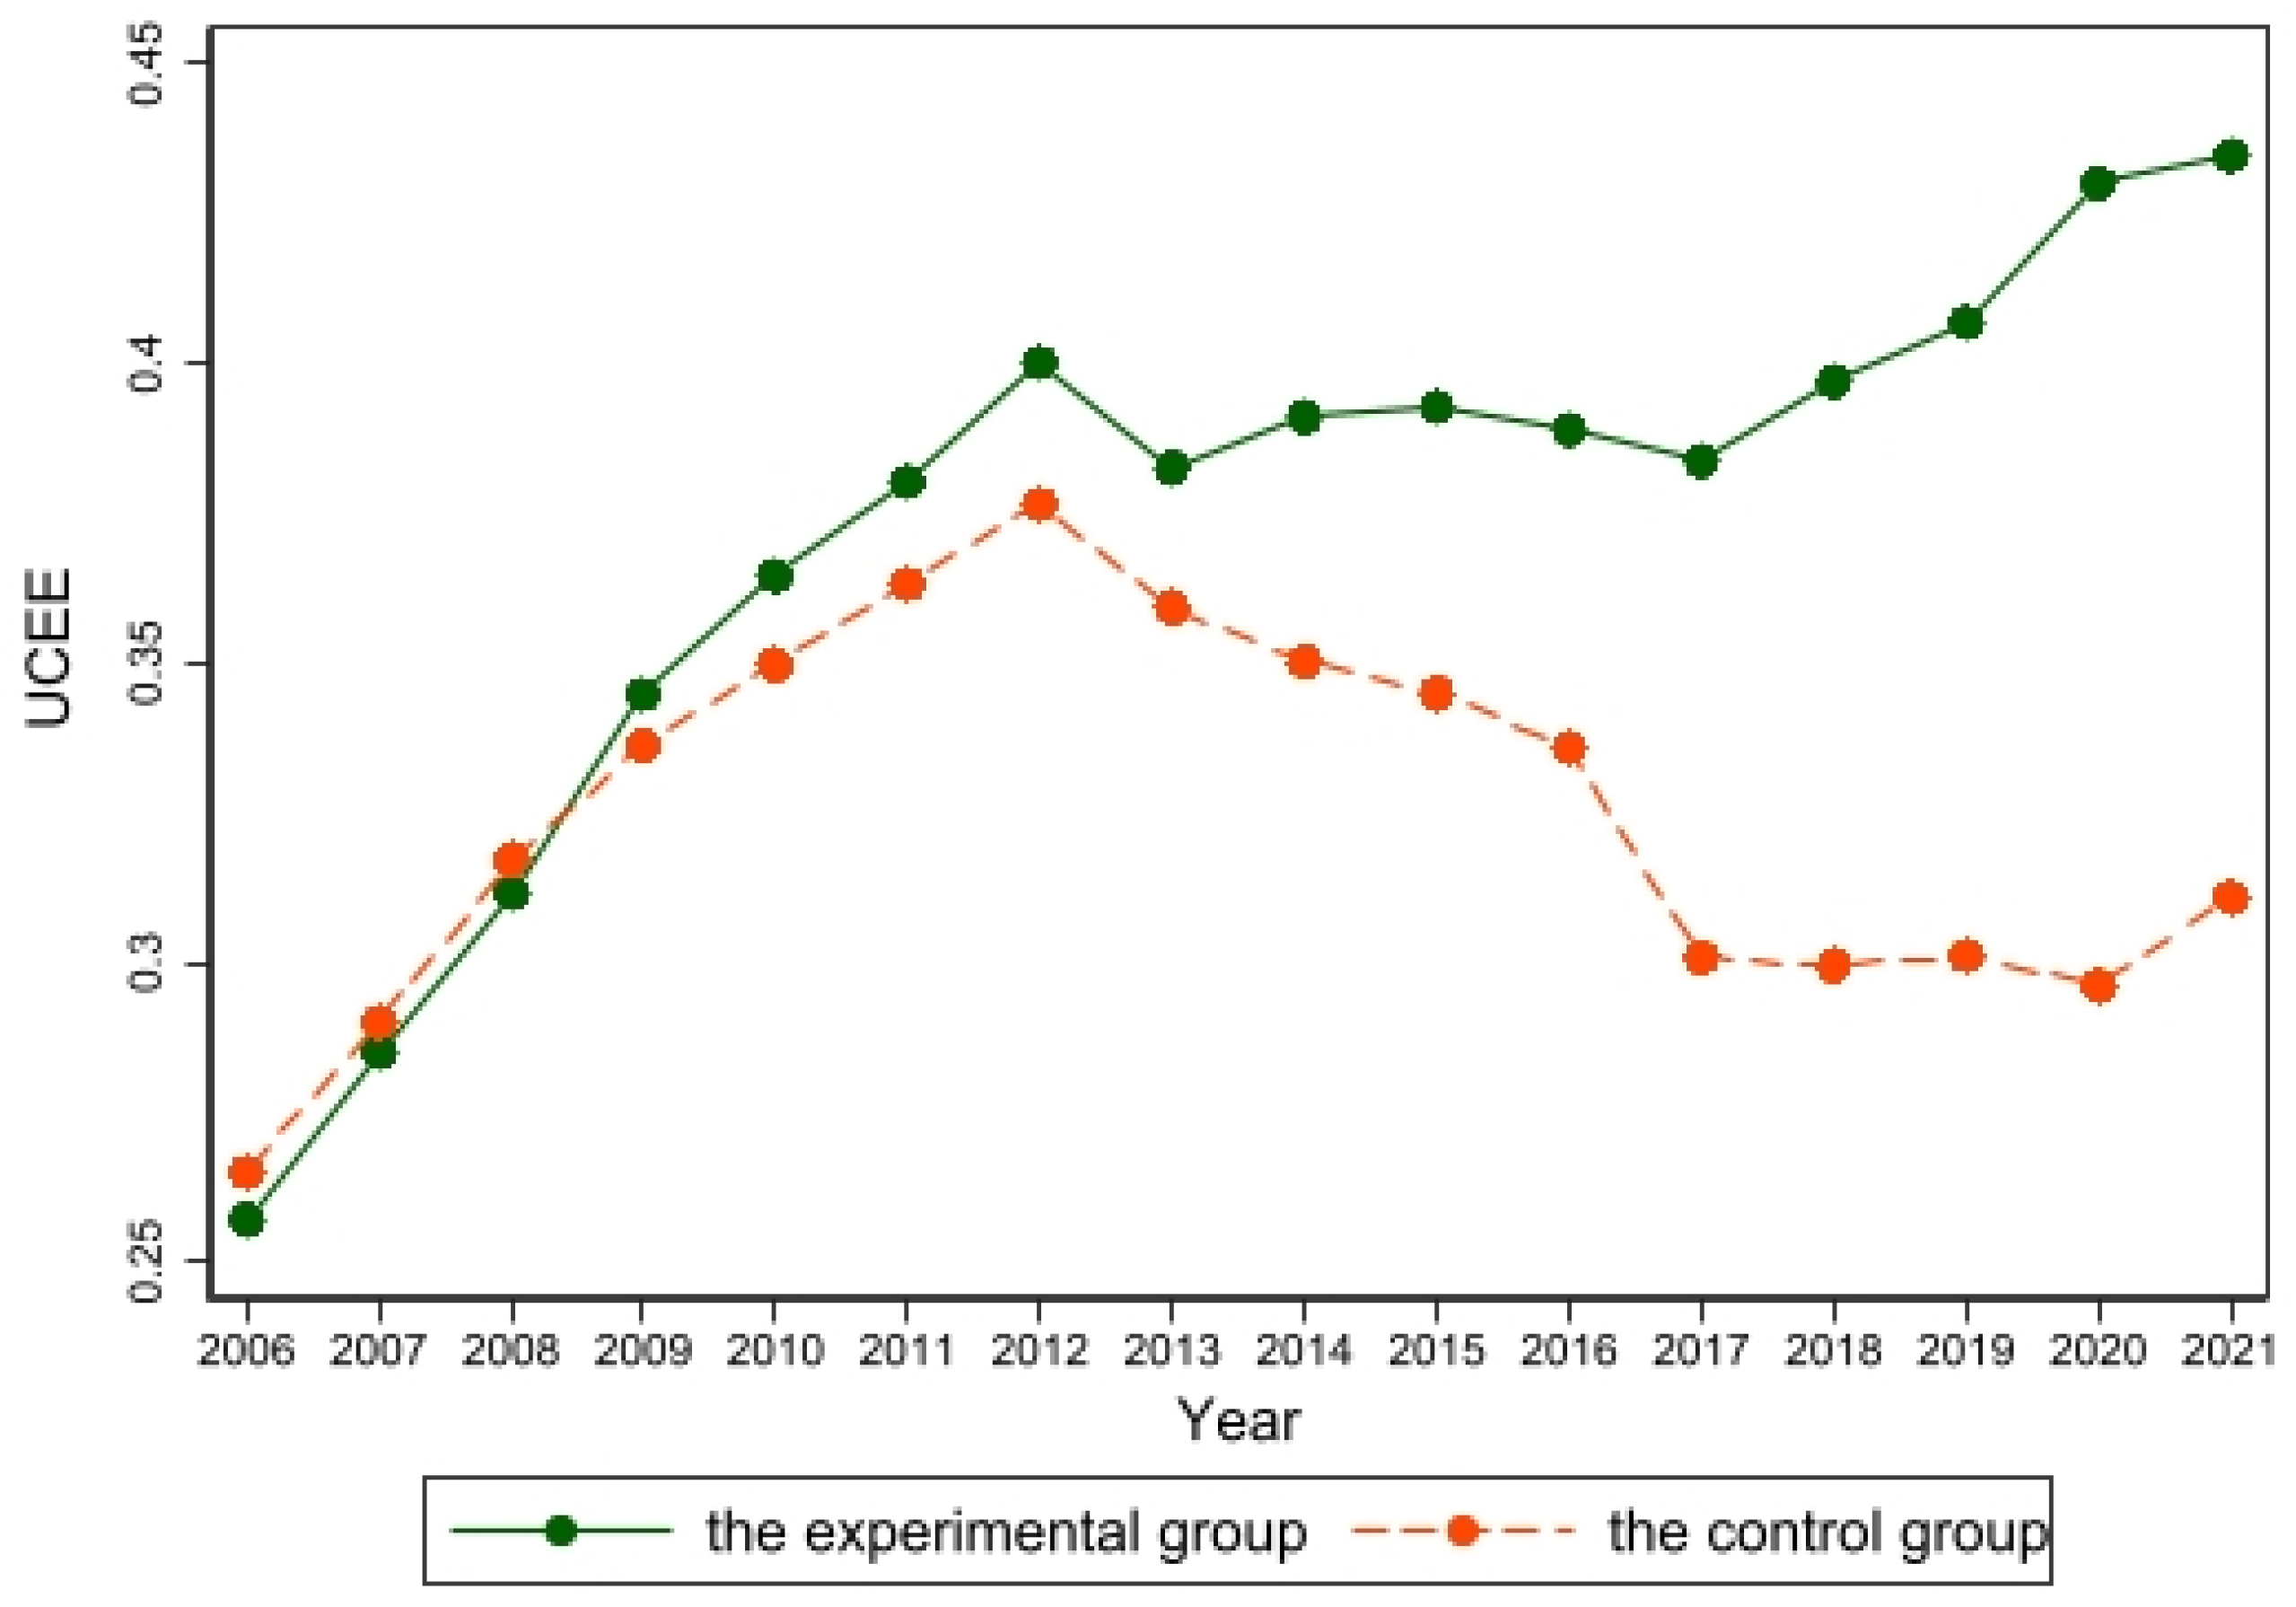
28]. The incremental implementation nature allows for evaluating the effectiveness of EIP policies by comparing trends before and after policy implementation.
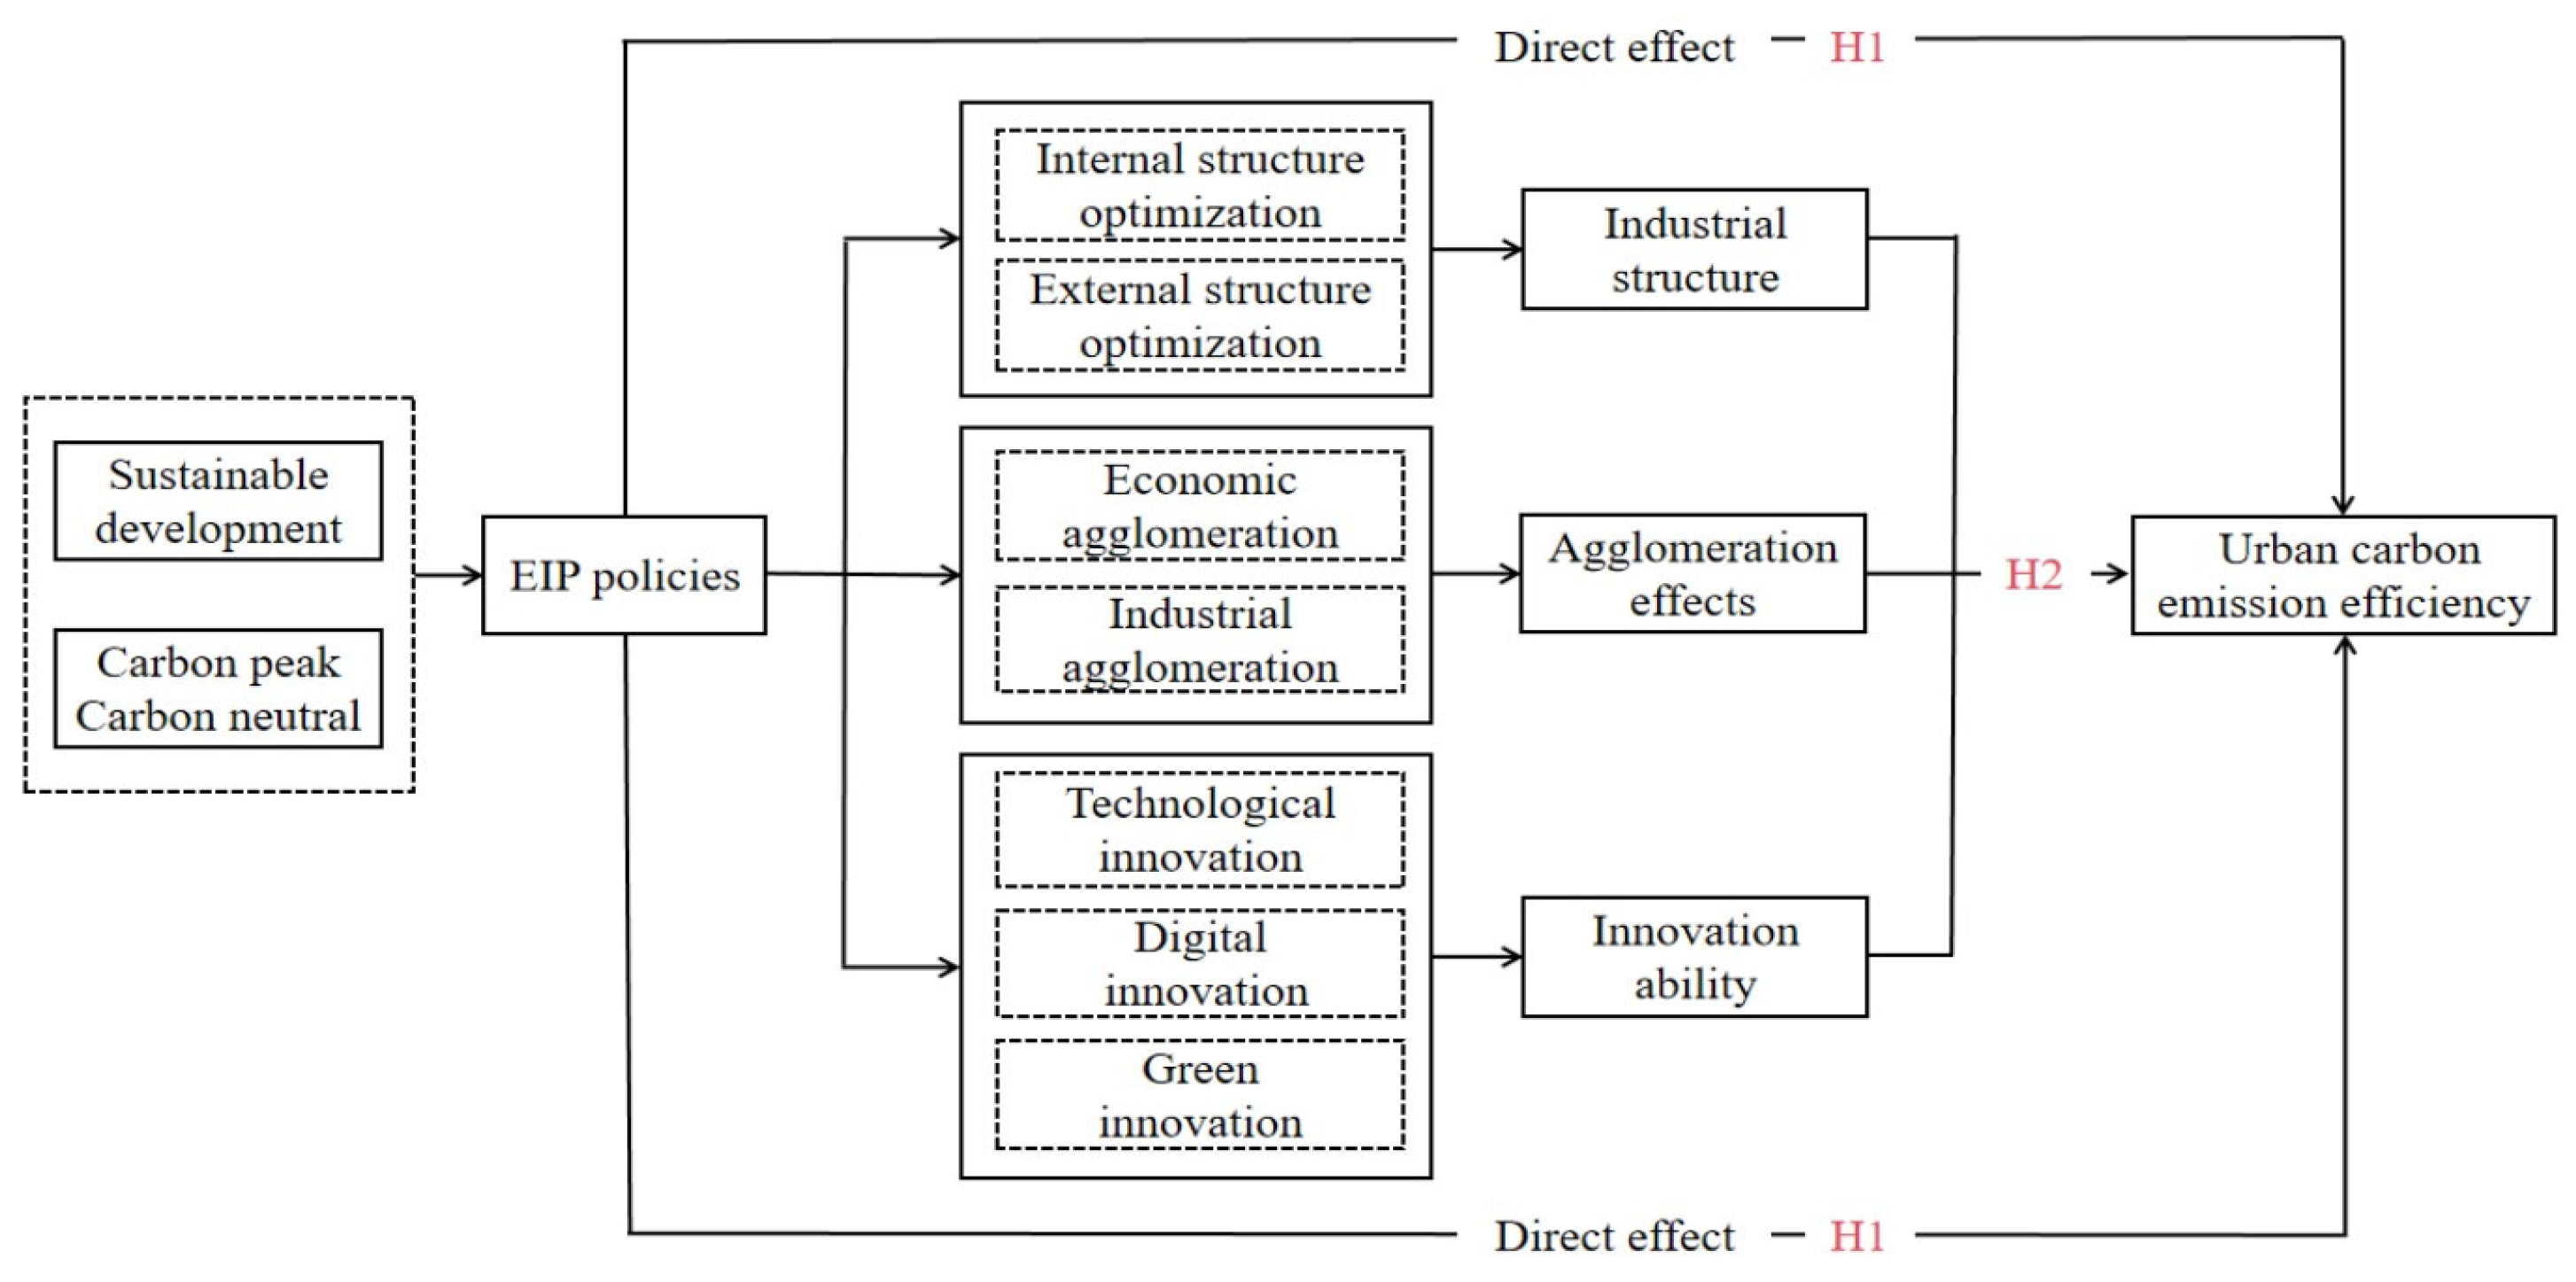
To delve deeper into the environmental ramifications of EIP policies, this study contextualizes the policy impact of EIPs as a quasi-natural experiment within China. It employs a multi-period difference-in-difference (DID) method and a mediation effect model on panel data encompassing 282 prefecture-level cities spanning from 2006 to 2021. Firstly, the carbon emission efficiency for each city during the sample period was computed utilizing the Super-SBM DEA model, which accounts for unexpected outputs. Subsequently, the implementation of EIP policies is observed to yield a significant positive impact on enhancing urban carbon emission efficiency through multi-period difference-in-difference analysis, with a battery of tests ensuring the robustness of these findings. Lastly, by scrutinizing the transmission mechanism, it is posited that EIP policies can effectively foster the improvement of urban carbon emission efficiency through three avenues: optimizing industrial structure, bolstering agglomeration effects, and augmenting innovation ability. Furthermore, the promotional effect of EIP policies is notably pronounced in the eastern and central regions as well as in non-resource-based cities.
The subsequent sections are organized as follows: Section 2 reviews the extant literature, succinctly delineating the incremental contributions of this study; Section 3 scrutinizes relevant theories and posits specific hypotheses; Section 4 delineates the research methodology encompassing model configurations, variable selection, and data sources; Section 5 presents empirical findings and analysis, including baseline regression, robustness tests, mechanism analysis, and heterogeneity analysis; and Section 6 furnishes research conclusions and policy recommendations while contemplating future research avenues.

2. Literature Review

The existing body of literature concerning EIP research predominantly revolves around two core dimensions, including qualitative analysis and quantitative evaluation. Qualitative inquiries into EIPs often delve into their evolutionary trajectory, developmental patterns, case-specific examinations, and the establishment of standardized frameworks. For instance, Yu et al. (2015) [29] undertook a meticulous case study of the Rizhao EIP in China, elucidating that pivotal drivers such as environmental standards, tax incentives, and fiscal subsidies are instrumental in fostering industrial symbiosis. Perrucci et al. (2022) [30] conducted a comprehensive meta-analysis scrutinizing failed EIP endeavors in American history, thus unraveling the nuanced spectrum of costs and benefits associated with EIPs while shedding light on their elevated failure rates. Furthermore, Tseng et al. (2021) [31] employed the Delphi method to intricately construct a hierarchical framework encapsulating qualitative insights into the transformative dimensions of EIPs, thereby elucidating their potential environmental and societal impacts. Conversely, quantitative investigations into EIPs gravitate towards gauging their economic and environmental efficacy. For instance, Liu et al. (2012) [32] utilized the logarithmic average Divisia index method to quantify the overarching ecological efficiency of EIPs, revealing stark regional differentials in environmental performance coupled with a noteworthy annual enhancement rate of 89.4%. In contrast to the conventional life cycle assessment (LCA), the ecological footprint approach emerges as a more intuitive and transparent mechanism, facilitating the measurement of EIPs’ natural resource demands and the evaluation of ecosystem pressures [21]. Similarly, Fan et al. (2017) [20] employed an ecological footprint model to assess the environmental ramifications, thereby showcasing EIPs’ potential in optimizing energy and material utilization while mitigating the ecological footprint of industrial activities. Nevertheless, quantitative research on EIPs predominantly gravitates towards appraising the operational performance of industrial parks, with scant literature scrutinizing the reverberating impacts of EIPs on carbon emission efficiency as a policy catalyst.
Furthermore, research closely aligned with the carbon emissions theme primarily concentrates on two facets: firstly, evaluating carbon emission efficiency. The Malmquist index within the DEA model stands as one of the extensively employed efficiency assessment techniques [33]. Originating from the work of Lozano and Humphrey (2002) [34] and Boisso et al. (2000) [35], Fare et al. formulated this index to gauge decision-making unit productivity. Nonetheless, conventional Malmquist indices overlook unexpected outputs during the production process, potentially introducing measurement biases. To tackle this concern, Zhu et al. (2023) [36] pioneered the development of a directional distance function, derived from the traditional distance function, to compute the total factor productivity index while integrating unexpected outputs. Consequently, assessing carbon emission efficiency through the lens of total factor productivity constitutes standard practice within academia [37]. By establishing a production frontier grounded in input–output relationships, carbon emission efficiency is delineated as the deviation between actual emissions and the theoretically optimal value on the production frontier [38].
Secondly, factors driving carbon emission efficiency were investigated. Numerous scholars have extensively examined the influencing factors of carbon emissions from various perspectives. Li et al. (2018) [39] employed Structural Decomposition Analysis (SDA) to pinpoint emission intensity, changes in production inputs, and output structure as the primary drivers for reducing urban carbon dioxide emissions. Carbon emission reduction in the industrial sector stands as a pivotal aspect of achieving green sustainable development. Cui (2023) [40] assessed the implicit carbon emissions of the industrial sector by developing a non-competitive input–output model and a structural decomposition model, revealing that the demand scale could also significantly influence carbon emissions. Urban expansion exhibits a U-shaped direct effect on local carbon dioxide emissions, while it demonstrates an inverted U-shaped spatial spillover effect on adjacent urban carbon emissions [41]. In the industrial production realm, the production structure of an economy profoundly impacts its carbon dioxide emissions. To attain carbon emission reduction objectives, comprehensive research on industrial structure is imperative. Hu et al. (2023) [42] gauged the rationalization level of industrial structure through Theil’s index calculation, determining that in the short term, with industrial structure rationalization, carbon emissions will increase, but in the long term carbon emissions will decrease with industrial structure rationalization. Presently, China’s industrial structure is gradually optimizing, with close coordination established among relevant departments. However, in comparison to the industrial structure characteristics of developed nations, China’s industrialization process remains in its nascent stages [43]. Cross-regional adjustments in industrial structure not only need to align with regional objectives but also involve inter-regional industrial transfers. Rational arrangement of industrial layout can facilitate the optimization of industrial structure [44]. Furthermore, extant research indicates that industrial agglomeration in sectors such as industry and manufacturing yields significant emission reduction effects [45]. A U-shaped relationship exists between industrial agglomeration and carbon emissions, with industrial agglomeration closely linked to the degree of environmental regulation [46]. Additionally, manufacturing agglomeration may attenuate the carbon emission reduction effect initiated by urban digital trade, while the agglomeration of productive services could enhance this effect [47]. Using a Spatial Durbin Model (SDM), Zhang (2024) [48] revealed that the concentration of green finance exhibits spatial spillover effects on regional carbon emissions, underscoring the need for increased fiscal backing for green and low-carbon projects. Moreover, the efficacy of urban carbon dioxide emissions is impacted by the degree of innovation. Employing the continuous double difference method, Liu (2022) [49] discovered that policies incentivizing innovation have a notable adverse effect on urban carbon dioxide emissions. Several scholars have delved into the interactive dynamics between innovation and economic advancement concerning carbon emissions. Their findings indicate that both the economy and innovation contribute to carbon emission reduction, with the economy facilitating such reductions through mechanisms of innovation [50]. Generally, the influence of innovation on the economy adheres to a U-shaped curve. Nevertheless, Fang’s (2022) [51] investigation unveiled a linear relationship between green innovation and its economic impact. Additionally, the combined effect of digital finance and green technology innovation significantly fosters UCEE, albeit with a suppressive impact on the carbon emission efficiency of neighboring cities [6].
In summary, notwithstanding the significant research contributions made by scholars in the field under investigation, several deficiencies persist in the existing literature. In Table 1, we have compiled a summary of the existing literature. However, certain deficiencies may be apparent in these relevant studies. Firstly, there exists a notable gap in directly examining the impact of EIPs on urban carbon emissions, coupled with a lack of comprehensive and in-depth analysis regarding the underlying mechanisms. Given that EIPs represent a nascent form of industrial organization and novel environmental policy, it is imperative to refrain from merely extrapolating insights from other industrial innovation studies when elucidating its influence on urban carbon emissions. Secondly, a degree of contention surrounds the evaluation of agglomeration effects or innovation concerning the tangible efficacy of urban carbon reduction, necessitating further empirical substantiation. Moreover, prevailing research predominantly focuses on developed nations, with scant attention afforded to developing countries like China. Consequently, the generalizability of prior research findings to developing contexts warrants verification. Lastly, methodologically, prior studies have leaned towards qualitative case analyses, raising concerns regarding researcher subjectivity and sample validity. Furthermore, traditional quantitative analytical approaches employed in these studies inadequately address endogeneity concerns.
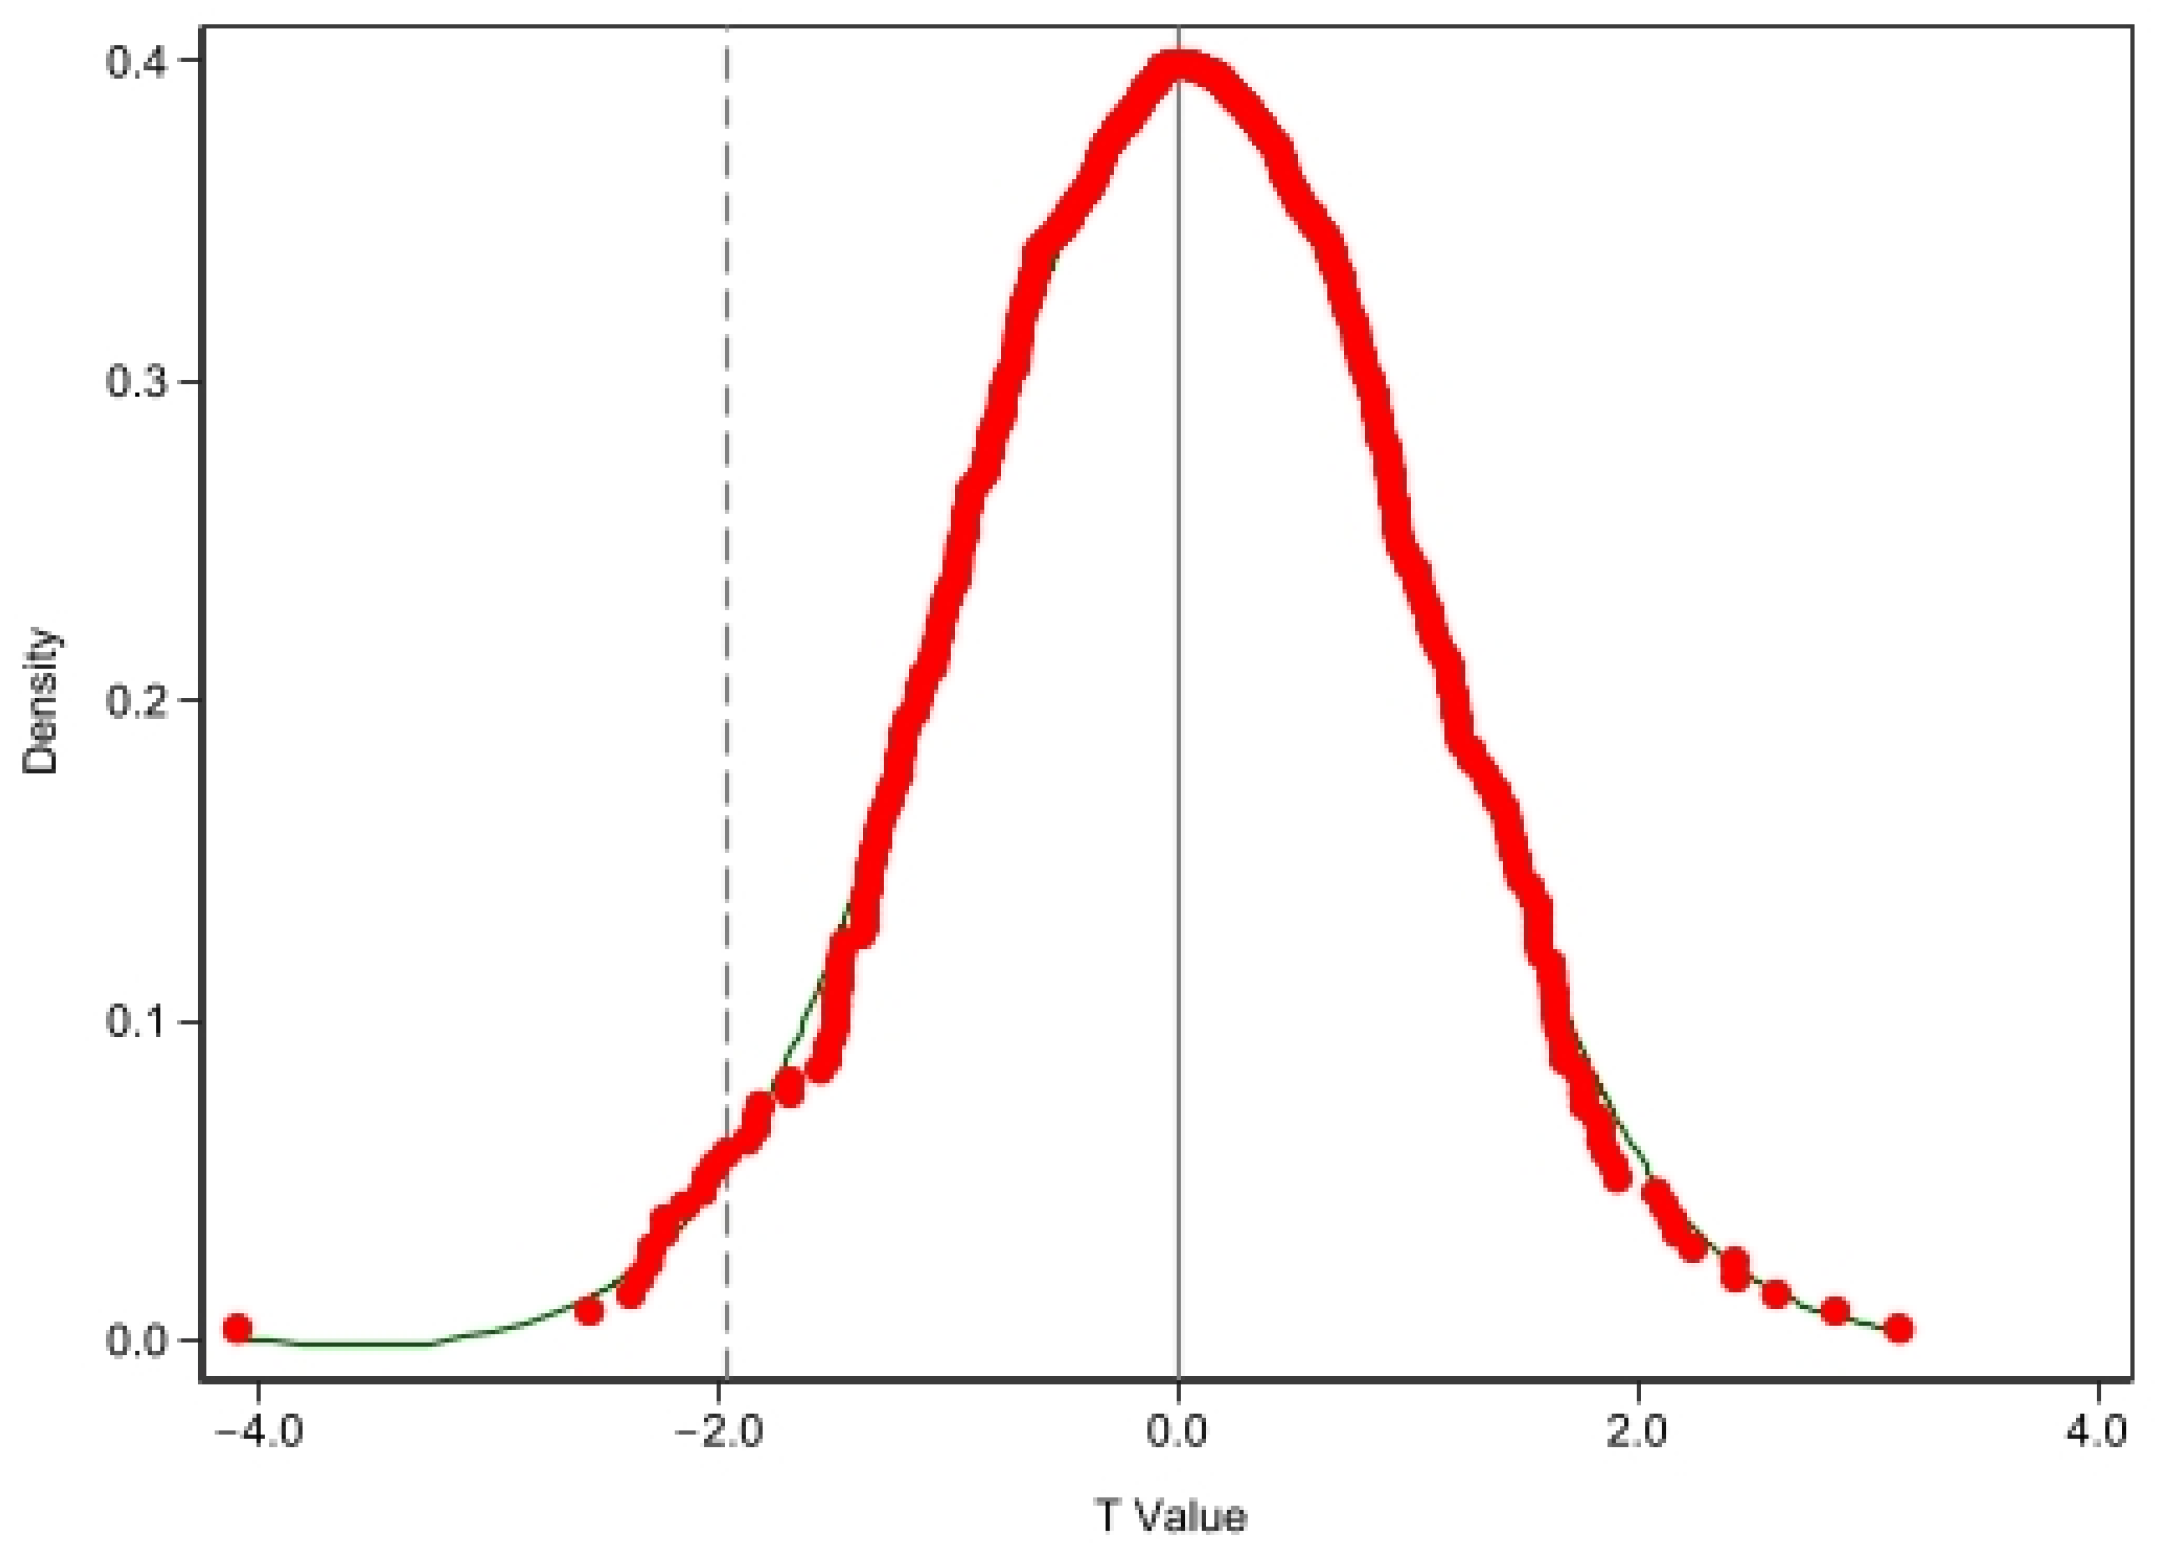
The primary aim is to empirically investigate the direct impacts of EIP policies on UCEE and to unravel the underlying mechanisms. This study makes several notable contributions. Firstly, it delves into the role of EIPs in environmental governance, with UCEE as the central focus, thereby enriching the discourse on EIPs within the environmental domain. Secondly, it narrows its focus to China’s specific context, utilizing precise sample data at the prefecture level to discern policy impacts on cities more accurately. Thirdly, from a methodological perspective, it introduces an innovative application of the multi-period DID method to EIP research, broadening the analytical toolkit for examining EIP’s contributions to environmental governance while effectively addressing endogeneity concerns, thus bolstering the scientific robustness and validity of the findings. Lastly, the study advances the understanding of EIP policies’ influence on urban carbon emissions by dissecting and validating the underlying mechanisms both theoretically and empirically. This deeper analysis elucidates the varying effects of EIP policies on urban characteristics, contributing to a more nuanced theoretical comprehension of EIP policy.

3. Theoretical Analysis and Research Hypothesis

3.1. Direct Effect of EIP on UCEE

In 2003, the Ministry of Ecology and Environment of China promulgated the “National Eco-Industrial Park Declaration, Naming, and Management Regulations”, underscoring the imperative for EIP initiatives to be grounded in sustainable development principles and to serve as catalysts for local economic transformation and environmental amelioration [24]. Theoretically, EIPs hold the potential to enhance UCEE through dual mechanisms. Firstly, they can effectively curtail urban carbon emissions, which stem from energy consumption and are categorized into direct and indirect emissions [23,25]. Direct emissions emanate from fossil fuel combustion, while indirect emissions include those from electricity and heat production. The industrial symbiosis characteristic of EIPs fosters symbiotic relationships among enterprises within the industry, forming cohesive economic entities based on shared or complementary resources. Consequently, industrial symbiosis influences material and energy flows within the park, impacting energy consumption, industrial processes, and waste management, thereby influencing the park’s carbon emissions [18]. Secondly, EIPs can bolster urban productivity. Positioned as the third generation of industrial parks in China, EIPs serve as hubs for ecological industries and upstream and downstream enterprises [12]. Substantial government investments in park infrastructure and policies attracting high-quality enterprises foster balanced upstream and downstream relationships and scale effects [12,13]. Consequently, the agglomeration and selection effects engendered by EIP establishment can drive productivity enhancements [21]. Building upon these premises, this paper posits the following research hypothesis:
H1. 
The EIP policy contributes to the enhancement of UCEE.

3.2. Indirect Effect of EIP on UCEE

The aforementioned analysis leads to the inference that EIPs exert a favorable influence on UCEE. However, the precise mechanisms through which EIPs influence UCEE warrant meticulous examination. Based on institutional theory, this study constructed the research framework depicted in Figure 1. This study will undertake a thorough investigation into the implementation of EIP policies, delving into the multifaceted ways in which such policies bolster UCEE, specifically through their impact on industrial structure, innovation ability, and agglomeration effects.
Firstly, the implementation of EIP policies serves as a catalyst for optimizing and enhancing the urban industrial economic landscape in designated cities, thus bolstering UCEE. On one hand, stringent environmental regulations are enforced by the government alongside meticulous assessment criteria governing emissions, energy consumption, and operational efficiency for enterprises seeking entry into the EIP [24,27]. Adherence to these criteria becomes imperative for enterprises aspiring to expand within the EIP, creating an environmental barrier that compels potential entrants, particularly those characterized by “high pollution, high emissions, and high energy consumption”, to recalibrate their developmental approaches [22]. This pressure fosters a paradigm shift towards industrial structural optimization. On the other hand, enterprises within the EIP must continually meet the government’s stringent assessment criteria, fostering an expulsion effect on pollution-intensive entities within the park [52,53]. In order to sustainably reap the benefits of EIP incentives, enterprises are impelled to expedite their own industrial restructuring efforts. Consequently, the implementation of EIP policies facilitates the overarching enhancement of the urban industrial framework, thereby influencing UCEE positively.
Secondly, the EIP policy fosters the establishment of urban resource clusters. As a key environmental initiative in pilot cities, the EIP endeavors to create high-quality spatial environments conducive to the concentration of pertinent production and innovation elements within designated geographic zones, employing a combination of incentive-driven and regulatory measures [15,18]. This directly catalyzes the emergence of business clusters, yielding tangible economic benefits [54]. Central to this process is the concept of economic agglomeration. According to this theory, the EIP policy incentivizes urban enterprises to coalesce within ecological industrial park areas, serving as spatial hubs [19]. Within these EIPs, enterprises can effectively mitigate operational costs, expedite the exchange, and dissemination of diverse production factors, including technology, human capital, and financial resources, within the agglomerated setting [55]. At the regional level, economic agglomeration and carbon emissions exhibit an “inverted N-shaped” relationship, implying the existence of thresholds for both emission increases and decreases relative to economic agglomeration (Zhou, 2024) [56]. Moreover, the industrial agglomeration catalyzed by the EIP policy is poised to significantly enhance carbon emission performance. Industrial agglomeration stands as one of the paramount spatial organizational structures within the global economy, offering distinct advantages in resource pooling, information dissemination, and economies of scale [45,46]. Recent scholarly investigations underscore the pivotal role of industrial agglomeration in mitigating carbon dioxide emissions, revealing a pronounced U-shaped correlation [46]. This signifies a decline in carbon dioxide emissions during the initial phase of industrial agglomeration. Such a phenomenon stems from the dynamic interplay of competition and collaboration among enterprises, which incentivize the adoption of cutting-edge production technologies, thereby bolstering energy efficiency. However, as industrial agglomeration progresses into its mature and declining phases, emissions may experience an uptick. This resurgence can be attributed to the pitfalls of excessive agglomeration, including resource depletion and overcapacity, ultimately exacerbating environmental degradation [45]. Consequently, the EIP policy is poised to foster the establishment of resource clusters within urban centers, thereby augmenting UCEE.
Finally, the establishment of an EIP is poised to elevate UCEE by fostering heightened levels of innovation within the city. On one front, green innovation emerges as a potent catalyst in enhancing carbon emission management, exerting a notably positive influence across environmentally-conscious, resource-dependent, and resource-independent urban settings (Xu, 2021) [57]. Diverging from conventional development zones, EIPs, guided by eco-centric developmental objectives, is predisposed towards cultivating the spatial clustering of intellectual capital and eco-friendly enterprises. This endeavor entails the infusion of pioneering expertise and eco-conscious manufacturing technologies, alongside the expansion and optimization of circular economy value chains, propelled by the ripple effects of knowledge and technological diffusion [24,58]. Aligned with the tenets of green development and low-carbon imperatives, EIPs assume a proactive stance in incentivizing green innovation, fostering the advancement of eco-industrial technologies and actively introducing novel methodologies conducive to ecological industrialization [49,54]. Simultaneously, technological innovation emerges as a pivotal determinant in curbing regional carbon footprints. Leveraging green technologies such as renewable energy and eco-efficient manufacturing processes is a viable means to curtail fossil fuel consumption across industrial operations, transportation networks, residential domains, and beyond, thus enhancing carbon emission efficacy [23]. Bai et al. (2020) [59] revealed that advancements in renewable energy technologies play a pivotal role in diminishing per capita carbon dioxide emissions. Estimates suggest that digital technology solutions spanning energy, manufacturing, agriculture and land management, construction, services, transportation, and various other sectors hold the potential to curtail approximately 15% of global carbon emissions [60]. Additionally, the establishment of an EIP is poised to instigate a constructive cycle of competition among enterprises situated within its precincts. Consequently, the phenomenon of innovation crowding-out is expected to galvanize enterprises towards undertaking green technology innovation endeavors, aiming to secure a competitive edge in the marketplace, thereby fostering a reduction in environmental pollution and enhancing carbon emission efficiencies [61]. Drawing from these insights, this paper posits the following research hypothesis:
H2. 
The establishment of an EIP can facilitate the advancement of UCEE through three primary mechanisms: optimizing industrial structure, bolstering agglomeration effects, and elevating innovation ability.

4. Methods

4.1. Econometric Model

The current study empirically assesses whether the EIP policy has bolstered UCEE, yet it necessitates addressing the common issue of endogeneity in research. Specifically, endogeneity stems from two facets: Firstly, the non-random selection of cities for EIPs, potentially influenced by factors like regional economic development levels and disparities in environmental quality, which could impact UCEE. Essentially, the decision to designate cities for EIP may correlate with urban carbon emission efficiency, thus introducing endogeneity concerns. Secondly, as the policy unfolds, various unobservable characteristics of distinct cities might also influence UCEE. Consequently, enhancements in UCEE could stem from unobserved city-related variables rather than the policy per se, further complicating endogeneity. Hence, this paper adopts a multi-period DID model to examine the EIP policy’s impact on UCEE. This model will juxtapose the alterations in carbon emission efficiency prior to and post policy implementation between pilot cities and non-pilot cities, while controlling for the non-randomness of pilot city selection and unobservant city attributes affecting UCEE, effectively mitigating endogeneity issues and elucidating the net effect of the pilot policy on UCEE. Given the temporal and regional disparities inherent in the establishment of EIPs, the multi-period DID model is formulated.
U C E E i t = α + β D I D i t + θ C o n t r o l i t + λ i + μ t + ε i t
In Equation (1), the dependent variable U C E E i t represents the carbon emission efficiency of city i in year t. The core explanatory variable, D I D i t , denotes the dummy variable for approved EIPs, which is the product of time dummy variables and between-group dummy variables. If a pilot city receives approval in year t, the value of D I D i t for year t and onwards is 1; otherwise, it is 0. It is worth noting that pilot cities may have multiple EIPs. Therefore, in defining the core explanatory variable, we define cities with only one EIP based on the year of EIP establishment; for cities with multiple EIPs, we only focus on the earliest year of EIP establishment. θ C o n t r o l i t represents the set of control variables, where λ i and μ t , respectively, represent time fixed effects and city-specific fixed effects, and ε i t represents the random error term. The core coefficient, denoted as β , measures the net impact of EIP establishment on UCEE. If the core coefficient is significantly positive, it indicates that approved EIP policies are conducive to improving UCEE; otherwise, it suggests that the policy effect has not been achieved.
Employing the DID model to discern policy effects and examine the parallel trends hypothesis necessitates that both the treatment and control groups exhibit similar trends prior to treatment initiation—notably, the implementation of EIPs. Failure to meet this criterion may lead to systematic disparities and endogeneity concerns within the sample groups. While Equation (1) can elucidate the average impact of EIP establishment on urban carbon emission efficiency, it falls short of capturing the dynamic effects across diverse timeframes. Drawing inspiration from Gehrsitz (2017) [62], this study employs event analysis to expand Equation (1) into a dynamic effects model, thereby delving deeper into the temporal ramifications of EIPs:
  U C E E i t = α + β j j = 4 1 p r e   j i t + β 0 c u r r e n t o t + β k k = 1 5 a f t e r   k i t + θ C o n t r o l i t + λ i + μ t + ε i t
where current represents the time of implementation of the EIP policy in pilot cities, pre-4–pre-1 denotes the four years leading up to the implementation of the EIP policy, and after1–after5 indicates the five years following the implementation of the EIP policy. By observing the significance of the estimated coefficients for pre-4–pre-1, it is possible to determine whether the sample data pass the parallel trends test. Ideally, before the implementation of the EIP policy, there should be no significant difference in the trend of changes in UCEE between the experimental group and the control group, meaning that the estimated coefficients for pre-4–pre-1 are not significant.
Numerous studies have highlighted the positive impact of optimizing industrial structure, fostering agglomeration effects, and advancing innovation to enhance UCEE. To circumvent endogeneity concerns stemming from intermediate variables, this study predominantly examines the influence of EIP establishment on industrial structure, agglomeration effects, and innovation ability. Meanwhile, the theoretical analysis and validation of the effects of industrial structure, agglomeration effects, and innovation ability on UCEE are derived from conclusions drawn in the extant literature. Equation (1) is elaborated into Equation (3) to conduct a mechanistic assessment.
M i t = α 0 + β   D I D i t + θ C o n t r o l i t + λ i + μ t + ε i t
In Equation (3), M i t serves as the mediating variable, calculated, respectively, from indicators of agglomeration effects and innovation ability. The impact of EIP construction on the mediating variable is measured using the core coefficient β . Specifically, regression analysis of Equation (3) indicates significance for β , thus demonstrating the significant role of EIP construction in optimizing industrial structure, enhancing agglomeration effects, and improving innovation ability, thereby validating the influencing mechanism. While Equation (1) aims to investigate whether EIP construction promotes UCEE, Equation (3) aims to explore how EIP construction facilitates the enhancement of UCEE.

4.2. Variable Definition

4.2.1. Explained Variable

To mitigate potential efficiency overestimation and account for non-radial adjustments in inputs and outputs, this study utilizes the Super-SBM DEA model. This model incorporates unexpected outputs and is employed to evaluate the carbon emission efficiency of each city from 2006 to 2021 (see Appendix A for specific information on the Super-SBM DEA model).

4.2.2. Explanatory Variable

In 2008, the Suzhou Industrial Park, Suzhou New and High-tech Industrial Development Zone, and Tianjin Economic-Technological Development Area received official designations as national EIPs by the former Ministry of Environmental Protection, marking the inaugural cohort of formally recognized EIPs nationwide. The process of formal EIP approval commenced as early as 2008, with varying numbers of additional zones added in subsequent years. Notably, there were no new additions in 2009, whereas 12 new zones were incorporated in 2016. Consequently, the explanatory variable comprises dummy variables representing cities sanctioned as EIPs. Standardized values were assigned based on the roster of national environmental performance workgroups published by the National Environmental Protection Agency and the timing of approval. Cities endorsed to host EIPs during the study period received a value of 1, constituting the experimental group in empirical research, while other cities were assigned a value of 0, forming the control group in empirical research.

4.2.3. Control Variable

To mitigate potential biases in estimating carbon emissions, this study incorporates nine control variables based on prior research and data availability: (1) Population density (Pop) is assessed using the logarithm of population per square kilometer in urban areas. (2) Urban economic development (lnRGDP) is gauged using the logarithm of per capita GDP within cities. (3) Human capital (lnWage) is captured through the logarithm of average worker wages. (4) Urbanization level (UL) is quantified using the ratio of urban population to total population in urban areas. (5) Information development index (IDI) is determined using the logarithm of internet user numbers in cities. (6) Industrial structure (STR) is delineated using the share of value added by the secondary industry to GDP. (7) Foreign direct investment (FDI) is expressed as the proportion of actual utilization of foreign direct investment to GDP. (8) Energy consumption structure (ECS) is evaluated based on energy efficiency. (9) Environmental regulation (ER) is assessed using the logarithm of industrial smoke removal volume.

4.3. Data

The study employed data from Chinese prefecture-level cities, sourcing regional-level variables from the “China Statistical Yearbook” and the EPS database. To ensure data adequacy and completeness, cities with significant data deficiencies, such as Lhasa, Chaohu, and Tongren, were excluded. Linear interpolation was applied to rectify missing data points in cities with minimal gaps in certain years. Furthermore, logarithmic transformation was utilized to address heteroskedasticity and effectively control for specific variables. Overall, 282 cities meeting the outlined criteria were selected from the initial 290 prefecture-level cities identified in the “China Urban Statistical Yearbook” of 2003. The study spanned from 2006 to 2021. Detailed information on all data is provided in Table 2.

5. Analysis of Empirical Results

5.1. Benchmark Regression

Utilizing Equation (1), this study assesses the influence of EIP construction on UCEE, thereby elucidating the interplay among key variables. Five distinct regression models were employed, contingent upon the inclusion of control variables and the fixation of city-specific and time effects, with the baseline regression outcomes delineated in Table 3. It is evident from the results that the coefficient of the explanatory variable DID on the dependent variable UCEE is significantly positive, indicating a substantial enhancement in urban carbon emission efficiency attributable to EIP construction.
Focusing on column (5) as the definitive outcome, the regression coefficient of DID on UCEE stands at 0.025 in Table 3, signifying a 2.5% increase in carbon emission efficiency of pilot cities at the 1% significance level following the implementation of EIP policies. Consequently, the establishment of EIPs exerts a discernible promotional effect on enhancing the carbon emission efficiency of local urban areas. Furthermore, this research delves into the impact of various control variables on UCEE. With the exception of human capital (lnWage), industrial structure (STR), and energy consumption structure (ECS), all other control variables exhibit a significant negative association with UCEE. This phenomenon may be ascribed to factors such as heightened population density (Pop), urban economic advancement (lnRGDP), urbanization levels (UL), and the information development index (IDI), which contribute to increased urban carbon intensity, consequently influencing carbon emission efficiency. Moreover, foreign direct investment (FDI) manifests a detrimental effect on UCEE, thereby partially validating the pollution haven hypothesis.

5.2. Robust Test

5.2.1. Parallel Trend Test

To visually ascertain the impact of EIP construction on UCEE, this study initially depicts the annual average carbon emission efficiency of both the experimental and control groups throughout the sample period in a time series graph, as illustrated in Figure 2. Broadly, the experimental group demonstrates a discernible upward trajectory over the analytical timeframe, whereas the control group displays fluctuations but also exhibits some growth compared to the initial period of the sample. A comparison between the two groups indicates that, prior to 2008, both maintained a synchronized trend in carbon emission efficiency, with the control group marginally outperforming the experimental group. However, post-2008, the UCEE of the experimental group notably surpasses that of the control group, with the gap between them progressively widening. This observation leads us to infer that the establishment of EIPs facilitates the enhancement of UCEE.
This study employs the multi-period difference-in-difference method and validates it using the event study approach, as depicted in Figure 3. By considering the year of policy implementation in pilot cities as the base year, we deduce that prior to the establishment of EIPs the coefficient estimates of virtual variables for each period did not reach the 5% significance level. This implies that UCEE did not exhibit significant improvement prior to EIP establishment. However, in the fourth year post EIP establishment, all coefficient estimates of virtual variables surpassed the 5% significance level. This indicates that UCEE experienced notable enhancement in the fourth year following the establishment of EIPs, likely attributable to the lag effect of the policies. Given that the implementation of EIP policies often entails the adoption of novel technologies by associated enterprises, a requisite period for adaptation and execution becomes imperative. For instance, initiatives aimed at fostering the utilization of clean energy within EIP frameworks may necessitate time for the establishment of fresh energy infrastructure and the gradual transition of energy consumption patterns. In summary, this study corroborates the hypothesis of parallel trends.

5.2.2. Placebo Test

The placebo test in this study aimed to discern whether the observed enhancement in UCEE, attributed to the establishment of EIPs, could be ascribed to random factors or other unobserved policy effects. Following the methodologies outlined by Qian et al. (2021) [63] and Li et al. (2022) [64], the study randomly reassigned the treatment indicator DID within the sample and then redistributed this indicator to each sample. Subsequently, the DID model was re-estimated using the shuffled treatment indicator 500 times. The estimation results of the placebo test are presented in Figure 4 The figure indicates that the T-values of the random samples are predominantly centered around 0, with the majority of estimated p-values exceeding 0.1, thus demonstrating a normal distribution. Consequently, the findings of this study are deemed robust.

5.2.3. PSM (Propensity Score Matching) Test

To mitigate concerns regarding selection bias, this study further investigates using the propensity score matching (PSM) method. We apply a PSM-DID model that encompasses all control variables, employing a radius of 0.05 for matching. Only matched observations are retained and reintroduced into Equation (1) for regression analysis. Following a balance test for propensity score matching, we acquire sample data of paired cities for the experimental group established by EIPs. Consequently, we reevaluate Equation (1) based on this dataset, and the regression outcomes are displayed in Column (1) of Table 4. Notably, the regression coefficients of EIP on UCEE remain statistically significant at the 1% level. Thus, the implementation of EIPs appears unaffected by sampling bias, affirming the robustness of the baseline regression results.

5.2.4. Replace the Carbon Emission Efficiency Measurement Method

To uphold the scientific rigor and persuasiveness of the test outcomes, we recalculated the urban replacement efficiency employing the super-efficiency CCR model to reevaluate UCEE [33], with other variables held constant. The regression outcomes are delineated in Column (2) of Table 4. Notably, the regression coefficient of the explanatory variable DID on the explained variable UCEE persists as significantly positive. This affirmation aligns with the principal findings of this study, underscoring the steadfastness of the results.

5.2.5. Lag Effect

Some studies propose that the influence of EIP policies on UCEE might manifest lag effects [63]. Moreover, given the potential bidirectional causality between EIP policies and carbon emission efficiency, this paper addresses endogeneity concerns by lagging the policy time by one period. The regression outcomes, displayed in Column (3) of Table 4, validate the resilience of the earlier findings.

5.2.6. Changing Sample Ranges

Taking into account the delayed influence of EIP policies on pilot cities, we omit sample data from periods after 2017. It is important to highlight that the distinctive geographical positioning and economic significance of the four directly-administered municipalities—Beijing, Shanghai, Guangzhou, and Shenzhen—might attenuate the efficacy of alternative energy-saving and emission-reduction measures, thereby complicating the discernment of EIP policy effects. Consequently, we opt to exclude sample data from these four cities. The regression outcomes are depicted in columns (4) and (5) of Table 4, reaffirming the steadfastness of the study’s conclusions.

5.2.7. Eliminating the Influence of Other Relevant Policies

In addition to EIP policies, there may exist other policies during the study period that could impact UCEE. To uphold the scientific integrity of our findings, it is imperative to mitigate the influence of these alternative policies. Previous research has indicated that carbon emission trading policies [65] and low-carbon city pilot policies [66] wield substantial influence on urban carbon emission efficiency. Consequently, in this study, we adopt a similar approach by assigning a value of 0 prior to the implementation of these policies and 1 thereafter, thereby constructing interaction terms DID1 for the carbon emission trading market policy and DID2 for the low-carbon city pilot policy in Equation (1). The resultant outcomes are delineated in Table 5. Even subsequent to accounting for the effects of other policies, the regression coefficient of DID remains statistically significant, thus affirming the robustness of our study’s conclusions.

5.3. Transmission Mechanism Regression

As outlined in Hypothesis 2, intermediary variables including industrial structure, agglomeration effects, and innovation ability are chosen. Industrial value added (IAV) [41,52] and industrial enterprise profits (IEP) [43] serve as indicators of industrial structure, while the ratio of the sum of value added in the secondary and tertiary industries to the administrative area assesses economic agglomeration (EA) [45,48,58]. Additionally, the logarithm of non-agricultural output to administrative area is utilized to measure industrial agglomeration (PA) [54,55,67] effects. Technological innovation (TI) [68,69] is gauged by the number of patented inventions, green innovation (GI) [51,57] by the quantity of green patents, and digital innovation (DI) [70] by the number of patents related to the digital economy. Initially, this section employs the bootstrap method to scrutinize the three mechanisms by which the establishment of EIPs impacts the enhancement of carbon emission efficiency, unveiling intermediary effects in all instances. Subsequently, a further examination of the influence of EIP establishment on the intermediary variables is undertaken, with the results presented in Table 6.
Upon integrating control variables, the coefficients of DID for the seven selected indicators are all notably positive at the 1% or 5% significance level. This suggests that the implementation of EIPs effectively stimulates the enhancement of UCEE by optimizing industrial structure, augmenting agglomeration effects, and bolstering innovation ability, thereby affirming Hypothesis 2.

5.4. Heterogeneity Analysis

5.4.1. Analysis of Heterogeneity across Geographical Locations

China’s expansive territory exhibits notable disparities in resource distribution and development strategies across its regions, rendering location a pivotal determinant influencing carbon emission efficiency. Our study sample is categorized into eastern, central, and western regions based on the classification provided by the National Bureau of Statistics of China, with regression findings elucidated in Table 7. Our analysis reveals that the implementation of EIPs significantly enhances carbon emission efficiency in eastern cities and central regions yet fails to yield significant results in western cities. Notably, the significance level is more pronounced in the eastern region compared to the central region. This discrepancy may stem from the comparatively higher concentration of heavy industries such as energy, chemicals, materials, and metallurgy in the western region, juxtaposed with the eastern cities’ substantial advantages in high-end innovation, technology, market capacity, and environmental conditions. The introduction of EIPs is anticipated to catalyze technological innovation within enterprises, elevate urban innovation prowess, and, consequently, foster UCEE.

5.4.2. Analysis of Heterogeneity in Urban Resource Endowment

Variations in resource endowments among different cities can significantly influence the efficacy of environmental policies. Therefore, it is imperative to examine the divergent impacts of EIPs on carbon emission efficiency across distinct resource endowment contexts. According to the National Development and Reform Commission’s “National Sustainable Development Plan for Resource-based Cities (2013–2020)”, the sampled cities are categorized into resource-based and non-resource-based, primarily distinguished by whether mineral resource development and processing constitute the dominant industry [71]. Resource-based cities primarily rely on the development and utilization of natural resources to fuel their economic growth. These resources encompass a spectrum, including oil, natural gas, minerals, and timber. Typically, such cities are deeply involved in the extraction, processing, and exportation of these resources as their principal economic pursuits, thereby being significantly impacted by fluctuations in natural resource prices and markets. In contrast, non-resource-based cities’ economic advancement is not primarily contingent upon the exploitation of natural resources; rather, it hinges on diverse industries or service sectors such as manufacturing, finance, technology, education, and tourism. The economic framework of non-resource-based cities is characterized by greater diversification, rendering them more adaptable to economic structural shifts and fluctuations in market dynamics. The efficacy of EIP implementation in enhancing carbon emission efficiency is notably more pronounced in non-resource-based cities compared to resource-based counterparts, implying that existing EIPs have not sufficiently optimized or upgraded the industrial structure of resource-based cities nor have they alleviated the so-called “resource curse.” Furthermore, resource-based cities exhibit excessive dependence on mineral resources, manifesting clear path dependence and lock-in effects. Consequently, current EIP development policies inadequately address all endowed characteristics of resource-based cities, thus failing to adequately promote improvements in resource-based UCEE. Detailed regression findings are outlined in Table 8.

6. Conclusions and Policy Implications

6.1. Conclusions

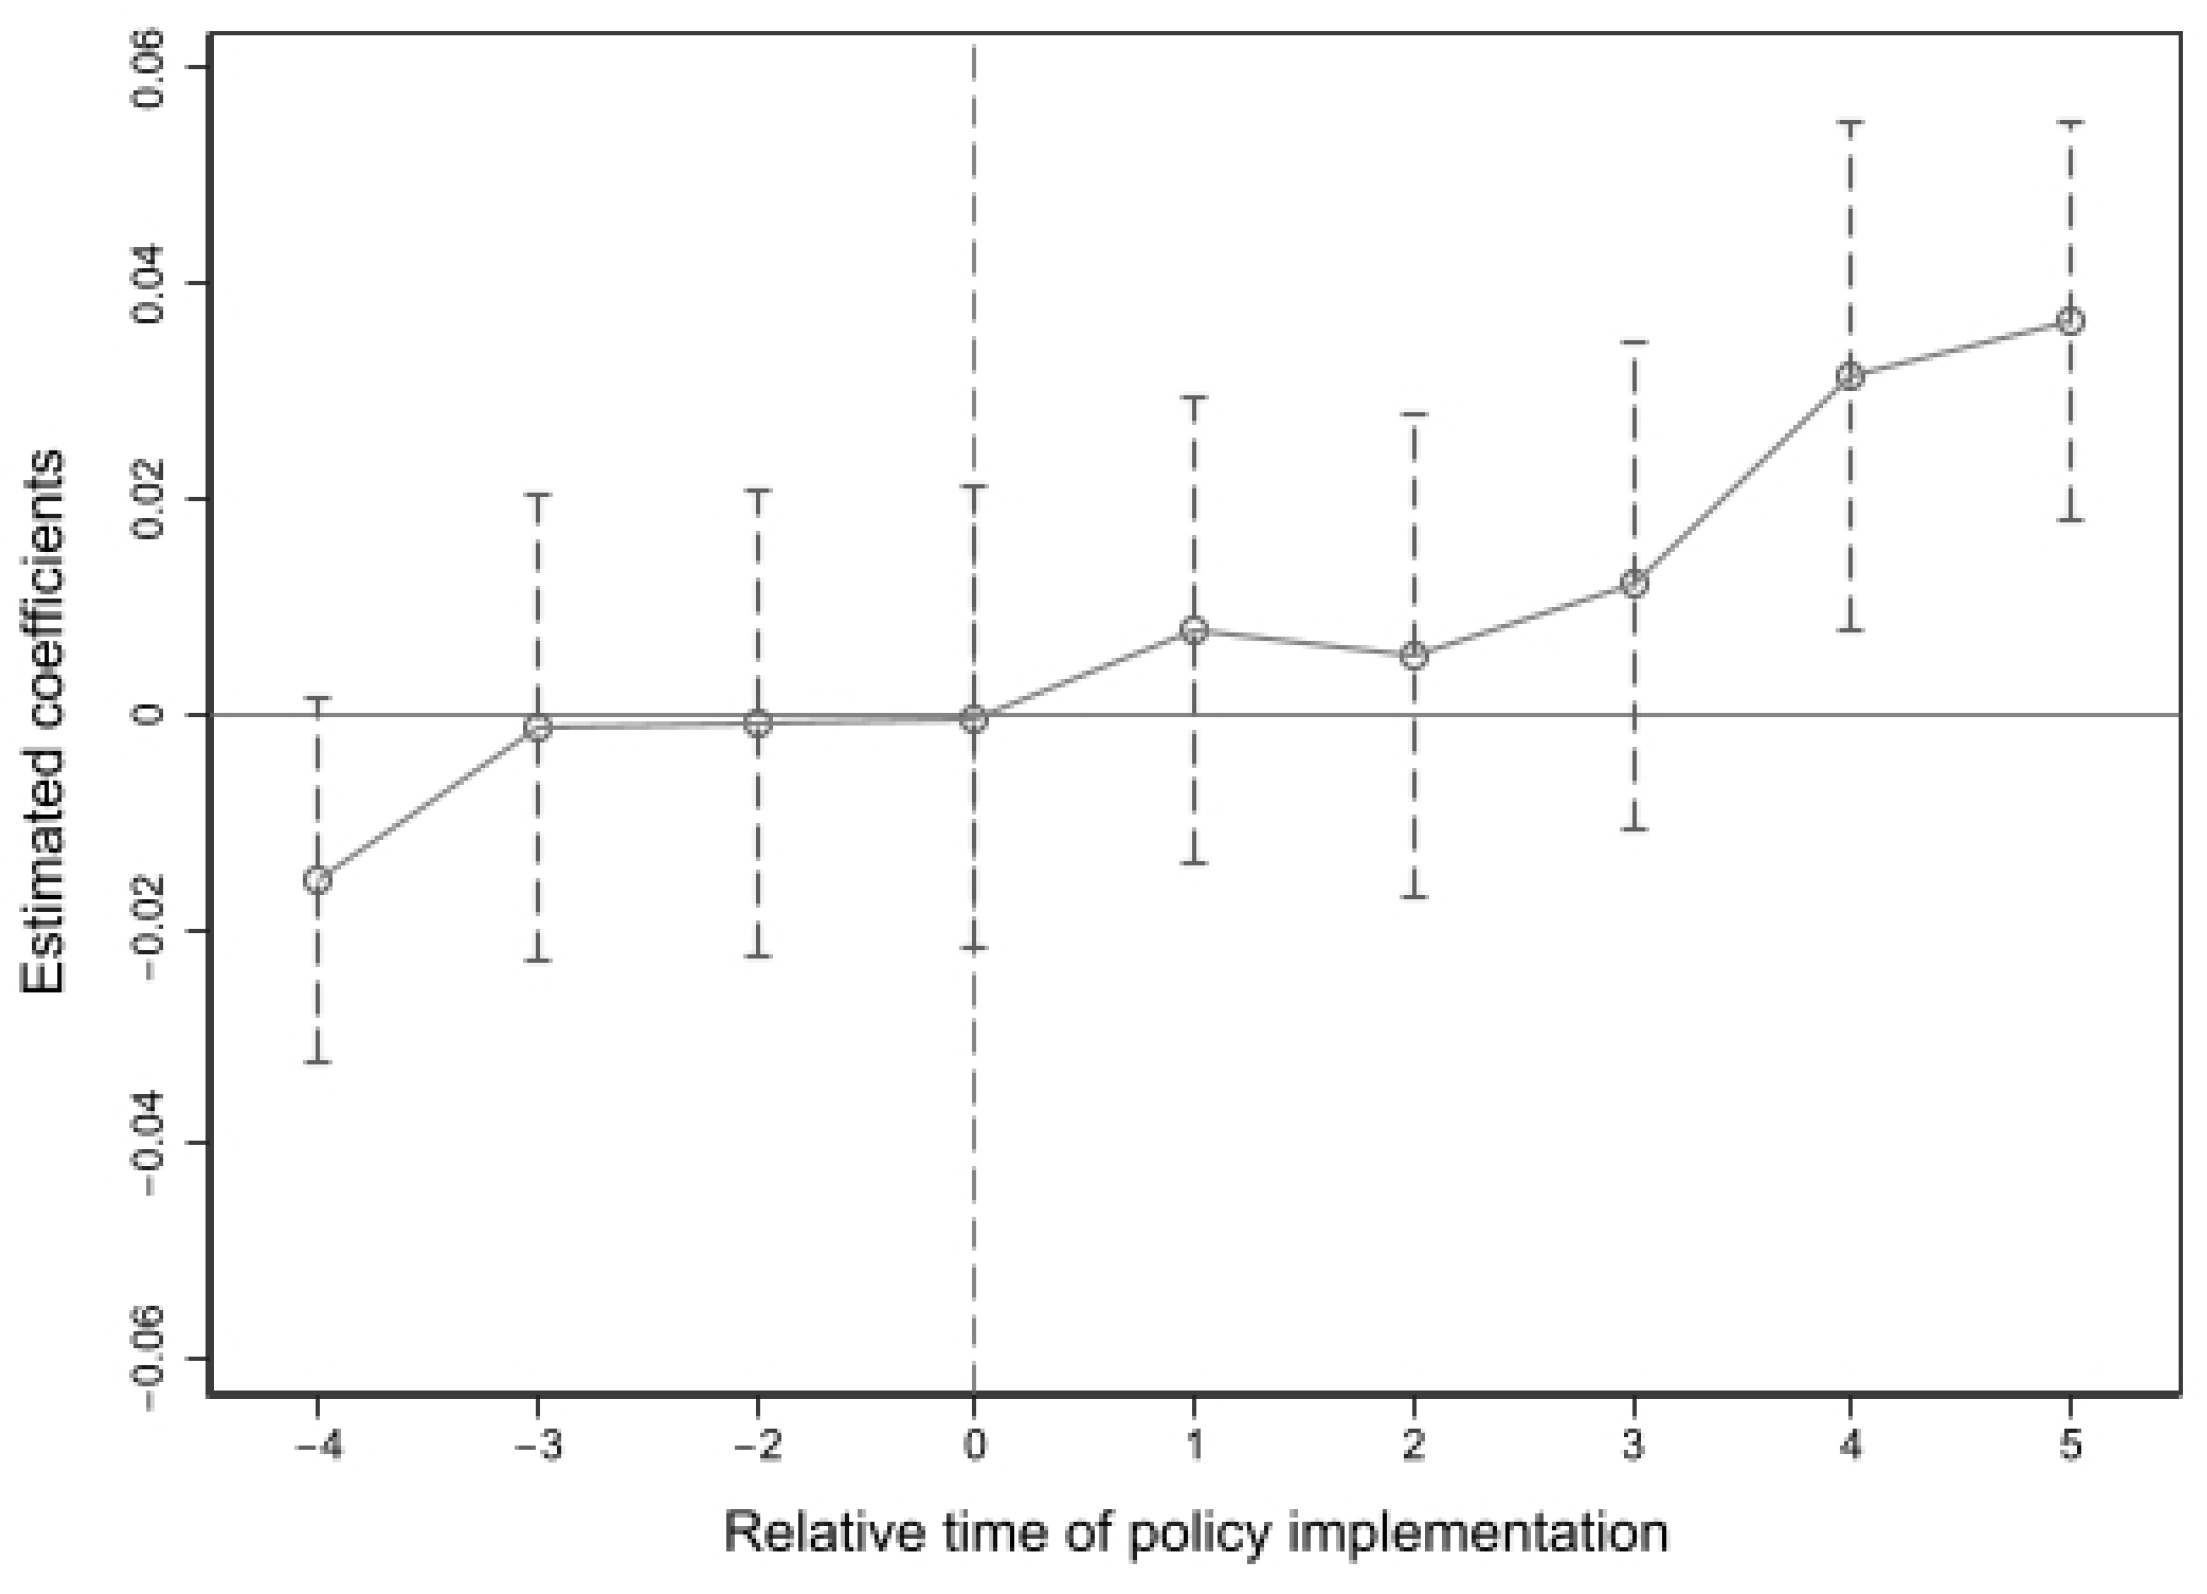
In recent years, with the exacerbation of global climate change, policymakers worldwide have intensified their commitment to employing policy interventions aimed at enhancing carbon emission efficiency, thereby fostering environmental preservation and sustainable development. This study utilizes panel data encompassing 282 prefecture-level cities in China spanning from 2006 to 2021 to establish a quasi-natural experiment centered on the nationwide implementation of EIPs. Employing the difference-in-difference method, the empirical analysis scrutinizes the impact of EIP policies on UCEE. The principal research findings are outlined as follows: Firstly, the implementation of EIP policies notably enhances the carbon emission efficiency of cities. Specifically, for pilot cities, the eco-industrial park policy yields a 2.5% increase in UCEE. Secondly, EIP policies exhibit a certain lagged effect in promoting UCEE, typically manifesting in the fourth year post policy implementation. Thirdly, the establishment of EIPs facilitates UCEE improvement by optimizing industrial structure, augmenting agglomeration effects, and elevating innovation ability. Lastly, the implementation of EIPs substantially boosts carbon emission efficiency in the eastern and central regions, with comparatively diminished effects observed in the western region. The promotional impact on resource-based cities is deemed statistically insignificant, whereas it is significant for non-resource-based cities.

6.2. Policy Implications

There is a need for the government to intensify efforts in advancing the establishment of EIPs throughout China and to broaden the reach of pilot initiatives. Named EIPs demonstrate a more pronounced catalyzing effect compared to those in the approval phase. Hence, eligible industrial parks should be actively encouraged to seek EIP pre-construction qualifications, and approved EIPs should expedite park development to secure formal designation. Moreover, it is imperative to promptly compile successful practices and accomplishments from pilot cities in EIP development to serve as a blueprint for promoting EIP establishment in other locales. Given the delayed environmental advantages stemming from EIP policies in local municipalities and the escalating marginal gains in enhancing UCEE, it is imperative for the government to bolster support for park policies and funding. This could entail augmenting tax incentives, implementing preferential land policies, facilitating technological upgrades and assistance, and intensifying efforts to attract skilled professionals, thereby ensuring the sustained and resilient growth of EIPs.
Leverage the synergistic effects stemming from EIP infrastructure and optimize industrial structure. The government must thoroughly assess the present state, potential, and forthcoming trajectories of industries. Subsequently, strategic integration of diverse enterprises and projects that harmonize with existing industries should be pursued to forge competitive industrial chains. This entails fostering the lateral expansion of interconnected industries, fostering industry clusters, and bolstering overall industry competitiveness. Moreover, the Chinese government should accord priority to technological advancements. Through policy incentives and targeted initiatives, it can implement innovation-centric strategies, continually explore untapped development avenues, appropriately augment funding allocations, concentrate on bolstering technology-oriented enterprises, and facilitate the technological metamorphosis of conventional pollution-intensive sectors. Enterprises ought to proactively respond to governmental policies, hasten the shift of traditional industries towards high-tech domains, and progressively phase out equipment characterized by high pollution and energy consumption.
In addition, given the varied environmental benefits of EIP policies across different cities, the Chinese government must deeply comprehend the economic and social development contexts of pilot cities when enacting policies. This understanding should encompass factors such as urban industrial structure, economic development status, population size, and local resource and environmental conditions. By conducting a comprehensive analysis of these factors, the challenges and potential impacts of EIP policies in diverse urban settings can be accurately gauged, thereby furnishing a solid scientific foundation for policy adjustments. Furthermore, it is imperative to seamlessly integrate EIP policies into the existing industrial landscapes of respective locales. This entails a thorough consideration of the advantageous and distinctive industries prevalent in the area, with a focus on prioritizing these sectors for policy implementation. Such an approach ensures that, while EIP policies yield environmental benefits, they also align with the inherent economic development trajectories of urban regions.

6.3. Limitations

However, this study has certain limitations. Firstly, it exclusively relies on data from Chinese prefecture-level cities, thereby constraining the generalizability of the research findings to the Chinese context. Future research endeavors should adopt a comparative perspective, encompassing similar environmental policies implemented in other countries besides EIPs. Secondly, this study employs a multi-period difference-in-difference approach to evaluate the impacts of EIP policies. While this method is well-suited for panel data analysis, its implementation may pose challenges in cases of significant data gaps. Lastly, this study solely examines the environmental ramifications of EIP policies on UCEE, neglecting to simultaneously investigate their economic and social implications. Subsequent research should delve into the economic and social dividends yielded by EIP policies, further elucidating the tripartite effects of such policies.

Author Contributions

Conceptualization, H.W. and R.W.; methodology, R.W.; software, Y.L.; validation, R.W. and Y.L.; formal analysis, H.W. and R.W.; resources, R.W.; data curation, R.W.; writing—original draft, R.W.; writing—review and editing, H.W. and Y.L.; visualization, R.W.; supervision, H.W.; funding acquisition, H.W. All authors have read and agreed to the published version of the manuscript.

Funding

Project supported by the Natural Science Foundation of Jiangxi Province of China (Grant Nos. 20232BAB203056).

Institutional Review Board Statement

Not applicable. This study did not involve humans or animals.

Informed Consent Statement

Not applicable. This study did not involve humans or animals.

Data Availability Statement

This study analyzed publicly available datasets. The data can be found at https://www.mee.gov.cn/ (Ministry of Ecology and Environment of China), accessed on 8 December 2023; https://www.stats.gov.cn/sj/ndsj/ (China statistical yearbook), accessed on 10 December 2023; and https://www.epsnet.com.cn/index.html (EPS) database, accessed on 16 December 2023.

Conflicts of Interest

The authors declare no conflicts of interest.

Appendix A

Unlike conventional green total factor productivity assessments, determining carbon emission efficiency necessitates accounting for the total volume of carbon emissions. Hence, a methodical and comprehensive consideration of input and output indicators is imperative for constructing carbon emission efficiency. Drawing from the environmental production and directional distance functions introduced by Fare et al. [72], this paper identifies input variables for carbon emission efficiency, encompassing labor, capital, and energy, while city GDP serves as the anticipated output, and city carbon emissions constitute the unexpected output. Regarding calculation methodologies, given that the standard SBM model frequently yields efficiency values of 1 for multiple cities post-calculation, rendering comparisons of carbon emission efficiency unfeasible and, consequently, affecting the accuracy of regression outcomes, this paper further develops a super-efficiency SBM DEA model integrating unexpected outputs, inspired by Li’s [73] proposed super-efficiency model for calculating carbon emission efficiency. The general form of the Super-SBM DEA model is as follows.
M i n   ρ S E = 1 m i = 1 m x i x i k 1 s r = 1 s y r y r k
s . t .   j = 1 , j k n x j λ j x ¯ ;   j = 1 , j k n y j λ j y ¯
j = 1 , j k n x i j λ j + s i = x i k ,   i = 1 , 2 , , m
j = 1 , j k n y i j λ j s r + = y r k ,   i = 1 , 2 , , s
j = 1 , j k n λ j = 1 ,   x ¯ x k ,   y ¯ y k ,   j = 1 , 2 , , n ( j k )
y ¯ 0 ,   λ 0 ,   s r + 0 ,   s i 0
In the above equation, ρ S E represents the efficiency value, where x and y denote input and output variables, respectively. The number of input variables is denoted by m , while the number of output indicators is denoted by s . The slack variables for the input and output are represented by s i and s r + , respectively. The weight vector is denoted by λ . The constraint for the relative effectiveness of the test unit DEA is that ρ S E 1 and s i = s r + = 0 . DEA is considered weakly effective when ρ S E 1 and either s i 0 or s r + 0 . Conversely, when ρ S E < 1 , the calculation is relatively invalid, indicating redundancy and suggesting that both the input and output need improvement for decision-making units to be considered valid. This approach allows us to calculate the carbon efficiency of each city.

References

  1. Wen, H.; Liang, W.; Lee, C.-C. China’s Progress toward Sustainable Development in Pursuit of Carbon Neutrality: Regional Differences and Dynamic Evolution. Environ. Impact Assess. Rev. 2023, 98, 106959. [Google Scholar] [CrossRef]
  2. Dong, Y.; Jin, G.; Deng, X. Dynamic Interactive Effects of Urban Land-Use Efficiency, Industrial Transformation, and Carbon Emissions. J. Clean. Prod. 2020, 270, 122547. [Google Scholar] [CrossRef]
  3. Nie, C.; Lee, C.-C. Synergy of Pollution Control and Carbon Reduction in China: Spatial–Temporal Characteristics, Regional Differences, and Convergence. Environ. Impact Assess. Rev. 2023, 101, 107110. [Google Scholar] [CrossRef]
  4. Li, J.; Shi, J.; Duan, K.; Li, H.; Zhang, Y.; Xu, Q. Efficiency of China’s Urban Development under Carbon Emission Constraints: A City-Level Analysis. Phys. Chem. Earth Parts A/B/C 2022, 127, 103182. [Google Scholar] [CrossRef]
  5. Chen, W.; Wang, G.; Xu, N.; Ji, M.; Zeng, J. Promoting or Inhibiting? New-Type Urbanization and Urban Carbon Emissions Efficiency in China. Cities 2023, 140, 104429. [Google Scholar] [CrossRef]
  6. Lee, C.-C.; Zhao, Y.-N. Heterogeneity Analysis of Factors Influencing CO2 Emissions: The Role of Human Capital, Urbanization, and FDI. Renew. Sustain. Energy Rev. 2023, 185, 113644. [Google Scholar] [CrossRef]
  7. Zhao, H.; Chen, S.; Zhang, W. Does Digital Inclusive Finance Affect Urban Carbon Emission Intensity: Evidence from 285 Cities in China. Cities 2023, 142, 104552. [Google Scholar] [CrossRef]
  8. Xiao, X.; Liu, C.; Li, S. How the Digital Infrastructure Construction Affects Urban Carbon Emissions—A Quasi-Natural Experiment from the “Broadband China” Policy. Sci. Total Environ. 2024, 912, 169284. [Google Scholar] [CrossRef] [PubMed]
  9. Lee, C.-C.; Nie, C. Place-Based Policy and Green Innovation: Evidence from the National Pilot Zone for Ecological Conservation in China. Sustain. Cities Soc. 2023, 97, 104730. [Google Scholar] [CrossRef]
  10. Feng, X.; Lin, X.; Li, Y.; Yang, J.; Yu, E.; He, C.; Lei, K.; Gao, W. Impact of Urban Land Development on Carbon Emission Performance Based on a Multidimensional Framework. Environ. Impact Assess. Rev. 2024, 105, 107429. [Google Scholar] [CrossRef]
  11. Hu, Y.; He, F.; Liao, K.; Liu, X. How Do Land Supply Admittance Regulations Affect Urban Carbon Emissions? J. Environ. Manag. 2023, 347, 119061. [Google Scholar] [CrossRef] [PubMed]
  12. Zhao, R.; Peng, H.; Jiao, W. Dynamics of Long-Term Policy Implementation of Eco-Transformation of Industrial Parks in China. J. Clean. Prod. 2021, 280, 124364. [Google Scholar] [CrossRef]
  13. Yang, W.; Wang, S.; Chen, B. Embodied Carbon Emission Analysis of Eco−industrial Park Based on Input−output Analysis and Ecological Network Analysis. Energy Procedia 2017, 142, 3102–3107. [Google Scholar] [CrossRef]
  14. Wu, J.; Nie, X.; Wang, H.; Li, W. Eco-Industrial Parks and Green Technological Progress: Evidence from Chinese Cities. Technol. Forecast. Soc. Chang. 2023, 189, 122360. [Google Scholar] [CrossRef]
  15. Schlüter, L.; Mortensen, L.; Gjerding, A.N.; Kørnøv, L. Can We Replicate Eco-Industrial Parks? Recommendations Based on a Process Model of EIP Evolution. J. Clean. Prod. 2023, 429, 139499. [Google Scholar] [CrossRef]
  16. Genc, O.; Van Capelleveen, G.; Erdis, E.; Yildiz, O.; Yazan, D.M. A Socio-Ecological Approach to Improve Industrial Zones towards Eco-Industrial Parks. J. Environ. Manag. 2019, 250, 109507. [Google Scholar] [CrossRef] [PubMed]
  17. Hu, W.; Tian, J.; Chen, L. An Industrial Structure Adjustment Model to Facilitate High-Quality Development of an Eco-Industrial Park. Sci. Total Environ. 2021, 766, 142502. [Google Scholar] [CrossRef] [PubMed]
  18. Zhao, H.; Zhao, H.; Guo, S. Evaluating the Comprehensive Benefit of Eco-Industrial Parks by Employing Multi-Criteria Decision Making Approach for Circular Economy. J. Clean. Prod. 2017, 142, 2262–2276. [Google Scholar] [CrossRef]
  19. Wu, Y.; Gao, X. Can the Establishment of Eco-Industrial Parks Promote Urban Green Innovation? Evidence from China. J. Clean. Prod. 2022, 341, 130855. [Google Scholar] [CrossRef]
  20. Fan, Y.; Qiao, Q.; Xian, C.; Xiao, Y.; Fang, L. A Modified Ecological Footprint Method to Evaluate Environmental Impacts of Industrial Parks. Resour. Conserv. Recycl. 2017, 125, 293–299. [Google Scholar] [CrossRef]
  21. Lo, S.-F.; Lu, W.-M.; Chang, C.-W.; Hung, S.-W.; Yang, L.-L. An Efficiency-Driven Approach for Global Ecological Industrial Parks. J. Clean. Prod. 2023, 424, 138837. [Google Scholar] [CrossRef]
  22. Chen, S.; Hou, M.; Ding, Z.; Yao, S. Does Green Location-Oriented Policy Enhance Ecological Resources and Reduce Air Pollution? Empirical Analysis from Counties in China. J. Environ. Manag. 2024, 349, 119437. [Google Scholar] [CrossRef]
  23. Farooque, M.; Zhang, A.; Liu, Y.; Hartley, J.L. Circular Supply Chain Management: Performance Outcomes and the Role of Eco-Industrial Parks in China. Transp. Res. Part E Logist. Transp. Rev. 2022, 157, 102596. [Google Scholar] [CrossRef]
  24. Hong, H.; Gasparatos, A. Eco-Industrial Parks in China: Key Institutional Aspects, Sustainability Impacts, and Implementation Challenges. J. Clean. Prod. 2020, 274, 122853. [Google Scholar] [CrossRef]
  25. Zeng, D.Z.; Cheng, L.; Shi, L.; Luetkenhorst, W. China’s Green Transformation through Eco-Industrial Parks. World Dev. 2021, 140, 105249. [Google Scholar] [CrossRef]
  26. Guo, Y.; Liu, W.; Tian, J.; He, R.; Chen, L. Eco-Efficiency Assessment of Coal-Fired Combined Heat and Power Plants in Chinese Eco-Industrial Parks. J. Clean. Prod. 2017, 168, 963–972. [Google Scholar] [CrossRef]
  27. Hu, Q.; Huang, H.; Kung, C.-C. Ecological Impact Assessment of Land Use in Eco-Industrial Park Based on Life Cycle Assessment: A Case Study of Nanchang High-Tech Development Zone in China. J. Clean. Prod. 2021, 300, 126816. [Google Scholar] [CrossRef]
  28. Wang, K.-L.; Xu, R.-Y.; Jiang, W.; Liu, Y. Impact of National Industrial Relocation Demonstration Zones (NIRDZs) Policy on Urban Carbon Emissions in China. Environ. Impact Assess. Rev. 2023, 102, 107165. [Google Scholar] [CrossRef]
  29. Yu, F.; Han, F.; Cui, Z. Evolution of Industrial Symbiosis in an Eco-Industrial Park in China. J. Clean. Prod. 2015, 87, 339–347. [Google Scholar] [CrossRef]
  30. Perrucci, D.V.; Aktaş, C.B.; Sorentino, J.; Akanbi, H.; Curabba, J. A Review of International Eco-Industrial Parks for Implementation Success in the United States. City Environ. Interact. 2022, 16, 100086. [Google Scholar] [CrossRef]
  31. Tseng, M.-L.; Negash, Y.T.; Nagypál, N.C.; Iranmanesh, M.; Tan, R.R. A Causal Eco-Industrial Park Hierarchical Transition Model with Qualitative Information: Policy and Regulatory Framework Leads to Collaboration among Firms. J. Environ. Manag. 2021, 292, 112735. [Google Scholar] [CrossRef] [PubMed]
  32. Liu, Z.; Geng, Y.; Lindner, S.; Guan, D. Uncovering China’s Greenhouse Gas Emission from Regional and Sectoral Perspectives. Energy 2012, 45, 1059–1068. [Google Scholar] [CrossRef]
  33. Liu, S.; Xia, X.H.; Tao, F.; Chen, X.Y. Assessing Urban Carbon Emission Efficiency in China: Based on the Global Data Envelopment Analysis. Energy Procedia 2018, 152, 762–767. [Google Scholar] [CrossRef]
  34. Lozano-Vivas, A.; Humphrey, D.B. Bias in Malmquist Index and Cost Function Productivity Measurement in Banking. Int. J. Prod. Econ. 2002, 76, 177–188. [Google Scholar] [CrossRef]
  35. Boisso, D.; Grosskopf, S.; Hayes, K. Productivity and Efficiency in the US: Effects of Business Cycles and Public Capital. Reg. Sci. Urban Econ. 2000, 30, 663–681. [Google Scholar] [CrossRef]
  36. Zhu, Q.; Liu, C.; Li, X.; Zhou, D. The Total Factor Carbon Emission Productivity in China’s Industrial Sectors: An Analysis Based on the Global Malmquist-Luenberger Index. Sustain. Energy Technol. Assess. 2023, 56, 103094. [Google Scholar] [CrossRef]
  37. Gao, Y.; Zhang, M.; Zheng, J. Accounting and Determinants Analysis of China’s Provincial Total Factor Productivity Considering Carbon Emissions. China Econ. Rev. 2021, 65, 101576. [Google Scholar] [CrossRef]
  38. Sun, J.; Cui, J.; Dong, F.; Liu, Y. Regional Decomposition and Attribution Analysis of Carbon-Emission Intensity Using an Extended Approach Combined with a Meta-Frontier Non-Radial Malmquist-Luenberger Productivity Index. Environ. Impact Assess. Rev. 2024, 106, 107473. [Google Scholar] [CrossRef]
  39. Li, J.S.; Zhou, H.W.; Meng, J.; Yang, Q.; Chen, B.; Zhang, Y.Y. Carbon Emissions and Their Drivers for a Typical Urban Economy from Multiple Perspectives: A Case Analysis for Beijing City. Appl. Energy 2018, 226, 1076–1086. [Google Scholar] [CrossRef]
  40. Cui, S.; Xu, P.; Wang, Y.; Shi, Y.; Liu, C. Influencing Mechanisms and Decoupling Effects of Embodied Carbon Emissions: An Analysis Based on China’s Industrial Sector. Sustain. Prod. Consum. 2023, 41, 320–333. [Google Scholar] [CrossRef]
  41. Liu, X.; Xu, H.; Zhang, M. The Effects of Urban Expansion on Carbon Emissions: Based on the Spatial Interaction and Transmission Mechanism. J. Clean. Prod. 2024, 434, 140019. [Google Scholar] [CrossRef]
  42. Hu, L.; Yuan, W.; Jiang, J.; Ma, T.; Zhu, S. Asymmetric Effects of Industrial Structure Rationalization on Carbon Emissions: Evidence from Thirty Chinese Provinces. J. Clean. Prod. 2023, 428, 139347. [Google Scholar] [CrossRef]
  43. Li, Z.; Sun, L.; Geng, Y.; Dong, H.; Ren, J.; Liu, Z.; Tian, X.; Yabar, H.; Higano, Y. Examining Industrial Structure Changes and Corresponding Carbon Emission Reduction Effect by Combining Input-Output Analysis and Social Network Analysis: A Comparison Study of China and Japan. J. Clean. Prod. 2017, 162, 61–70. [Google Scholar] [CrossRef]
  44. Zhu, B.; Zhang, T. The Impact of Cross-Region Industrial Structure Optimization on Economy, Carbon Emissions and Energy Consumption: A Case of the Yangtze River Delta. Sci. Total Environ. 2021, 778, 146089. [Google Scholar] [CrossRef] [PubMed]
  45. Xu, J.; Wang, J.; Wang, T.; Li, C. Impact of Industrial Agglomeration on Carbon Emissions from Dairy Farming—Empirical Analysis Based on Life Cycle Assessmsent Method and Spatial Durbin Model. J. Clean. Prod. 2023, 406, 137081. [Google Scholar] [CrossRef]
  46. Liu, X. Industrial Agglomeration, Environmental Regulation, and Carbon Emissions Reduction under the Carbon Neutrality Goal: Threshold Effects Based on Stages of Industrialization in China. J. Clean. Prod. 2024, 434, 140064. [Google Scholar] [CrossRef]
  47. Wen, H.; Zhu, K. Can digital trade promote the low-carbon development of China’s transport sector. Clean Technol. Environ. Policy 2024, 1–17. [Google Scholar] [CrossRef]
  48. Zhang, W.; Liu, X.; Zhao, S.; Tang, T. Does Green Finance Agglomeration Improve Carbon Emission Performance in China? A Perspective of Spatial Spillover. Appl. Energy 2024, 358, 122561. [Google Scholar] [CrossRef]
  49. Liu, R.; Zhu, X.; Zhang, M.; Hu, C. Innovation Incentives and Urban Carbon Dioxide Emissions: A Quasi-Natural Experiment Based on Fast-Tracking Green Patent Applications in China. J. Clean. Prod. 2023, 382, 135444. [Google Scholar] [CrossRef]
  50. You, X.; Chen, Z. Interaction and Mediation Effects of Economic Growth and Innovation Performance on Carbon Emissions: Insights from 282 Chinese Cities. Sci. Total Environ. 2022, 831, 154910. [Google Scholar] [CrossRef]
  51. Fang, G.; Gao, Z.; Wang, L.; Tian, L. How Does Green Innovation Drive Urban Carbon Emission Efficiency?—Evidence from the Yangtze River Economic Belt. J. Clean. Prod. 2022, 375, 134196. [Google Scholar] [CrossRef]
  52. Jiang, M.; An, H.; Gao, X. Adjusting the Global Industrial Structure for Minimizing Global Carbon Emissions: A Network-Based Multi-Objective Optimization Approach. Sci. Total Environ. 2022, 829, 154653. [Google Scholar] [CrossRef] [PubMed]
  53. Zheng, H.; Gao, X.; Sun, Q.; Han, X.; Wang, Z. The Impact of Regional Industrial Structure Differences on Carbon Emission Differences in China: An Evolutionary Perspective. J. Clean. Prod. 2020, 257, 120506. [Google Scholar] [CrossRef]
  54. Liu, Y.; Yang, M.; Cui, J. Urbanization, Economic Agglomeration and Economic Growth. Heliyon 2024, 10, e23772. [Google Scholar] [CrossRef] [PubMed]
  55. Hu, R.; Xu, W.; Liu, L.; Cui, Z.; Zhao, C. The Impact of Urban Agglomerations on Carbon Emissions in China: Spatial Scope and Mechanism. J. Clean. Prod. 2023, 419, 138250. [Google Scholar] [CrossRef]
  56. Wang, J.; Dong, X.; Dong, K. How Does ICT Agglomeration Affect Carbon Emissions? The Case of Yangtze River Delta Urban Agglomeration in China. Energy Econ. 2022, 111, 106107. [Google Scholar] [CrossRef]
  57. Xu, L.; Fan, M.; Yang, L.; Shao, S. Heterogeneous Green Innovations and Carbon Emission Performance: Evidence at China’s City Level. Energy Econ. 2021, 99, 105269. [Google Scholar] [CrossRef]
  58. Wang, L. Impacts of Digital Economy Agglomeration on Carbon Emission: A Two-Tier Stochastic Frontier and Spatial Decomposition Analysis of China. Sustain. Cities Soc. 2023, 95, 104624. [Google Scholar] [CrossRef]
  59. Bai, C.; Feng, C.; Yan, H.; Yi, X.; Chen, Z.; Wei, W. Will Income Inequality Influence the Abatement Effect of Renewable Energy Technological Innovation on Carbon Dioxide Emissions? J. Environ. Manag. 2020, 264, 110482. [Google Scholar] [CrossRef]
  60. Zhang, Y.; Lan, M.; Zhao, Y.; Su, Z.; Hao, Y.; Du, H. Regional Carbon Emission Pressure and Corporate Green Innovation. Appl. Energy 2024, 360, 122625. [Google Scholar] [CrossRef]
  61. Li, Y.; Zhang, Y. What Is the Role of Green ICT Innovation in Lowering Carbon Emissions in China? A Provincial-Level Analysis. Energy Econ. 2023, 127, 107112. [Google Scholar] [CrossRef]
  62. Gehrsitz, M. The Effect of Low Emission Zones on Air Pollution and Infant Health. J. Environ. Econ. Manag. 2017, 83, 121–144. [Google Scholar] [CrossRef]
  63. Qian, L.; Xu, X.; Sun, Y.; Zhou, Y. Carbon Emission Reduction Effects of Eco-Industrial Park Policy in China. Energy 2022, 261, 125315. [Google Scholar] [CrossRef]
  64. Li, X.; Cheng, Z. Does High-Speed Rail Improve Urban Carbon Emission Efficiency in China? Socio-Econ. Plan. Sci. 2022, 84, 101308. [Google Scholar] [CrossRef]
  65. Pu, S.; Ouyang, Y. Can Carbon Emission Trading Policy Promote Green Innovation? The Perspective of Corporate Operating Difficulties. J. Clean. Prod. 2023, 420, 138473. [Google Scholar] [CrossRef]
  66. Wang, L.; Shao, J.; Ma, Y. Does China’s Low-Carbon City Pilot Policy Improve Energy Efficiency? Energy 2023, 283, 129048. [Google Scholar] [CrossRef]
  67. Wang, Z.; Zhang, J.; Luo, P.; Sun, D.; Li, J. Revealing the Spatio-Temporal Characteristics and Impact Mechanism of Carbon Emission in China’s Urban Agglomerations. Urban Clim. 2023, 52, 101733. [Google Scholar] [CrossRef]
  68. Zhou, D.; Lu, Z.; Qiu, Y. Do Carbon Emission Trading Schemes Enhance Enterprise Green Innovation Efficiency? Evidence from China’s Listed Firms. J. Clean. Prod. 2023, 414, 137668. [Google Scholar] [CrossRef]
  69. Wen, H.; Hu, K.; Nghiem, X.H.; Acheampong, A.O. Urban climate adaptability and green total-factor productivity: Evidence from double dual machine learning and differences-in-differences techniques. J. Environ. Manag. 2024, 350, 119588. [Google Scholar] [CrossRef]
  70. Chang, K.; Liu, L.; Luo, D.; Xing, K. The Impact of Green Technology Innovation on Carbon Dioxide Emissions: The Role of Local Environmental Regulations. J. Environ. Manag. 2023, 340, 117990. [Google Scholar] [CrossRef]
  71. Li, B.; Han, Y. Policy Effects and Mechanisms of Ecological Civilization Demonstration Area on Carbon Efficiency in Resource-Based Cities. Ecol. Indic. 2023, 155, 111055. [Google Scholar] [CrossRef]
  72. Fare, R.; Grosskopf, S.; Pasurkajr, C. Environmental Production Functions and Environmental Directional Distance Functions. Energy 2007, 32, 1055–1066. [Google Scholar] [CrossRef]
  73. Li, S.; Jahanshahloo, G.R.; Khodabakhshi, M. A Super-Efficiency Model for Ranking Efficient Units in Data Envelopment Analysis. Appl. Math. Comput. 2007, 184, 638–648. [Google Scholar] [CrossRef]
Figure 1. The research framework.
Sustainability 16 03159 g001
Figure 2. Trend of the UCEE between the experimental and control group.
Sustainability 16 03159 g002
Figure 3. Parallel trend test and dynamic effect estimation.
Sustainability 16 03159 g003
Figure 4. Placebo test.
Sustainability 16 03159 g004
Table 1. Existing literature analysis.
FieldContentContributorsMethodologyResearch Finding
EIPQualitative analysisYu et al. (2015) [29]; Perrucci et al. (2022) [30]; Tseng et al. (2021) [31]evolutionary trajectory; developmental patterns; case-specific examinations; the establishment of standardized frameworksEIPs are anticipated to yield a spectrum of environmental and economic ramifications.
Quantitative evaluationLiu et al. (2012) [32]; Fan et al. (2017) [20]logarithmic average Divisia index method; life cycle assessment (LCA); ecological footprint model
UCEEEvaluating carbon emission efficiencyLiu et al. (2018) [33]; Lozano and Humphrey (2002) [34]; Boisso et al. (2000) [35]; Zhu et al. (2023) [36]; Gao et al. (2021) [37]; Sun et al. (2024) [38]the Malmquist index within the DEA model; total factor productivity indexBuilding upon the conventional Malmquist index, the research endeavors to establish a production frontier by examining input–output relationships, thereby enhancing the precision of carbon emission efficiency measurements.
Driving factors of carbon emission efficiencyLi et al. (2018) [39]; Cui (2023) [40]; Liu (2024) [41]; Hu et al. (2023) [42]; Li (2017) [43]; Zhu (2021) [44]; Xu (2023) [45]; Liu (2024) [46]; Wen and Zhu (2024) [47]; Zhang (2024) [48]; Liu (2022) [49]; You and Chen (2022) [50]; Fang’s (2022) [51]; Lee and Zhao (2023) [6]Structural Decomposition Analysis (SDA); a non-competitive input–output model and a structural decomposition model; Theil’s index; Spatial Durbin Model (SDM);It delves into diverse factors influencing carbon emission efficiency from multifaceted angles. These factors encompass emission intensity, production inputs, shifts in output composition, demand scale, urban sprawl, industrial composition, economic concentration, manufacturing clustering, green finance integration, eco-innovation, and technological advancement, among others.
Table 2. Descriptive statistics.
VariablesMaximumMinimumMeanStandard DeviationObservation
UCEE1.1780.0250.3310.1254512
DID100.0640.2454512
Pop7.8821.6095.7370.924512
lnRGDP13.0564.59510.4910.7254512
lnWage12.2148.50910.6760.5374512
UL3.2060.1160.5040.2234512
IDI17.7625.46813.0691.1734512
STR90.9711.746.76911.1774512
FDI0.19900.0180.0194512
ECS2.510.0410.5490.1644512
ER25.446013.0322.1694512
Table 3. Benchmark regression.
(1)(2)(3)(4)(5)
UCEEUCEEUCEEUCEEUCEE
DID0.104 ***0.071 ***0.074 ***0.021 ***0.025 ***
(0.007)(0.006)(0.006)(0.005)(0.005)
Pop −0.005−0.043 **
(0.023)(0.021)
lnRGDP −0.004−0.015 ***
(0.005)(0.005)
lnWage 0.0080.020 **
(0.006)(0.008)
UL −0.096 ***−0.102 ***
(0.016)(0.015)
IDI −0.014 ***−0.010 ***
(0.002)(0.002)
STR 0.002 ***0.000 **
(0.000)(0.000)
FDI −0.495 ***−0.473 ***
(0.072)(0.068)
ECS 0.422 ***0.402 ***
(0.008)(0.008)
ER −0.002 **−0.003 ***
(0.001)(0.001)
_cons0.325 ***0.327 ***0.326 ***0.245 *0.506 ***
(0.002)(0.001)(0.001)(0.129)(0.148)
City FeNoYesYesYesYes
Year FeNoNoYesNoYes
N45124512451245124512
r20.0410.7080.7640.8390.861
Notes: The values in parentheses are robust standard errors. ***, **, and * are 1%, 5%, and 10% significance levels, respectively.
Table 4. Additional robustness test.
PSM-DIDReplace MethodLag EffectChanging Sample Ranges
UCEEUCEEUCEEUCEEUCEE
DID0.025 ***0.026 ***0.036 ***0.024 ***0.027 ***
(0.006)(0.005)(0.009)(0.005)(0.005)
ControlsYesYesYesYesYes
City FeYesYesYesYesYes
Year FeYesYesYesYesYes
_cons0.333 **0.720 ***0.687 **0.2480.506 ***
(0.152)(0.155)(0.329)(0.156)(0.148)
N45124512423033844448
r20.8610.8890.3380.8990.861
Notes: The values in parentheses are robust standard errors. ***, ** are 1%, 5% significance levels, respectively.
Table 5. Eliminating the influence of other relevant policies.
Benchmark RegressionExcluding Carbon Emission Trading PoliciesExcluding Low-Carbon City Pilot PoliciesExcluding the Two Policies
UCEEUCEEUCEEUCEE
DID0.025 ***0.024 ***0.024 ***0.023 ***
(0.005)(0.005)(0.005)(0.005)
DID1 −0.012 *** −0.022 ***
(0.005) (0.005)
DID2 0.011 ***0.016 ***
(0.003)(0.003)
ControlsYesYesYesYes
City FeYesYesYesYes
Year FeYesYesYesYes
_cons0.506 ***0.477 ***0.503 ***0.447 ***
(0.148)(0.148)(0.148)(0.148)
N4512451245124512
r20.8610.8610.8610.862
Notes: The values in parentheses are robust standard errors. *** is 1% significance level.
Table 6. Mechanism regression.
Industrial StructureAgglomeration EffectsInnovation Ability
IAVIEPEAIAGITIDI
DID0.068 ***0.207 ***0.107 ***0.029 **0.115 ***1.125 ***0.390 ***
(0.003)(0.012)(0.009)(0.011)(0.006)(0.071)(0.021)
ControlsYesYesYesYesYesYesYes
City FeYesYesYesYesYesYesYes
Year FeYesYesYesYesYesYesYes
_cons0.029−1.032 ***−7.067 ***−2.087 ***0.405 **5.607 **1.627 **
(0.093)(0.376)(0.279)(0.351)(0.191)(2.241)(0.689)
N4230418945124512451245064209
r20.9330.8680.9960.9940.7090.7300.783
Notes: The values in parentheses are robust standard errors. ***, ** are 1%, 5% significance levels, respectively.
Table 7. Heterogeneity analysis based on city location.
(1)(2)(3)
Eastern RegionCentral RegionWestern Region
DID0.058 ***0.031 ***0.098 ***0.018 *0.063 ***0.016
(0.008)(0.007)(0.014)(0.011)(0.017)(0.012)
ControlsNoYesNoYesNoYes
Year FeYesYesYesYesYesYes
City FeYesYesYesYesYesYes
_cons0.373 ***0.750 **0.313 ***0.685 ***0.289 ***1.287 ***
(0.002)(0.379)(0.001)(0.213)(0.002)(0.246)
N160016001584158413281328
r20.7630.8440.6990.8450.7630.879
Notes: The values in parentheses are robust standard errors. ***, **, and * are 1%, 5%, and 10% significance levels, respectively.
Table 8. Heterogeneity analysis based on urban resource dependence.
(1)(2)
Resource-Based CitiesNon-Resource-Based Cities
DID0.012−0.0020.077 ***0.033 ***
(0.022)(0.015)(0.006)(0.005)
ControlsNoYesNoYes
Year FeYesYesYesYes
City FeYesYesYesYes
_cons0.300 ***0.622 ***0.344 ***0.754 ***
(0.001)(0.194)(0.001)(0.221)
N1792179227202720
r20.7250.8710.7690.857
Notes: The values in parentheses are robust standard errors. *** is 1% significance level.
Disclaimer/Publisher’s Note: The statements, opinions and data contained in all publications are solely those of the individual author(s) and contributor(s) and not of MDPI and/or the editor(s). MDPI and/or the editor(s) disclaim responsibility for any injury to people or property resulting from any ideas, methods, instructions or products referred to in the content.

