The Impact of Vertical Fiscal Imbalances and Local Government Tax Efforts on the Quality of Economic Development—A Study Based on Threshold Regression and Simultaneous Equation Models


Abstract
:1. Introduction
2. Literature Review
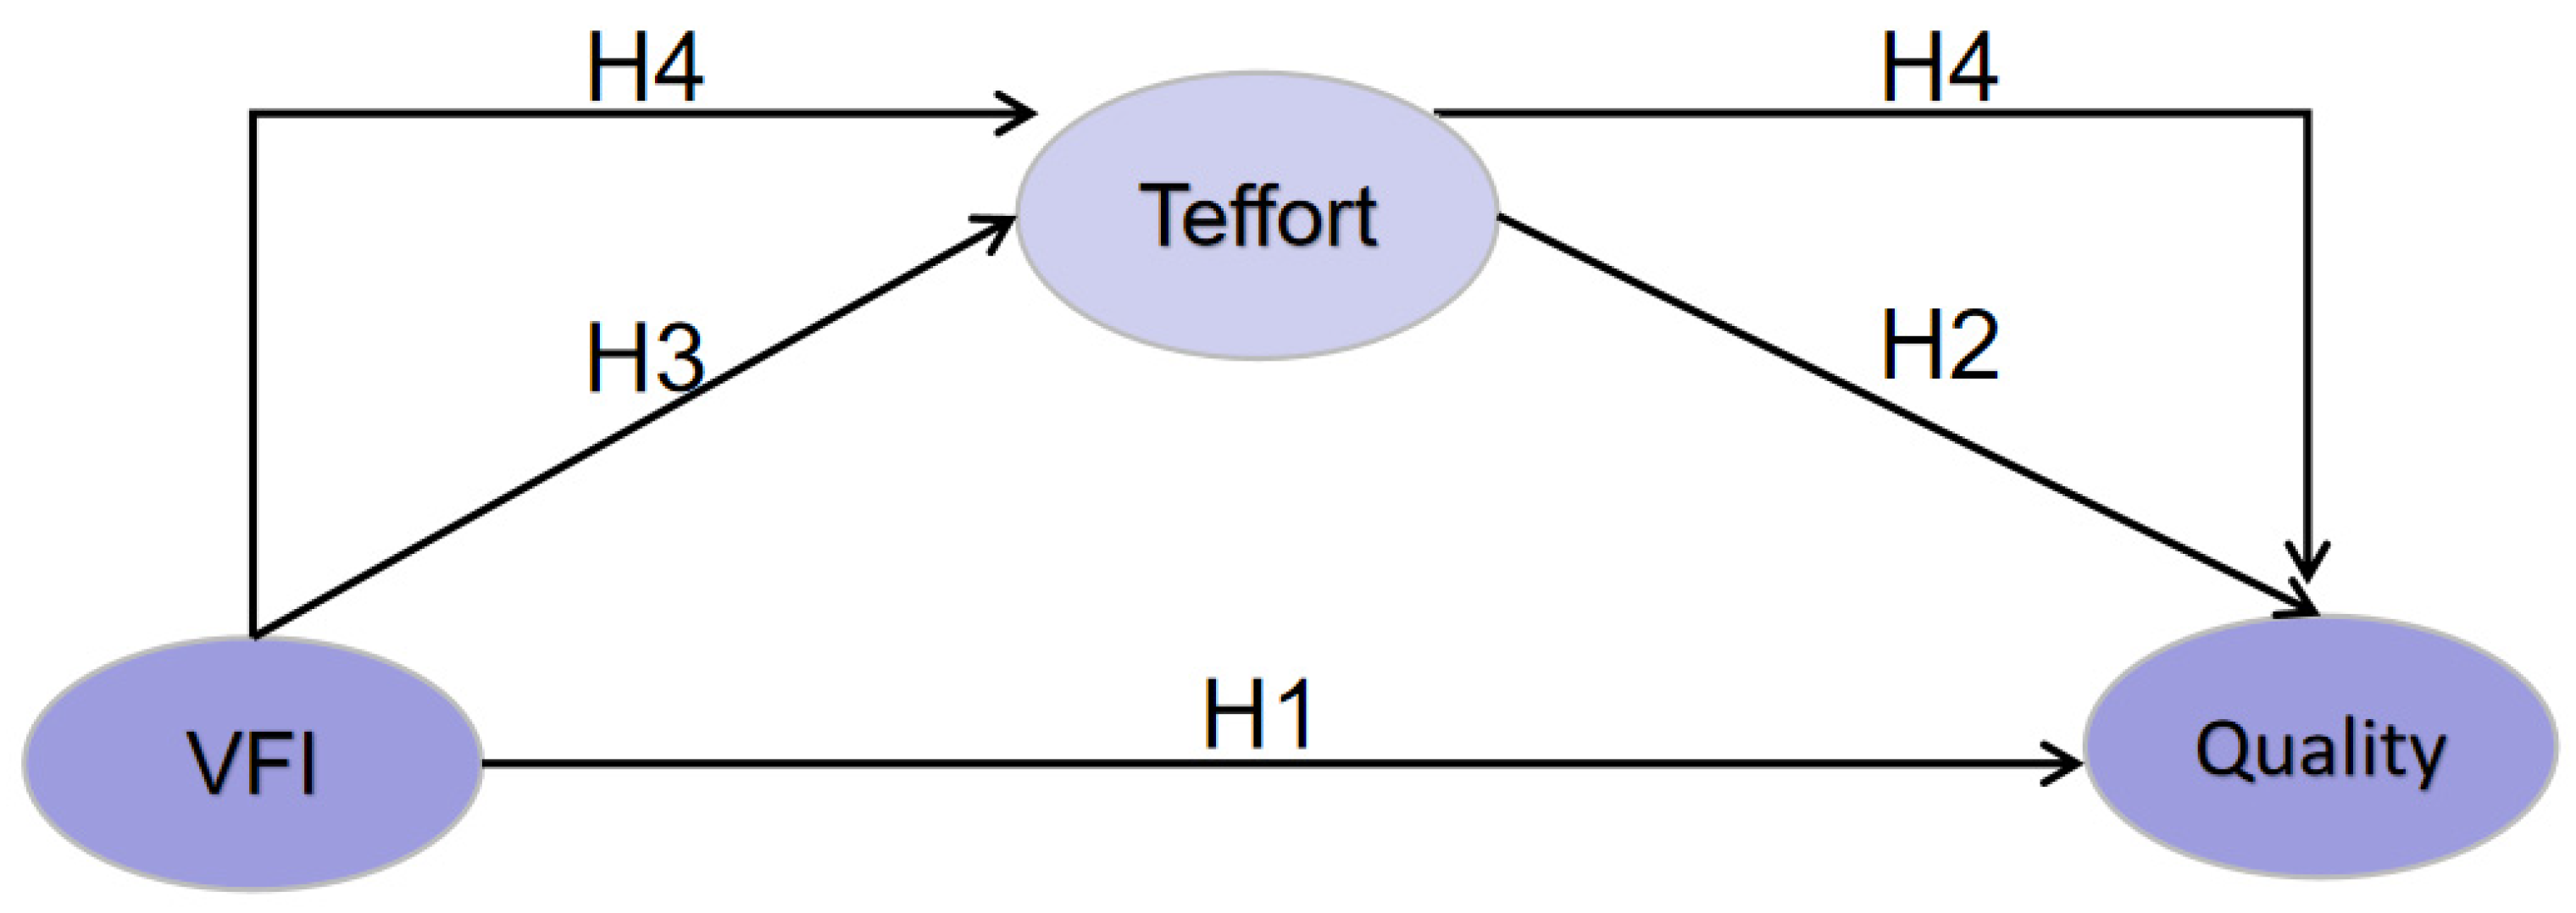
3. Research Hypotheses Development
4. Data and Methods
4.1. Variables
4.2. Data Sources
4.3. Threshold Effects Model
4.4. System of Simultaneous Equations
4.5. Stability Test
5. Results and Discussion
5.1. Descriptive Statistics
5.2. Panel Unit Root Test
5.3. Panel Threshold Model Test
5.4. Analysis of Empirical Results
5.5. Robustness Test Results
5.6. Standardized Regression Results
6. Conclusions
Author Contributions
Funding
Institutional Review Board Statement
Informed Consent Statement
Data Availability Statement
Acknowledgments
Conflicts of Interest
References
- Wei, M.; Li, S.H. A Study on Measuring the Level of High-Quality Development of China’s Economy in the New Era. J. Quant. Tech. Econ. 2018, 35, 3–20. [Google Scholar]
- Ren, B.P. Research on China’s High-Quality Economic Development. J. Shanxi Norm. Univ. (Philos. Soc. Sci.) 2018, 47, 104. [Google Scholar]
- Wang, L.P.; Liu, Y.; Wu, W.T. Impact of Fiscal System Imbalances on High-Quality Economic Development. J. Ind. Technol. Econ. 2020, 7, 22–30. [Google Scholar]
- Feng, T.; Liu, M.; Li, C. How Do Vertical Fiscal Imbalances Affect Energy Efficiency? The Role of Government Spending on Science and Technology. Environ. Sci. Pollut. Res. 2023, 30, 42327–42338. [Google Scholar] [CrossRef] [PubMed]
- Zhou, C.; Li, X.; Lin, X.; Cheng, M. Influencing Factors of the High-Quality Economic Development in China Based on the LASSO Model. Energy Rep. 2022, 8, 1055–1065. [Google Scholar] [CrossRef]
- Liu, L.; Zhang, W. Vertical Fiscal Imbalance and Government Spending on Science and Technology in China. Econ. Change Restruct. 2022, 55, 1953–1971. [Google Scholar] [CrossRef]
- Eyraud, L.; Lusinyan, L. Vertical Fiscal Imbalances and Fiscal Performance in Advanced Economies. J. Monet. Econ. 2013, 60, 571–587. [Google Scholar] [CrossRef]
- Ren, B.P. From the Miracle of China’s Economic Growth to High-quality Economic Development. China Rev. Political Econ. 2022, 13, 3–34. [Google Scholar]
- Xie, Z.F.; Fan, Z.Y. Chinese-Style Tax System, Centralization of Centralized Tax Administration and Tax Competition. Econ. Res. J. 2015, 50, 92–106. [Google Scholar]
- Zodrow, G.R.; Mieszkowski, P. Pigou, Tiebout, Property Taxation, and the under Provision of Local Public Goods. J. Urban Econ. 1986, 19, 356–370. [Google Scholar] [CrossRef]
- Chen, L.M.; Huo, C.J. The Measurement and Influencing Factors of High-Quality Economic Development in China. Sustainability 2022, 14, 9293. [Google Scholar] [CrossRef]
- Mao, J.H.; Wang, Z.Y.; Ma, T.Y. Dynamic Evolution of High-Quality Economic Development Levels: Regional Differences and Distribution in West China. Sustainability 2023, 12, 1975. [Google Scholar] [CrossRef]
- Xiao, W.S.; Kong, H.J.; Shi, L.F.; Boamah, V.; Tang, D.C. The Impact of Innovation-Driven Strategy on High-Quality Economic Development: Evidence from China. Sustainability 2022, 14, 4212. [Google Scholar] [CrossRef]
- Li, S.D.; You, S.B.; Liu, D.C.X.; Wang, Y.K. National Quality and Sustainable Development: An Empirical Analysis Based on China’s Provincial Panel Data. Sustainability 2023, 15, 4879. [Google Scholar] [CrossRef]
- Hettich, W.; Winer, S. Vertical Imbalance in the Fiscal Systems of Federal States. Can. J. Econ. 1986, 19, 746–765. [Google Scholar] [CrossRef]
- Hunter, J.S. Federalism and Fiscal Balance; National University Press: Singapore, 1977; Volume 3. [Google Scholar]
- Li, Y.Y.; Zhang, F. Mechanisms and Incentive Effects in the Formation of Vertical Fiscal Imbalances. J. Manag. World 2019, 35, 43–59. [Google Scholar]
- Cai, Q.F.; Chen, Y.H. Fiscal Vertical Imbalances, Local Incentive Alienation and Business Investment. J. Manag. World 2023, 39, 25–40. [Google Scholar]
- Chu, D.Y.; Shao, J. Vertical Fiscal Imbalances, Public Expenditure Structure and Economic Growth. Econ. Theory Bus. Manag. 2018, 10, 30–43. [Google Scholar]
- Chu, D.Y.; Shao, J.; Chi, S.X. Do Fiscal System Imbalances Discourage Local Government Tax Efforts? Econ. Res. J. 2019, 54, 41–56. [Google Scholar]
- Persson, T.; Tabellini, G. Federal Fiscal Constitutions: Risk Sharing and Redistribution. J. Political Econ. 1996, 104, 979–1009. [Google Scholar] [CrossRef]
- De Mello, L.R. Fiscal Decentralization and Intergovernmental Fiscal Relations: A Cross-Country Analysis. World Dev. 2000, 28, 365–380. [Google Scholar] [CrossRef]
- Faguet, J.P. Does Decentralization Increase Government Responsiveness to Local Needs? Evidence from Bolivia. J. Public Econ. 2004, 88, 867–893. [Google Scholar] [CrossRef]
- Lin, C.; Sun, Y.J. Vertical Fiscal Imbalances, Local Government Behaviour and Economic Volatility. Economist 2019, 9, 44–53. [Google Scholar]
- Bao, Q.; Tang, S.; Liu, B. Local Competition, Homogeneity of Leading Industries and Domestic Overcapacity. J. World Econ. 2017, 40, 144–169. [Google Scholar]
- Sun, Z.; Chen, X.D.; Su, X.Y. Local Competition, Overcapacity and Fiscal Sustainability. Ind. Econ. Res. 2019, 1, 75–86. [Google Scholar]
- Chu, D.Y.; Fei, M.S. Vertical Fiscal Imbalances, Tax Effort and Local Economic Growth. Contemp. Finance Econ. 2021, 10, 30–42. [Google Scholar]
- Song, M.Z.; Ye, C.; Chen, J.; Liu, X.Q. Impact of Vertical Fiscal Imbalances on High-Quality Economic Development. J. Hunan Univ. Financ. Econ. 2021, 37, 47–54. [Google Scholar]
- Wei, D.M.; Gu, N.H.; Wei, J.H. Vertical Fiscal Imbalances, Public Expenditure Bias and High-Quality Economic Development. Econ. Rev. 2021, 2, 23–43. [Google Scholar]
- Chu, D.Y.; Fei, M.S.; Huang, X. Local Government Competition, Tax Efforts and High-Quality Economic Development. Public Finance Res. 2020, 8, 55–69. [Google Scholar]
- Shangguan, X.M.; Ge, B.H. Local Government Tax Competition, Environmental Governance and Haze Pollution. Contemp. Finance Econ. 2019, 5, 27–36. [Google Scholar]
- Shen, K.R.; Fu, W.L. Tax Competition, Region Game and Their Efficiency of Growth. Econ. Res. J. 2006, 6, 16–26. [Google Scholar]
- Lv, B.Y.; Guo, Q.W. Sources of High Tax Growth in China: Explanations in the Framework of Tax Capacity and Tax Effort. Soc. Sci. China 2011, 2, 76–90+221+222. [Google Scholar]
- Fu, W.L.; Shen, K.R. Equalization Transfers and Local Fiscal Expenditure Structure. Econ. Res. J. 2012, 47, 45–57. [Google Scholar]
- Jia, J.X.; Ying, S.W. Fiscal Decentralization and Corporate Tax Incentives—An Analysis Based on the Competitive Perspective of Local Governments. China Ind. Econ. 2016, 10, 23–39. [Google Scholar]
- Li, X.W.; Yang, X.B.; Liang, X.D. Vertical Fiscal Imbalances, Revenue and Expenditure Preferences, and Local Government Public Service Provision. Jiang Han Trib. 2021, 12, 5–14. [Google Scholar]
- Fisher, R.C. Income and Grant Effects on Local Expenditure: The Flypaper Effect and Other Difficulties. J. Urban Econ. 1982, 12, 324–345. [Google Scholar] [CrossRef]
- Rodden, J. The Dilemma of Fiscal Federalism: Grants and Fiscal Performance around the World. Am. J. Political Sci. 2002, 46, 670–688. [Google Scholar] [CrossRef]
- Oates, W.E. Fiscal Decentralization and Economic Development. Natl. Tax J. 1993, 46, 237–243. [Google Scholar] [CrossRef]
- Bird, R.M.; Tarasov, A.V. Closing the Gap: Fiscal Imbalances and Intergovernmental Transfers in Developed Federations. Environ. Plan. C Gov. Policy 2004, 22, 77–102. [Google Scholar] [CrossRef]
- Turati, G.; Boetti, L.; Piacenza, M. Decentralization and Local Governments’ Performance: How Does Fiscal Autonomy Affect Spending Efficiency? FinanzArchiv 2012, 68, 269–302. [Google Scholar]
- Bruce, E.H. Sample Splitting and Threshold Estimation. Econometrica 2000, 68, 575–603. [Google Scholar]
- Zhang, M.; Ma, W.L. Will Finance Vertical Imbalance Drive High-Quality Economic Development? Contemp. Finance Econ. 2022, 11, 37–39. [Google Scholar]
- Levin, A.; Lin, C.F.; Chu, C.J. Unit Root Tests in Panel Data: Asymptotic and Finite-Sample Properties. J. Econom. 2002, 108, 1–24. [Google Scholar] [CrossRef]
- Baretti, C.; Huber, B.; Lichtblau, K. A Tax on Tax Revenue: The Incentive Effects of Equalizing Transfers: Evidence from Germany. Int. Tax Public Finance 2002, 9, 631–649. [Google Scholar] [CrossRef]


| Variable | Definition | Calculation |
|---|---|---|
| Quality | Economic growth is not just about pursuing quantitative expansion but also about quality, efficiency and overall sustainability | Calculated by principal component analysis of five indicators: innovation, coordination, green, openness and sharing |
| Teffort | Actual level of collection of local government tax revenues | Ratio of actual to potential tax revenues |
| VFI | Misalignment of fiscal revenues and expenditures between the center and localities | Refer to Table 2 |
| Open | Openness of regions to the external economy | Total exports and imports as a share of GDP |
| Ind | Share of different industries in the economy of each region | Share of tertiary sector output in GDP |
| Compete | Horizontal competition among local governments to generate higher economic performance and achieve greater promotion benefits | Competitiveness of neighboring provinces in terms of GDP per capita |
| Transfer | Non-reimbursable financial assistance provided by local governments to individuals, families, businesses or other organizations | General transfers as a percentage of total gross transfers |
| Urban | Population migration from rural to urban areas | Proportion of urban population in the resident population at the end of the year |
| Density | Population per unit area | The ratio of total population to land area at the end of the year |
| Ptax | The average tax burden is borne by each person in the region | Natural logarithm of the proportion of tax revenues to population size |
| Pgdp | Economic value created by each person in the area | Natural logarithm of the ratio of GDP to population size |
| Index Name | Measure Formula |
|---|---|
| VFI | |
| FDR | |
| FDS | |
| FSS | |
| Variable Definitions | |
| FDR: Decentralization of Fiscal Revenue FDS: Decentralization of Fiscal Spending FSS: Local Financial Self-sufficiency Rate of Gap LPR: Local Public Revenue LPS: Local Public Spending CPR: Central Public Revenue CPS: Central Public Spending LPOP: Local Population NPOP: National Population | |
| Variables | Observation (N × T) | Standard Error | Minimum | Maximum | Average |
|---|---|---|---|---|---|
| Quality | 30 × 15 | 1.2424 | −1.7500 | 7.5800 | 0.0000 |
| Teffort | 30 × 15 | 0.0878 | 0.7678 | 1.3027 | 1.0021 |
| VFI | 30 × 15 | 0.1909 | 0.1490 | 0.9383 | 0.6855 |
| Open | 30 × 15 | 0.3263 | 0.0076 | 1.6701 | 0.2929 |
| Ind | 30 × 15 | 0.0932 | 0.2979 | 0.8373 | 0.4764 |
| Compete | 30 × 15 | 2.8549 | 0.4697 | 17.1979 | 3.6960 |
| Transfer | 30 × 15 | 0.1691 | 0.0319 | 0.7528 | 0.4810 |
| Urban | 30 × 15 | 0.1343 | 0.2824 | 0.8960 | 0.5696 |
| Density | 30 × 15 | 1.2838 | 2.0337 | 8.2753 | 5.4537 |
| Ptax | 30 × 15 | 0.8144 | 6.3235 | 10.4425 | 8.2508 |
| Pgdp | 30 × 15 | 0.5761 | 2.0592 | 5.2338 | 3.7117 |
| Variables | LLC | Fisher-ADF | Conclusion | |||
|---|---|---|---|---|---|---|
| P | Z | L* | Pm | |||
| Quality | −1.4 × 10¹³ *** (0.0000) | 90.8665 *** (0.0062) | −1.8364 ** (0.0332) | −1.9276 ** (0.0279) | 2.8177 *** (0.0024) | I(0) |
| VFI | −1.5 × 10¹³ *** (0.0000) | 133.9130 *** (0.0000) | −6.2351 *** (0.0000) | −6.1312 *** (0.0000) | 6.7473 *** (0.0000) | I(0) |
| Ind | −2.5 × 10¹³ *** (0.0000) | 141.2966 *** (0.0000) | −5.7091 *** (0.0000) | −5.9491 *** (0.0000) | 7.4213 *** (0.0000) | I(0) |
| Transfer | −2.9 × 10¹⁴ *** (0.0000) | 90.3639 *** (0.0068) | −1.7811 ** (0.0374) | −1.6725 ** (0.0482) | 2.7718 *** (0.0028) | I(0) |
| Open | −1.5 × 10¹³ *** (0.0000) | 162.4680 *** (0.0000) | −7.4742 *** (0.0000) | −7.6513 *** (0.0000) | 9.3540 *** (0.0000) | I(0) |
| −1.7 × 10¹³ *** (0.0000) | 183.1957 *** (0.0000) | −8.6709 *** (0.0000) | −8.9606 *** (0.0000) | 11.2462 *** (0.0000) | I(0) | |
| −8.1 × 10¹² *** (0.0000) | 236.4852 *** (0.0000) | −9.0932 *** (0.0000) | −11.1187 *** (0.0000) | 16.1108 *** (0.0000) | I(0) | |
| Compete | −4.9 × 10¹³ *** (0.0000) | 355.7075 *** (0.0000) | −14.3859 *** (0.0000) | −17.9064 *** (0.0000) | 26.9943 *** (0.0000) | I(0) |
| Teffort | −1.1 × 10¹⁴ *** (0.0000) | 144.2382 *** (0.0000) | −6.6799 *** (0.0000) | −6.6238 *** (0.0000) | 7.6899 *** (0.0000) | I(0) |
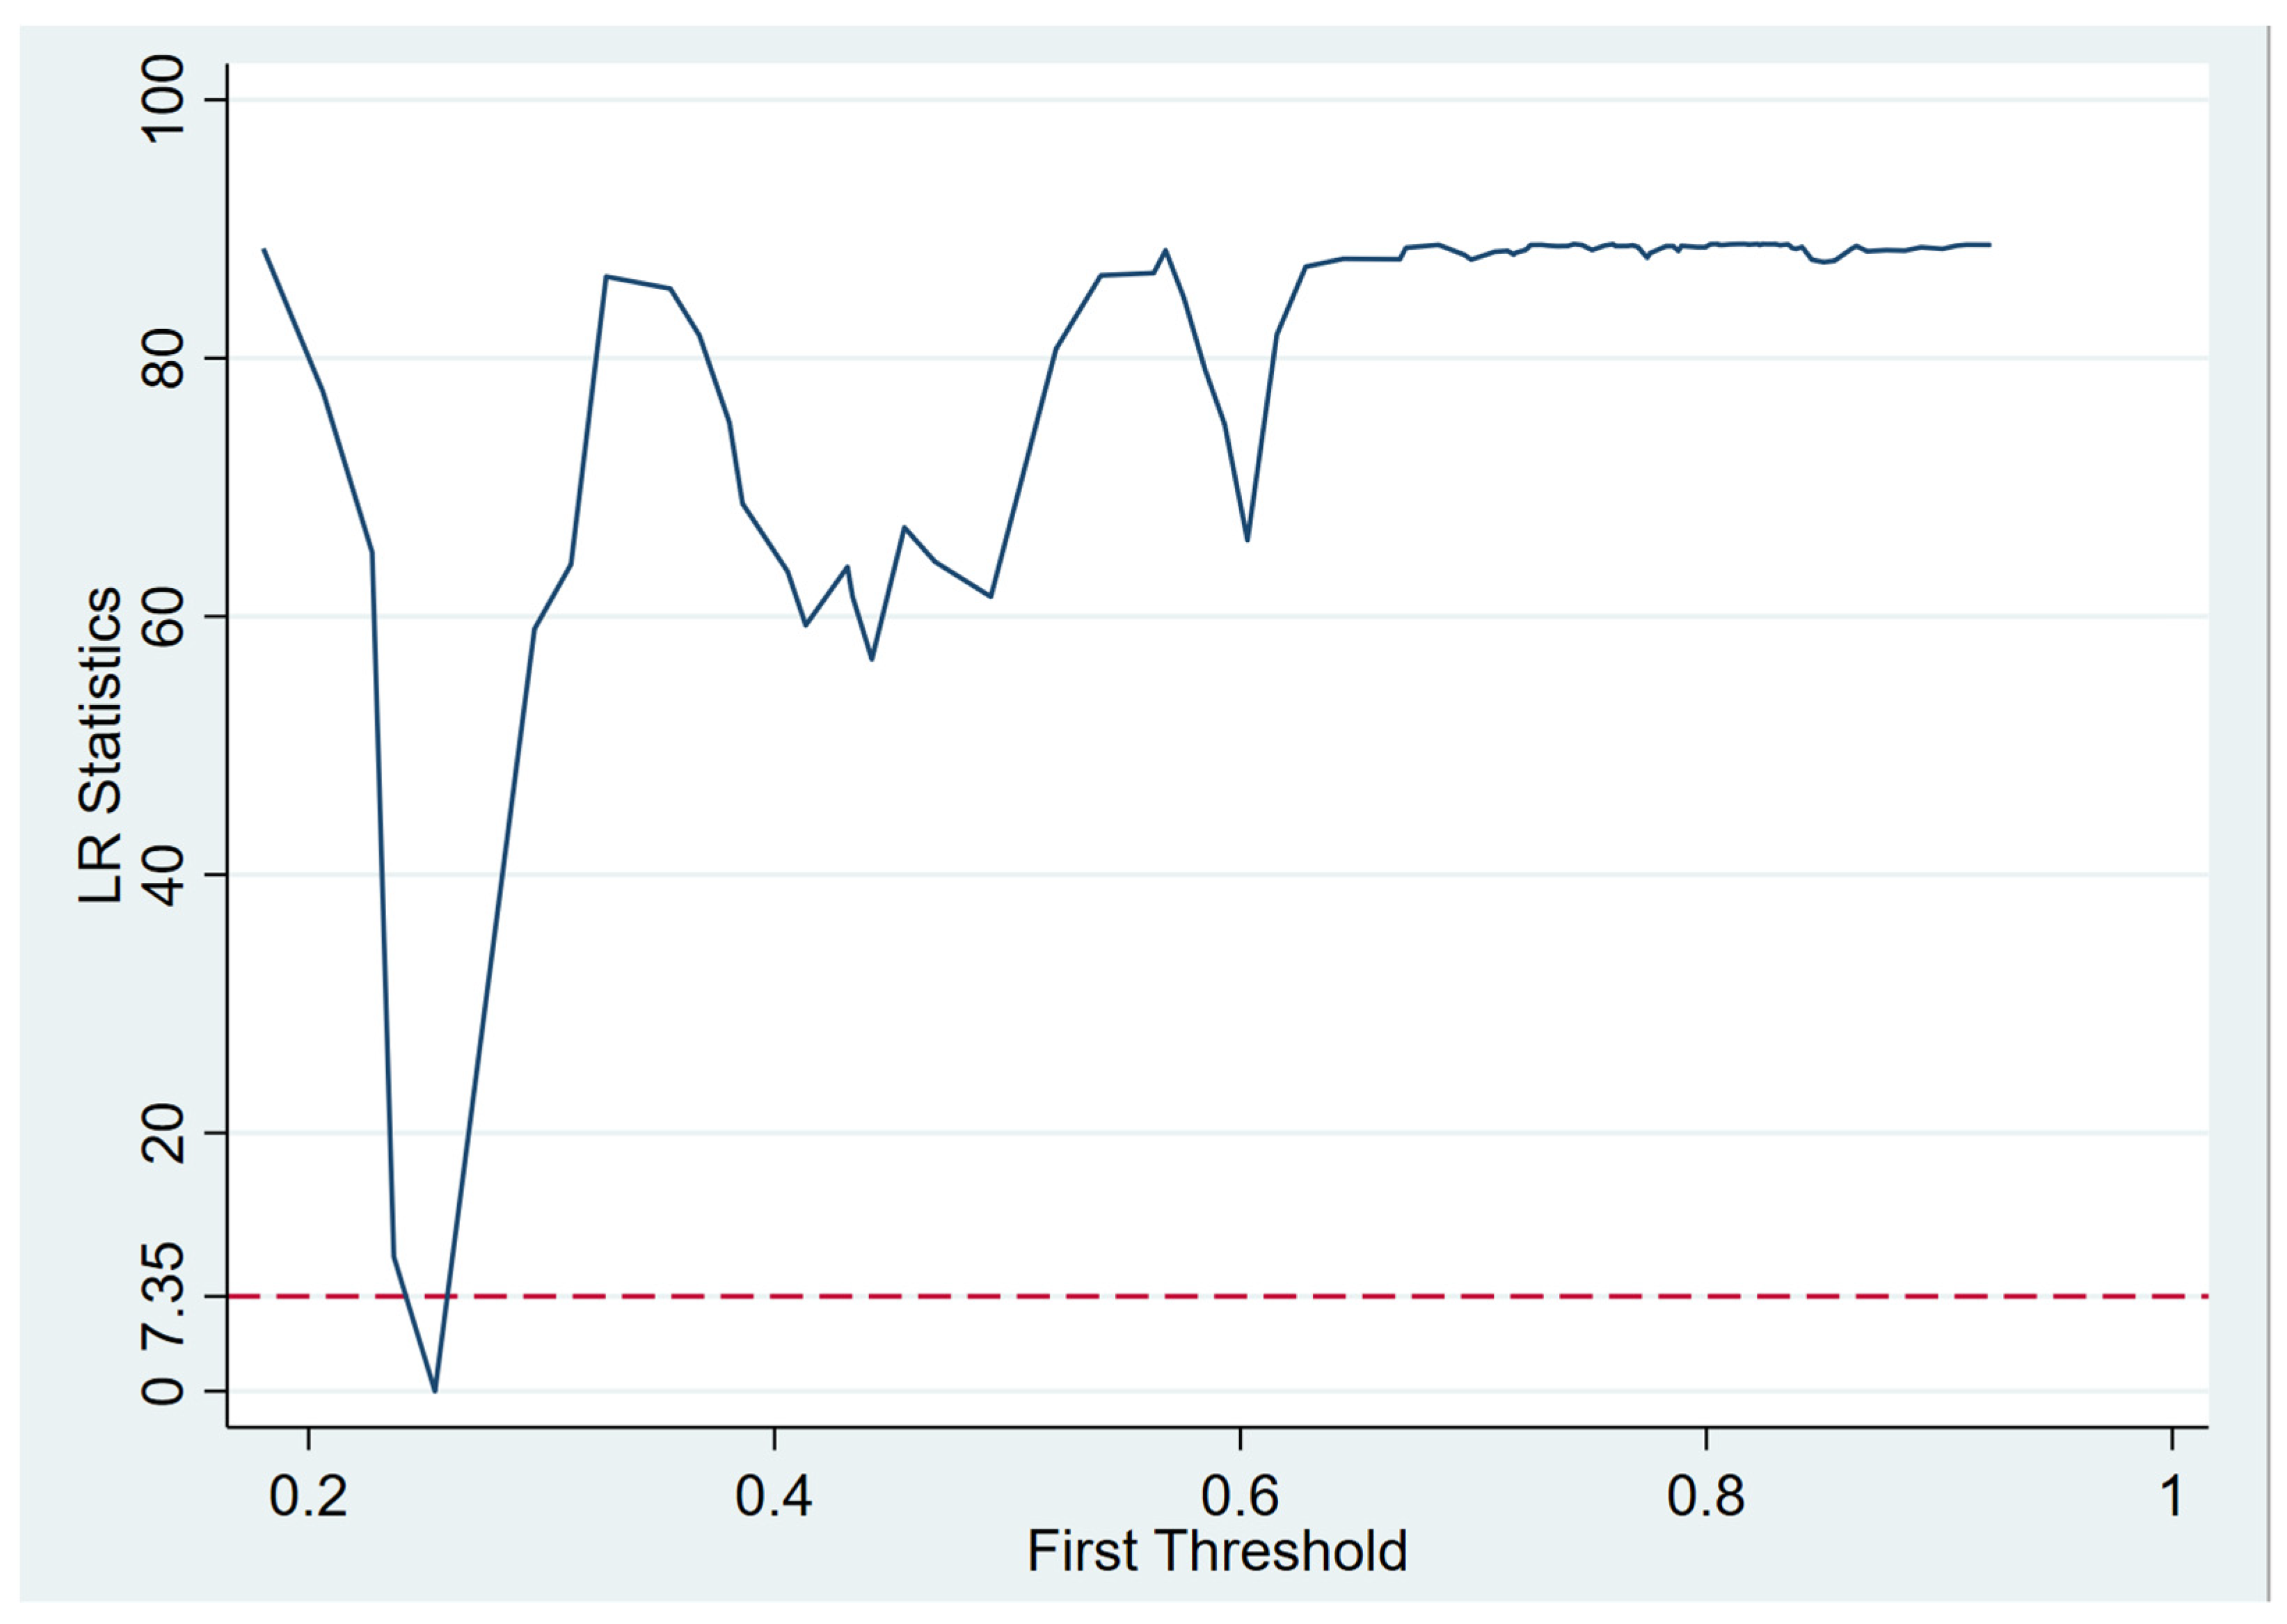
| Threshold Types | RSS | F-Statistics | p-Value | Test Results |
|---|---|---|---|---|
| Single threshold (: no threshold) | 31.8802 | 96.01 | 0.0000 *** | Rejection |
| Double threshold (: single threshold) | 22.6314 | 20.54 | 0.3333 | Acceptance |
| Explanatory Variable | Explained Variable: Quality | |
|---|---|---|
| Zone 1 (VFI ≤ 0.2542) | Teffort | −1.1396 *** (0.2296) |
| Zone 2 (VFI > 0.2542) | −0.0172 (0.1738) | |
| VFI | −5.6499 *** (1.4069) | |
| Compete | −0.0541 *** (0.0113) | |
| Ind | 5.2583 *** (0.4844) | |
| Transfer | 3.0131 *** (0.1732) | |
| FSS | −5.8320 *** (1.2151) | |
| Density | 1.3666 *** (0.3658) | |
| _cons | −4.3480 (2.7226) | |
| N | 450 | |
| R-square | 0.9188 | |
| Dependent Variables | Two-Stage Least Squares | Three-Stage Least Squares | Three-Stage Least Squares ~r | |||
|---|---|---|---|---|---|---|
| Quality | Teffort | Quality | Teffort | Quality | Teffort | |
| Teffort | −0.487 *** (−2.59) | −0.500 *** (−2.81) | −0.509 *** (−2.86) | |||
| VFI | −1.253 ** (−2.38) | −0.299 *** (−3.23) | −1.205 ** (−2.42) | −0.305 *** (−3.51) | −1.167 ** (−2.34) | −0.310 *** (−3.56) |
| Open | −1.599 *** (−10.64) | −1.538 *** | (−10.85) | −1.492 *** (−10.53) | ||
| Ind | 0.123 (0.20) | 0.192 (0.33) | 0.241 (0.42) | |||
| Compete | 0.0049 ** (2.26) | 0.0050 ** (2.42) | 0.0050 ** (2.44) | |||
| Transfer | −0.101 *** (−3.01) | −0.120 *** (−3.83) | −0.134 *** (−4.29) | |||
| Urban | 0.857 *** (6.49) | 0.879 *** (7.09) | 0.896 *** (7.24) | |||
| Density | −0.730 *** (−12.13) | −0.716 *** (−12.65) | −0.706 *** (−12.50) | |||
| Ptax | 0.850 *** (29.20) | 0.844 *** (30.83) | 0.840 *** (30.65) | |||
| Pgdp | −1.459 *** (−32.52) | −1.460 *** (−34.57) | −1.460 *** (−34.53) | |||
| Constant | 5.225 *** (9.78) | 3.833 *** (9.02) | 5.103 *** (10.12) | 3.773 *** (9.45) | 5.013 *** (9.95) | 3.734 *** (9.37) |
| Region | Y | Y | Y | Y | Y | Y |
| Time | Y | Y | Y | Y | Y | Y |
| R-square | 0.9589 | 0.8005 | 0.9588 | 0.8002 | 0.9588 | 0.7997 |
| Dependent Variables | Two-Stage Least Squares | Three-Stage Least Squares | Three-Stage Least Squares ~r | |||
|---|---|---|---|---|---|---|
| Quality | Teffort | Quality | Teffort | Quality | Teffort | |
| Teffort | −0.417 *** (−2.31) | −0.432 *** (−2.53) | −0.443 *** (−2.59) | |||
| VFI | −0.989 ** (−2.00) | −0.221 *** (−2.65) | −0.961 ** (−2.05) | −0.227 *** (−2.90) | −0.939 ** (−2.00) | −0.232 *** (−2.95) |
| Open | −1.540 *** (−10.71) | −1.486 *** (−10.95) | −1.445 *** (−10.66) | |||
| Ind | 0.054 (0.09) | 0.118 (0.20) | 0.164 (0.28) | |||
| Compete | 0.0049 ** (2.24) | 0.0050 ** (2.40) | 0.0050 ** (2.41) | |||
| Transfer | −0.102 *** (−3.05) | −0.122 *** (−3.85) | −0.135 *** (−4.30) | |||
| Urban | 0.887 *** (6.73) | 0.909 *** (7.34) | 0.927 *** (7.50) | |||
| Density | −0.744 *** (−12.38) | −0.731 *** (−12.94) | −0.722 *** (−12.80) | |||
| Ptax | 0.869 *** (31.82) | 0.863 *** (33.60) | 0.859 *** (33.41) | |||
| Pgdp | −1.466 *** (−32.67) | −1.468 *** (−34.75) | −1.469 *** (−34.73) | |||
| Constant | 4.927 *** (9.82) | 3.721 *** (8.81) | 4.829 *** (10.19) | 3.667 *** (9.24) | 4.755 *** (10.05) | 3.632 *** (9.17) |
| Region | Y | Y | Y | Y | Y | Y |
| Time | Y | Y | Y | Y | Y | Y |
| R-square | 0.9588 | 0.7989 | 0.9588 | 0.7986 | 0.9587 | 0.7980 |
| Dependent Variables | Two-Stage Least Squares | Three-Stage Least Squares | Three-Stage Least Squares ~r | |||
|---|---|---|---|---|---|---|
| Quality | Teffort | Quality | Teffort | Quality | Teffort | |
| Teffort | −0.487 *** (−2.59) | −0.500 *** (−2.81) | −0.509 *** (−2.86) | |||
| VFI | −0.239 ** (−2.38) | −0.0570 *** (−3.23) | −0.230 ** (−2.42) | −0.0583 *** (−3.51) | −0.223 ** (−2.34) | −0.0591 *** (−3.56) |
| Open | −0.522 *** (−10.64) | −0.502 *** (−10.85) | −0.487 *** (−10.53) | |||
| Ind | 0.0114 (0.20) | 0.0179 (0.33) | 0.0225 (0.42) | |||
| Compete | 0.0141 ** (2.26) | 0.0142 ** (2.42) | 0.0142 ** (2.44) | |||
| Transfer | −0.0170 *** (−3.01) | −0.0204 *** (−3.83) | −0.0227 *** (−4.29) | |||
| Urban | 0.115 *** (6.49) | 0.118 *** (7.09) | 0.120 *** (7.24) | |||
| Density | −0.937 *** (−12.13) | −0.919 *** (−12.65) | −0.907 *** (−12.50) | |||
| Ptax | 0.692 *** (29.20) | 0.687 *** (30.83) | 0.684 *** (30.65) | |||
| Pgdp | −0.840 *** (−32.52) | −0.841 *** (−34.57) | −0.841 *** (−34.53) | |||
| Constant | 3.956 *** (14.01) | 1.700 *** (15.81) | 3.919 *** (14.69) | 1.666 *** (16.47) | 3.891 *** (14.59) | 1.642 *** (16.26) |
| Region | Y | Y | Y | Y | Y | Y |
| Time | Y | Y | Y | Y | Y | Y |
| RR-square | 0.9589 | 0.8005 | 0.9588 | 0.8002 | 0.9588 | 0.7997 |
| Mechanisms | Paths and Transmission | Effect | Result | Total Effect |
|---|---|---|---|---|
| Direct Effect | VFI → Quality | −0.223 | −0.223 | |
| Direct Effect | Teffort → Quality | −0.509 | −0.509 | |
| Indirect Effect | VFI → Teffort | −0.0591 | 0.0301 | |
| VFI → Teffort → Quality | × | 0.0301 |
Disclaimer/Publisher’s Note: The statements, opinions and data contained in all publications are solely those of the individual author(s) and contributor(s) and not of MDPI and/or the editor(s). MDPI and/or the editor(s) disclaim responsibility for any injury to people or property resulting from any ideas, methods, instructions or products referred to in the content. |
© 2024 by the authors. Licensee MDPI, Basel, Switzerland. This article is an open access article distributed under the terms and conditions of the Creative Commons Attribution (CC BY) license (https://creativecommons.org/licenses/by/4.0/).
Share and Cite
Wang, K.; Liew, V.K.-S. The Impact of Vertical Fiscal Imbalances and Local Government Tax Efforts on the Quality of Economic Development—A Study Based on Threshold Regression and Simultaneous Equation Models. Sustainability 2024, 16, 3173. https://doi.org/10.3390/su16083173
Wang K, Liew VK-S. The Impact of Vertical Fiscal Imbalances and Local Government Tax Efforts on the Quality of Economic Development—A Study Based on Threshold Regression and Simultaneous Equation Models. Sustainability. 2024; 16(8):3173. https://doi.org/10.3390/su16083173
Chicago/Turabian StyleWang, Ke, and Venus Khim-Sen Liew. 2024. "The Impact of Vertical Fiscal Imbalances and Local Government Tax Efforts on the Quality of Economic Development—A Study Based on Threshold Regression and Simultaneous Equation Models" Sustainability 16, no. 8: 3173. https://doi.org/10.3390/su16083173