Article

Promoting (Safe) Young-User Cycling in Russian Cities: Relationships among Riders’ Features, Cycling Behaviors and Safety-Related Incidents

1
INTRAS (Research Institute on Traffic and Road Safety), University of Valencia, 46022 Valencia, Spain
2
Naberezhnye Chelny Institute, Kazan Federal University, Kazan 420008, Russia
3
Department of Transport Sysytems Service, Kazan Federal University, Kazan 420008, Russia
*
Author to whom correspondence should be addressed.
Sustainability 2024, 16(8), 3193; https://doi.org/10.3390/su16083193
Submission received: 3 January 2024 / Revised: 3 April 2024 / Accepted: 5 April 2024 / Published: 11 April 2024

Abstract

:
Background: Promoting cycling, walking and other ‘active’ transportation means continues to be a shared guideline in urban planning, closely aligned with the Sustainable Development Goals of the United Nations. Nonetheless, young cyclists’ safety figures and their potential contributors, including behavioral issues, remain an ongoing concern for researchers, practitioners, and policymakers. Aim: This study aimed to analyze both risky and protective riding patterns of young Russian cyclists in relation to cycling safety factors using the Cycling Behavior Questionnaire (CBQ). Methods: This study used the data provided by 374 young Russian cyclists, aged M = 21.6 (SD = 4.8) years, who responded to an electronic survey on cycling behavior and safety outcomes. Results: Beyond demographic characteristics, the key road rule knowledge and risk perception of young cyclists were significantly associated with their self-reported cycling behaviors. Although both traffic violations and riding errors were negatively correlated with safety incidents, predictive analyses show that errors (though not violations) play a predictive role in young cyclists’ safety-related incidents. Conversely, positive cycling behaviors have been shown to be significant reducers of riding crash likelihood. Conclusion: The results of this study support the idea that addressing key issues such as risk perception, road rule knowledge and protective riding habits, while also targeting risky behaviors on the road, could enhance cycling safety outcomes. Additionally, these findings offer valuable insights into understanding the factors contributing to riding risks and crashes among young cyclists, particularly in the context of the increasing need to promote safer and more sustainable urban mobility in a country with a still young cycling culture.

1. Introduction

Even though current discussions about urban cycling point to the promotion of environmentally friendly transport means such as cycling and walking, the road safety figures of these ‘active’ users remain a huge public health issue, with a direct impact on the society and economy of countries [1]. Indeed, the latest data on bicycle users’ fatalities and injuries highlight the urgency of addressing the risks associated with active mobility alongside their related sustainability indicators [2,3,4]. Accordingly, cyclists, as vulnerable road users, face particular challenges that require special attention, especially in counties with a limited ‘cycling tradition’ in urban settings or a discrete number of previous actions aimed at fostering an inclusive road culture surrounding urban cycling [5].
Data from the European Road Safety Observatory, in its annual report for 2022 [6], show that the number of cyclists killed in European regions has remained stable over the last ten years, with figures of around 2000 people killed per year. These data contrast with other vulnerable users such as pedestrians or motorcyclists, where slight reductions in the number of fatalities have been observed in the last few years [7]. Moreover, during the last decade, the representation of cyclists among fatal victims of traffic crashes has grown from 6.7% in 2010 to 9.44% in 2021, suggesting that safety-related outcomes of cyclists need attention and a preventive evidence-based approach needs to be implemented [6]. The yearly percent and frequency of cyclist fatalities registered in Russia during the last decade are shown in Figure 1.
Therefore, the need for specific and effective policies and practices for the promotion of road safety, especially in this road group, is evident. In this regard, it is important to understand and address the factors that influence cycling behavior in each region, not only from a road safety perspective but also in the broader context of transport economics and urban infrastructure planning.

1.1. Young Cyclists as a Vulnerable Group

Cyclists are considered a particularly vulnerable road group as their safety on the road can be compromised due to various heterogeneous factors [8]. On the one hand, the very characteristics of their means of travel mean that cyclists do not have physical protection to protect them in the event of a collision, so they are more exposed to serious injuries [9]. This element can be aggravated if bicycle users do not use the necessary protective systems such as helmets or relevant equipment. In addition, cyclists may be less visible to drivers, especially in low light or adverse weather conditions [10].
Complementarily, in some areas, the road infrastructure does not favor the adequate circulation of this road group [11]. Many roads are designed primarily for motorized vehicles, which can leave cyclists with limited space that influences the risk of suffering an incident or road accident [12]. Road conditions such as potholes, unevenness and slippery surfaces also pose significant hazards to cyclists [13]. Other scenarios such as crossings or intersections may represent critical points where collisions between cyclists and motor vehicles are triggered [14]. Furthermore, the quality and design of cycling infrastructure directly influence cycling behavior. Design flaws, such as a lack of dedicated lanes, inadequate signage or poor maintenance, can lead to risky behaviors and rule violations [15]. In this sense, recent data from urban studies indicate that, in cities with well-designed cycling infrastructure, a decrease in both traffic accidents and costs associated with vehicular congestion is observed [16]. In addition to infrastructure, there are other factors such as a lack of adequate signage or weather conditions that affect road accidents among cyclists. Specifically, in Russia, there is usually extreme cold weather and situations with strong winds with rain, snow and ice that influence the use of bicycles as well as cycling behavior, requiring specific precautions to face the variety of weather conditions in the country.
On the other hand, the lack of awareness on the part of drivers, manifesting as aggressive, inattentive or unwise behavior towards cyclists, can generate conflictive situations on the road [17]. Additionally, cyclists can also commit infractions that increase the risk of being exposed to an incident on the road. In this sense, cyclist behavior in the urban and interurban environment is a multifaceted phenomenon involving complex interaction between various factors [18]. These behaviors may comprise errors and violations of traffic rules, but also positive and prevention behaviors that promote road safety and transport efficiency [19,20].
Additionally, young cyclists are often in a particularly vulnerable position in traffic due to several inter-related factors. One of these ‘key matters’ is risk perception, which tends to be consistently lower in this user group, if compared to their adult counterparts [21,22]. In this sense, they present a propensity to engage in risky behaviors, underestimating the typical threats associated with cycling in urban environments or very crowded roads. In addition, variables such as impulsivity and sensation seeking may be more pronounced in this demographic, increasing the likelihood of engaging in dangerous situations [23,24].
Other previous applied studies stress inexperience as another key issue for young riders’ safety. Having less time on the road, barely experienced cyclists may not have fully developed the ability to anticipate complex traffic situations or to react appropriately in unexpected circumstances [25]. Therefore, understanding the behaviors of young cyclists has been systematically underscored as something crucial for their safety. The mobility of this user group plays an increasingly important role in the urban transport landscape, with direct implications for transport economics and the quality of life of the overall set of road users [26,27]. In line with this, factors such as cyclists’ understanding of and compliance with traffic regulations, the culture and social acceptance of cycling as a means of transport and psychological and socioeconomic factors are related to certain behaviors of bicycle users.

1.2. Key Literature-Based Insights on Urban Cycling Safety

According to the accumulated literature, during the last two decades, cycling has gained ground in many countries as a consequence of infrastructural, political, and social actions, making it a suitable alternative for individuals [28]. In urban settings, different methodologies have been developed to assess bicycle usage, quality, and/or safety. A good example of this is the Bicycle Level of Service (BLOS), which assesses bicycle flows (bicycle dynamics, obstacles, interaction with other modes of transportation), available infrastructure (shared use standards, rule enforcement, pavement quality, trip destination) and external or exogenous factors (weather, topography, socio-demographic characteristics) [29] for the design and development of standards and protective measures. Among others, it is common to find overall recommendations such as wide bike lanes for the proper mobility of cyclists, protective infrastructure on highly congested roads heavily traveled by motor vehicles and user-related recommendations typically aimed at preventing risk-enhancing behaviors. These are important elements that impact cyclists’ perception of safety and consequently their behavior on the road. Various studies suggest that protected bike lanes increase users’ perceived safety, as they show less concern about hazards and tend to be more predisposed to use them [30,31].
At the safety level, one of the factors that significantly tends to impact cycling crash rates worldwide is the need to (often problematically) share space with motor vehicles, something that typically increases users’ (both cyclists and vehicle drivers) likelihood to perform risky behaviors which result in traffic incidents, which are aggravated by issues such as poor cycling culture, weather conditions and infrastructure design, among other factors, such as poor cyclists’ visibility [32]. Yan et al. (2018) [33] notes that angle collisions are the main pattern of crashes between motor vehicles and bicycles, although different irregular maneuvers can lead to specific crash patterns such as head-on or rear-end crashes. Meanwhile, Isaksson-Hellman and Werneke (2017) [34] estimate that around 78% of all crashes involving these modes of transportation occurred because a bicycle and an automobile crossed paths, and that in over 53% of these crashes, the cyclist crossed the roadway while following a bike lane; thus, specific measures are needed for reductions in this type of crash, such as reducing speed in high-cyclist-concentration areas, improving road lighting and installing medians between the roadway and the bike lane [35].
Additionally, situations in which cyclists interact with other two-wheeled users (e.g., other cyclists) in urban scenarios have been investigated. As a useful finding, Yuan et al. (2018) [36] found that cyclists tend to perform certain specific evasion maneuvers to avoid crashes with other bicyclists, preferring to move to their right side, with no significant changes in speed, something that indeed is quite different to the speed reductions typically observable in cyclists while interacting with cars. Also, both this study and others show key differential patterns, such as that women show more preventive behaviors than men (see Useche et al., 2022 [19]), circulating at slower speeds and tending more toward deviations from their trajectory as crash avoidance maneuvers.

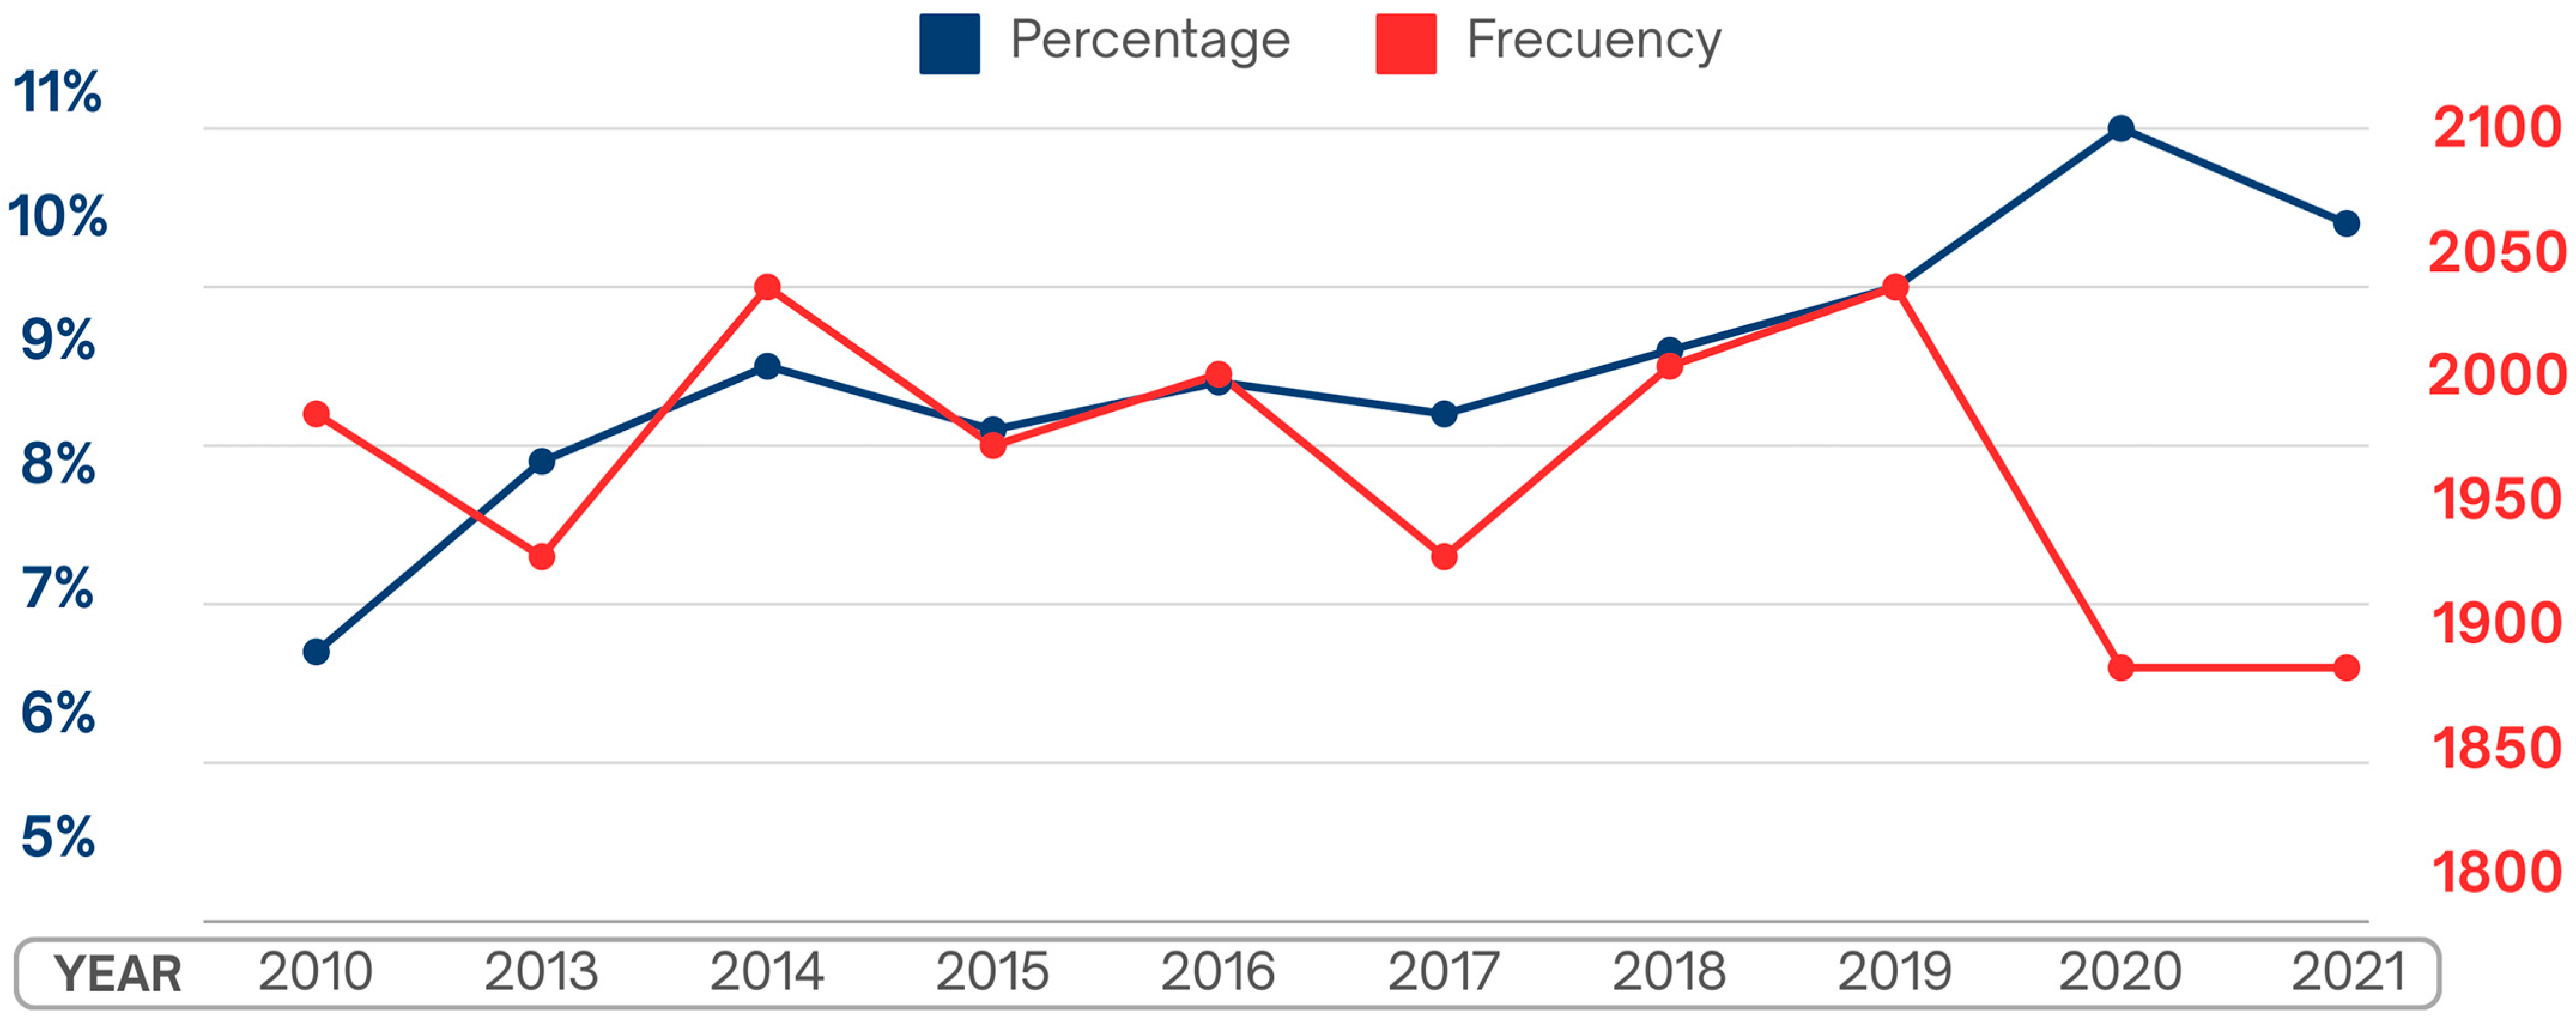
1.3. Urban Cycling in Figures: The Case of Russia

The European Cyclist’s Federation produced a report detailing the status of national plans and strategies for the promotion of cycling in the countries of the continent [6]. It identifies more than 25 countries with a developed National Cycling Strategy or similar document specifying the actions being implemented. However, there is still a large number of regions in which such a plan does not exist or is pending development, with Russia being in this second group of countries. Despite this, plans and actions have been developed in some localities, such as the Cycling Infrastructure Design Guide developed by the Moscow Department of Transport in which new signs and infrastructures were established to prioritize cycling trips, especially related to projects for the implementation of bike lanes, city bicycle rental stations and bicycle parking in urban areas, cycling lifestyle promotion and monitoring and reviewing cycling infrastructure development.
Along these lines, cycling trips have progressively increased in recent years. Nearly 4.5 million bicycles were sold in Russia in 2021, which constitutes a significant rise from the year before [37]. This may have contributed to an increase in the number of road accidents with injured cyclists, standing at 5713 crashes in 2020 [38]. Thus, of the total number of crashes that occurred in that year, 4.5% resulted in at least one injured cyclist, a figure that was 2.9% in 2017 [39]. Consequently, 4% of those killed in Russia due to traffic accidents are cyclists, according to data from the Global Road Safety Facility (2023) [40].

1.4. Study Objectives and Hypotheses

This study aimed to analyze both risky and protective riding patterns of young Russian cyclists in relation to cycling safety factors using the Cycling Behavior Questionnaire (CBQ). Complementarily, the potential relationships between risk perception, cycling rule knowledge, riding behaviors and self-reported cycling crashes were also assessed.
In these regards, and bearing in mind the aforementioned literature-based insights presented in the previous section, two core study hypotheses were created:
Hypothesis 1 (H1).
If variables related to individual characteristics (i.e., gender, risk perception, traffic rule knowledge) are considered, significant associations with Russian riders’ behavioral outcomes (errors, violations and positive behaviors) are expected.
Hypothesis 2 (H2).
It is expected that both risky cycling behaviors (i.e., driving errors and traffic violations) and protective cycling behaviors exert a significant effect on the self-reported riding crash rates of Russian cyclists.

2. Materials and Methods

2.1. Participants

The sample used for this study consisted of N = 374 cyclists aged 16 years and older (68.4% male and 31.6% female) who used any type of bicycle as a means of transportation in the past year, with a mean age of M = 21.61 years (SD = 4.87), residing in large Russian cities. Other demographics of the sample are detailed in Table 1.

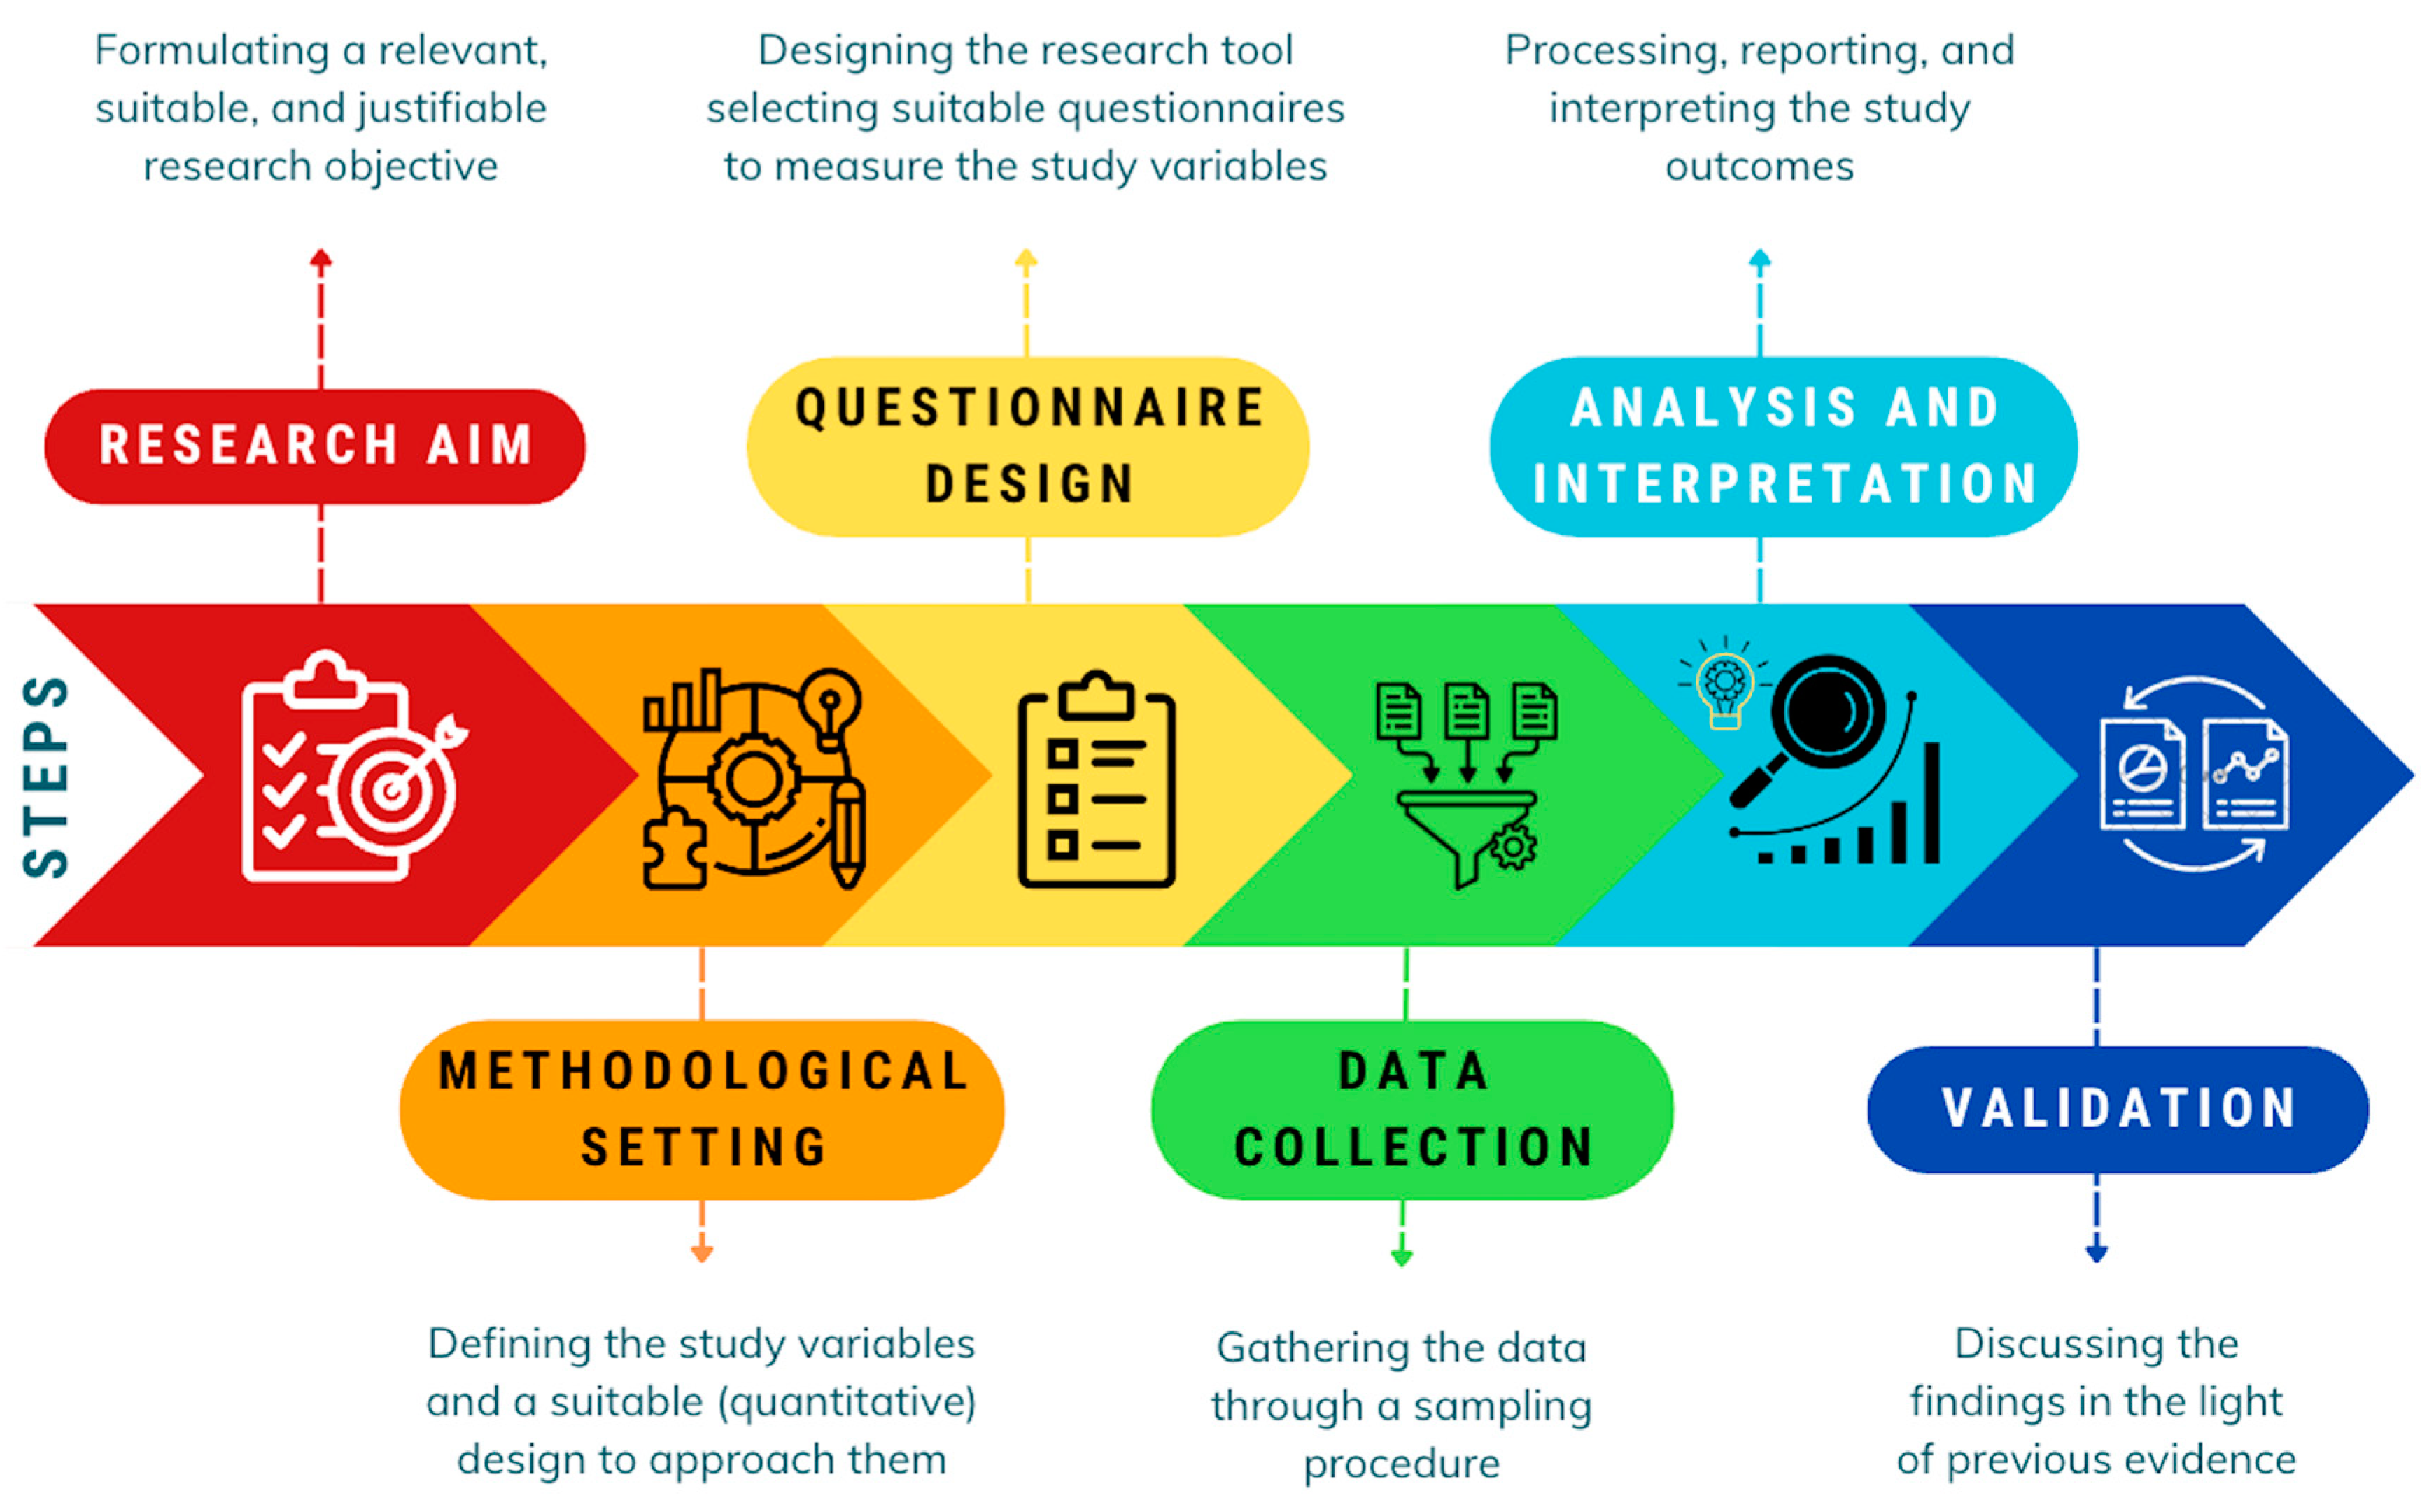
2.2. Design, Procedure and Instruments

Data collection was performed through an electronic survey using an online questionnaire applied through the Google Forms platform. This platform was chosen given its wide accessibility and compatibility with most connected devices, including mobile phones, tablets, and computers using different operative systems and interfaces. The survey was about 15 min long and the sample was obtained during the year 2021. The six sequential research steps followed (from the study objective definition to data validation) are schematically presented in Figure 2.
Regarding recruitment strategies, different actions were carried out such as advertising on social networks, the exchange of questionnaires in classrooms, mailing lists and national cycling federations. No economic incentives were offered to participants in the study.
The questionnaire included the following variables and scales:
  • Consisting of 29 items, the CBQ is a frequency-based Likert-type questionnaire. Responses can be made on a 5-point scale [0 = never–4 = almost always]. This tool’s factorial composition is distributed into three factors as follows: traffic violations, which refers to a cyclist’s deliberate deviations from those practices or traffic rules such as speeding or using alcohol/drugs (8 items; CRI = 0.981; α = 0.768; ω = 0.770); errors, which refers to the non-intentional behaviors of a cyclist that result in the failure of a planned action to achieve their intended consequence, such as a misjudgment of a road or traffic situation (15 items; CRI = 0.994; α = 0.914; ω = 0.913); and positive behaviors, which refers to a cyclist’s protective habits and reactions that may enhance their cycling safety (6 items; 0.983; α = 0.785; ω = 0.782). In a cross-cultural application of the scale, Useche et al. (2022) [19] provided a comprehensive overview of the psychometric characteristics, reliability and validity insights of the 29-item CBQ, highlighting strengths such as its high reliability and validity insights. Also, it is worth mentioning that the Cycling Behavior Questionnaire assesses these factors on the basis of the frequency with which riders perform these behaviors, regardless of their knowledge (or not) of the norm or their risk perception degree.
  • The Risk Perception and Regulation Scale [19]. The RPRS is a generic Likert scale composed of 12 items (7 for risk perception–α = 0.757; ω = 0.760; 5 for traffic normative knowledge–α = 0.753; ω = 0.751). A scale from 0 (no risk perceived) to 4 (most risk perceived) is used to quantify the degree of risk perceived in several typical road scenarios, such as driving or riding while under the influence.
  • Sociodemographic variables of cyclists, namely, age, gender and current occupation.
  • Cycling-related user characteristics: cycling weekly intensity (cycling hours per week), usual reason(s) for bicycle use (i.e., daily commuting/work, sport, leisure; more than one could be marked), self-rated cycling performance and the number of safety-related cycling incidents (regardless of their severity) suffered in the last five years.

2.3. Data Analysis

After conducting careful data curation and scoring procedures, basic descriptive (frequency) analyses were performed to describe and characterize cycling behavior among the Russian population. Namely, mean values, standard deviations and errors were calculated for the study variables. Subsequently, in order to favor the accuracy of comparative, bivariate and predictive analyses, the study variables were standardized. In regard to comparative analyses, t-test analyses were performed to obtain possible statistical associations with sociodemographic variables and user characteristics (e.g., having suffered a cycling crash in the last five years).
As for bivariate tests, Pearson correlation analyses were performed to identify the relationship between cycling behavior, traffic rule knowledge, risk perception and crash-related incidents as self-reported by cyclists.
After confirming basic parameters and statistical assumptions, the study employed path analysis to assess Hypothesis 2. The path model accounted for fundamental demographic factors, including the age and cyclists’ gender, along with their main motive of use and weekly cycling intensity. Given recommendations from the specialized literature to address issues like multivariate non-normality and heteroscedasticity in questionnaire-based research [41], the study utilized maximum likelihood bias-corrected (bootstrapped) estimations. These estimations involved 2000 bootstrap samples per estimation and calculated 95% confidence intervals. Statistical analyses were performed using ©IBM SPSS (Statistical Package for Social Sciences) version 26.0 (Armonk, NY, USA).

3. Results

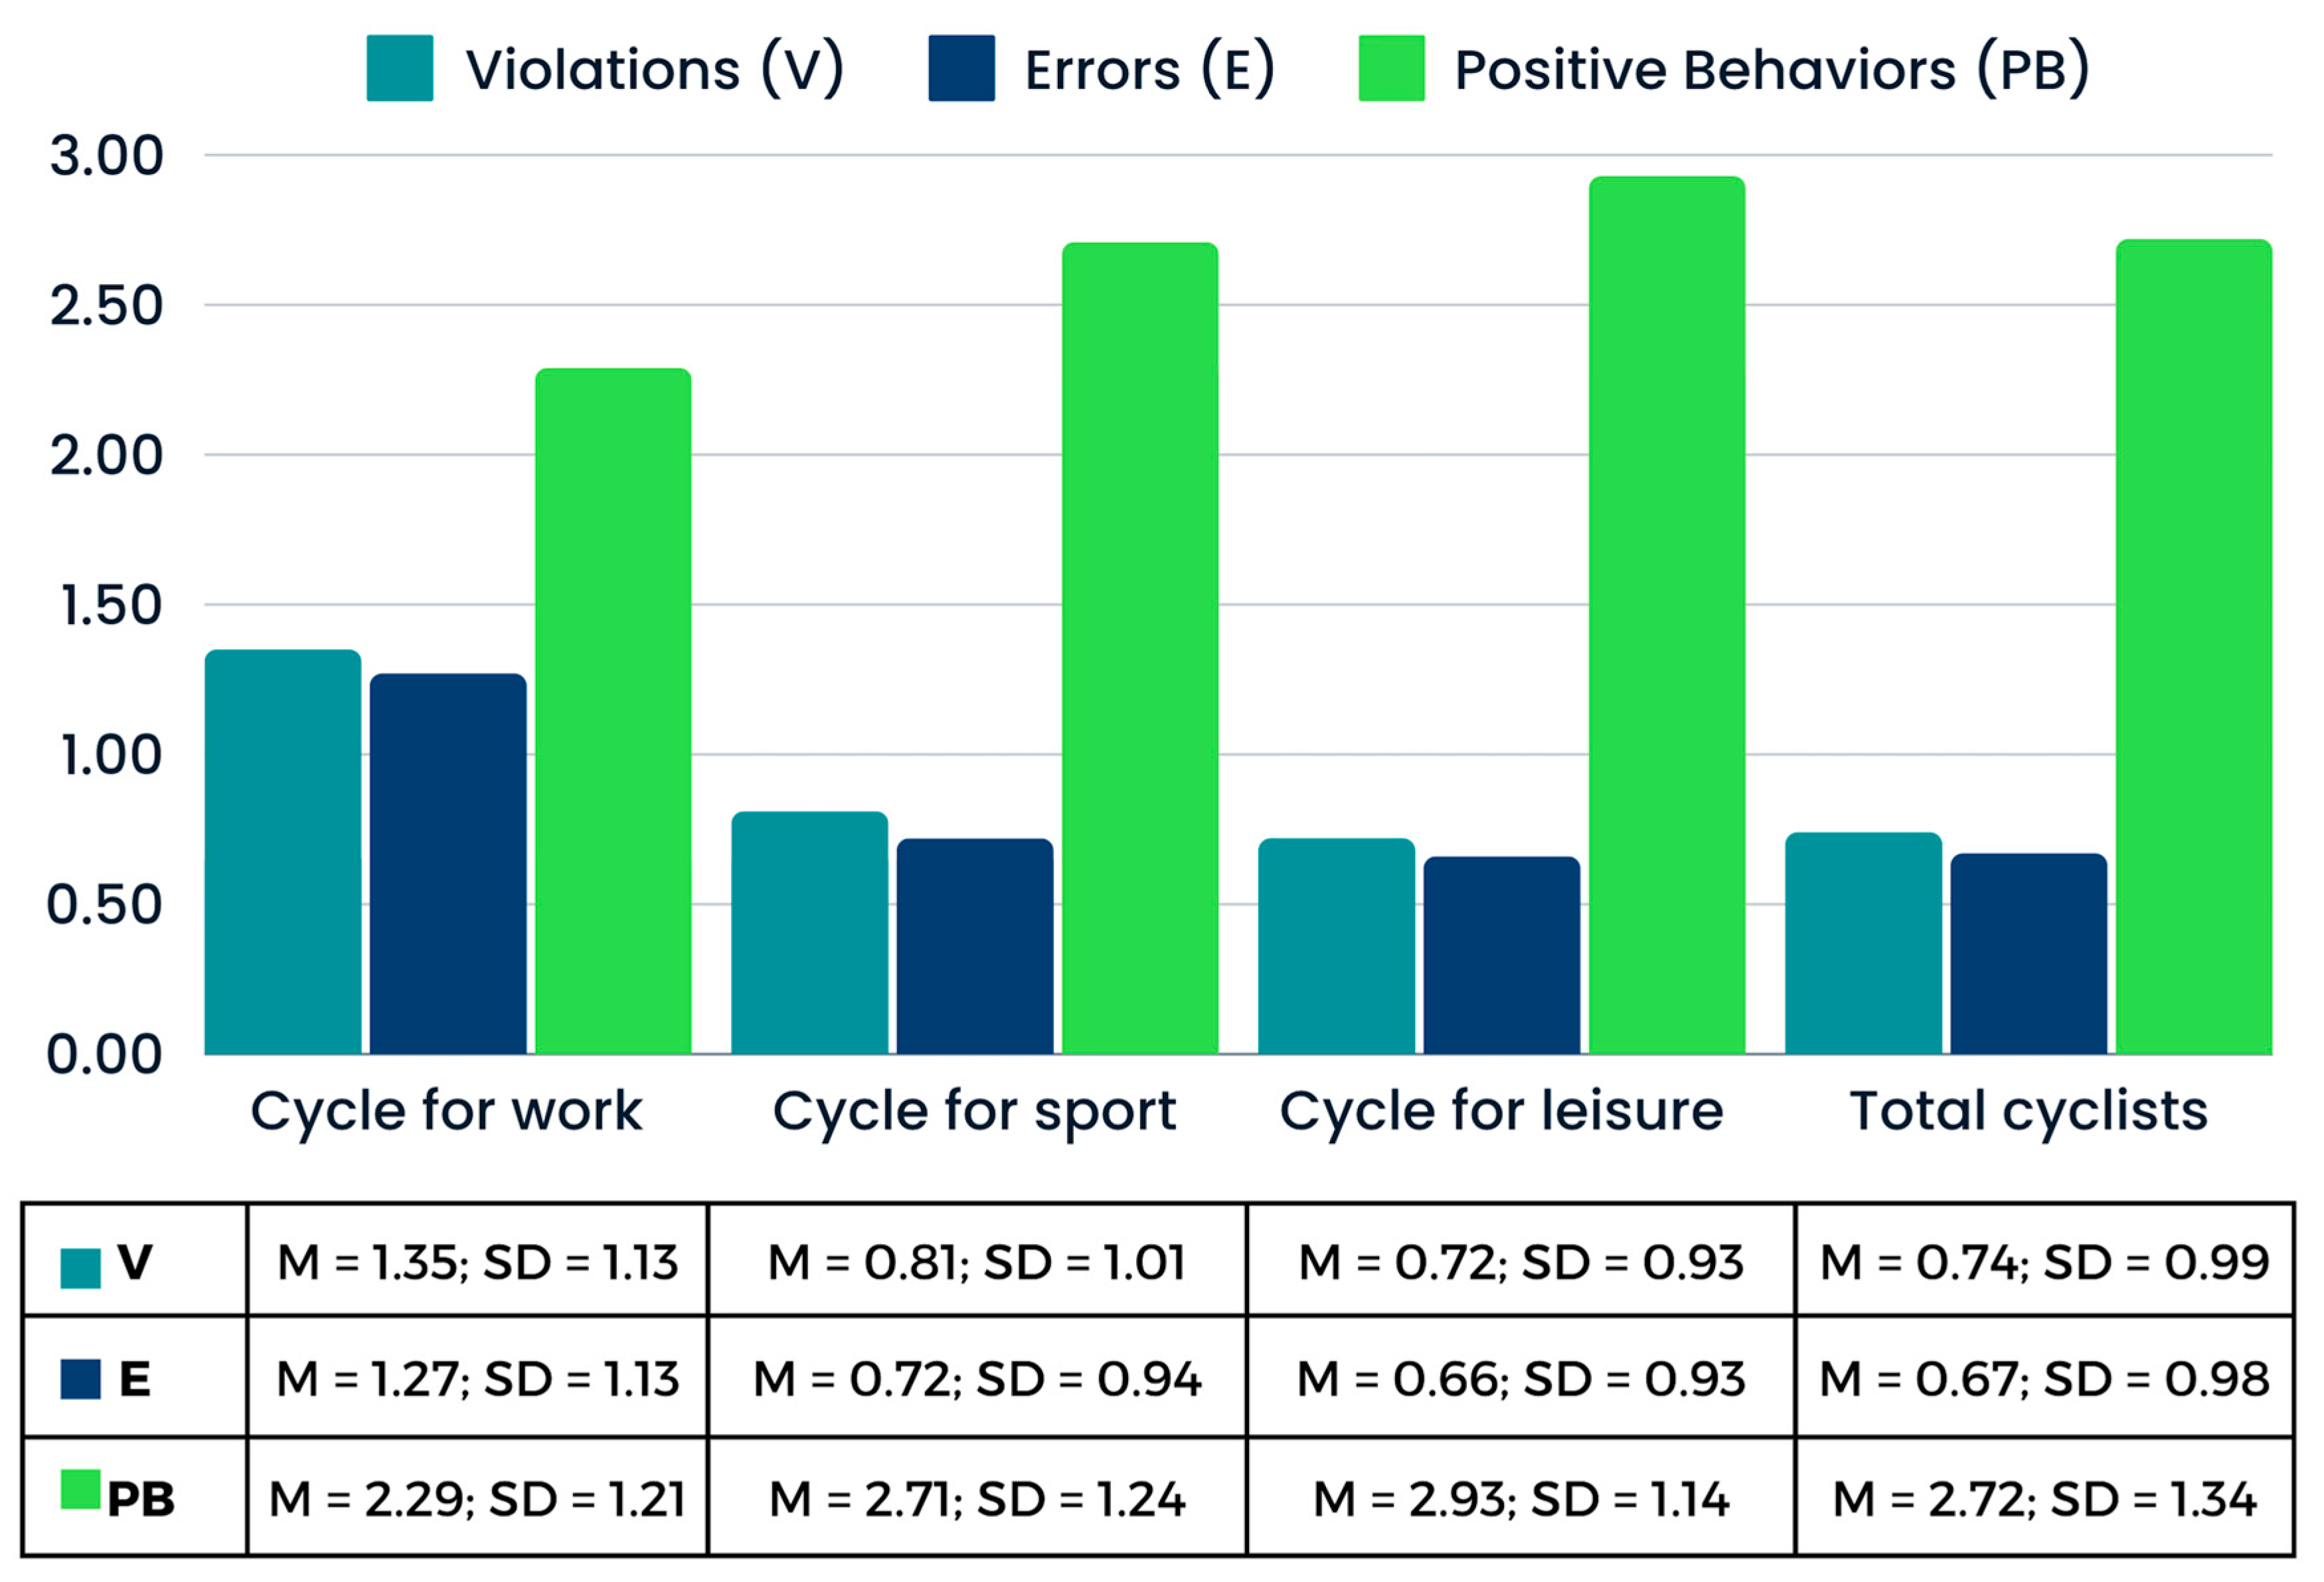
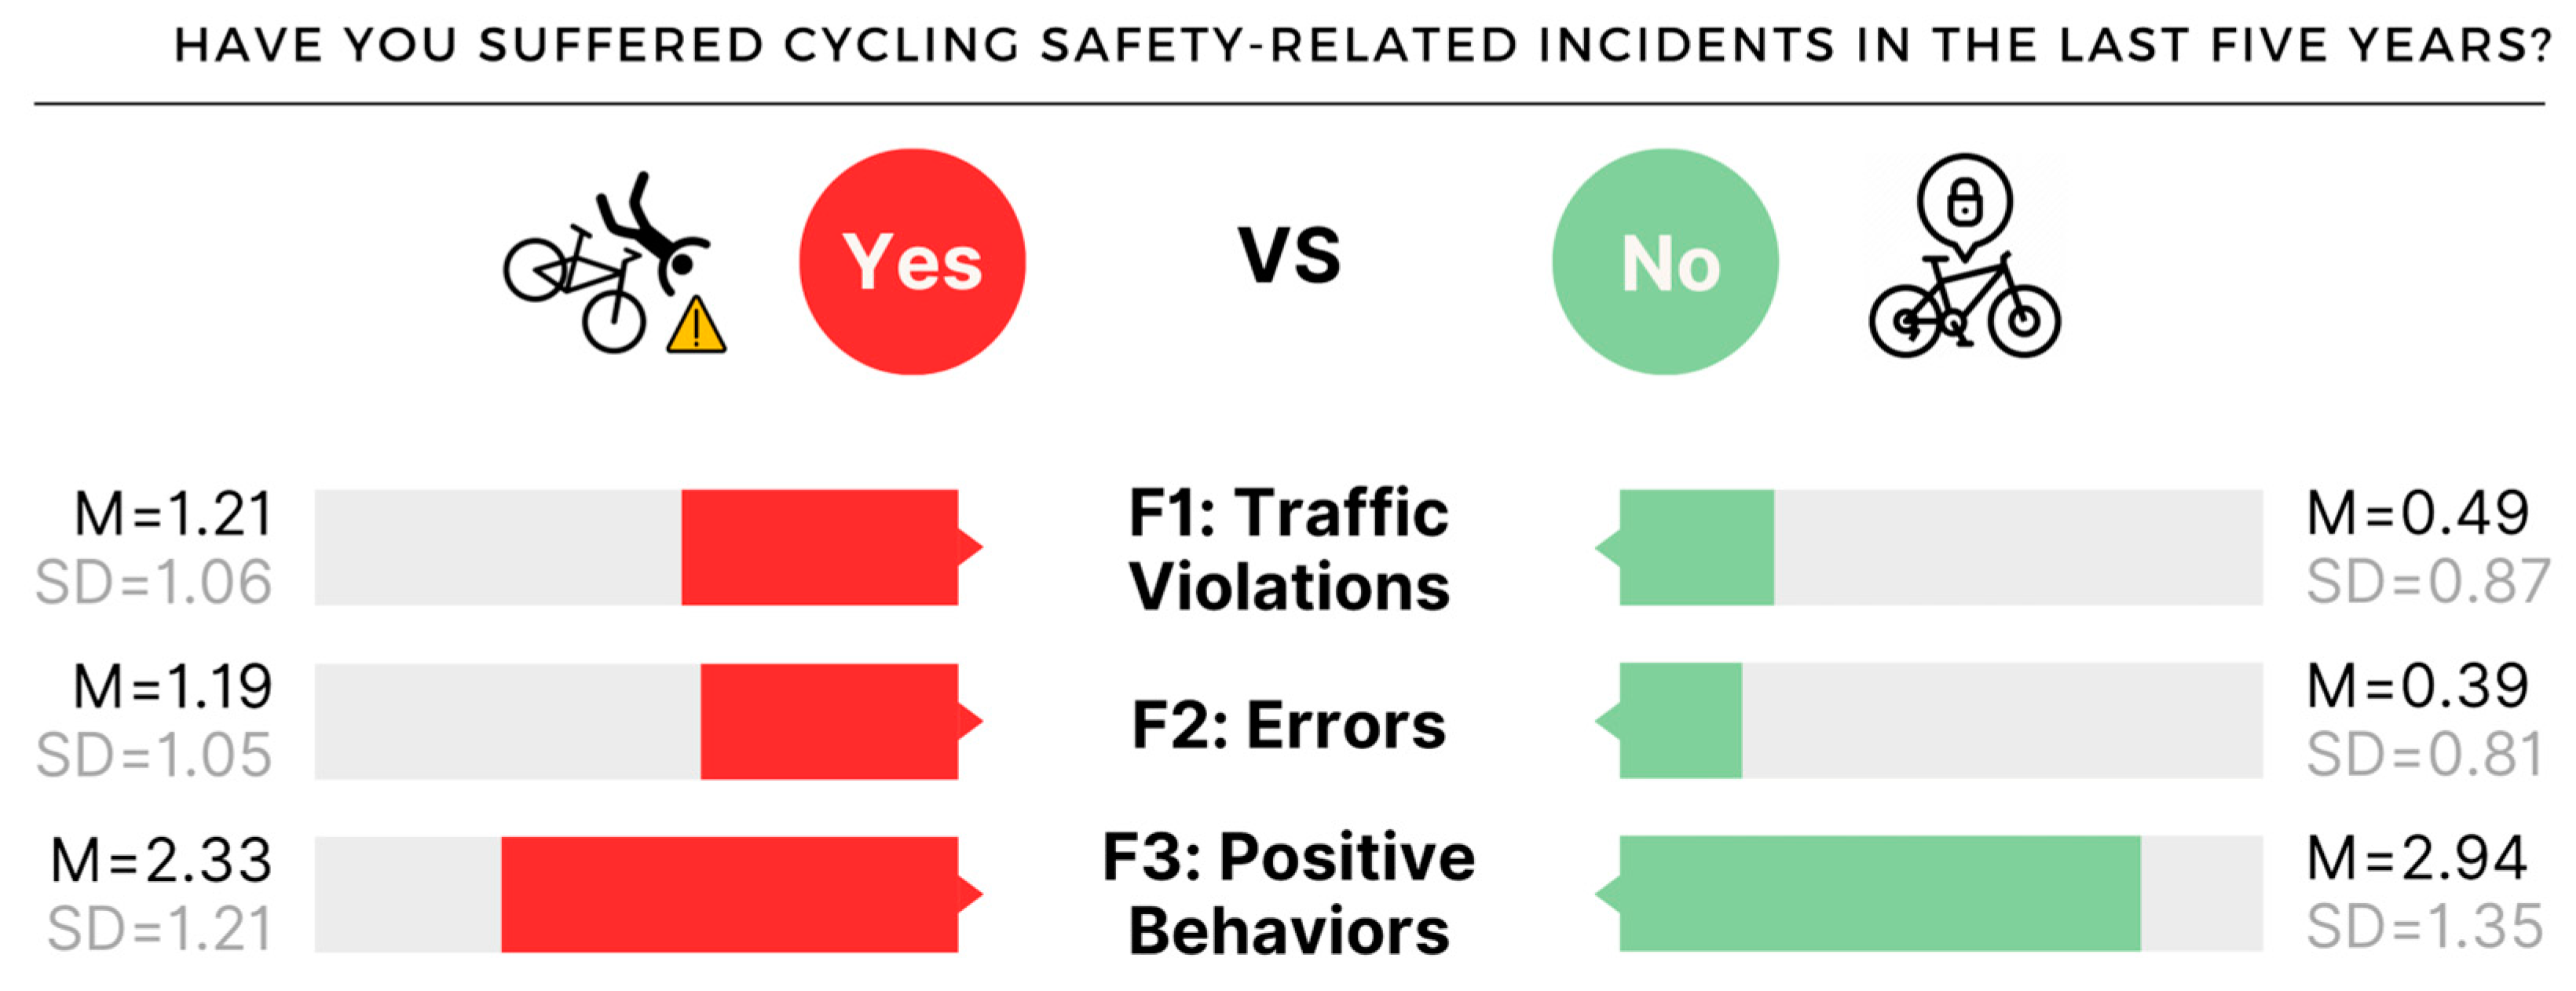
3.1. Descriptive Outcomes

Overall, this sample of Russian cyclists score relatively low on violations (M = 0.74; SD = 0.99) and errors (M = 0.67; SD = 0.98). In contrast, the mean is M = 2.72 (SD = 1.34) for positive behaviors. However, the behaviors vary substantially depending on the reasons for cycling. Thus, people who use bicycles for leisure and sport show better behaviors as cyclists (more positive behaviors and fewer errors and violations) compared to those who use bicycles for commuting to work. Figure 3 graphically shows the differences indicated above.
Overall, none of the three factors measured by the CBQ reported significant differences according to gender or age group. However, once the sample was dichotomized according to the fact of having suffered (or not) at least one crash in the last five years, it was found that those cyclists who have experienced a cycling incident self-report riskier cycling behaviors (i.e., more errors and violations) and fewer positive behaviors compared to users who have never experienced a riding crash as a cyclist in the last five years (Figure 4). In other words, cycling incidents are a safety-related factor significantly differentiating the scores obtained in the CBQ factors, specifically among cyclists who have crashed when compared to their counterparts who have not.

3.2. Bivariate Correlations
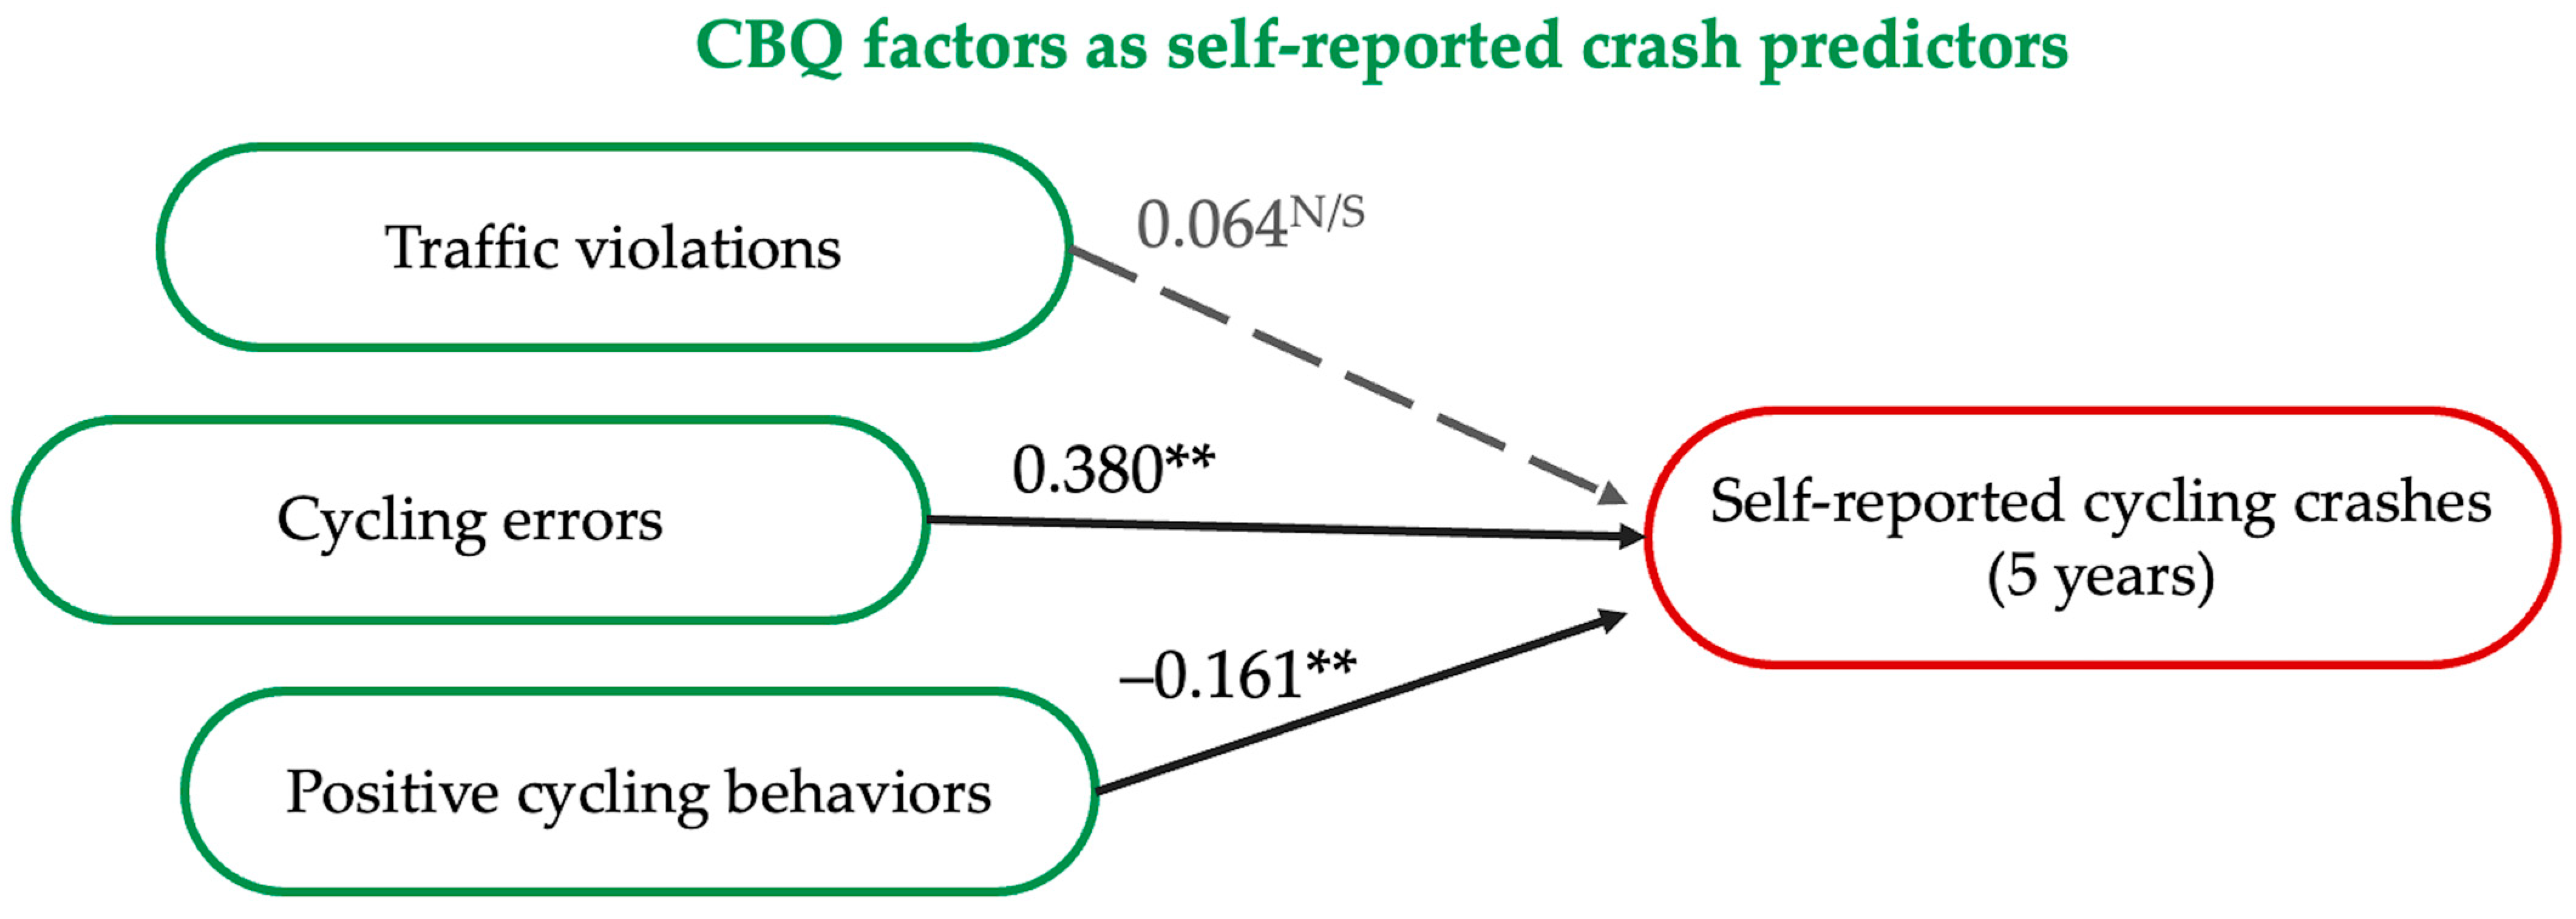
Bicycle user characteristics are related to the behavior of cyclists (Table 2). Thus, the higher the frequency of cycling, the more errors and violations are self-reported, and the more road safety-related incidents have been suffered. A positive relationship is also observed between positive behaviors and the rating they give themselves as cyclists. In turn, the greater the knowledge of the regulations and the perception of risk, the fewer errors and violations are made, and the more positive behaviors are performed.

3.3. Path Analysis

Prior to the model configuration, the paths were theoretically determined, representing a confirmatory approach grounded in plausibility. The fitness of the path models was evaluated using various ordinal/incremental indices (Normed Fit Index—NFI; Incremental Fit Index—IFI; Confirmatory Fit Index—CFI; and Relative Fit Index—RFI), along with their Root Mean Squared Errors of Approximation (RMSEAs) and PCMIN/DF, a ratio between the x2 test value and the number of retained degrees of freedom. The cutoff criteria employed adhered to established standards in the literature, considering ordinal/incremental indices above 0.900, RMSEAs below 0.080 and a PCMIN/DF < 5.0 indicative of satisfactory fit, in alignment with the theoretical plausibility of the paths [42,43,44]. Significance levels were set differentially at p < 0.001, p < 0.010, and p < 0.050.
Following the model configuration controlling for age, gender and exposure and the drawing of the theoretically driven covariances between the two predictors, the resulting statistics for model fit were as follows: x2 = 15.995, p < 0.001; PCMIN/DF = 2.670; NFI (Delta 1) = 0.980; IFI (Delta 2) = 0.987; CFI = 0.987; RFI (rho 1) = 0.928; RMSEA = 0.067, 90% CI [0.028–0.108]. The significant model, whose full set of coefficients is available in Table 3, was retained in consideration of its theoretical plausibleness and overall suitable fit coefficients.
Among the three paths drawn (i.e., traffic violations → self-reported crashes; cycling errors → self-reported crashes; and positive behaviors → self-reported crashes), two of them have shown relevant effects, significant at the level of 0.010, and one remained non-significant. Namely, traffic violations were found to be non-significant statistical predictors of the number of crashes suffered by Russian cyclists in the last five years, even though the path directionality remained positive. On the other hand, cycling errors were significant positive predictors of the dependent variable with β = 0.380; p < 0.010, and positive behaviors exerted a negative and significant effect with β = −0.161; p < 0.010 (bootstrap bias-corrected values). The graphical representation of the retained paths and their predictive coefficients is available in Figure 5.

4. Discussion

The core aim of this study was to analyze both the risky and protective riding patterns of young Russian cyclists in relation to cycling safety factors using the Cycling Behavior Questionnaire (CBQ). Through this approach, we sought to gain a detailed understanding of the practices and attitudes of cyclists in the Russian context as a way of providing insights into the rarely studied behavioral patterns of cyclists in the region, with potential implications for the design of further policies and programs related to sustainable mobility.
Contextualizing the scores and contrasting the findings with other research utilizing the CBQ, it is noteworthy that the positive behavior rates self-reported by young Russian cyclists is among the lowest when compared to that of other countries previously addressed with the CBQ, especially in Europe, such as Austria, Germany or Spain, and in the Americas, such as Brazil or Chile. Among the currently available information, only countries such as Cameroon and China have even lower scores on this factor [19], which in turn, has been endorsed by the study outcomes as critical for riders’ safety. On the contrary, very similar figures to other regions are observed for self-reported violations, being close to the average of all the countries where the CBQ has been applied. In relation to the errors committed by Russian cyclists, their score is slightly higher than the international average, being higher than in countries such as the United Kingdom, Finland or Denmark [45].
Cycling conditions in Russia can influence differences in cycling behavior in relation to other countries [20]. Thus, one of the influencing factors is the climate, as this region experiences extremely cold and long winters, which discourages cycling, especially at certain times of the year. In addition, although efforts are being made to improve cycling infrastructure, as well as actions to promote sustainable transport, there are still deficiencies in policies related to cycling mobility that have an impact on the use and behavior of users [46].

4.1. Cycling Behavior as a Function of User Characteristics

Focusing attention on the results according to the characteristics of the user, and in concordance with the first literature-based hypothesis raised for this research, the fact that the behavior of young cyclists who use bicycles for leisure and exercise purposes tend to be ‘safer’ than those who use them for commuting to work is noteworthy. A suitable explanation for this is offered by Useche et al. (2021) [47], having found that they tend to commit more errors and violations, as well as self-report less protective behavioral patterns. This phenomenon may be influenced by several inter-related factors. First, having too short a time to get to work may lead cyclists to a greater propensity to make hasty decisions on the road, such as using excessive speed or failing to heed red lights or signals [48]. Consequently, the urgency to get to work on time could generate an environment where traffic regulations are subordinated to the need for commuting efficiency [49]. In contrast, cyclists who use bicycles for exercise or leisure activities report less self-reported infringing behavior, which may be related to user satisfaction. While commuting to and from work is a routine journey and is performed in usually complex traffic contexts, for leisure trips, cyclists have more choice with regard to route. In this regard, Wild and Woodward (2019) [50] point out that the pleasant feelings of active transportation receive little attention compared to other factors and that it is important to enhance the physical, social and psychological pleasures of cycling to encourage positive user behaviors. Therefore, the creation of better urban infrastructures, more adapted to cyclists, would make the trips of these users safer, especially those who use a bicycle to go to work, increasing their satisfaction during their commute [51]. In addition, training actions in the workplace to promote safe behavior for both drivers and cyclists would also contribute to improving the safety of this group of road users [52].
In turn, it is consistently observed across the applied literature that riders who have crashed tend to report riskier behavior and less protective habits (e.g., avoiding riding in bad weather settings) than those who have never suffered relevant safety incidents. This result is in line with previous research given that people who tend to commit more cycling infractions often engage in risky and challenging behaviors concerning established traffic rules [53,54,55]. In correlational terms, both errors and traffic violations tend to be reported as factors significantly associated with road crashes, even though their specific role may vary according to users’ typology, given substantial differences in behavioral repertories [56,57,58].
In addition, other studies suggest that young riders’ negative outcomes could be preceded by a lack of road safety education, inexperience in riding bicycles in urban environments, more susceptibility to suffering distractions and poorer decision-making in unexpected/complex traffic situations [59,60].
In relation to cycling intensity (an aspect addressed in this study beyond riders’ age), positive correlations were observed among Russian cyclists between the frequency of cycling and instances of self-reported traffic violations and errors. From a theoretical standpoint, this relationship can be attributed to increased exposure to traffic situations, raising the likelihood of committing violations [61,62]. Moreover, riding in complex urban environments, a common experience for regular cyclists, may contribute to more errors being made and, sometimes, less protective habits while cycling [63]. In contrast, other studies have found that in cases where cyclists ride on quiet roads, differentiated from roadways with non-complex traffic conditions, higher intensity need not be associated with a higher perceived exposure to crashes [64].
Also, the results of this survey-based research underscore the key value of risk perception and rule knowledge among cyclists. Apart from being positively associated with positive cycling behaviors, they hold a negative and significant relationship with the variable errors. These results are in agreement with previous studies such as those by Kummeneje et al. (2020) [65], Lehtonen et al. (2016) [66] and McIlroy et al. (2021) [45], who point out that risk perception is a fundamental variable in understanding cyclist behavior, as well as that of other road users. This variable directly influences users’ decisions and actions. When cyclists perceive situations as dangerous or high-risk, they tend to adjust their behavior by adopting preventive measures in critical situations, such as slowing down, changing lanes or using safety gear [67]. It is also worth pointing that, from a literature point of view, risk perception and rule knowledge are both typical significant contributors and might be considered as relevant issues for safety interventions in urban settings [19,67].

4.2. Predictive Analysis: Behavioral Contributors to Cycling Crashes

The second hypothesis of this study stated that cycling behavioral factors (i.e., errors, violations and positive behaviors) might exert significant effects on the self-reported crash rates of Russian cyclists. While the path model outcomes largely endorse this assumption, it is worth mentioning that this relationship occurs only to a partial extent. All three factors do not exhibit similar associations with safety-related outcomes, particularly concerning risky cycling behaviors.
In the first place, and as initially expected, positive behaviors, defined theoretically as safety-related habits aimed at preventing riders’ involvement in crash-related scenarios [19], have a negative and significant effect on the self-reported number of cycling crash rates among study participants. This finding aligns with previous applications of the instrument in other countries, where cyclists with higher positive behavior scores tended to experience fewer cycling safety-related incidents. Further, in terms of directionality, the association between positive behavior and self-reported crash rates consistently remained negative (e.g., [68,69,70]).
Among risk-related riding behaviors, however, there are dissimilar outcomes when comparing the statistical effects exerted by cycling errors and traffic violations. While the directionality of these associations (i.e., predictive paths to cycling crashes) remains coherently positive in both cases, only one of these two variables (i.e., riding errors but not traffic violations) remains a significant contributor to the dependent factor. Despite the fact that at first glance this could sound dissonant, there are various pieces of recent evidence supporting this fact. For instance, in previous studies with cyclists and pedestrians, circulation errors emerged as the primary behavioral factors influencing these users’ self-reported crashes [56,71]. Also, O’Hern et al. (2019) [72] found that errors—though not violations—had a significant association with the self-reported crash rates of Australian cyclists, supporting the need to differentiate motorized from non-motorized user dynamics and safety-related contributors and potential behavioral repertoires (i.e., possible violations and errors).

4.3. Other Relevant Safety-Related Challenges and Potential Contributors

From a literature point of view, it is also important to highlight that addressing additional constraints, such as the behavior of motor vehicle users—whose infractions tend to simultaneously influence accident rates involving cyclists—has been emphasized as a complementary focus to improve riders’ safety outcomes [73]. Indeed, a key variable that appears to modulate this factor is the cycling culture of a country, as well as the so-called ‘safety in numbers’. That is, when there are more cyclists on the road, it has been shown to increase awareness of their presence among car drivers, thereby reducing the risk of crashes involving cyclists [74].
In this regard, and considering the insights provided by previous evidence gathered from regions sharing characteristics similar to the country under analysis (e.g., high motorization levels and the limited integration of cycling into everyday urban dynamics), some challenges remain latent. For instance, the literature examining public policy actions aimed at promoting bicycle use and active mobility in countries with young cycling cultures suggests that complementary measures, such as road safety education, increasing social discussion on the role of active transport on public health, awareness-raising strategies and sustained promotive policies, could support mid- and long-term bicycle adoption rates and behavioral improvements among both current and potential users [27,54,75].
Furthermore, it should be noted that in addition to an emerging urban cycling tradition, Russia still lacks extensive cycling infrastructure in major urban areas, leading to, among other consequences, frequent mixed traffic use [40]. This presents the challenge of fostering positive interactions among road users. In other words, there is a need to raise awareness among drivers regarding the presence of cyclists on the road to promote respectful driving behavior towards vulnerable users.
Bearing in mind previous studies and evaluations conducted in other countries, this can include the implementation of Advanced Driver Assistance Systems (ADASs) for crash prevention [32], as well as social reinforcement for positive and safety-enhancing behaviors and cycling patterns [53]. Additionally, previous contextual approaches emphasize the significant role that efforts focused on improving road infrastructure tailored to weather conditions may play [20,40], as these are significant factors among the primary constraints identified in Russian cities. This may involve constructing protected bike lanes and implementing adequate signage. Taken together, these combined actions can help reduce crashes, foster a safer road culture and encourage greater cycling participation in the region.

4.4. Limitations of the Study and Further Research

This study presented some outstanding strengths, such as the investigation of an underexplored topic in Russia and its practical implications for the establishment of specific measures to improve road safety for cyclists in the region. However, there are some key limitations which should be considered in interpreting the study findings.
First, while this and other cross-sectional study protocols are designed to maintain partakers’ anonymity, potential common method bias and individual limitations include a restricted number of covariables and controlling variables, leaving room for biases. Memory flaws, for example, might have influenced the accuracy of participants’ reports on behaviors and crash-related incidents provided to the research team, especially when addressing potentially sensitive topics such as social behavior and safety outcomes. While the aforementioned standard procedures were followed to minimize their impact, the likelihood of these biases could be minimized through complementary strategies, such as wording and prefacing potentially sensitive questions, clearly defining the role of the study partakers and evaluating the possible motivations behind providing socially desirable information from a qualitative point of view [76].
Secondly, and as the survey methodology greatly depended on the accuracy (and not only the deliberate honesty) of the answers provided by the participants, there is also a possibility that cyclists may have involuntarily self-reported some of their behaviors in a biased manner, either through forgetfulness, lack of awareness of certain risks or a tendency to present certain behaviors in a more positive light. In addition, the sample cannot be assumed to be fully representative in terms of gender, a study feature that should be considered when interpreting the current results.
As for usage patterns and infrastructure-related issues, it is worth acknowledging that in this study, questions related to the infrastructure or traffic conditions in which the cyclists surveyed ride were appended. Nevertheless, it would benefit the explanatory and informative scope of further research to consider these factors, given that they are supported as variables that also may influence and explain risk-related riding behaviors [11,13,64].
Moreover, the safety-related indicator utilized in this study (i.e., self-reported crashes) did not incorporate considerations for either near-misses or crash severity. It would be interesting to specifically analyze the differences among these different types of safety outcomes with greater sensitivity and to incorporate complementary measures (e.g., observations, police crash records) to cross-check the trends of the crash data provided through the questionnaire setting.
Finally, it is worth encouraging other researchers and institutions to keep exploring cycling safety-related phenomena in countries where the body of knowledge in this specific field is weak or understudied. Such efforts would contribute to decision-making and transport planning, promoting sustainable active transportation modes and dynamics.

5. Conclusions

This study represents a preliminary exploration of the relationships between individual characteristics, self-reported cycling behaviors and cycling safety-related issues among Russian young cyclists. Overall, the results of this empirical research allow us to highlight the relevance of individual psychosocial factors and self-reported cycling behaviors on cycling safety outcomes. These insights can be summarized as follows, in accordance with our study hypotheses:
As for Hypothesis 1, it was consistently shown that young cyclists’ key individual features (i.e., traffic norm knowledge and risk perception) are significantly associated with self-reported riding behavior. Specifically, a negative relationship was observed between these features and both traffic violations and riding errors. Conversely, the link between risk perception, rule knowledge and positive cycling behaviors was positive and significant, as was the association with lower crash rates.
Regarding Hypothesis 2, the relationship between risk-related cycling behaviors and self-reported crash outcomes has shown significant but differential predictive links. Specifically, while traffic violations were not significant predictors of cycling crashes, riding errors remained key risk contributors. Additionally, positive cycling behaviors (i.e., protective habits) were identified as significant reducers of crash likelihood.

Practical Applications and Contributions

At a practical level, the outcomes of this research may be valuable for different purposes, actions and stakeholders, namely the following:
From a technical/methodological standpoint, this study endorses the psychometric value of the behavioral and user-focused questionnaires (e.g., CBQ, RPRS) applied for the first time in the Russian cycling population.
At a user level, it provides empirical insights into understanding the factors contributing to riding risk and crashes among young bicycle riders, a demographic gaining prominence in urban cycling in the country.
In terms of policy and practical implications, this study provides key data to inform efforts aimed at promoting (safe) bicycle riding in a country with a still young cycling culture. Despite enduring ‘classical’ constraints such as challenging weather-related factors and historically high motorization, there is potential to enhance active and user-friendly mobility, aligning with the growing demand for more sustainable urban transportation options and the imperative to improve cycling safety.

Author Contributions

Conceptualization, S.A.U., F.A. and M.F.; methodology, S.A.U. and F.A.; software, F.A. and S.A.U.; validation, A.B., P.B. and I.M.; formal analysis, S.A.U. and M.F.; investigation, A.B., P.B., I.M. and G.P.; resources, P.B. and I.M.; data curation, A.B., P.B., I.M. and G.P.; writing—original draft preparation, S.A.U., F.A. and M.F.; writing—review and editing, S.A.U. and F.A.; visualization, S.A.U.; supervision, P.B. and I.M.; project administration, P.B.; funding acquisition, F.A. and S.A.U. All authors have read and agreed to the published version of the manuscript.

Funding

This research received no external funding.

Institutional Review Board Statement

The study protocol was assessed and subsequently approved by the University of Valencia’s Research Institute on Traffic and Road Safety’s Ethics Committee (IRB approval number: HE0003170921). Individuals took part in the study anonymously and provided their consent after being fully informed by the research staff about the objectives of the study and all previously mentioned parameters before responding to the research survey.

Informed Consent Statement

Informed consent was obtained from all subjects involved in the study.

Data Availability Statement

The data used for this study can be available upon reasonable request to the corresponding author.

Acknowledgments

The authors would like to acknowledge the time and thoughtful contributions provided by the numerous cyclists who participated in this study. Additionally, they extend appreciation for the support received from members of cycling advocacy and research institutions who contribute daily to the advancement of cycling safety on a global scale, despite the political tensions outside the scientific field that interfere with the quality of life and well-being of the population.

Conflicts of Interest

The authors declare no conflicts of interest.

References

  1. Chattu, V.K.; Manzar, M.D.; Kumary, S.; Burman, D.; Spence, D.W.; Pandi-Perumal, S.R. The global problem of insufficient sleep and its serious public health implications. Healthcare 2018, 7, 1. [Google Scholar] [CrossRef]
  2. World Health Organization. Global Status Report on Alcohol and Health 2018; World Health Organization: Geneva, Switzerland, 2019. [Google Scholar]
  3. Alonso, F.; Faus, M.; Esteban, C.; Useche, S.A. Who wants to change their transport habits to help reduce air pollution? A nationwide study in the Caribbean. J. Transp. Health 2023, 33, 101703. [Google Scholar] [CrossRef]
  4. Oviedo-Trespalacios, O.; Çelik, A.K.; Marti-Belda, A.; Włodarczyk, A.; Demant, D.; Nguyen-Phuoc, D.Q.; Rubie, E.; Oktay, E.; Argandar, G.D.; Rod, J.E.; et al. Alcohol-impaired Walking in 16 Countries: A theory-based investigation. Accid. Anal. Prev. 2021, 159, 106212. [Google Scholar] [CrossRef]
  5. Garcia-Venegas, M.; Mercado-Ravell, D.A.; Pinedo-Sanchez, L.A.; Carballo-Monsivais, C.A. On the safety of vulnerable road users by cyclist detection and tracking. Mach. Vis. Appl. 2021, 32, 109. [Google Scholar] [CrossRef]
  6. European Cyclists’ Federation. The Sate of National Cycling Strategies in Europe 2021. 2022. Available online: https://ecf.com/system/files/The_State_of_National_Cycling_Strategies_2021_final_0.pdf (accessed on 10 February 2024).
  7. Xie, X.; Nikitas, A.; Liu, H. A study of fatal pedestrian crashes at rural low-volume road intersections in southwest China. Traffic Inj. Prev. 2018, 19, 298–304. [Google Scholar] [CrossRef] [PubMed]
  8. Klanjčić, M.; Gauvin, L.; Tizzoni, M.; Szell, M. Identifying urban features for vulnerable road user safety in Europe. EPJ Data Sci. 2022, 11, 27. [Google Scholar] [CrossRef]
  9. De Rome, L.; Boufous, S.; Georgeson, T.; Senserrick, T.; Ivers, R. Cyclists’ clothing and reduced risk of injury in crashes. Accid. Anal. Prev. 2014, 73, 392–398. [Google Scholar] [CrossRef]
  10. Kaya, N.; Girgis, J.; Hansma, B.; Donmez, B. Hey, watch where you’re going! An on-road study of driver scanning failures towards pedestrians and cyclists. Accid. Anal. Prev. 2021, 162, 106380. [Google Scholar] [CrossRef]
  11. Mulvaney, C.A.; Smith, S.; Watson, M.C.; Parkin, J.; Coupland, C.; Miller, P.; McClintock, H. Cycling infrastructure for reducing cycling injuries in cyclists. Cochrane Database Syst. Rev. 2015, 12, CD010415. [Google Scholar] [CrossRef] [PubMed]
  12. Arellana, J.; Saltarín, M.; Larrañaga, A.M.; González, V.I.; Henao, C.A. Developing an urban bikeability index for different types of cyclists as a tool to prioritise bicycle infrastructure investments. Transp. Res. Part A Policy Pract. 2020, 139, 310–334. [Google Scholar] [CrossRef]
  13. Gössling, S.; McRae, S. Subjectively safe cycling infrastructure: New insights for urban designs. J. Transp. Geogr. 2022, 101, 103340. [Google Scholar] [CrossRef]
  14. Micucci, A.; Sangermano, M. A study on cyclists behaviour and bicycles kinematic. Int. J. Transp. Dev. Integr. 2020, 4, 14–28. [Google Scholar] [CrossRef]
  15. Mullen, C.; Tight, M.; Whiteing, A.; Jopson, A. Knowing their place on the roads: What would equality mean for walking and cycling? Transp. Res. Part A Policy Pract. 2014, 61, 238–248. [Google Scholar] [CrossRef]
  16. Hull, A.; O’holleran, C. Bicycle infrastructure: Can good design encourage cycling? Urban Plan Transp Res. 2014, 2, 369–406. [Google Scholar] [CrossRef]
  17. Oldmeadow, J.A.; Povey, S.; Povey, A.; Critchley, C. Driver anger towards cyclists in Australia: Investigating the role of the perceived legitimacy of cyclists as road users. Transp. Res. F Traffic Psychol. Behav. 2019, 63, 240–251. [Google Scholar] [CrossRef]
  18. Wang, C.; Zhang, W.; Feng, Z.; Wang, K.; Gao, Y. Exploring factors Influencing the risky cycling behaviors of young cyclists aged 15–24 years: A questionnaire-based study in China. Risk Anal. 2020, 40, 1554–1570. [Google Scholar] [CrossRef]
  19. Useche, S.A.; Alonso, F.; Boyko, A.; Buyvol, P.; Castañeda, I.D.; Cendales, B.; Cervantes, A.; Echiburu, T.; Faus, M.; Feitosa, Z.; et al. Cross-culturally approaching the Cycling Behaviour Questionnaire (CBQ): Evidence from 19 countries. Transp. Res. F Traffic Psychol. Behav. 2022, 91, 386–400. [Google Scholar] [CrossRef]
  20. Shoman, M.M.; Imine, H.; Acerra, E.M.; Lantieri, C. Evaluation of cycling safety and comfort in bad weather and surface conditions using an instrumented bicycle. IEEE Access 2023, 11, 15096–15108. [Google Scholar] [CrossRef]
  21. Puchades, V.M.; Fassina, F.; Fraboni, F.; De Angelis, M.; Prati, G.; de Waard, D.; Pietrantoni, L. The role of perceived competence and risk perception in cycling near misses. Saf. Sci. 2018, 105, 167–177. [Google Scholar] [CrossRef]
  22. Castanier, C.; Paran, F.; Delhomme, P. Risk of crashing with a tram: Perceptions of pedestrians, cyclists, and motorists. Transp. Res. F Traffic Psychol. Behav. 2012, 15, 387–394. [Google Scholar] [CrossRef]
  23. Zheng, Y.; Ma, Y.; Li, N.; Cheng, J. Personality and behavioral predictors of cyclist involvement in crash-related conditions. Int. J. Environ. Res. Public Health 2019, 16, 4881. [Google Scholar] [CrossRef]
  24. Young, K.L.; Stephens, A.N.; O’Hern, S.; Koppel, S. Australian cyclists’ engagement in secondary tasks. J. Transp. Health 2020, 16, 100793. [Google Scholar] [CrossRef]
  25. Zeuwts, L.H.; Vansteenkiste, P.; Deconinck, F.J.; Cardon, G.; Lenoir, M. Hazard perception in young cyclists and adult cyclists. Accid. Anal. Prev. 2017, 105, 64–71. [Google Scholar] [CrossRef] [PubMed]
  26. Büchel, B.; Marra, A.D.; Corman, F. COVID-19 as a window of opportunity for cycling: Evidence from the first wave. Transp. Policy 2022, 116, 144–156. [Google Scholar] [CrossRef]
  27. Kriit, H.K.; Williams, J.S.; Lindholm, L.; Forsberg, B.; Nilsson Sommar, J. Health economic assessment of a scenario to promote bicycling as active transport in Stockholm, Sweden. BMJ Open 2019, 9, e030466. [Google Scholar] [CrossRef]
  28. Bauman, A.; Merom, D.; Rissel, C. “Where have all the bicycles gone?” Are bicycle sales in Australia translated into health-enhancing levels of bicycle usage? Prev. Med. 2012, 54, 145–147. [Google Scholar] [CrossRef]
  29. Seriani, S.; Perez, V.; Aprigliano, V.; Fujiyama, T. Experimental study of cyclist’ sensitivity when they are overtaken by a motor vehicle: A pilot study in a street without cycle lanes. Sustainability 2022, 14, 16784. [Google Scholar] [CrossRef]
  30. Knight, A.; Charlton, S.G. Protected and unprotected cycle lanes’ effects on cyclists’ behaviour. Accid. Anal. Prev. 2022, 171, 106668. [Google Scholar] [CrossRef]
  31. Silva, C.; Moeckel, R.; Clifton, K. Comparative observational assessment of cyclists’ interactions on urban streets with on-street and sidewalk bike lanes. Transp. Res. Rec. 2022, 2677, 836–848. [Google Scholar] [CrossRef]
  32. Brijs, T.; Mauriello, F.; Montella, A.; Galante, F.; Brijs, K.; Ross, V. Studying the effects of an advanced driver-assistance system to improve safety of cyclists overtaking. Accid. Anal. Prev. 2022, 174, 106763. [Google Scholar] [CrossRef]
  33. Yan, X.; Ma, M.; Huang, H.; Abdel-Aty, M.; Wu, C. Motor vehicle–bicycle crashes in Beijing: Irregular maneuvers, crash patterns, and injury severity. Accid. Anal. Prev. 2011, 43, 1751–1758. [Google Scholar] [CrossRef]
  34. Isaksson-Hellman, I.; Werneke, J. Detailed description of bicycle and passenger car collisions based on insurance claims. Saf. Sci. 2017, 92, 330–337. [Google Scholar] [CrossRef]
  35. Thomas, B.; DeRobertis, M. The safety of urban cycle tracks: A review of the literature. Accid. Anal. Prev. 2013, 52, 219–227. [Google Scholar] [CrossRef]
  36. Yuan, Y.; Daamen, W.; Goñi-Ros, B.; Hoogendoorn, S.P. Investigating cyclist interaction behavior through a controlled laboratory experiment. J. Transp. Land Use 2018, 11, 833–847. [Google Scholar] [CrossRef]
  37. Statista Research Department. Bicycle Sales Volume in Russia 2017–2021. 2022. Available online: https://www.statista.com/statistics/1347727/bicycle-sales-volume-russia/ (accessed on 6 February 2024).
  38. Statista Research Department. Number of Road Accidents with Injured Cyclists in Russia from 2015 to 2020. 2023. Available online: https://www.statista.com/statistics/1035536/russia-number-of-road-accidents-with-injured-cyclists/ (accessed on 6 February 2024).
  39. Statista Research Department. Number of Road Accidents in Russia 2015–2022. 2023. Available online: https://www.statista.com/statistics/1035535/russia-number-of-road-accidents/ (accessed on 10 February 2024).
  40. Global Road Safety Facility. Road Safety Country Profile: Russian Federation Road Safety Country Profile. 2023. Available online: https://www.roadsafetyfacility.org/country/russian-federation (accessed on 6 February 2024).
  41. Byrne, B. Structural Equation Modeling with AMOS. Basic Concepts, Applications and Programming, 2nd ed.; Routledge Taylor & Francis Group: New York, NY, USA, 2010. [Google Scholar]
  42. Jimenez-Granado, A.; del Hoyo-Bilbao, J.; Fernandez-Gonzalez, L. Interaction of parental discipline strategies and adolescents’ personality traits in the prediction of child-to-parent violence. Eur. J. Psychol. Appl. Leg. Context 2023, 15, 43–52. [Google Scholar] [CrossRef]
  43. Marsh, H.W.; Hau, K.T.; Wen, Z. In search of golden rules: Comment on hypothesis-testing approaches to setting cut-off values for fit indexes and dangers in overgeneralizing Hu and Bentler’s (1999) findings. Struct. Equ. Model. 2004, 11, 320–341. [Google Scholar] [CrossRef]
  44. Miles, J.; Shevlin, M. A time and a place for incremental fit indices. Personal. Individ. Differ. 2007, 42, 869–874. [Google Scholar] [CrossRef]
  45. McIlroy, R.C.; Useche, S.A.; Gonzalez-Marin, A. To what extent do our walking and cycling behaviours relate to each other, and do we cycle as well as we think we do? Piloting the walking and cycling behaviour questionnaires in the UK. Accid. Anal. Prev. 2022, 168, 106597. [Google Scholar] [CrossRef] [PubMed]
  46. Zakharov, D.; Fadyushin, A. The efficiency of some activities for the development of urban infrastructure for public transport, cyclists and pedestrians. Int. J. Transp. Dev. Integr. 2021, 5, 136–149. [Google Scholar] [CrossRef]
  47. Charreire, H.; Roda, C.; Feuillet, T.; Piombini, A.; Bardos, H.; Rutter, H.; Compernolle, S.; Mackenbach, J.D.; Lakerveld, J.; Oppert, J.M. Walking, cycling, and public transport for commuting and non-commuting travels across 5 European urban regions: Modal choice correlates and motivations. J. Transp. Geogr. 2021, 96, 103196. [Google Scholar] [CrossRef]
  48. Macioszek, E.; Granà, A. The analysis of the factors influencing the severity of bicyclist injury in bicyclist-vehicle crashes. Sustainability 2022, 14, 215. [Google Scholar] [CrossRef]
  49. Wegman, F.; Zhang, F.; Dijkstra, A. How to make more cycling good for road safety? Accid. Anal. Prev. 2012, 44, 19–29. [Google Scholar] [CrossRef]
  50. Wild, K.; Woodward, A. Why are cyclists the happiest commuters? Health, pleasure and the e-bike. J. Transp. Health 2019, 14, 100569. [Google Scholar] [CrossRef]
  51. Pucher, J.; Buehler, R. Safer cycling through improved infrastructure. Am. J. Public Health 2016, 106, 2089–2091. [Google Scholar] [CrossRef] [PubMed]
  52. Bonham, J.; Johnson, M. Cyclist-related content in novice driver education and training. Accid. Anal. Prev. 2018, 111, 321–327. [Google Scholar] [CrossRef]
  53. Huemer, A.K. Motivating and deterring factors for two common traffic-rule violations of cyclists in Germany. Transp. Res. F Traffic Psychol. Behav. 2018, 54, 223–235. [Google Scholar] [CrossRef]
  54. Coogan, M.A.; Campbell, M.; Adler, T.J.; Forward, S. Examining behavioral and attitudinal differences among groups in their traffic safety culture. Transp. Res. F Traffic Psychol. Behav. 2014, 26, 303–316. [Google Scholar] [CrossRef]
  55. Tang, T.; Guo, Y.; Zhou, X.; Labi, S.; Zhu, S. Understanding electric bike riders’ intention to violate traffic rules and accident proneness in China. Travel Behav. Soc. 2021, 23, 25–38. [Google Scholar] [CrossRef]
  56. Useche, S.A.; Llamazares, J. The guilty, the unlucky, or the unaware? Assessing self-reported behavioral contributors and attributions on pedestrian crashes through structural equation modeling and mixed methods. J. Saf. Res. 2022, 82, 329–341. [Google Scholar] [CrossRef] [PubMed]
  57. Martínez-Ruiz, V.; Lardelli-Claret, P.; Jiménez-Mejías, E.; Amezcua-Prieto, C.; Jimenez-Moleon, J.J.; del Castillo, J. Risk factors for causing road crashes involving cyclists: An application of a quasi-induced exposure method. Accid. Anal. Prev. 2013, 51, 228–237. [Google Scholar] [CrossRef]
  58. Cestac, J.; Paran, F.; Delhomme, P. Young drivers’ sensation seeking, subjective norms, and perceived behavioral control and their roles in predicting speeding intention: How risk-taking motivations evolve with gender and driving experience. Saf. Sci. 2011, 49, 424–432. [Google Scholar] [CrossRef]
  59. Aldred, R. Incompetent or too competent? Negotiating everyday cycling identities in a motor dominated society. Mobilities 2013, 8, 252–271. [Google Scholar] [CrossRef]
  60. Fishman, E.; Washington, S.; Haworth, N. Barriers and facilitators to public bicycle scheme use: A qualitative approach. Transp. Res. F Traffic Psychol. Behav. 2012, 15, 686–698. [Google Scholar] [CrossRef]
  61. Zhang, G.; Yau, K.K.; Zhang, X.; Li, Y. Traffic accidents involving fatigue driving and their extent of casualties. Accid. Anal. Prev. 2016, 87, 34–42. [Google Scholar] [CrossRef]
  62. Regev, S.; Rolison, J.J.; Moutari, S. Crash risk by driver age, gender, and time of day using a new exposure methodology. J. Saf. Res. 2018, 66, 131–140. [Google Scholar] [CrossRef] [PubMed]
  63. Popa, I.; Ferraro, O.E.; Orsi, C.; Morandi, A.; Montomoli, C. Bicycle helmet use patterns in Italy. A description and analysis of survey data from an Italian friends of cycling association. Accid. Anal. Prev. 2017, 108, 268–274. [Google Scholar] [CrossRef]
  64. Hardinghaus, M.; Papantoniou, P. Evaluating cyclists’ route preferences with respect to infrastructure. Sustainability 2020, 12, 3375. [Google Scholar] [CrossRef]
  65. Kummeneje, A.M.; Rundmo, T. Attitudes, risk perception and risk-taking behaviour among regular cyclists in Norway. Transp. Res. F Traffic Psychol. Behav. 2020, 69, 135–150. [Google Scholar] [CrossRef]
  66. Lehtonen, E.; Havia, V.; Kovanen, A.; Leminen, M.; Saure, E. Evaluating bicyclists’ risk perception using video clips: Comparison of frequent and infrequent city cyclists. Transp. Res. F Traffic Psychol. Behav. 2016, 41, 195–203. [Google Scholar] [CrossRef]
  67. Von Stülpnagel, R.; Lucas, J. Crash risk and subjective risk perception during urban cycling: Evidence for congruent and incongruent sources. Accid. Anal. Prev. 2020, 142, 105584. [Google Scholar] [CrossRef] [PubMed]
  68. Schepers, P.; Agerholm, N.; Amoros, E.; Benington, R.; Bjørnskau, T.; Dhondt, S.; de Geus, B.; Hagemeister, C.; Loo, B.P.; Niska, A. An international review of the frequency of single-bicycle crashes (SBCs) and their relation to bicycle modal share. Inj. Prev. 2015, 21, e138–e143. [Google Scholar] [CrossRef]
  69. O’Hern, S.; Estgfaeller, N.; Stephens, A.N.; Useche, S.A. Bicycle rider behavior and crash involvement in Australia. Int. J. Environ. Res. Public Health 2021, 18, 2378. [Google Scholar] [CrossRef]
  70. O’Hern, S.; Willberg, E.; Fink, C.; Useche, S. Relationships among bicycle rider behaviours, anger, aggression, and crashes in finland. Safety 2022, 8, 18. [Google Scholar] [CrossRef]
  71. Benhood, A.; Mannering, F. Determinants of bicyclist injury severities in bicycle-vehicle crashes: A random parameters approach with heterogeneity in means and variances. Anal. Methods Accid. Res. 2017, 16, 35–47. [Google Scholar] [CrossRef]
  72. O’Hern, S.; Stephens, A.N.; Young, K.; Koppel, S. Personality traits as predictors of cyclist behaviour. In Proceedings of the International Cycling Safety Conference—ICSC2019, QUT, Brisbane, QLD, Australia, 18–20 November 2019. [Google Scholar]
  73. Elvik, R.; Bjørnskau, T. Safety-in-numbers: A systematic review and meta-analysis of evidence. Saf. Sci. 2017, 92, 274–282. [Google Scholar] [CrossRef]
  74. Jacobsen, P.L. Safety in numbers: More walkers and bicyclists, safer walking and bicycling. Inj. Prev. 2015, 21, 271–275. [Google Scholar] [CrossRef]
  75. Phillips, R.O.; Ulleberg, P.; Vaa, T. Meta-analysis of the effect of road safety campaigns on accidents. Accid. Anal. Prev. 2011, 43, 1204–1218. [Google Scholar] [CrossRef]
  76. Latkin, C.A.; Edwards, C.; Davey-Rothwell, M.A.; Tobin, K.E. The relationship between social desirability bias and self-reports of health, substance use, and social network factors among urban substance users in Baltimore, Maryland. Addict. Behav. 2017, 73, 133–136. [Google Scholar] [CrossRef]
Figure 1. Absolute frequency and relative percentage of cyclists deceased in relation to the total number of traffic crash fatalities registered in the UE. Note: Data for the years 2011 and 2012 are not available in official records.
Sustainability 16 03193 g001
Figure 2. Summary of the research design and step-by-step (sequential) execution of the present study.
Sustainability 16 03193 g002
Figure 3. Differences in riding behaviors (violations, errors and positive behaviors) according to riders’ core reasons for cycling.
Sustainability 16 03193 g003
Figure 4. Differences in self-reported cycling behaviors between cyclists who have crashed and cyclists who have not.
Sustainability 16 03193 g004
Figure 5. Path analysis of cycling behavioral factors as predictors of self-reported cycling crashes in the last 5 years. Notes: Controlling for age, gender, main motive of use, and weekly exposure; N/S non-significant path; ** paths were significant at the level p < 0.010.
Sustainability 16 03193 g005
Table 1. Sociodemographic data of the sample.
Demographic FeatureCategoryTotal
n%
GenderFemale11831.6%
Male25668.4%
Total374100.0%
Age range <20 years12533.4%
20–2318348.9%
>236617.7%
Total374100.0%
OccupationStudying29879.7%
Working5314.2%
Other236.1%
Total374100.0%
Cycling weekly intensity<1 h15541.4%
1–2 h6918.4%
2–5 h6517.4%
6–10 h7319.5%
>10 h123.2%
Total374100.0%
Main reason(s) for cyclingDaily commuting/work7921.1%
Sport/fitness17747.3%
Leisure22459.9%
Table 2. Pearson’s bivariate correlation coefficients between individual, behavioral and self-reported crash-related study variables.
Study Variable1234567
1Weekly cycling intensity-
2Self-rated performance0.104 *-
3Road rule knowledge−0.0420.586 **-
4Risk perception−0.0260.466 **0.837 **-
Cycling Behavior
5Violations0.211 **0.005−0.137 **−0.088-
6Errors0.159 **−0.061−0.232 **−0.163 **0.891 **-
7Positive behaviors−0.0240.608 **0.601 **0.635 **−0.176 **−0.192 **-
Safety outcomes
8Self-reported cycling crashes0.381 **−0.146 **−0.315 **−0.229 **0.425 **0.461 **−0.242 **
Notes: * Correlation is significant at the level p < 0.050; ** Correlation is significant at the level p < 0.010.
Table 3. Variables included in the path model, estimates, significance levels and 95% confidence intervals for bootstrap bias-corrected coefficients.
PathSPC aS.E. bC.R. cp  dBootstrap Bias-Corrected Values e
Est fS.E. b95% CI gp  d
Cycling behavioral factors as predictors of self-reported cycling crashes
Traffic ViolationsCycling crashes0.0650.2170.6310.5280.0640.121−0.1380.3310.712
ErrorsCycling crashes0.3790.2163.761***0.3800.1280.0780.587**
Positive BehaviorsCycling crashes−0.1630.099−3.513***−0.1610.049−0.249−0.056**
Notes for the table: a SPC = Standardized Path Coefficients (β-linear regression weights); b S.E. = Standard Error; c C.R. = Critical Ratio; d p-value: ** significant at the level p < 0.010; *** significant at the level p < 0.001; e bootstrapped model coefficients (bias-corrected); f bootstrapped model standardized estimates (bias-corrected); g confidence interval at the level of 95% (lower bound—left; upper bound—right).
Disclaimer/Publisher’s Note: The statements, opinions and data contained in all publications are solely those of the individual author(s) and contributor(s) and not of MDPI and/or the editor(s). MDPI and/or the editor(s) disclaim responsibility for any injury to people or property resulting from any ideas, methods, instructions or products referred to in the content.

