1. Introduction
The acceleration of global urbanization [
1,
2,
3,
4] has led to the continuous expansion of urban scale and changes in surface cover conditions, contributing to the increasingly severe urban heat island effect (UHI). According to the United Nations’ 2022 World Cities Report, the global urban population is projected to increase from 56% in 2021 to 68% by 2050. Since the 1978 Reform and Opening-up, China’s urbanization rate has surged [
5,
6]. This rapid urbanization has significantly altered urban land use patterns [
7,
8], increased impervious surfaces [
9,
10,
11], reduced blue–green spaces, and changed surface thermal properties, all contributing to UHI formation [
12,
13,
14,
15,
16,
17]. Hangzhou, a city with cold winters and hot summers [
18,
19,
20,
21,
22], experiences significant seasonal variations that impact its urban thermal environment [
23]. The city’s climate characteristics lead to especially prominent seasonal variations in land surface temperature (LST) [
24,
25]. High summer temperatures intensify UHI and aggravate heat stress [
26], while low winter temperatures may reduce outdoor thermal comfort. Therefore, investigating seasonal LST variations is vital for assessing and responding to the urban thermal environment [
27,
28].
Planners have implemented various measures to mitigate UHI and enhance the urban thermal environment [
29,
30,
31]. While the cooling island effect of urban water bodies (UCI) has been extensively studied, most research focuses on small-scale individual water bodies [
32]. UCI is recognized as a natural and economically efficient means to alleviate the UHI. It is driven mainly by urban water bodies and green spaces, which reduce ambient temperatures through evapotranspiration [
33] and sunlight reflection/scattering, offering cooler surroundings for urban dwellers [
34,
35]. Recent UCI research demonstrates a multidisciplinary and integrated approach, focusing on advanced technologies and innovative planning to alleviate UHI [
36]. UCI intensity is typically assessed using two main approaches [
37,
38,
39,
40]. In this field, remote sensing and GIS technologies are crucial for obtaining and analyzing city-wide LST information. QGIS 3.28.0 processes these data to identify cool island areas and their relationships with urban planning features [
41]. The research aims to maximize UCI by adjusting urban layouts, including enhancing greenery and water bodies [
42]. Another key research area is the link between climate change and UCI. Integrated assessments, such as evaluating ecosystem services and health impacts, are also applied. Seasonal analyses provide a wider view of UCI’s temporal variations.
Further research is necessary to bridge three critical gaps in UCI understanding [
43,
44,
45]. Firstly, most research has focused on large-scale city variations and planning, rather than small-scale, high-resolution analysis. Secondly, additional spatial variables, such as gradient changes across distances and surroundings, must be considered for their influence on UCI, beyond factors like land area and land use/land cover. Lastly, while most studies concentrate solely on summer conditions, a comprehensive evaluation requires an integrated analysis across all seasons. Addressing these limitations through localized, multidimensional, and temporally extensive approaches will enable more targeted and impactful strategies for sustainable urban development and climate change adaptation.
In the context of exploring spatiotemporal urban land use/cover changes and their impacts on the urban thermal environments, the relationship between urban disasters—especially flooding and typhoons—and urban cool island (UCI) phenomena becomes pivotal. Such catastrophic events critically disrupt urban thermal regulation, leading to substantial alterations in urban land use and cover (LULC). We spotlight Hangzhou’s vulnerability to these disasters and their capacity to erode key UCI components, namely urban green spaces and water bodies. Consequently, this underscores the necessity for disaster-resilient urban planning that ensures the longevity and efficacy of UCI strategies amidst and following such calamities. This revision underscores the importance of integrating disaster resilience into urban thermal environment analysis, propelled by insights on the impact of urban structure integrity and adaptability on thermal comfort and UCI effectiveness post-disaster. Recent studies have highlighted the necessity of incorporating disaster resilience into the analysis of urban thermal environments to enhance sustainability. For instance, the progressive collapse behavior of composite substructures under extreme conditions demonstrates the intricate relationship between structural integrity and thermal performance. Similarly, advances in understanding disproportionate collapse emphasize the need for robust design strategies that account for thermal sustainability in the face of such disasters.
This study aims to use remote sensing and GIS to investigate the UCI effects and seasonal changes in Hangzhou’s main water bodies and their impact on LST. Satellite data are used to construct LST models, in combination with GIS technologies to acquire appropriate LST data. Classification and statistical analysis methods assess the efficiency of the cooling effects of water bodies. This study aims to discuss cool island effects across various water bodies and land uses, analyzing how major water bodies seasonally regulate surrounding thermal environments. The findings could provide a basis for planning large water parks as a strategy to alleviate the UHI effect.
2. Study Area and Data Source
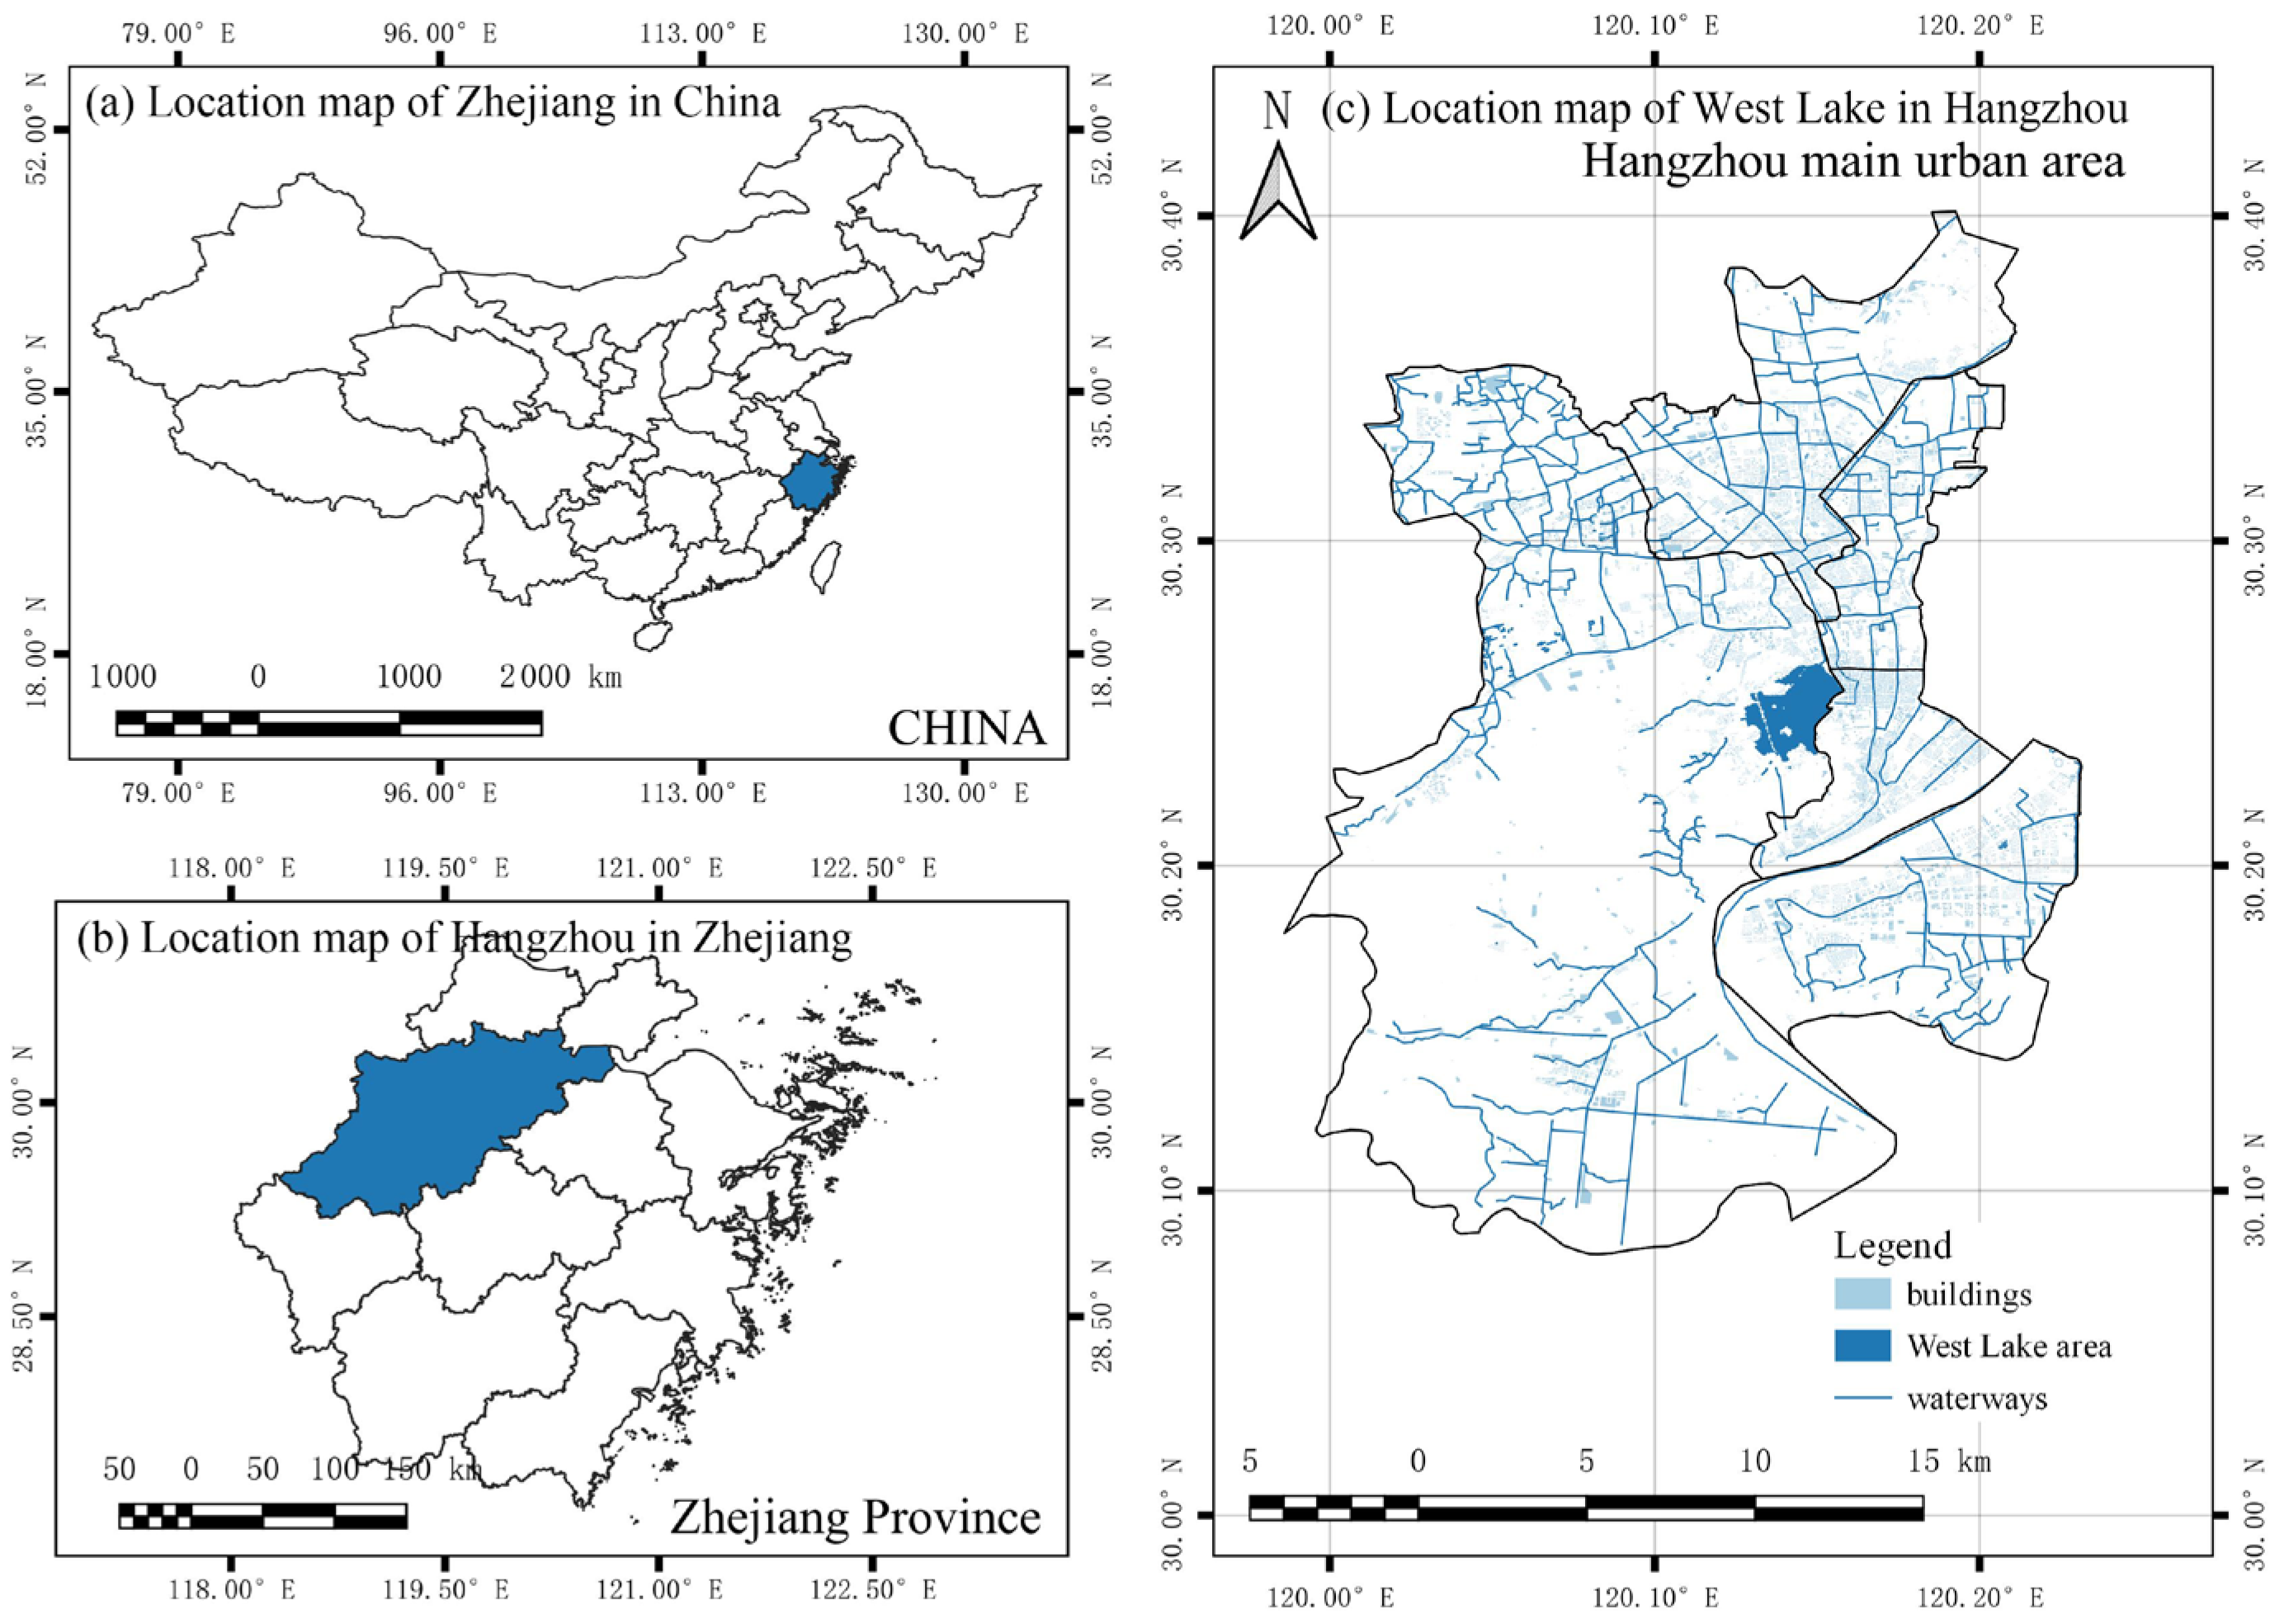
2.1. Study Area Description
Hangzhou is located on the southern bank of the Yangtze River Delta, downstream from the Qiantang River, extending from 118°20′ E to 120°44′ E longitudinally and from 29°11′ N to 30°34′ N latitudinally. The region has a humid subtropical climate characterized by hot summers. Renowned for its rich natural resources and unique urban layout, Hangzhou stands as a critical eco-garden city in China. As of 2020, Hangzhou’s urban green coverage rate reached 40.29%, with 406 parks covering approximately 6686.53 km
2. The city’s core area, covering about 312.43 km
2, provides essential ecological services and leisure space. Additionally, as the Yangtze River Delta’s southern core, it covers 16,596 km
2 and has an estimated population of 11,936,000. Centered around West Lake, the city boasts a diverse park system, including wilderness, urban, community, and pocket parks, totaling over 300 parks and green spaces exceeding 4000 m
2. Hangzhou’s core, adjoining Xihu, Shangcheng, Xiacheng, and Jianggan districts, is distinguished by its unique ecological roles and rich cultural significance, making it an excellent research subject. The extensive waters and vegetation of West Lake significantly influence the urban environment, acting as a vital buffer zone for the thermal milieu. The district, as shown in
Figure 1, represents Hangzhou’s core metropolitan area, notable for its substantial population and size.
2.2. Data Sources
This study used high-quality Landsat 5, 7, and 8 satellite images from 1990 to 2020, as shown in
Table 1 and
Table 2. Images were selected for their clarity and minimal atmospheric interference. Preprocessing steps like cloud and shadow removal, atmospheric correction, and topographic normalization ensured data completeness and accuracy. Image data for February, May, August, and November were chosen to capture seasonal variations, sourced from the USGS Earth Explorer website. (
https://earthexplorer.usgs.gov/. accessed on 6 October 2023). Landsat 5 images have a resolution of 30 × 30 m, with their thermal infrared bands resampled to match the spectral band resolutions. Landsat 7 offers a 30 m resolution for spectral bands and includes the Enhanced Thematic Mapper Plus (ETM+) sensor, improving image quality over Landsat 5. Furthermore, Landsat 7’s thermal infrared bands have a 60 m resolution, between the 30 m resolution of its spectral bands and Landsat 8’s 100 m thermal infrared resolution. Landsat 8 offers a 30 m resolution for spectral bands and a 100 m resolution for thermal infrared bands. The images were calibrated for radiative and atmospheric conditions.
Land surface temperature (LST) data were derived by combining Landsat 5’s TM, Landsat 7’s ETM+, and Landsat 8’s OLI and TIRS sensor data, using an improved mono-window algorithm. These seasonal and annual data facilitated comprehensive analyses of land cover transformations and temperature shifts in Hangzhou and its environs.
2.3. Other Considerations
Accounting for all factors affecting urban cool island effects is crucial for the research’s thoroughness and accuracy. This study extends beyond land use analysis to include meteorological conditions, building and population densities, green space configurations, and water body characteristics. Data on these elements were sourced from meteorological stations, satellite imagery, population censuses, and field investigations, and processed using spatial analysis and statistical models. Climate conditions, building distributions, population patterns, and blue–green space configurations exhibit intricate relationships with the cool island phenomenon. Incorporating these factors reveals the mechanisms behind cool island formation, verifies research accuracy, and enhances the comprehensiveness and authenticity of the results. Thus, this study incorporates a broad array of factors beyond land use, offering a more comprehensive and accurate insight into urban cool island effects and informing urban planning and management.
3. Methodology
In choosing the right method, considerations include data characteristics, accuracy needs, and technical feasibility. The objective of this study was to meticulously analyze the urban cool island (UCI) effect across Hangzhou’s core area by examining land use/land cover (LULC) and land surface temperature (LST). This involved evaluating the advantages and limitations of various remote sensing data processing and analytical approaches. The choice of appropriate techniques is crucial to ensure the accuracy and reliability of the research findings.
3.1. LULC Classification
The maximum likelihood supervised classification approach, a probabilistic method widely used in remote sensing image categorization [
46,
47], assumes that sample sets for each classification conform to specific probability distributions, typically normal distributions. This method calculates the probabilities of a sample belonging to various categories and assigns it to the category with the highest probability. It requires training samples with known categories to estimate each class’s probability distribution parameters. In practical applications like LULC classification of remote sensing images, this method involves preprocessing steps such as object segmentation, spectral normalization, and setting a priori probability values for different object types. Additionally, integrating techniques like random forest can enhance the classification’s rationality and accuracy. Validated by ground truth data, this method has demonstrated high classification precision, with overall Kappa coefficients reaching 0.84.
For Landsat images, the maximum likelihood method considers mean values and covariance of category signatures, using specific band spectral characteristics for categorization. For example, specialized bands from Landsat 5, 7, and 8 satellites are used for image classification, considering the influences of thermal bands. All images are initially processed with Composite Bands using image processing tools to prepare for generating LULC maps. Additionally, land surface temperature variations are considered during the classification process, which covers a wide range of LULC categories such as building areas, vegetation, open land/agriculture, and water bodies.
3.2. Mono-Window Algorithm Inversion and GDA Correction-Based LST Downscaling Method
This study used mono-window algorithm inversion and GDA correction-based LST downscaling to derive temperature data from satellite images’ thermal infrared bands [
48,
49,
50]. The former utilizes sensor-specific gains and biases to calibrate digital values (DN) into radiance, then applies Plank function inverse transforms to obtain brightness temperature, considering the Landsat sensor constants K1 and K2. The second method seeks to match low-spatial-resolution LST data with high-spatial-resolution variables. This approach draws from seasonal LST data (
and
) in spring, summer, autumn, and winter between 1990 and 2020. These data are first extracted into point layers in QGIS. Then, multiple regression equations encompassing linear, quadratic, cubic, reciprocal, and logarithmic formulas are constructed to establish multivariate regression models, selecting the equation with the highest fitting accuracy as the downscaling algorithm to estimate LST (
and
). Subsequently, residual errors between original LST data and predicted LST are computed to obtain spatial residual grids (
and
). These residual values signify aspects not predictable by the regression models. Via simple spline interpolation, the residuals are interpolated into 30 m-resolution grid images (
), with multiple validations confirming optimal efficacy of spline interpolation. Finally, by applying multivariate regression models again based on 30 m
,
,
and
data,
can be recalculated and added to
to acquire ultimate 30 m-resolution downscaled LST data (
). This composite technique allowed for more detailed high-resolution analysis of LST data, enhancing urban heat island effect investigations.
3.3. Density Segmentation-Based LST Classification
Density segmentation was used to categorize LST data, facilitating the analysis of West Lake’s UCI effect on downtown Hangzhou and its spatiotemporal variations [
51,
52]. This approach relied on absolute LST values obtained through downscaling processes, aimed at minimizing meteorological influences. Specifically, the average land surface temperature (
A) and standard deviations (
SD) across the study areas were computed using specific formulas, facilitating a more accurate assessment of the UCI effect and its variations over time and space. This methodological approach enhances the understanding of how urbanization patterns and natural landscape features contribute to the urban thermal environment.
For setting different temperature thresholds (T) based on multiples of standard deviations (X).
As shown in
Table 3. By selecting diverse X values, LST data could be stratified into seven discrete levels encompassing “Extreme Cold Zone”, “Cold Zone”, “Cool Zone”, “Moderate Zone”, “Warm Zone”, “Hot Zone”, and “Extreme Hot Zone” for spatial distribution analyses regarding these temperature divisions to identify factors impacting UCI effects.
3.4. Water Body Shape Index Analysis
The water body shape index (WBSI) is a quantitative index assessing water body shape complexity and its interaction with the environment, crucial for UCI studies due to its insight into boundary intricacies affecting microclimates. The concept of the WBSI is based on the understanding that the physical configurations of water bodies, particularly their boundary perimeters, play vital roles in ecological processes and thermal exchanges in urban landscapes.
The WBSI provides a technique for thoroughly analyzing the UCI effects of major water bodies like rivers or lakes on ambient temperature, focusing on designated buffer zones surrounding each area, especially at landscape scales. In particular, the index encompasses two key aspects of water body boundary complexity: the length and irregularity of the boundary shape.
The calculation of the
WBSI is straightforward yet insightful. The
WBSI is defined as the ratio of the water body’s perimeter to the square root of its area, mathematically expressed as:
where
P represents the perimeter and
A represents the area of the water body. This calculation produces a dimensionless value that signifies the shape complexity of the water body. A higher
WBSI value indicates more intricate and irregular boundaries, suggesting stronger interactions between the water body and the surrounding landscape, which can influence local temperature and ecological dynamics.
3.5. Multidimensional Statistical Analysis of Land Surface Temperature Changes
This study applied a multidimensional methodology to analyze LST changes across Hangzhou’s West Lake and its vicinity [
53]. Firstly, a multivariate linear regression model was constructed to quantify the relationships between LST and the distance gradient from various land types near the lake. This model holistically considers the influences of distance gradient, the water body shape index (WBSI), and land use/land cover (LULC) as key explanatory variables on LST. Denoted as:
where
symbolizes the LST of the ith sample,
β denotes regression coefficients and
ε represents the error term.
β0 represents LST’s baseline in the regression model when all variables are zero.
β1 indicates LST change with distance from land types, where positive values mean higher LST with increased distance.
β2 measures the WBSI’s impact on LST, showing how water body shape and distribution changes affect temperature.
β3 evaluates how LULC types influence LST, with variations affecting temperature through sunlight interaction.
wk indicates the frequency of LST oscillations in time-series analysis, with high values signifying rapid changes. This model consolidates the effects of distance, the WBSI and LULC as pivotal predictors on LST.
Regarding time-series analysis, monthly LST data underwent Fourier transformation to decompose periodic and nonperiodic constituents through formulas:
where
ω denotes angular velocity,
t refers to time and
,
represents Fourier coefficients. By testing obtained dominant periodic terms, intrinsic patterns behind LST seasonal variations could be revealed.
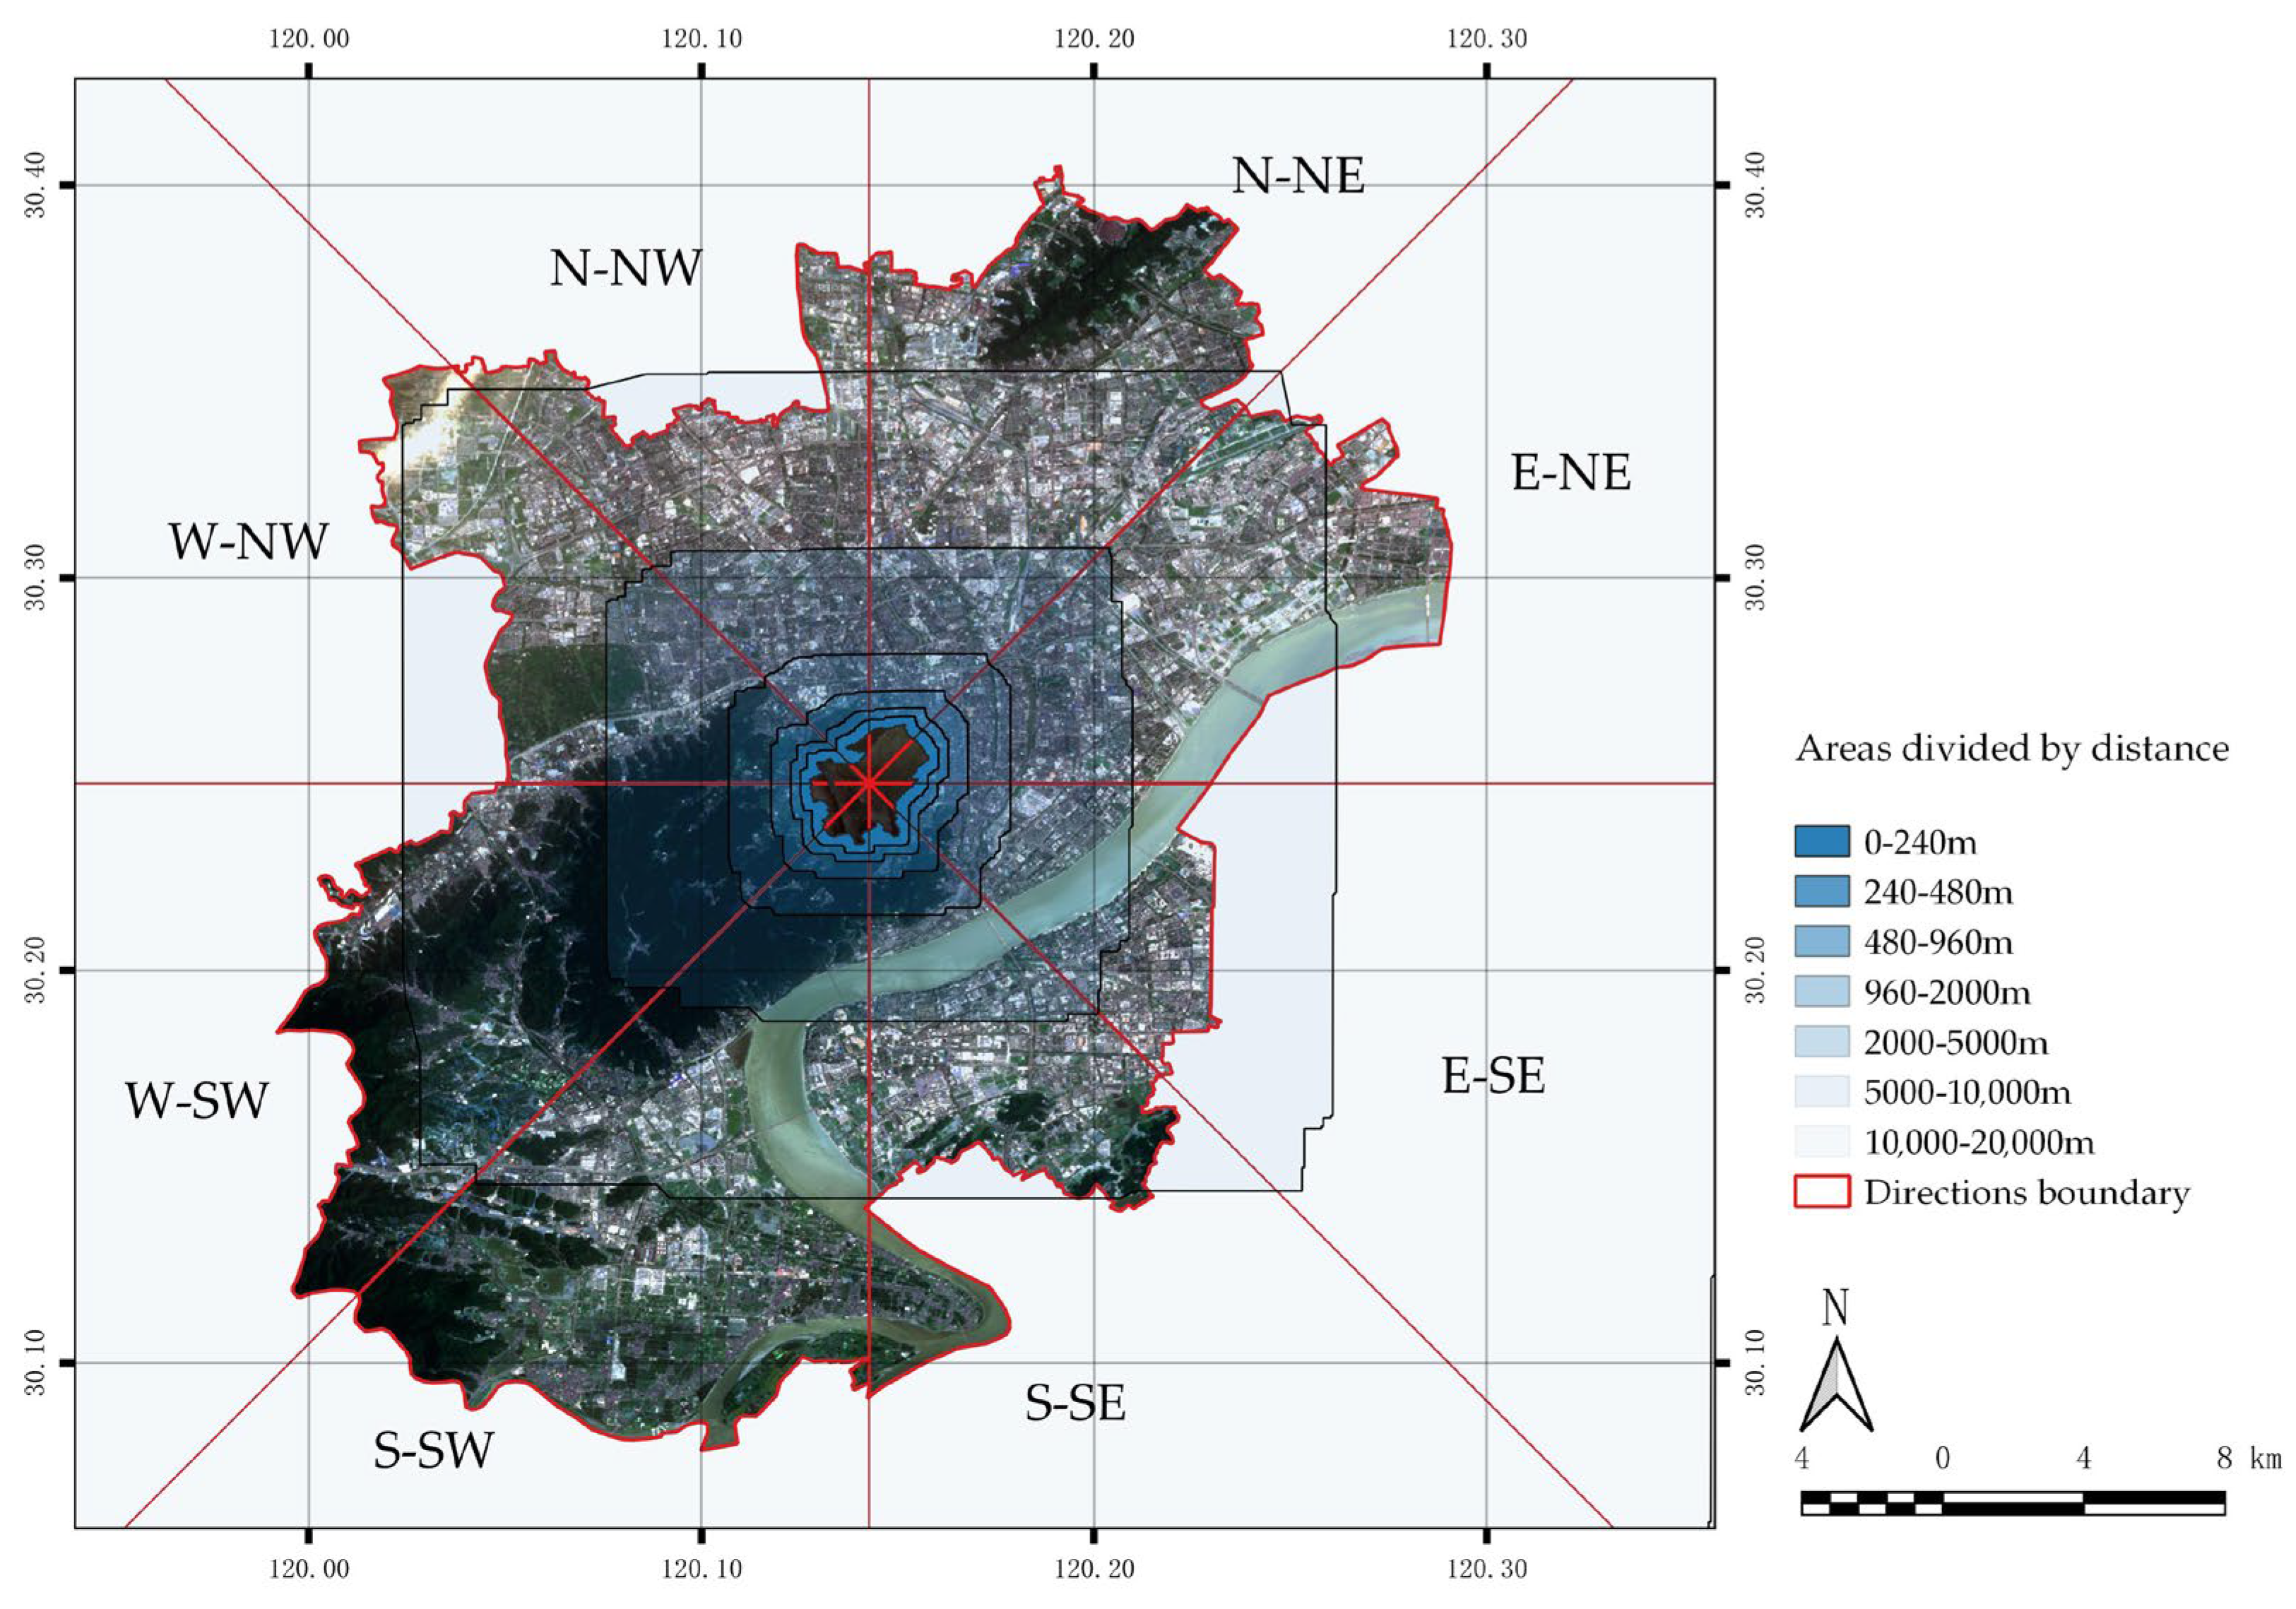
Autoregressive, moving average, and autoregressive moving average models, combined with Fourier transformation, were used to analyze LST from 1990 to 2020, identifying long-term trends, fluctuations, and oscillations. Gradients encompassing 240 m, 480 m, 960 m, 2 km, 5 km, and 10 km distances were incorporated, with 360° space uniformly split into 8 directions to examine seasonal land surface temperature shifts comprehensively, as shown in
Figure 2. LST change patterns across varied spatiotemporal scales could be grasped, and associations with seasonal variations could be uncovered via this multidimensional approach.
4. Results
4.1. Land Use and Land Cover Indicators and Spatial Index Variations
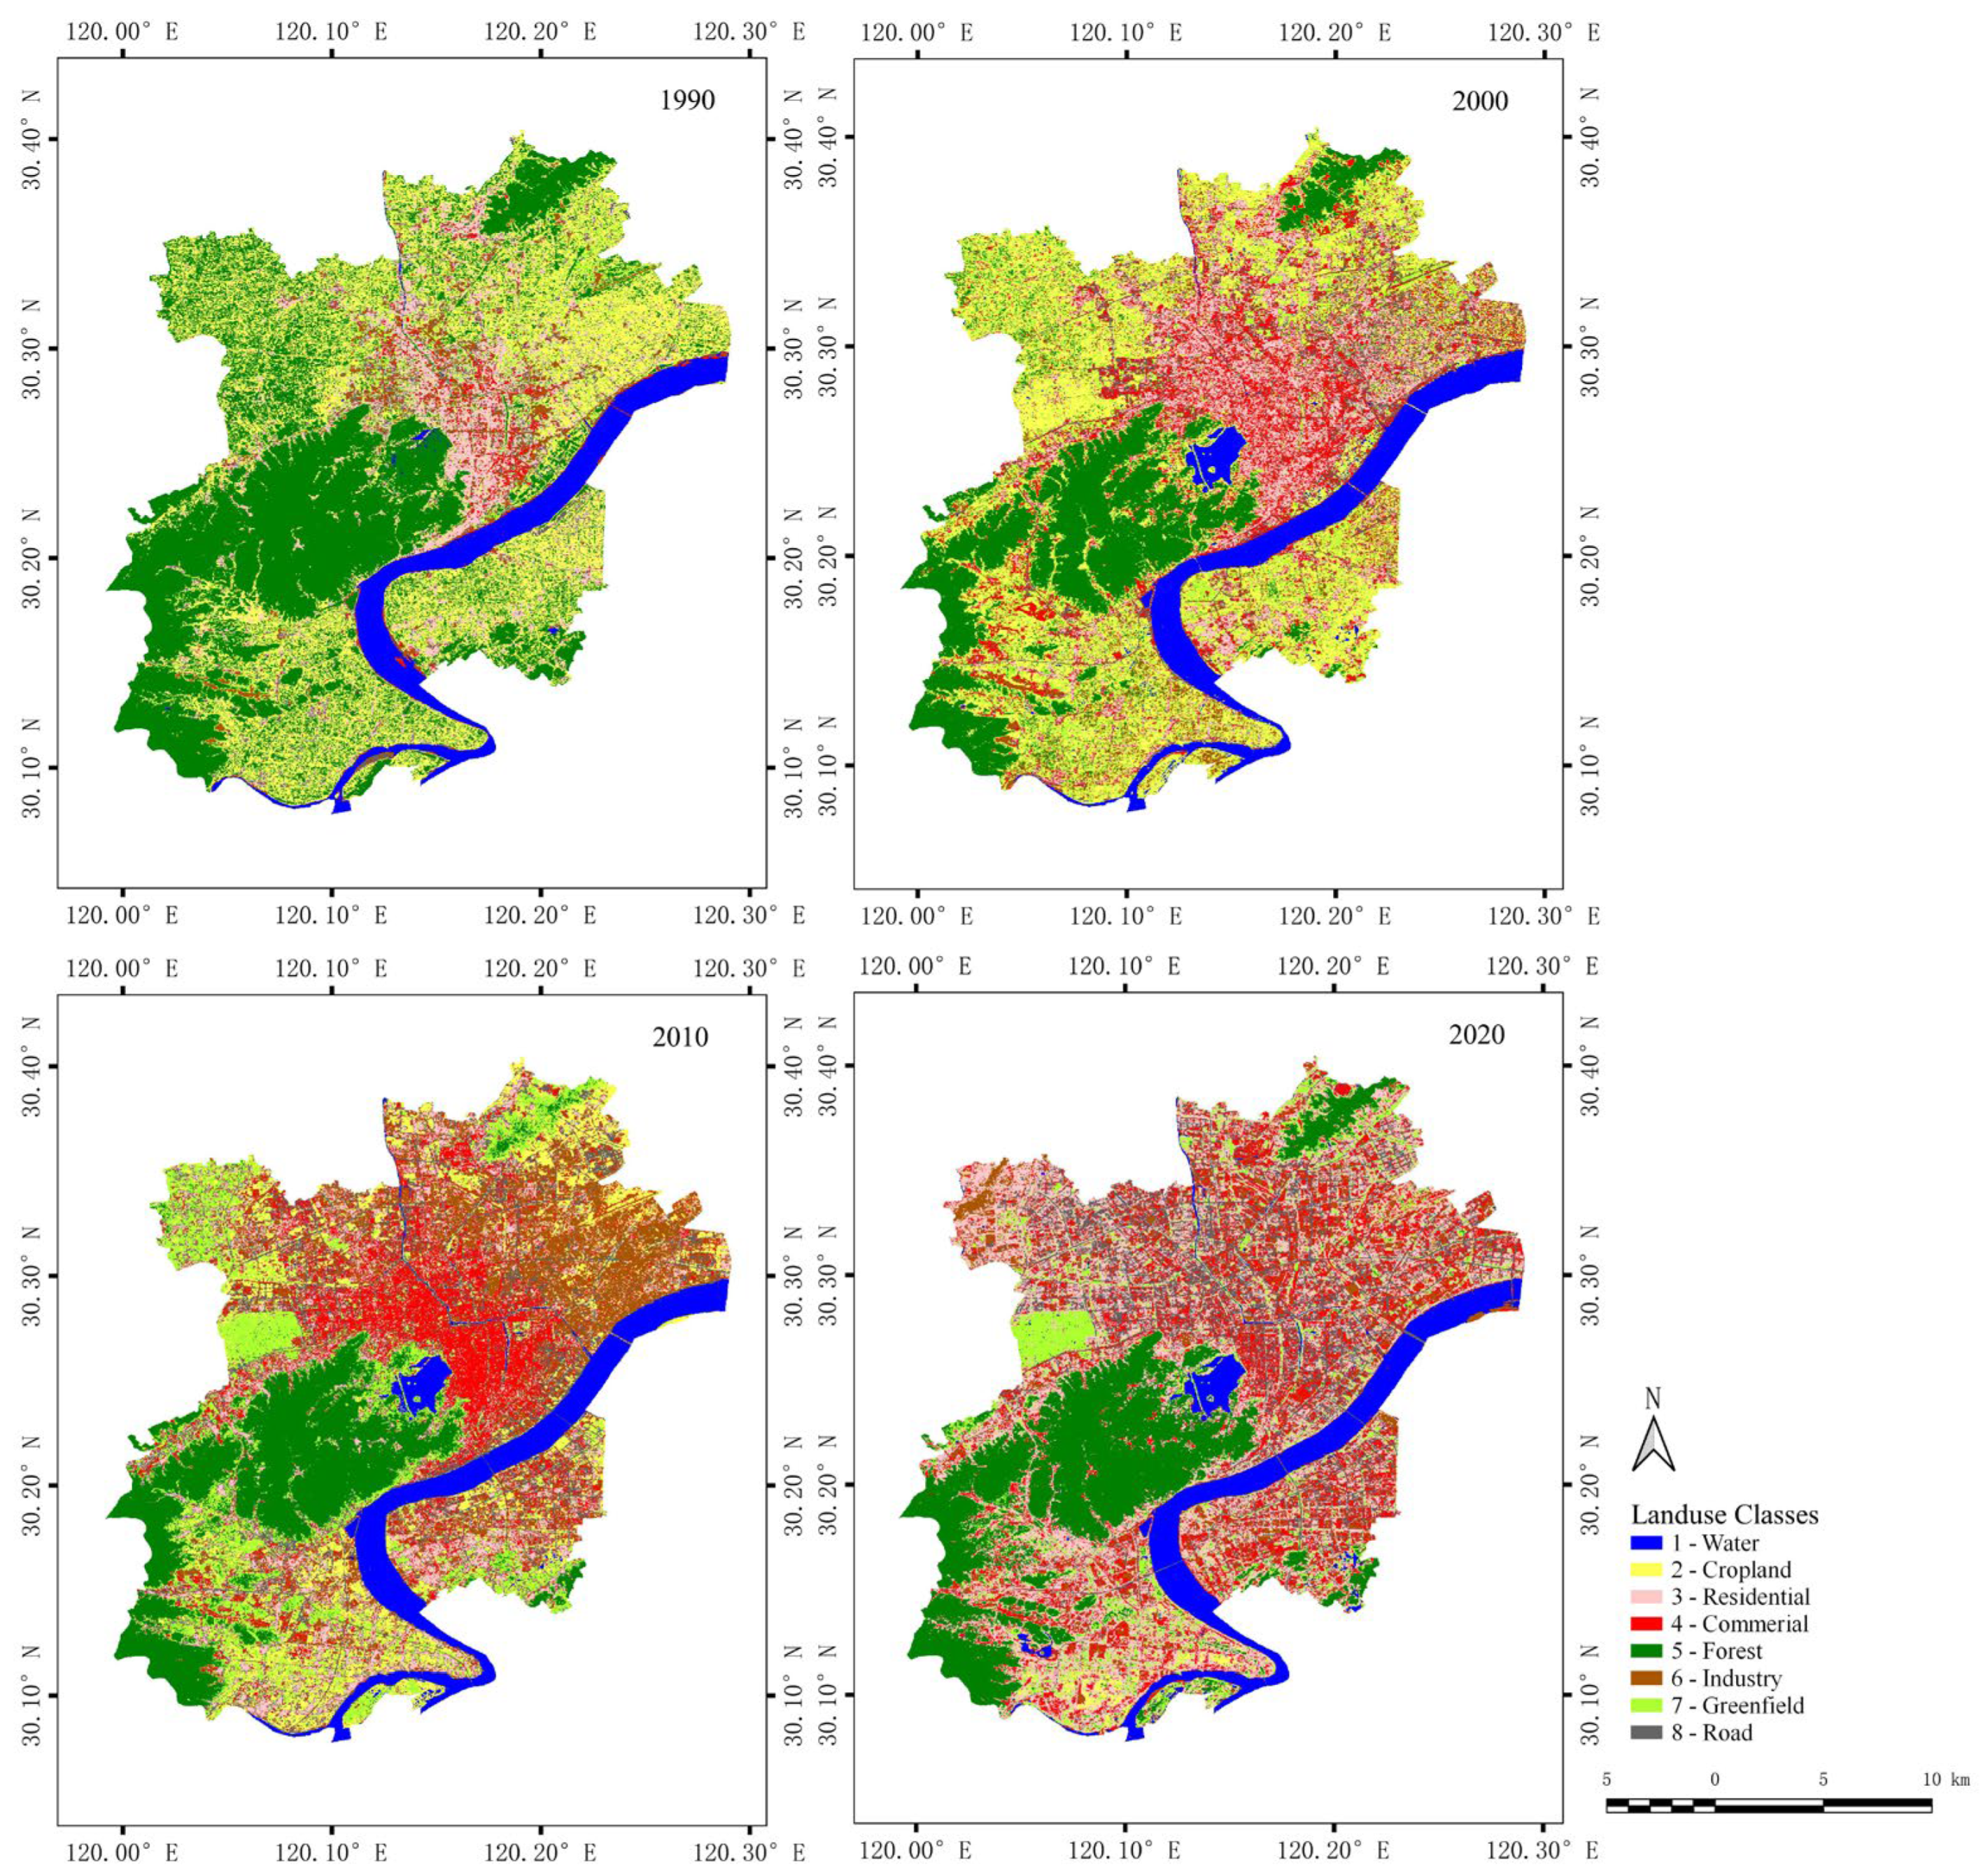
Over the past 30 years, Hangzhou has seen significant LULC changes, reflecting its dynamic urbanization and demographic changes. These transformations were comprehensively analyzed using the maximum likelihood supervised classification approach applied to Landsat image data from 1990, 2000, 2010, and 2020. The overall accuracies and Kappa coefficients of this analysis, ranging from 0.86 to 0.95 (0.95, 0.86, 0.89, and 0.88, respectively), underscore the reliability of the classification techniques used.
The LULC changes, shown in
Figure 3 and
Figure 4, and
Table 4, depict Hangzhou’s transition from agriculture to urbanization. This transition has been driven by economic growth, increasing population, and evolving urban planning strategies. The spatial distribution of these changes indicates a more pronounced transformation in the central and eastern parts of the city. Meanwhile, the outskirts have largely preserved their natural and agricultural characteristics.
The specific LULC changes detailed in
Figure 3 and
Table 4 include a dramatic decline in arable land, a significant expansion of residential and commercial areas, an initial decrease followed by a recovery of forested areas, a substantial expansion of infrastructure, particularly roads, and a fluctuation in industrial land use. Water bodies have remained stable, showcasing effective resource management during urban growth.
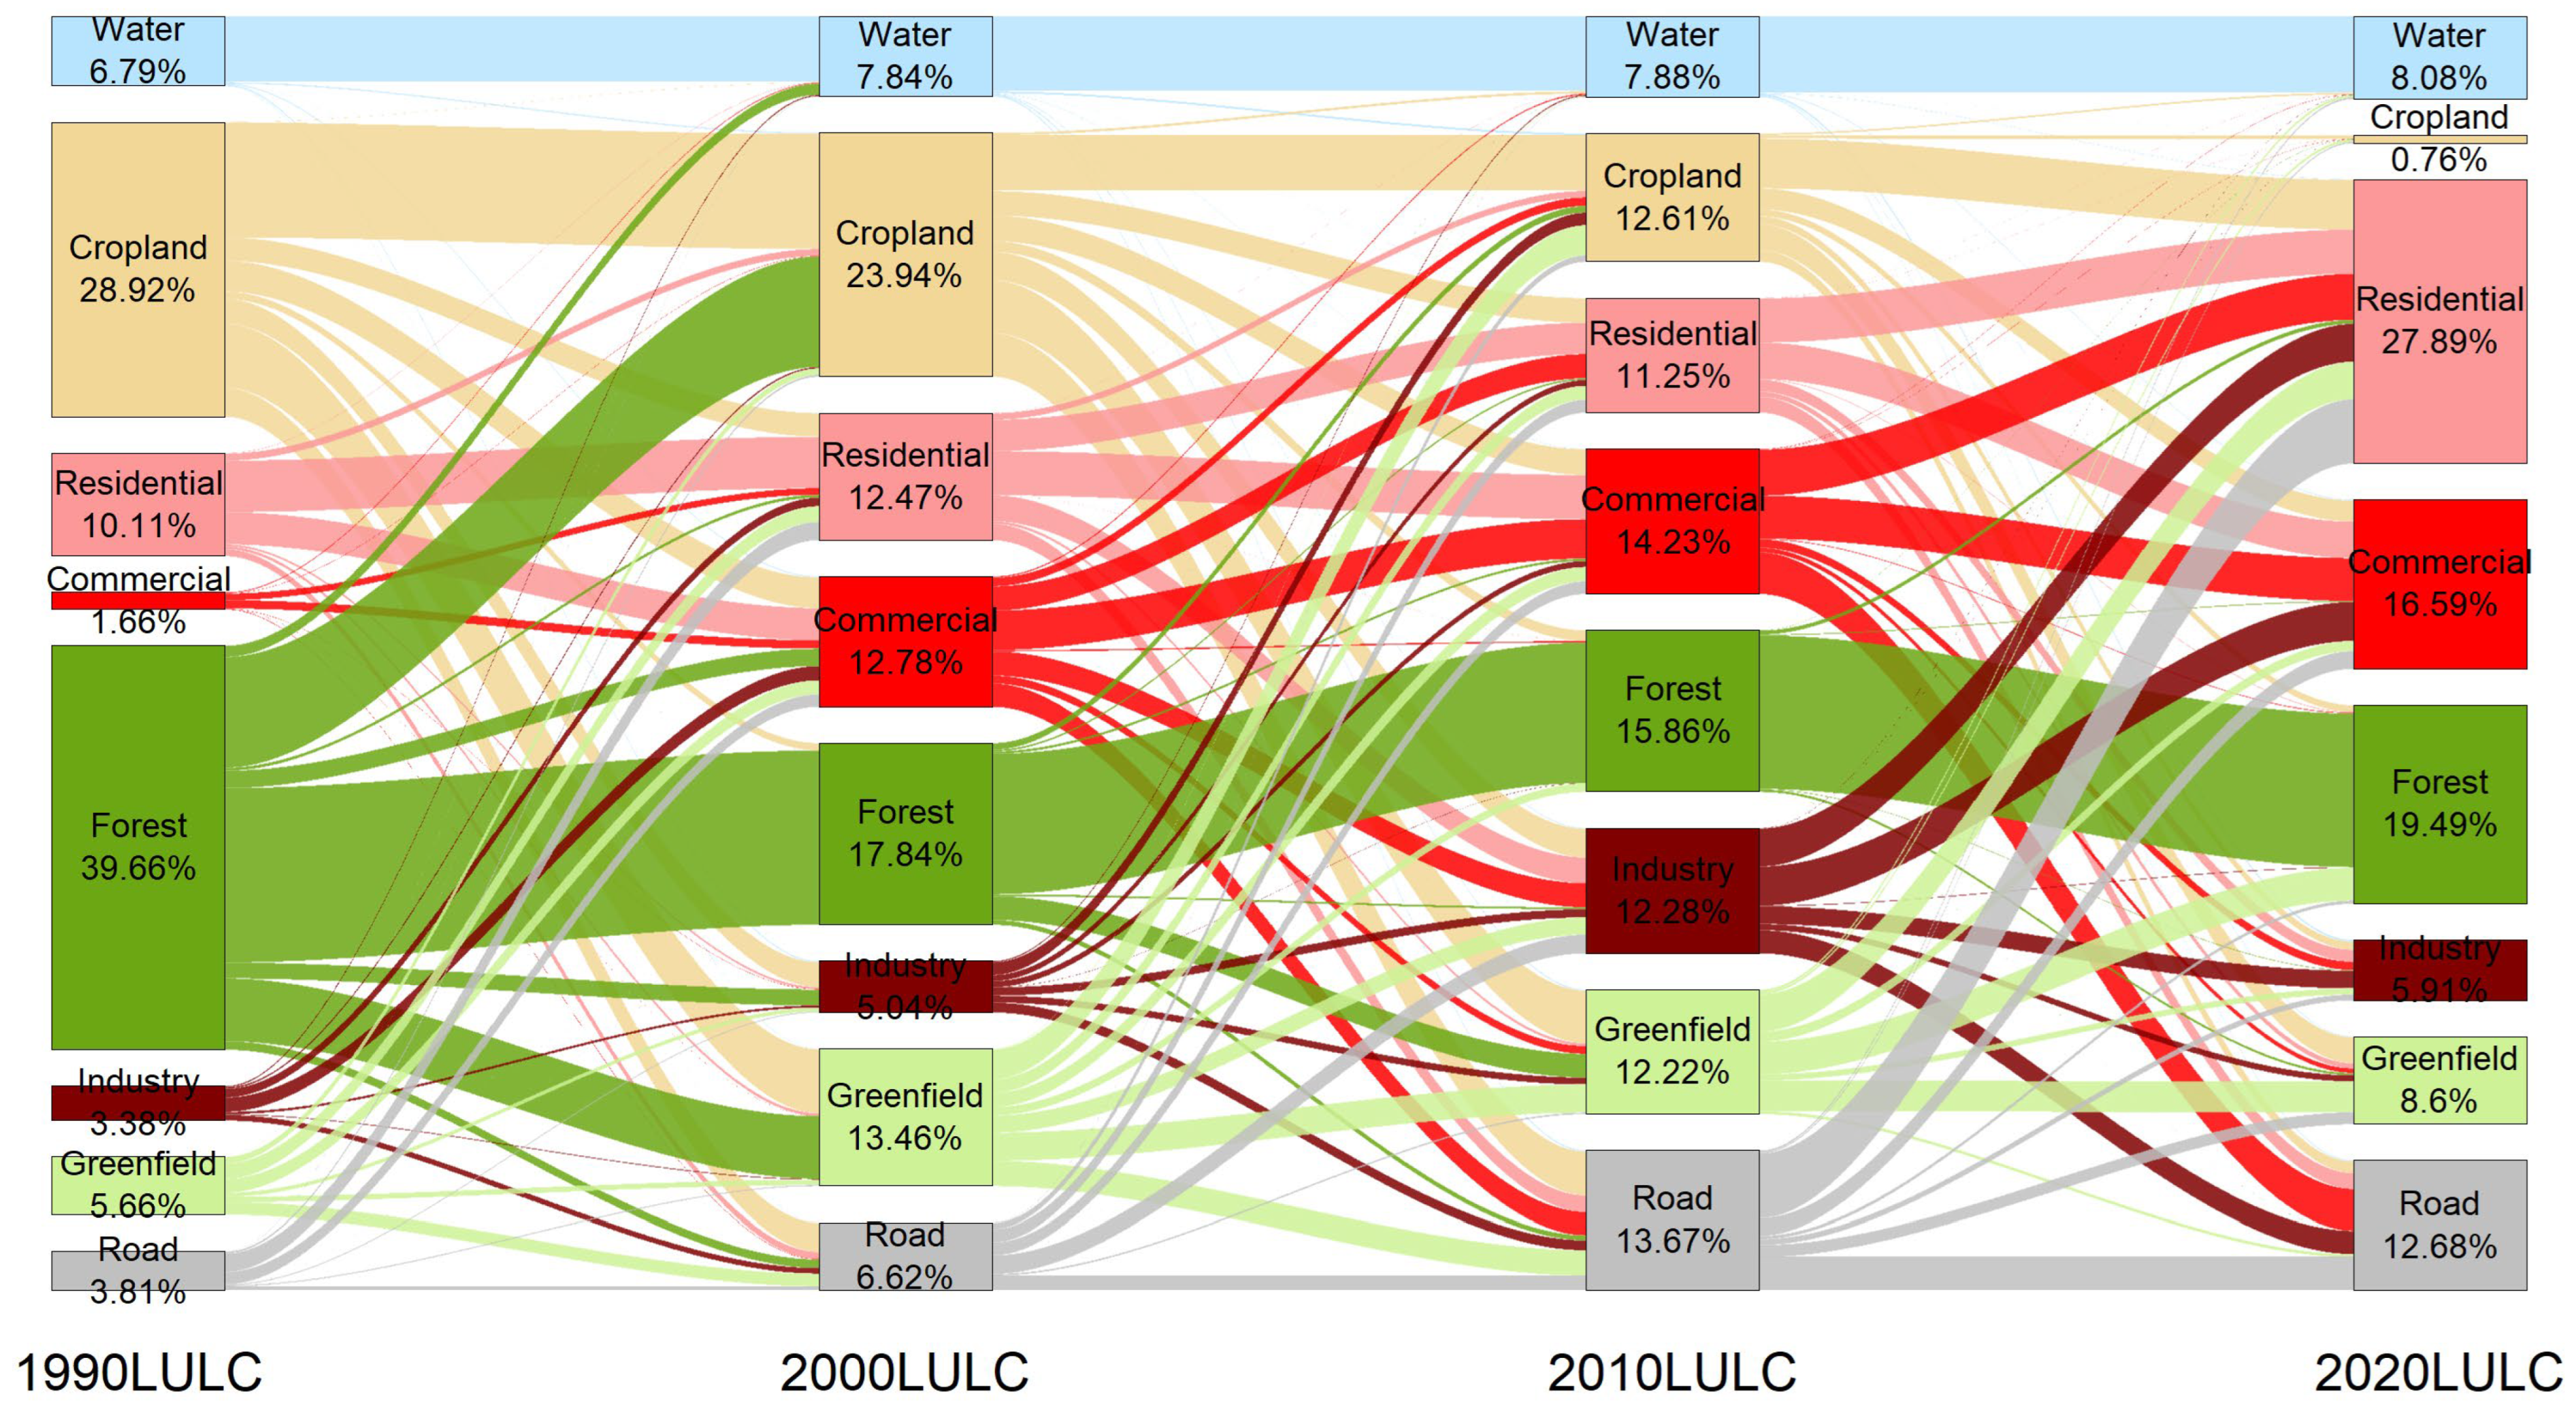
Notable transitions between LULC types over the decades, as shown in the Sankey Diagram in
Figure 4, include a persistence of commercial land use, the transformation of green fields into residential and commercial areas, and the conversion of commercial and cropland areas into residential zones.
4.2. Spatiotemporal Variabilities Characteristics in Land Surface Temperatures of Hangzhou Core Area over the Past 30 Years
Using a single-channel algorithm, surface temperatures in Hangzhou were extracted from Landsat satellite imagery for the years 1990, 2000, 2010, and 2020. Median and mean temperature values for each land use type for each season in these years were selected as reference indices, as detailed in
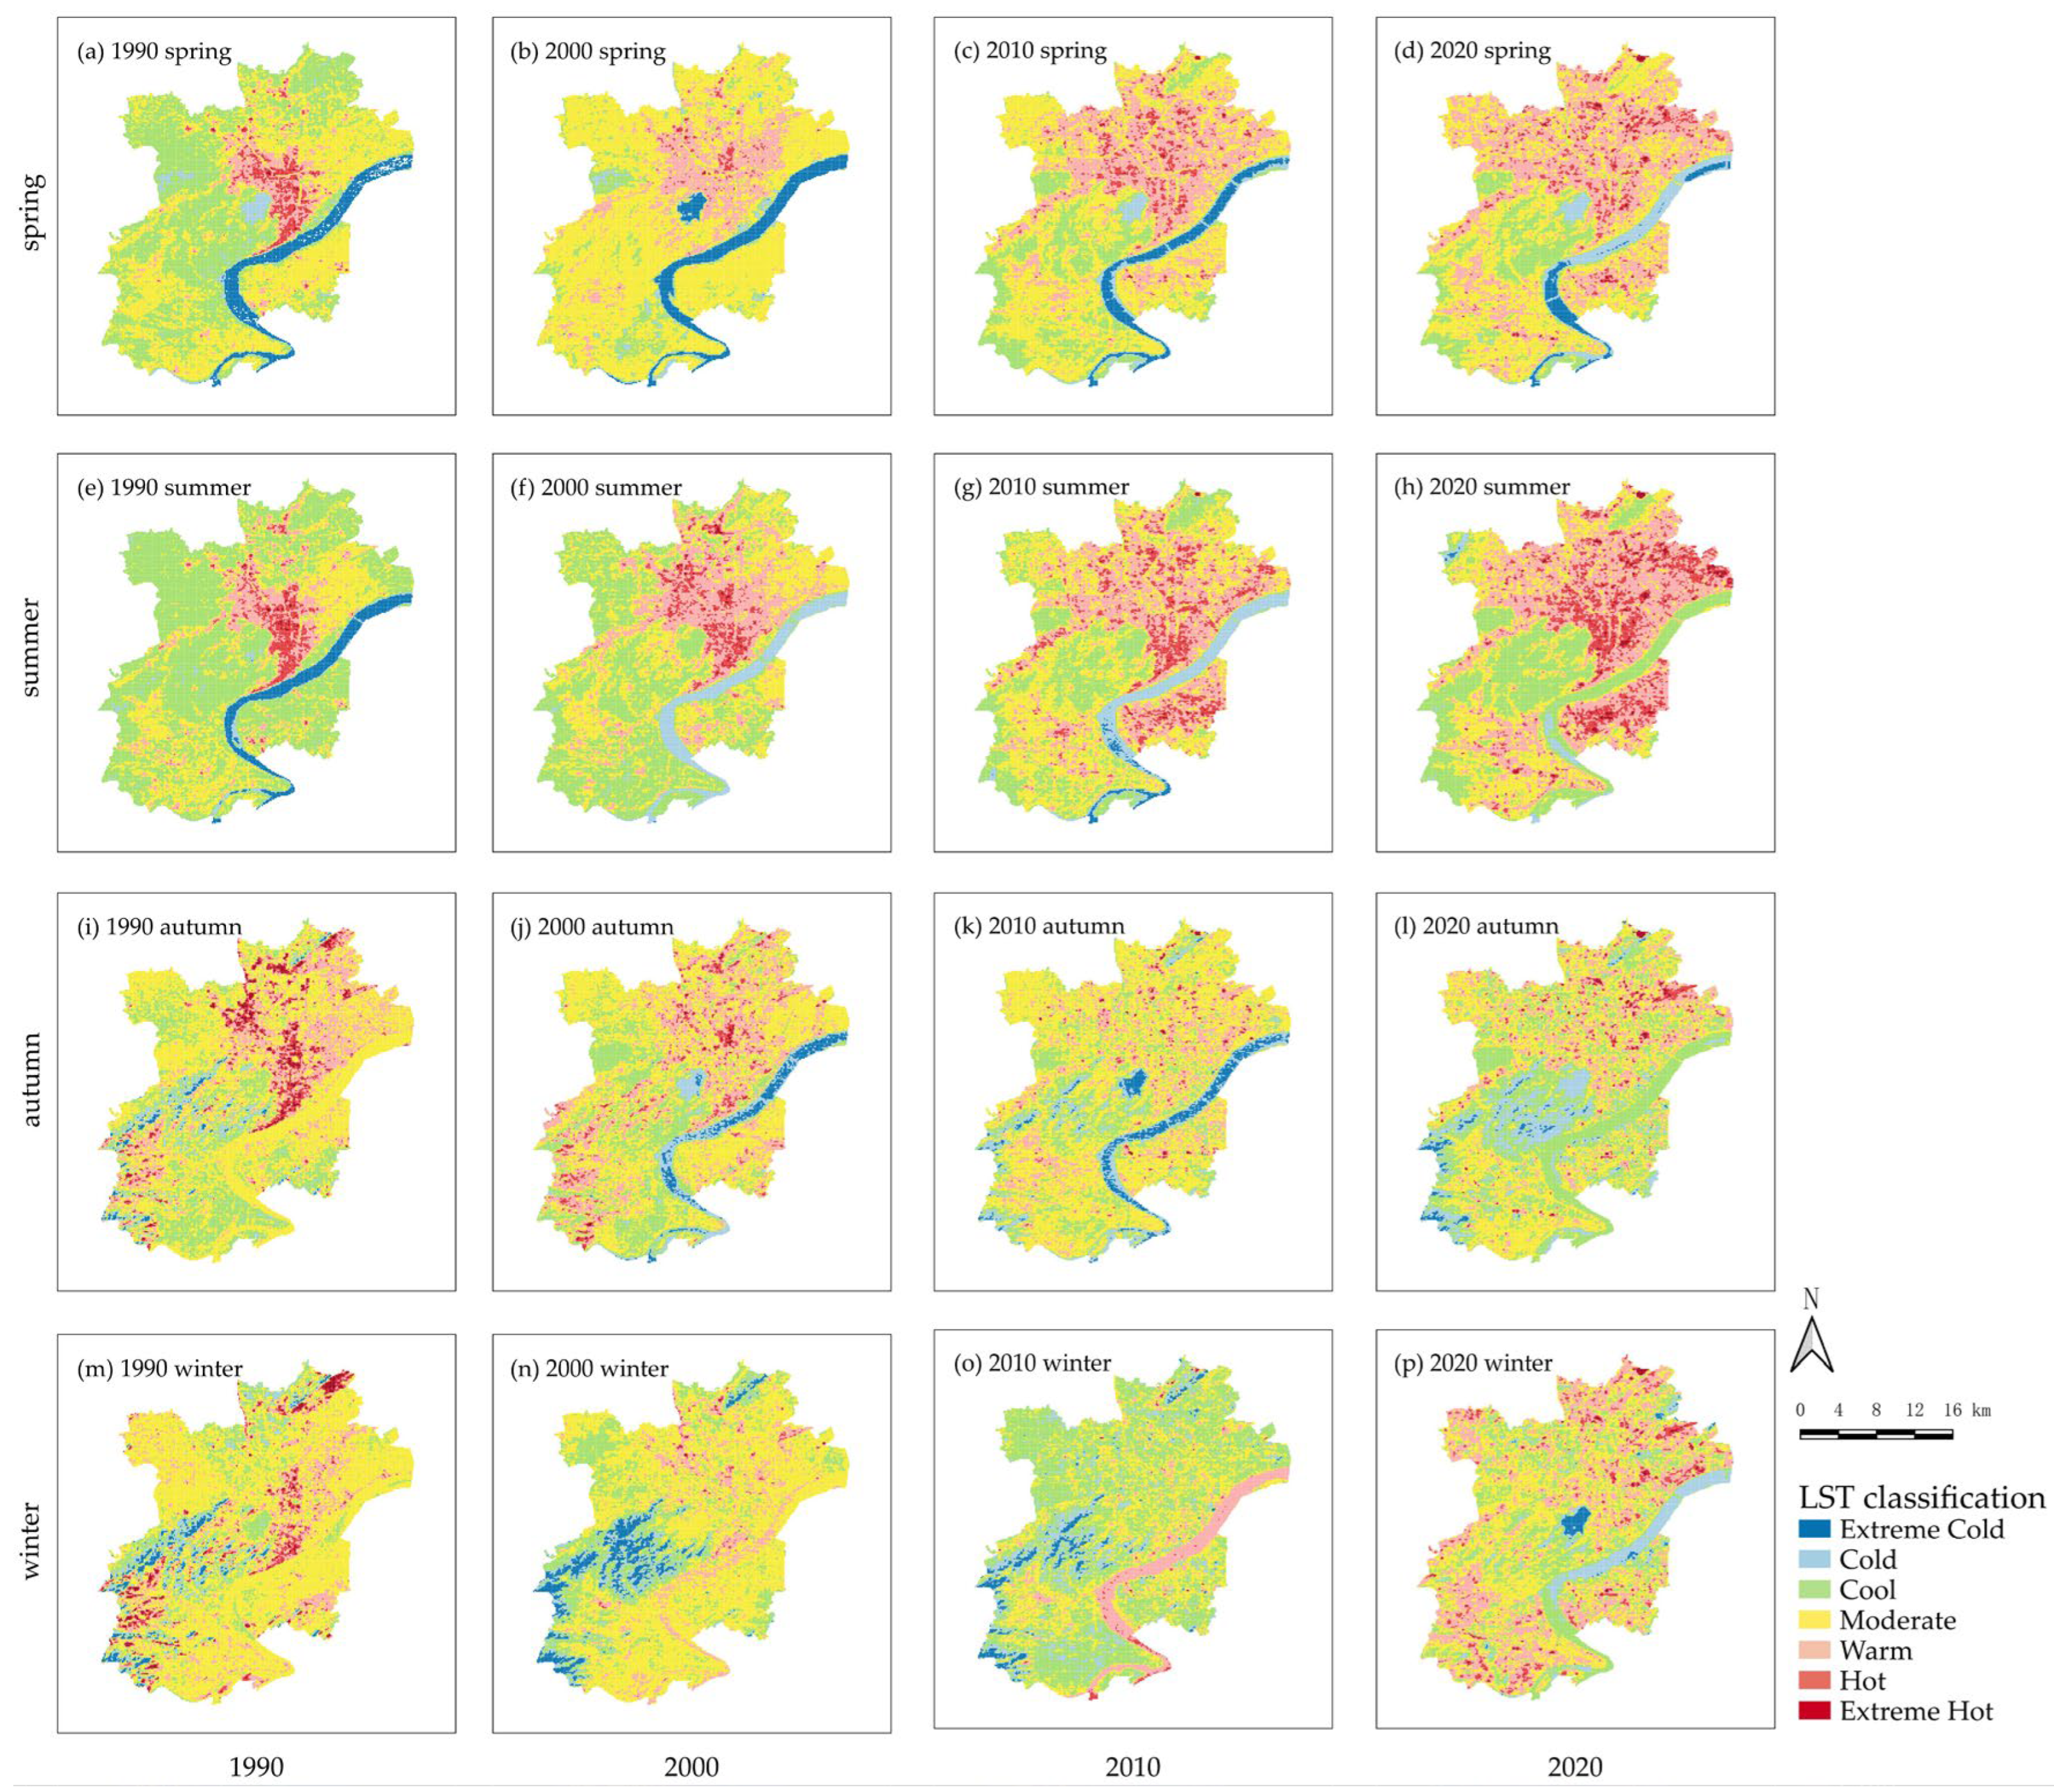
Table 5. Density segmentation was used to analyze Hangzhou’s surface temperature distribution across seasons, shown in
Figure 5 and
Figure 6. The analysis revealed that major water bodies in Hangzhou, notably West Lake, were significant cool island areas in summer, with surface temperatures approximately 2.1 °C lower than the surrounding urban developed areas.
Analysis from 1990 to 2020 revealed that cool temperature zones in spring outnumbered other temperature zones across all areas each season. This trend highlights the strong correlation between urban heat island effects and seasonal changes, with the cooling effect most significant in summer at West Lake, followed by spring and autumn, and least noticeable in winter.
Statistical analysis from 1990 to 2020 indicated an upward trend in the rate of change in surface temperatures for all land use categories, except water bodies. For example, the average summer temperature in forested areas increased from 25.28 °C in 1990 to 26.52 °C in 2020. In contrast, temperature fluctuations in water bodies and forests were relatively stable, with a standard deviation controlled below 0.8 °C, reflecting their lower degree of urbanization. The data also reflected the monsoon climate characteristics of Hangzhou, with a significant temperature difference between summer and winter in 2020.
5. Discussion
5.1. Spatial Variability Analysis of LST
The spatial variability analysis of land surface temperature (LST) revealed distinct spatial patterns linking urban expansion with an increase in surface temperature. These patterns demonstrate how urban materials accumulate heat and how reduced vegetation intensifies the urban heat island (UHI) effect. With land use/land cover (LULC) changes, LST is generally higher in urban construction and industrial areas, and lower in green spaces and water bodies, especially around the West Lake area.
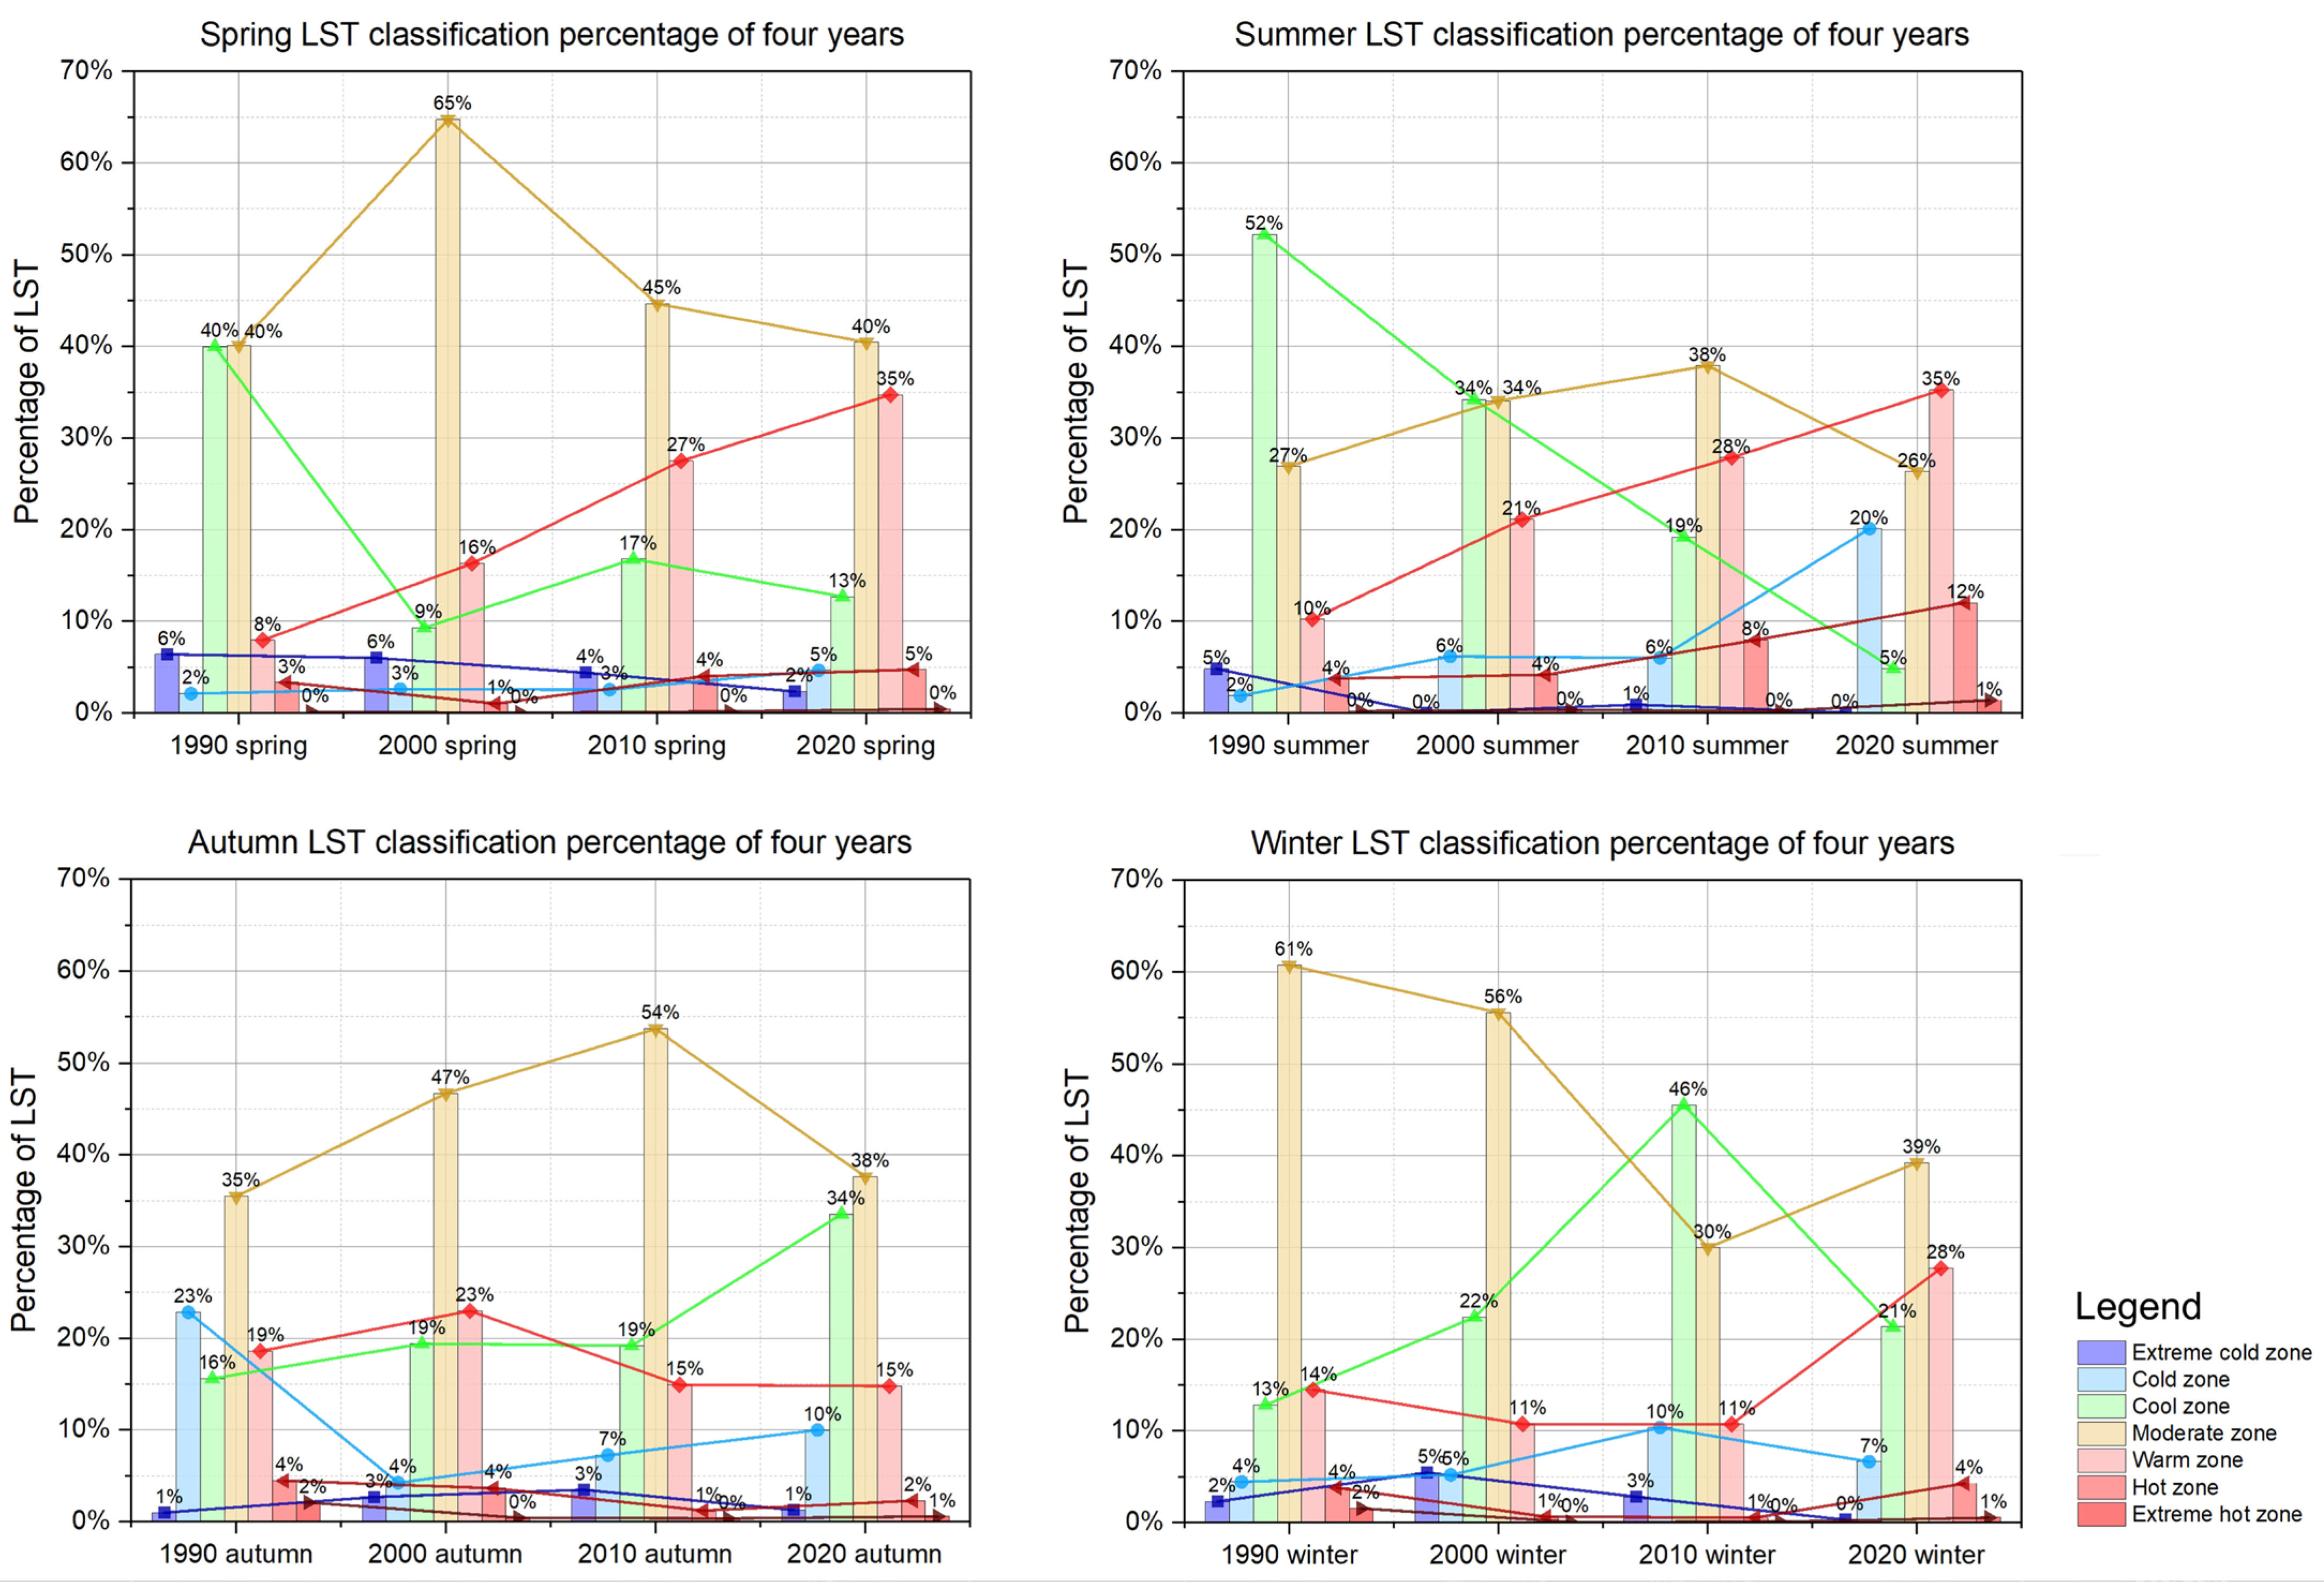
For instance, as depicted in
Figure 6, it shows the 1990–2020 seasonal LULC type LST proportion bar chart and trend line. What we want to express is the trend of the proportion of different LST subzones (extreme cold zone, cold zone, cool zone, moderate zone, warm zone, hot zone, extreme hot zone) in four different seasons between 1990 and 2020. The four subplots represent the four different seasons, and the seven different colored bars represent the percentage of LST zones, so the curve connecting the four bars of the same color over the four years represents the trend of this type of LST zones during these four years. during summer, the temperature rise in urban areas is more pronounced due to the heat island effect. As indicated in
Figure 7, the analysis shows that alongside regional LULC changes, there are corresponding shifts in LST across different zones.
The analysis of the link between urban expansion and increased LST confirms that LST is typically higher in urban construction and industrial areas. The analysis reveals that green spaces and water bodies, especially around the West Lake, play a significant role in modulating LST, generally maintaining lower temperatures. Directional analysis indicates that LST varies in certain directions, influenced by the average water body shape index (WBSI) and seasonal LST data.
In summary, the relationship between urban expansion and increased LST, the modulating effect of green spaces and water bodies on LST, and the impact of LULC changes on LST distribution are key factors influencing the intensity of the urban heat island effect. Seasonality and directionality also play crucial roles in influencing LST distribution.
5.2. Spatial Influence of Distance Gradient Variations on UCI Phenomena
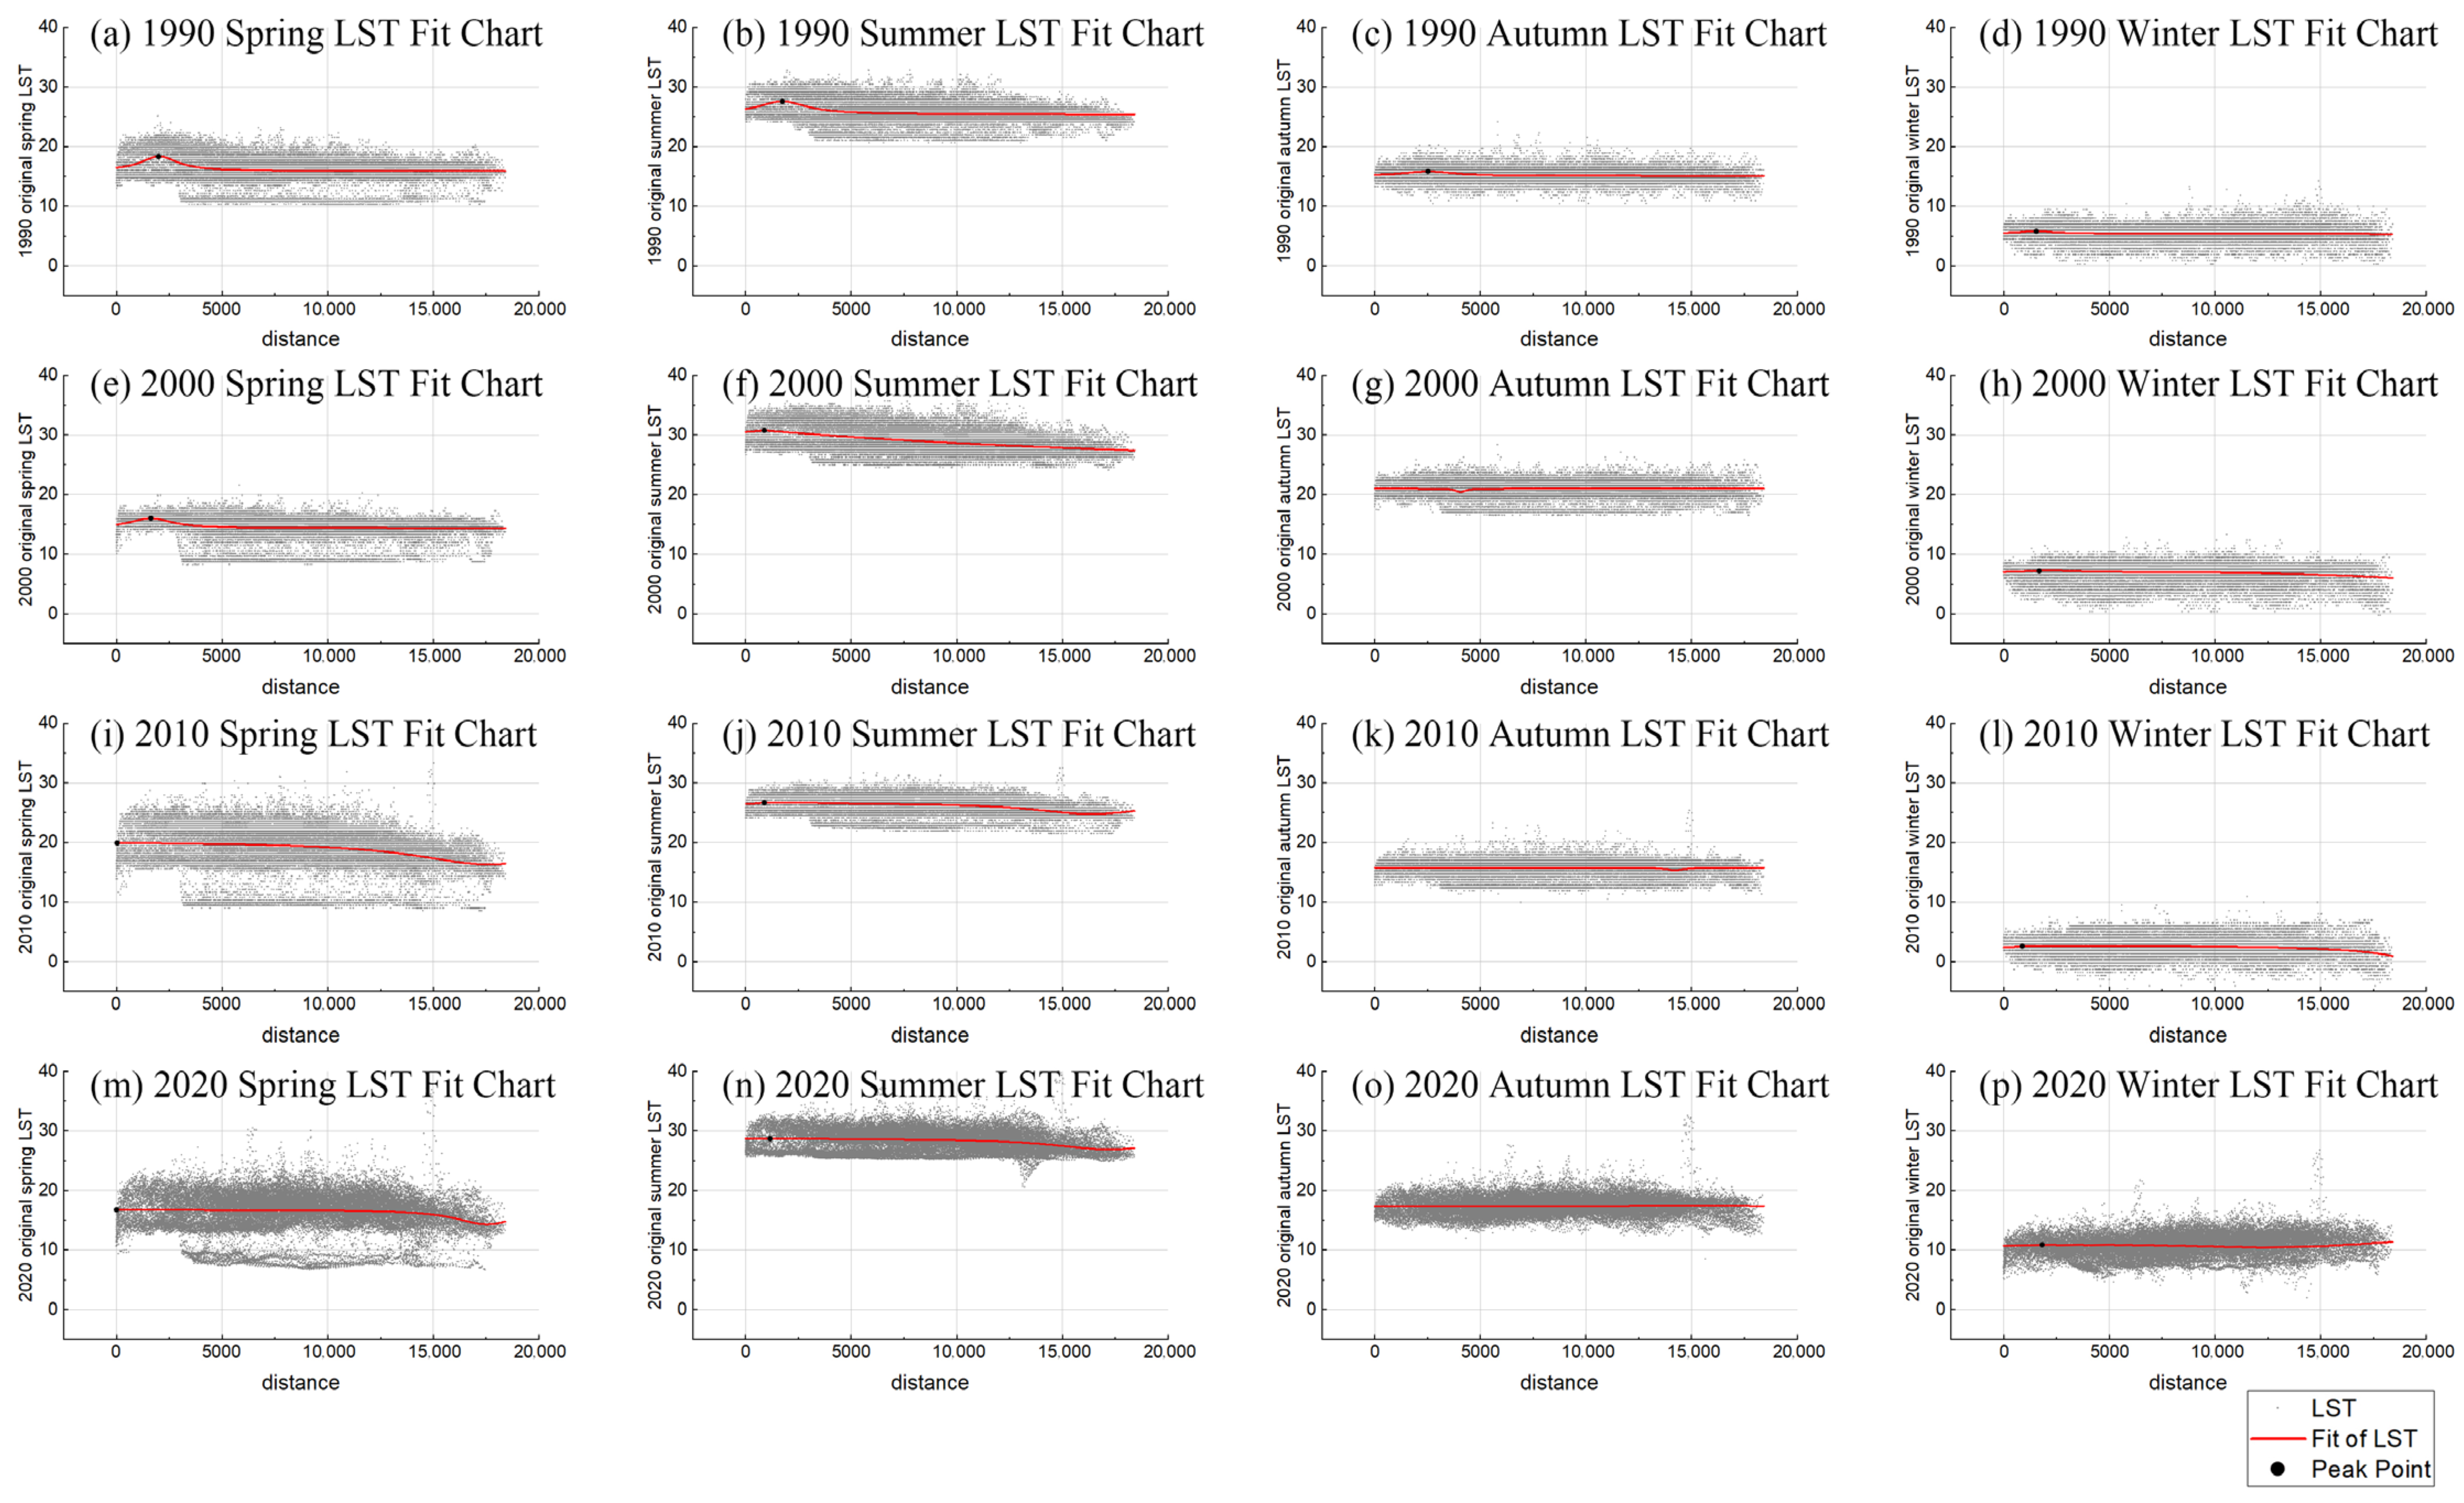
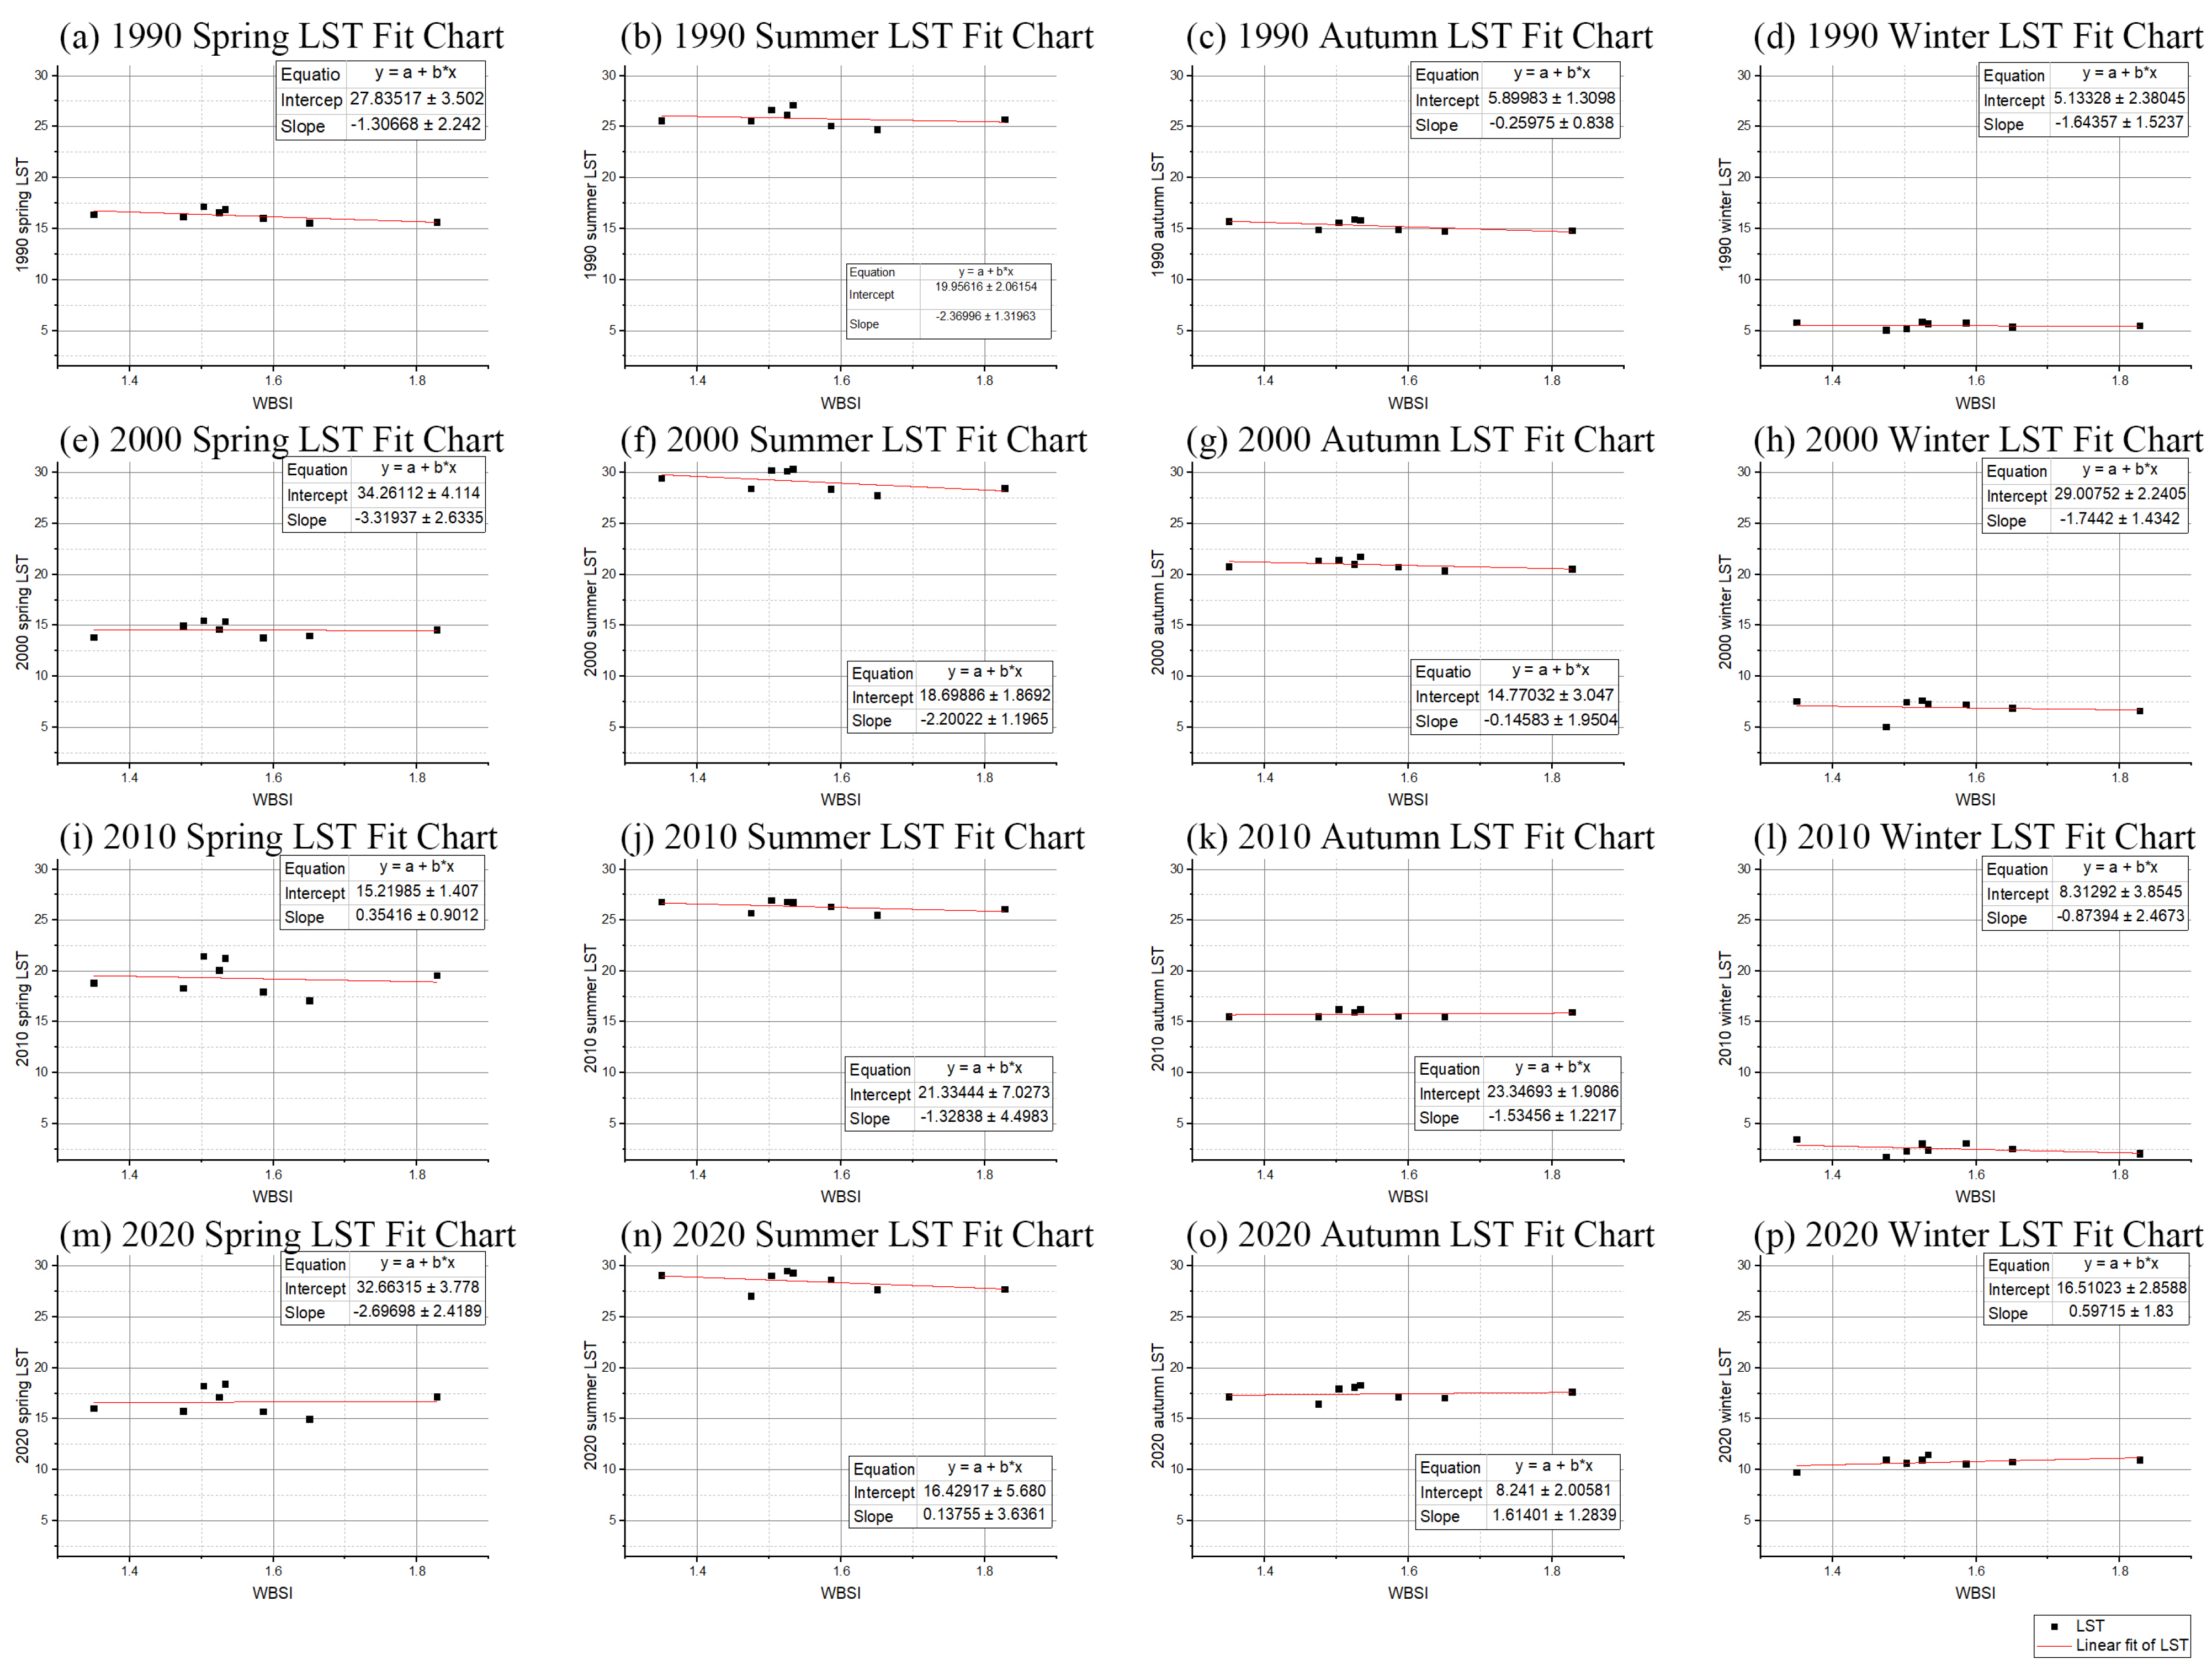
To explore the relationship between LST and distance, this study analyzed seasonal LST data and corresponding distances. A quadratic polynomial regression model was used to quantitatively assess the association between LST and distance across different seasons. As shown in
Figure 8, the spring data analysis indicates that LST initially increases with distance and then gradually decreases. This trend may reflect the predominant influence of the urban heat island (UHI) effect, transitioning to an urban cool island (UCI) phenomenon at greater distances, where the surface temperature peaks at a certain distance before decreasing further.
The summer data exhibit a similar pattern, with the peak of LST occurring at a farther distance, possibly due to the intensification of the UHI effect in summer. The autumn data show relatively smaller changes in LST, indicating a more balanced interaction between UHI and UCI effects. The winter trend is milder, possibly reflecting the limited or balanced influences of UHI and UCI during this season.
Quantitative analysis of seasonal data reveals varying UHI and UCI effects across seasons. UHI effects are more pronounced in spring and summer, while autumn and winter display a more balanced characteristic between UHI and UCI.
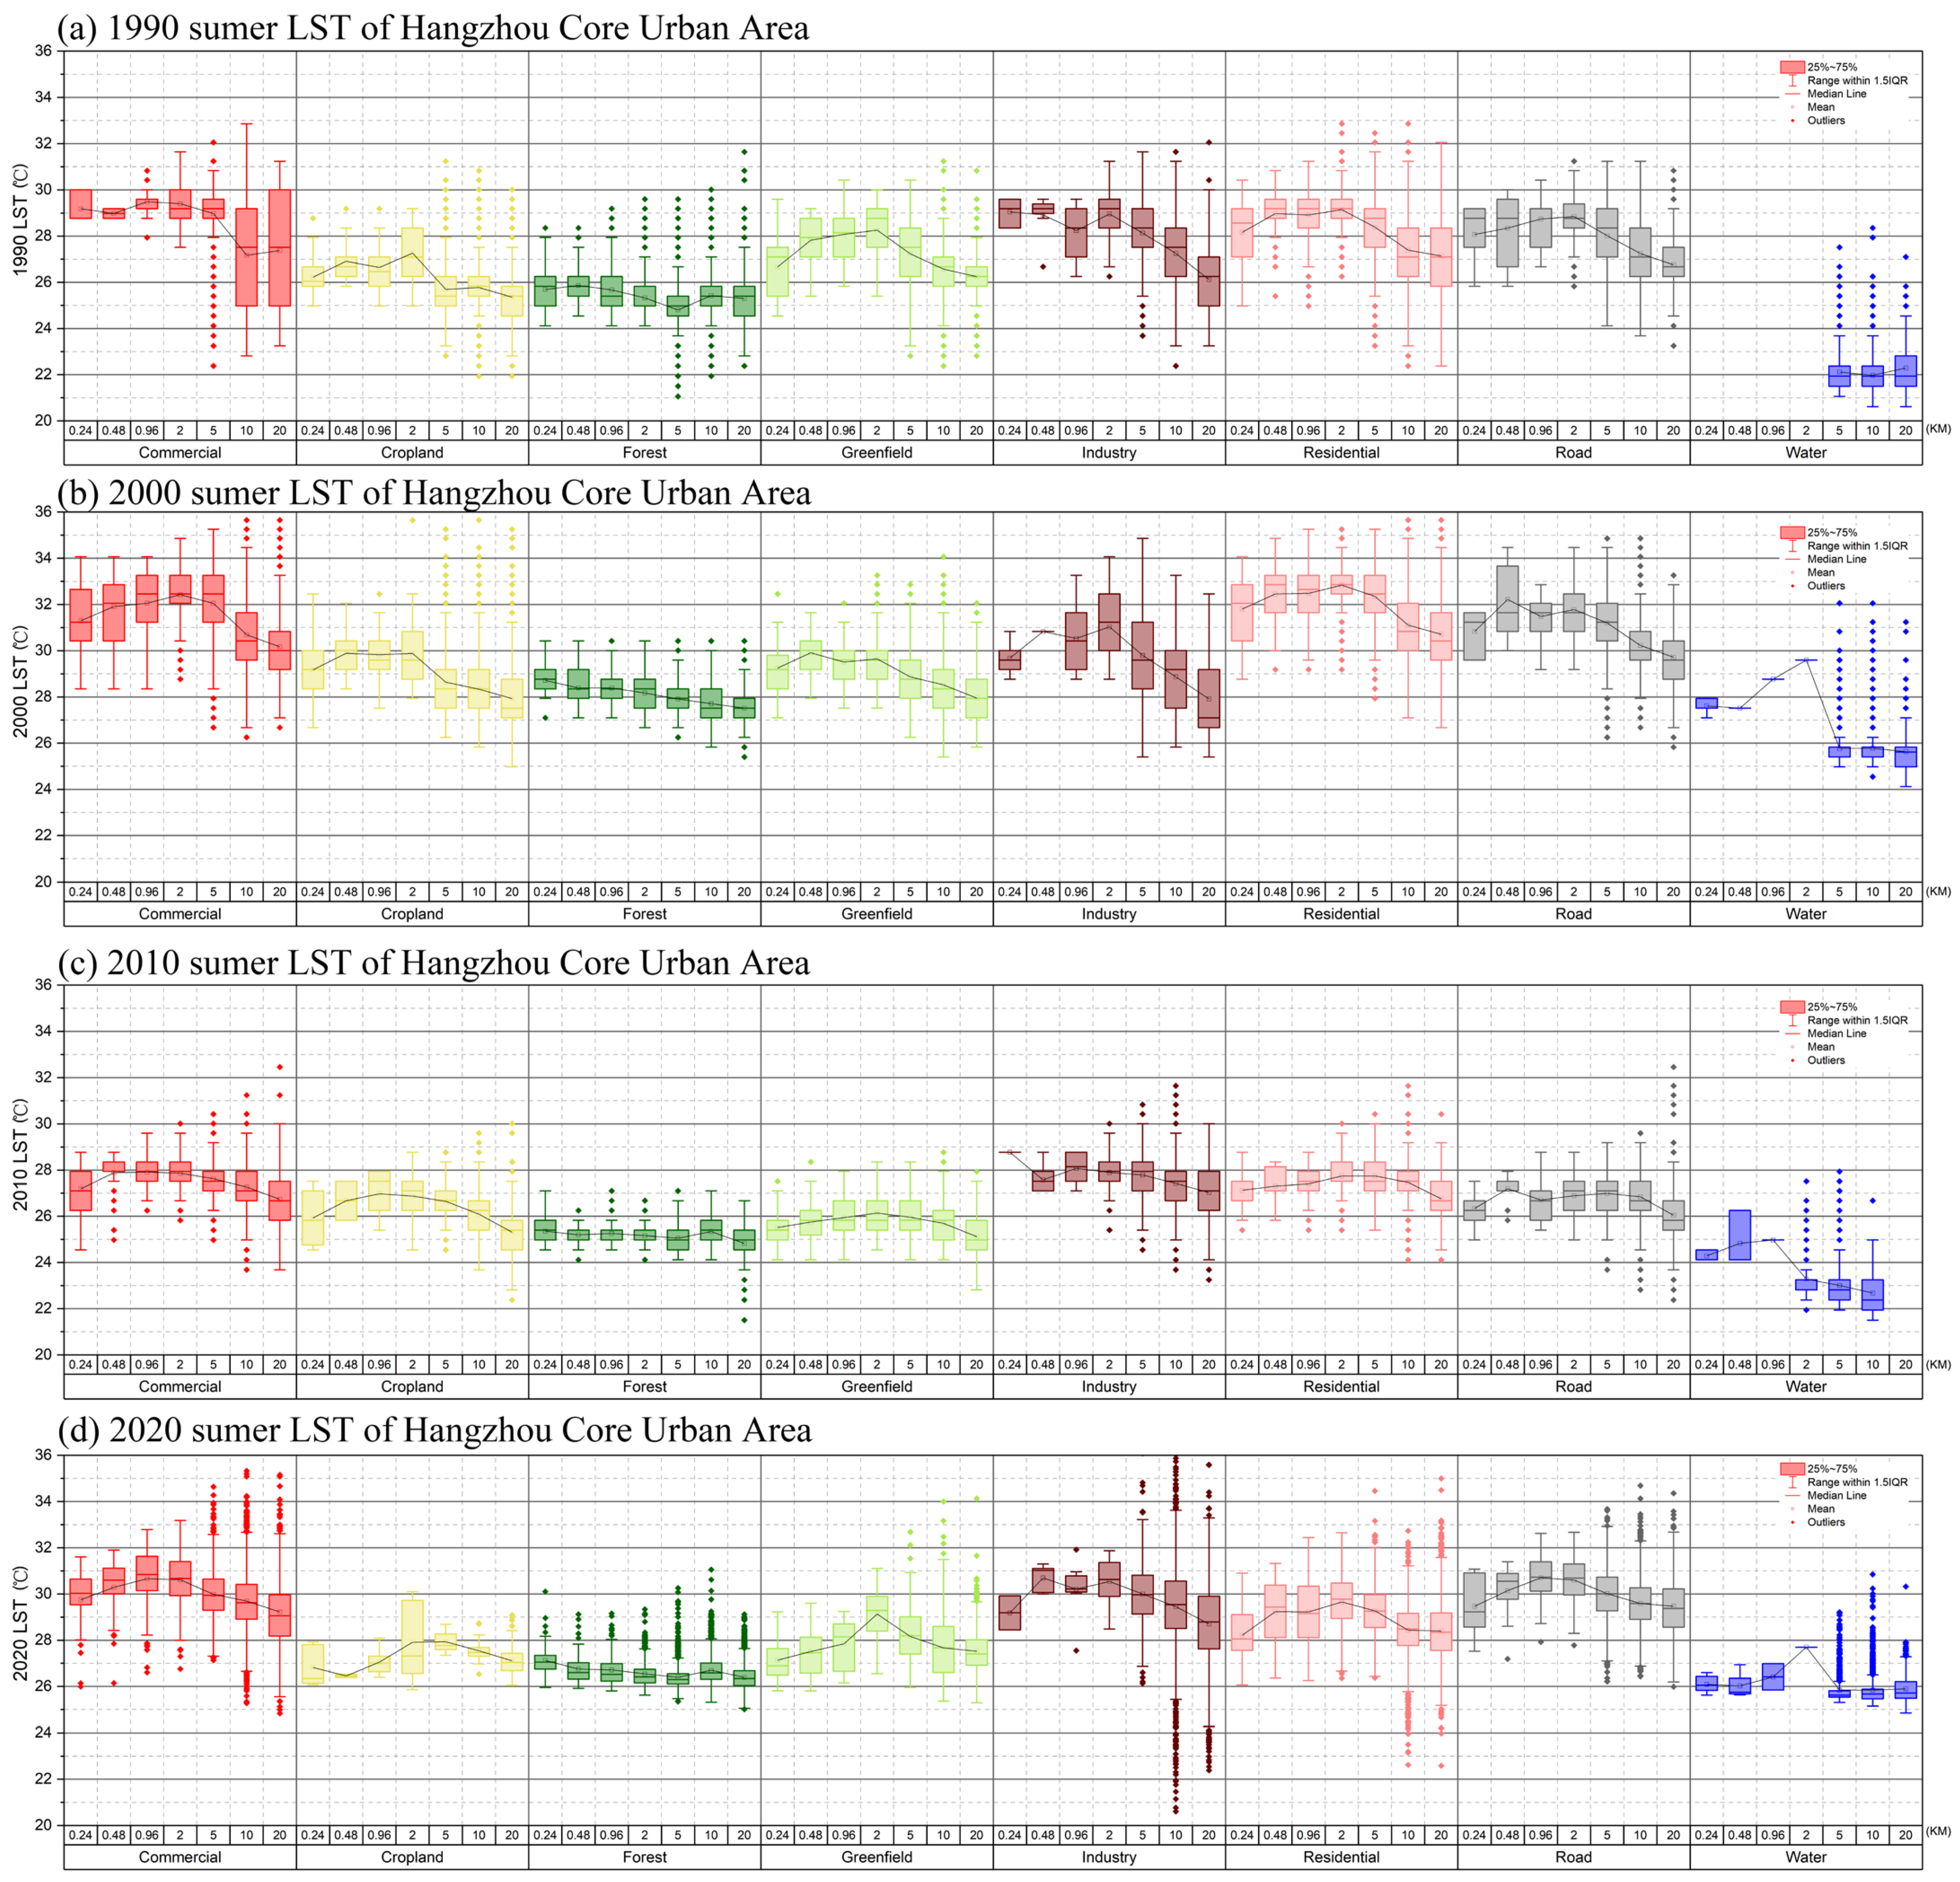
Taking summer as an example,
Figure 9 illustrates the distribution of LST across various Land Use and Land Cover (LULC) types along a distance gradient. The results show that the summer urban cool island (UCI) effect, represented by West Lake’s water body, reduces the peak impact range on commercial, residential, industrial, and road areas from two kilometers to within one kilometer. This reflects the intensified urban heat island (UHI) effect due to urbanization, which reduces the influence of cool islands on the urban thermal environment.
As the distance from the urban center increases, temperature fluctuations diminish, indicating that water bodies and other cooling factors at greater distances collectively expand the influence of cool islands on the urban thermal environment. This finding underscores the significance of water bodies and green spaces in mitigating UHI effects and enhancing the urban thermal comfort, particularly during the summer season.
In summary, this study reveals the strong association between urban expansion and the increase in land surface temperature (LST), the significant regulatory role of green spaces and water bodies on LST, and the profound impact of land use/land cover (LULC) changes on LST distribution, all of which are key factors affecting the intensity of the urban heat island (UHI) effect. Furthermore, seasonality and directionality are also found to have significant impacts on the distribution of LST. These findings highlight the complex interactions between urban development, natural landscapes, and climate in shaping the urban thermal environment.
5.3. Analysis of Water Body Shape Index (WBSI) Morphological Characteristics
Table 6 and
Figure 10 present the WBSI values for each sector.
Figure 10 specifically showcases the seasonal distribution statistics and trend fitting curves of LST by the WBSI. This figure underscores the profound impact of urban expansion on the LST, particularly highlighting how different shapes and sizes of water bodies contribute to the urban cool island (UCI) effect. The trend fitting curves provide a visual representation of how the LST varies with the morphological characteristics of water bodies, measured by the WBSI. The analysis reveals a notable cooling effect in areas surrounding higher WBSI values, emphasizing the significance of water body configurations in urban heat mitigation strategies. The maximum and minimum sectoral WBSI values are 1.48 (WNW) and 1.25 (SSE), respectively, with mean LST temperature differentials exceeding 1 °C. This finding indicates a significant influence of the WBSI on UCI phenomena.
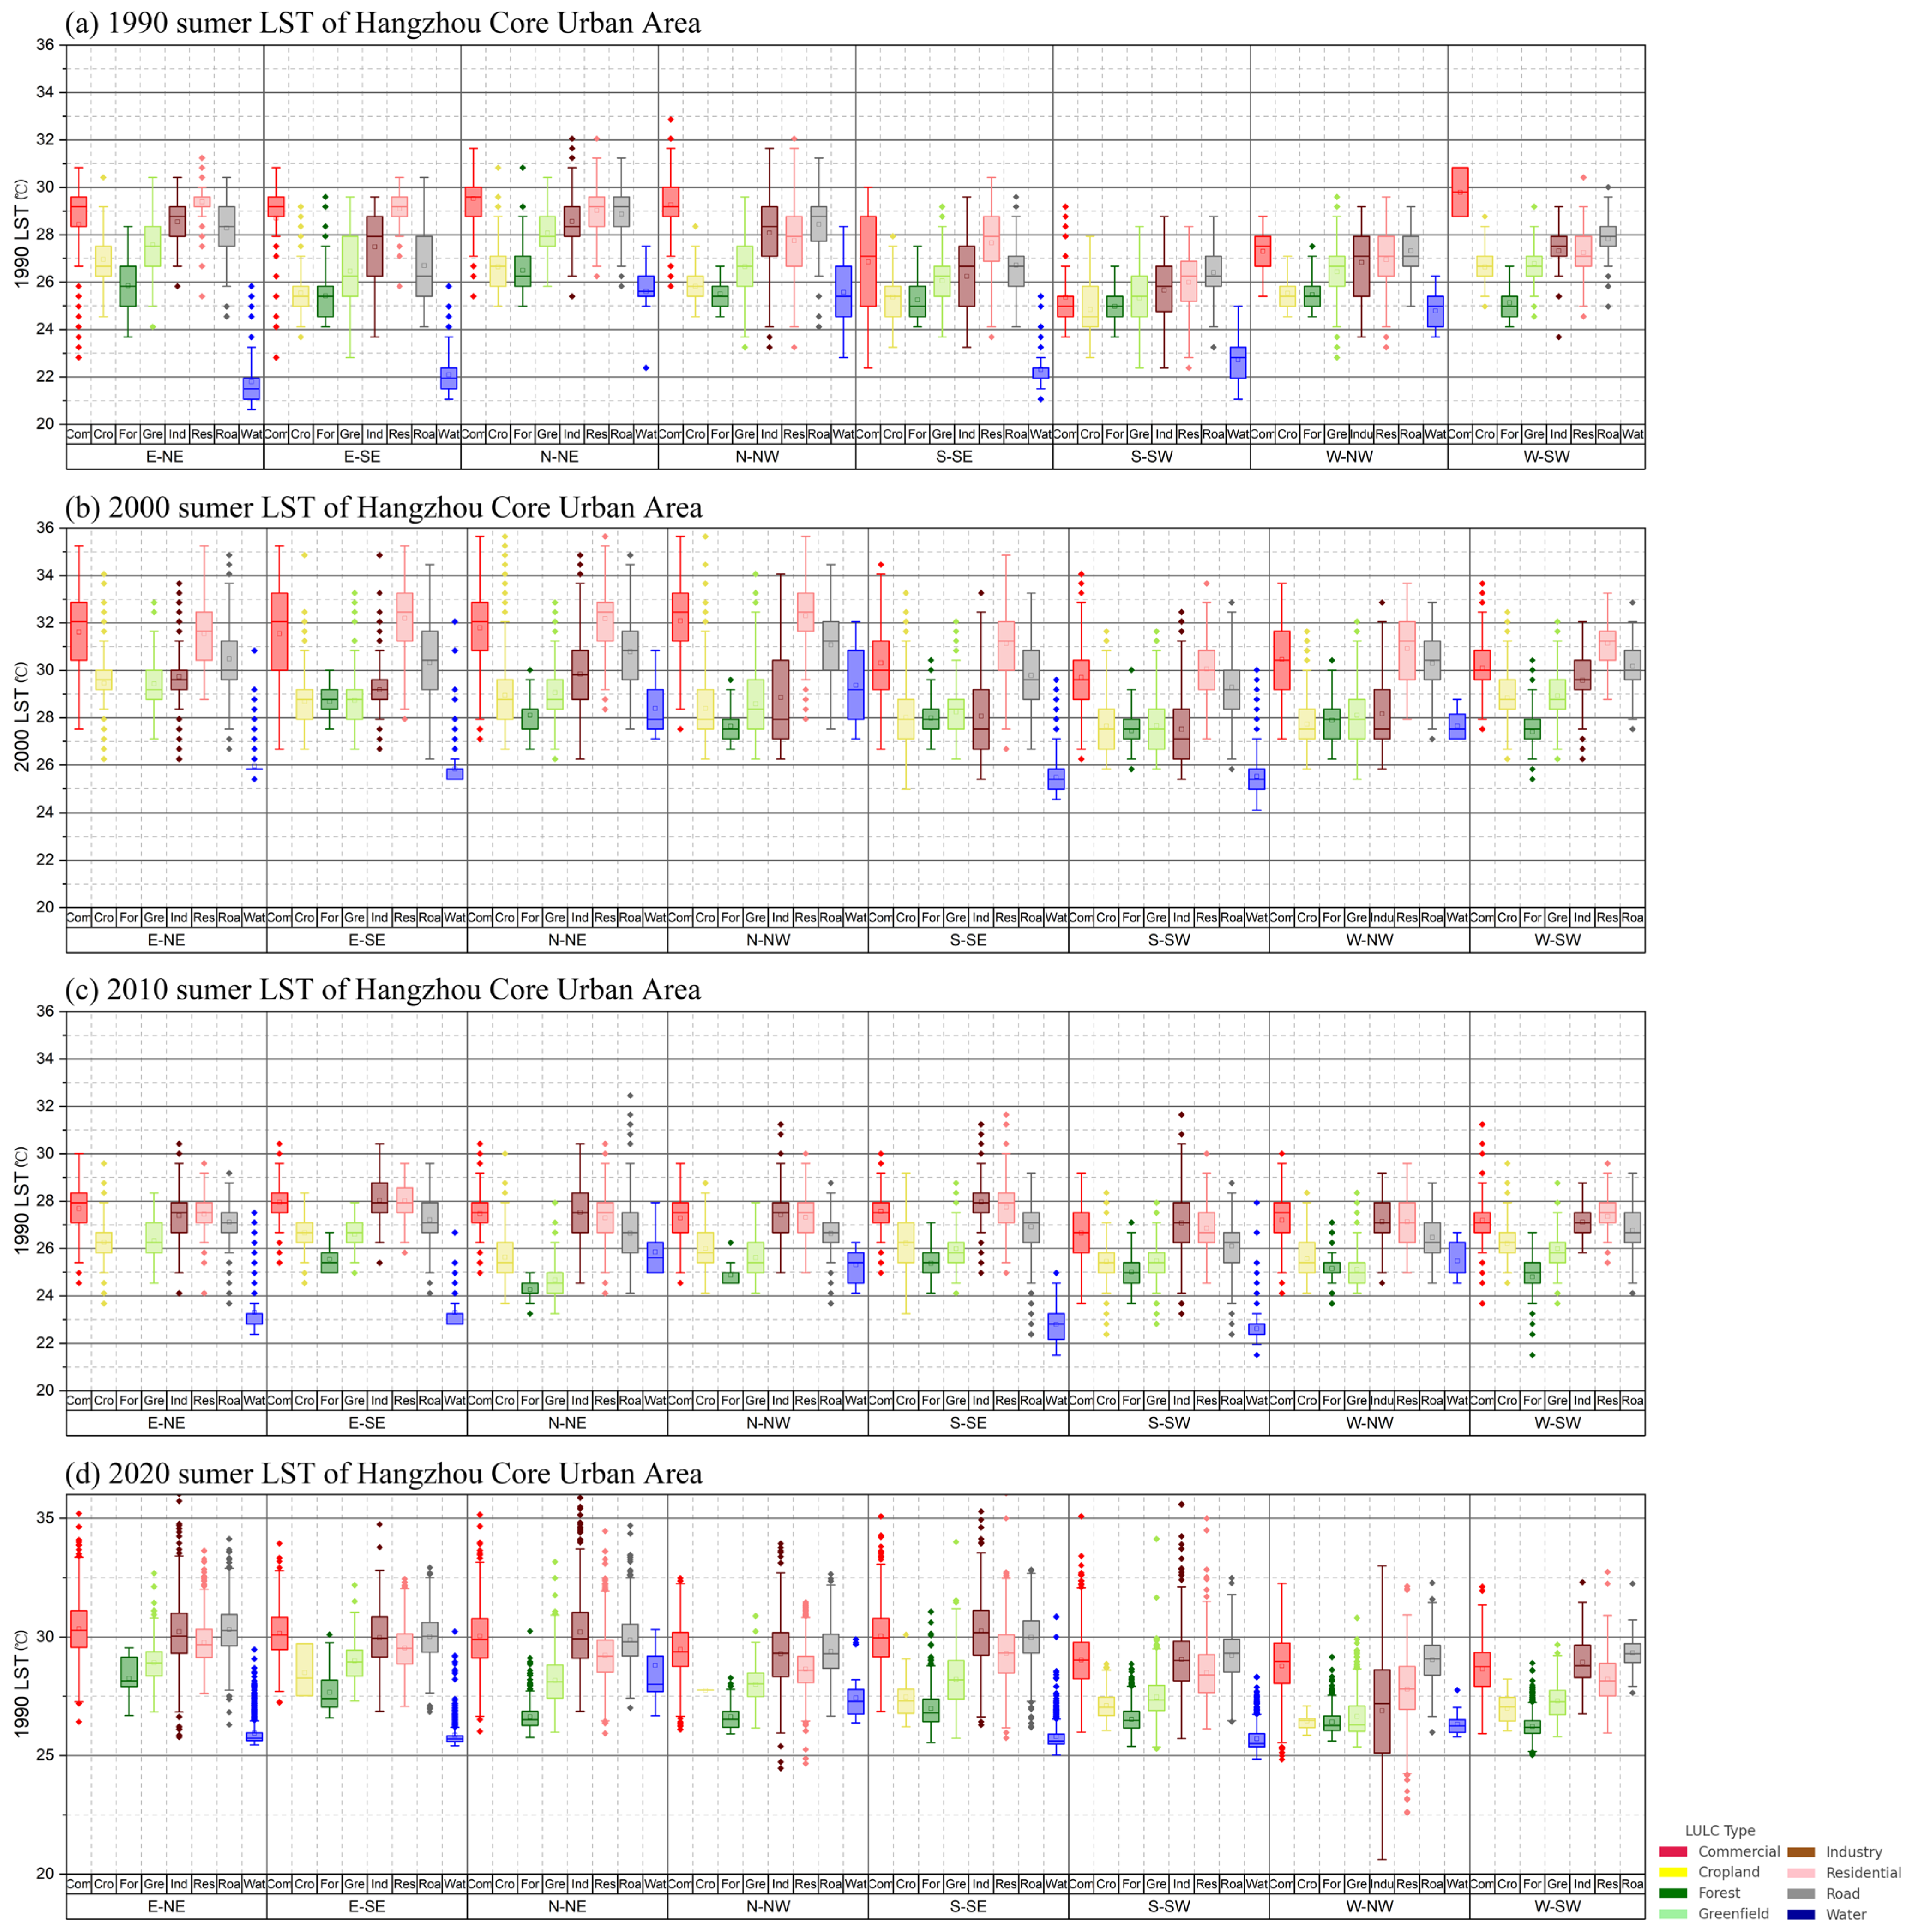
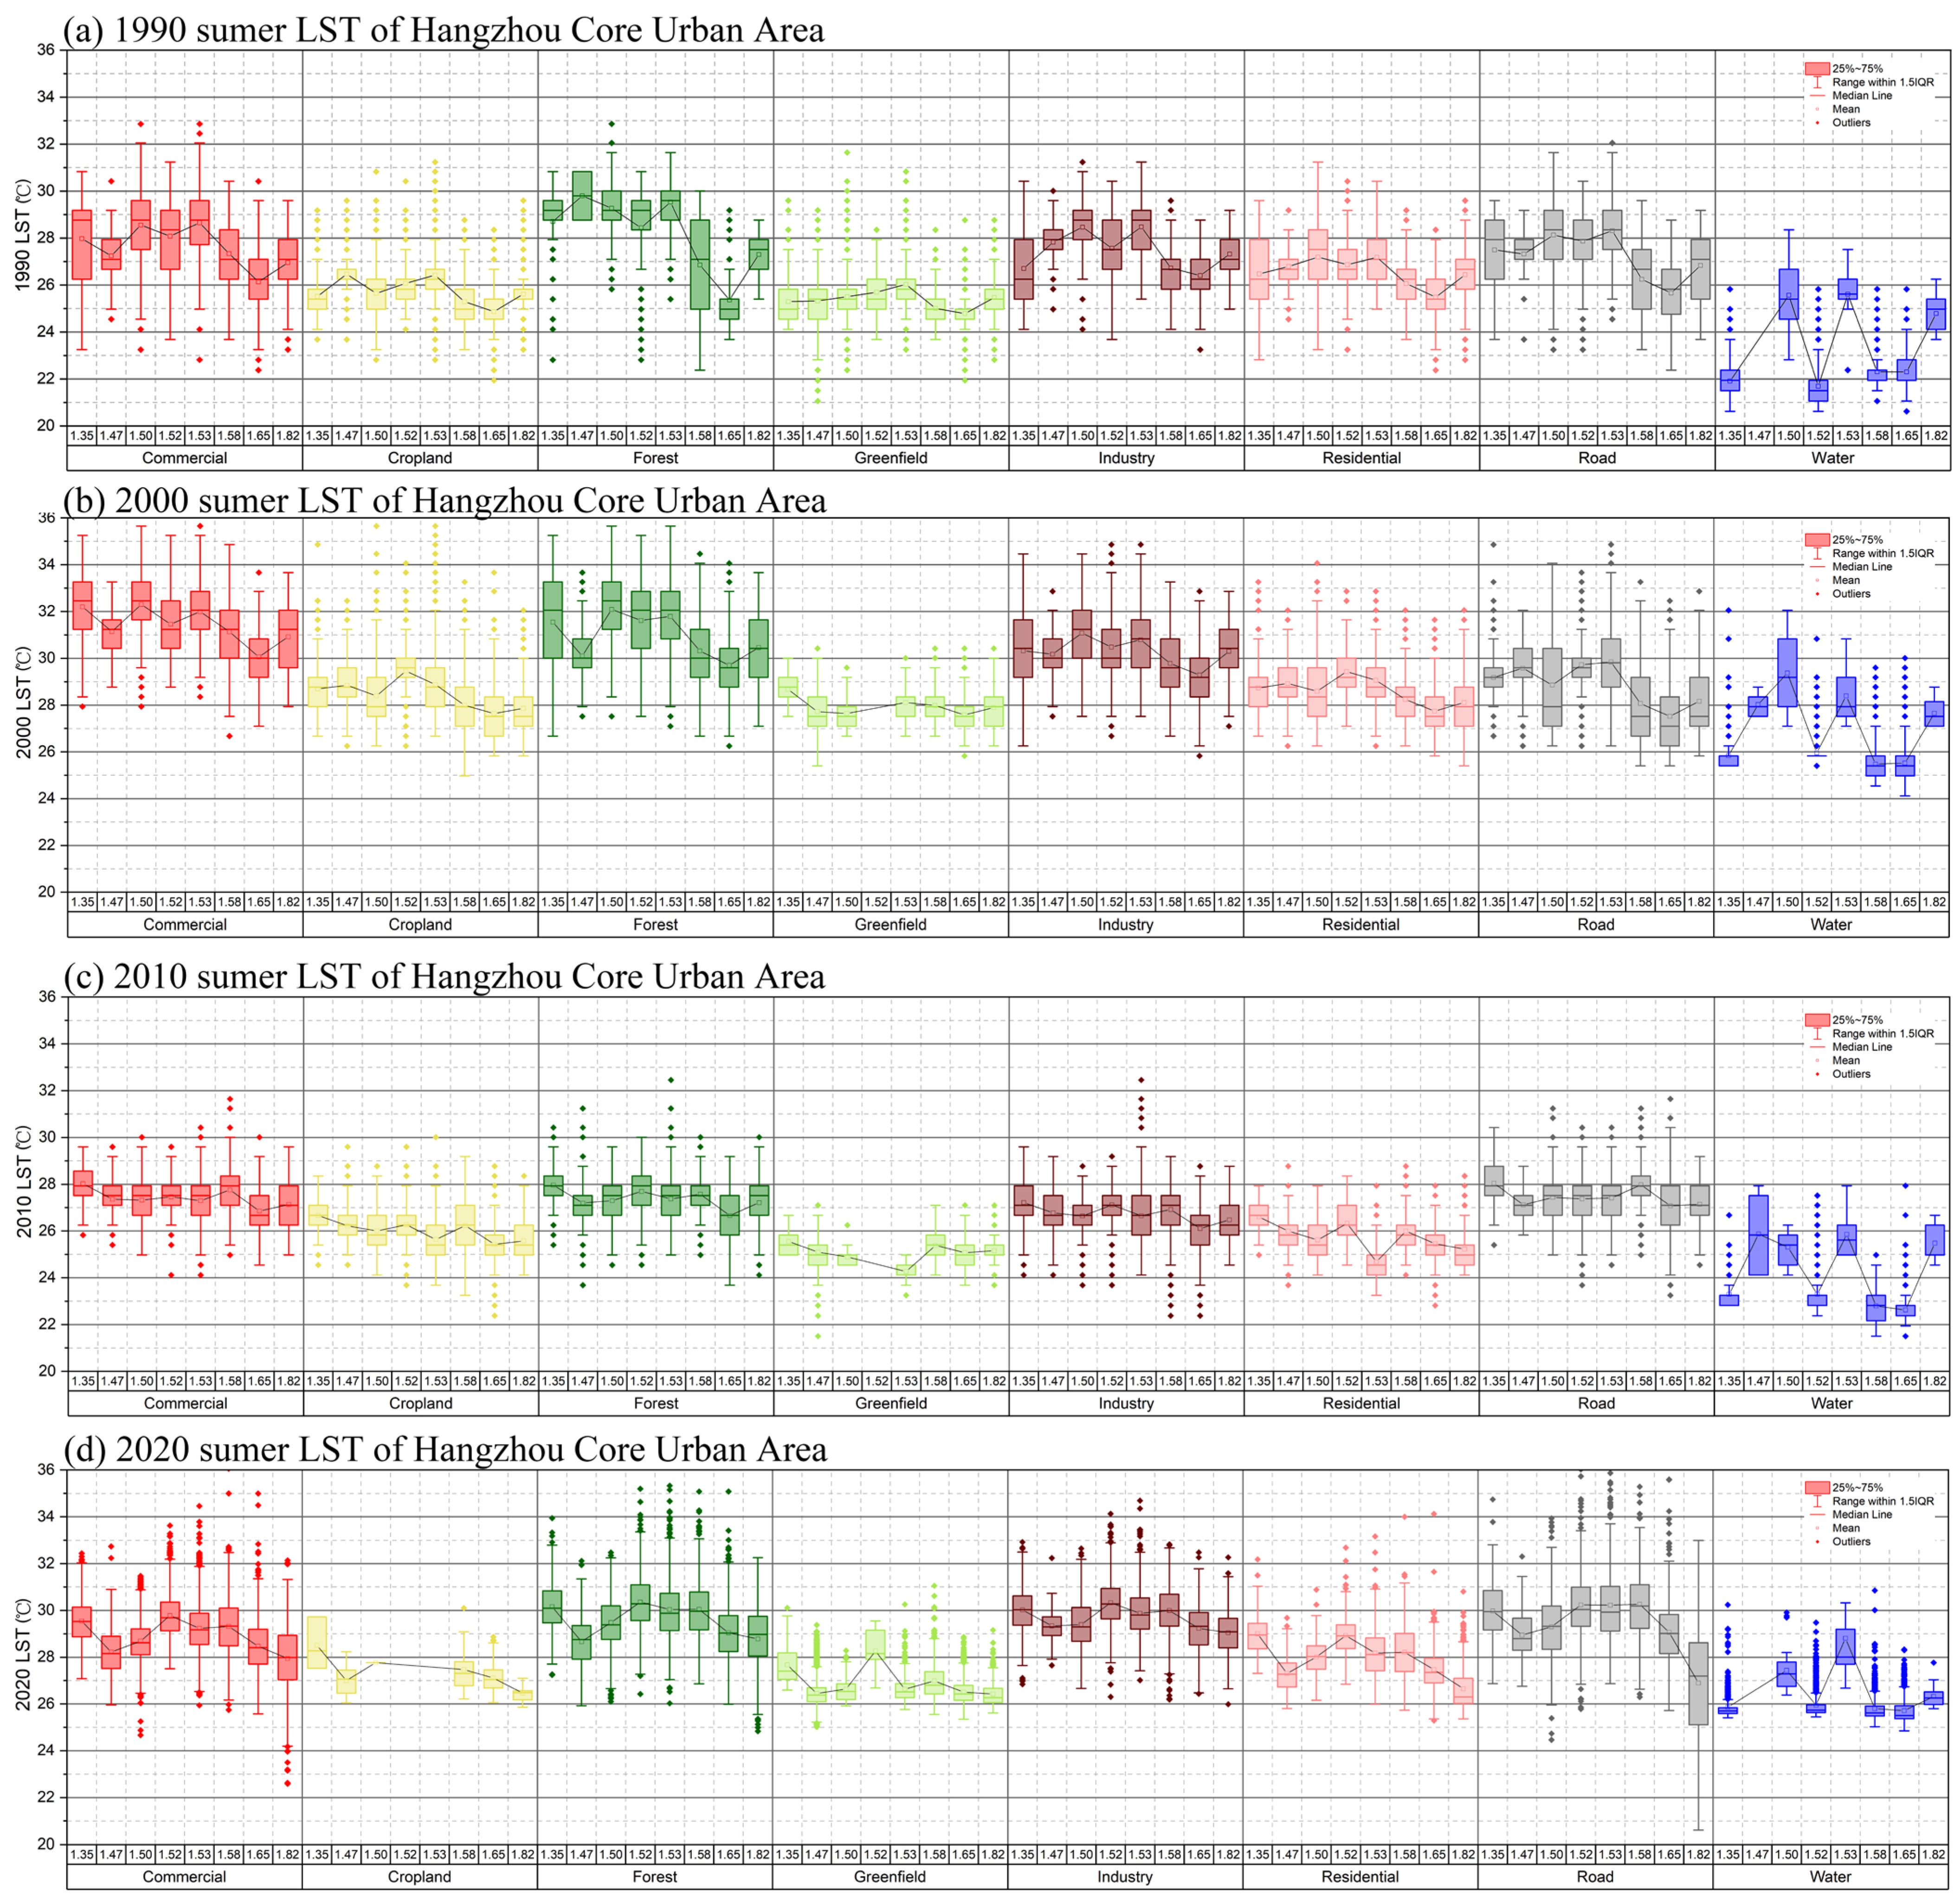
A significant correlation exists between the water body shape index (WBSI) and the urban cool island (UCI) effect intensity. Specifically, areas surrounding water bodies with higher WBSI values exhibit more pronounced cooling effects, impacting the surrounding land surface temperature (LST) significantly. As depicted in
Figure 11 of the multidimensional statistical analysis of land surface temperature changes method, it presents a more detailed summer LST box chart divided by the WBSI and land use/land cover (LULC) types. This figure further elaborates on the relationship between urban development, green spaces, water bodies, and their collective influence on the urban microclimate. Specifically, it demonstrates how varying WBSI values across different sectors around West Lake affect the surrounding LST, with higher WBSI values correlating with more pronounced cooling effects. This detailed breakdown by LULC types allows for a nuanced understanding of how land use changes contribute to urban heat dynamics and the potential of water bodies in enhancing urban thermal comfort. The region around West Lake was divided into eight sectors—NNE, ENE, ESE, SSE, SSW, WSW, WNW, and NNW. The WBSI of each sector was computed using Equation (2), analyzing the LST distribution characteristics, which facilitated identifying the association between UCI intensity and the WBSI across the lake’s sectors.
In summary, using the WBSI for morphological analysis effectively identifies cool island effects near water bodies. Quantitatively correlating the WBSI with the intensity of adjacent LST cooling facilitates enhanced UCI effect modeling and prediction capacities across lake sectors. This analysis underscores the utility of the WBSI as a tool in understanding and managing urban microclimates.
6. Conclusions and Recommendations
This study investigates the dynamics and mechanisms of the urban cool island (UCI) effect, linking rapid urban expansion with significant increases in land surface temperature (LST), particularly during summer and winter, to emphasize the seasonal climatic influences on the urban thermal landscape.
Vegetation and water bodies are pivotal in reducing urban heat stress, with their influence being essential throughout the year, despite variations in the UCI effect across seasons. Notably, temperatures in built-up areas continue to rise, even in winter.
Spatial analysis of large water bodies indicates that the UCI effect diminishes with distance, while higher water body shape index (WBSI) values enhance the cooling effect. Our findings advocate for considering spatial–temporal aspects in urban planning to effectively leverage landscape features against UCI variations.
When it comes to the limitations of our research methodology, we find it important to note the following points, which will serve as a guide for our future research.
1. Our study’s temporal resolution is constrained by the use of Landsat imagery at ten-year intervals, potentially missing rapid urban changes and immediate impacts of urban planning measures.
2. The focus on Hangzhou limits the generalizability of our findings to cities with differing climates, urban forms, or developmental stages, necessitating further validation in diverse contexts.
3. The novel application of the water body shape index (WBSI) to assess cooling effects introduces a methodological limitation, with its effectiveness in varying urban settings yet to be fully established.
In future research, we aim to address these limitations by adopting a more granular temporal analysis, potentially utilizing satellite data with higher frequency or incorporating urban sensor data to capture more immediate changes in land use and the urban heat island effect. We plan to expand our study to include a broader range of cities with varied climatic conditions, urban designs, and development trajectories to enhance the generalizability of our findings. This comparative approach will allow us to test the applicability of the water body shape index (WBSI) across different urban contexts and refine the metric based on these insights. Through these efforts, we anticipate contributing to a more nuanced understanding of urban thermal dynamics and developing more effective strategies for mitigating urban heat island effects in cities worldwide.
Crucially, this study introduces a groundbreaking discovery that the shape of water bodies plays a pivotal role in the urban cool island effect, a novel finding that paves the way for innovative urban design strategies aimed at climate resilience and sustainability. We recommend future urban planning to prioritize the design and preservation of water bodies with complex peripheries to maximize their cooling effects. Balancing urban development with the preservation of natural landscapes, such as green spaces and water bodies, is crucial for mitigating urban warming and enhancing UCI efficiency. This study provides a valuable framework for predicting and mitigating climate change in urban environments and advocates for the inclusion of different land use categories and seasonal variations in future studies to promote sustainable urban development strategies.
Author Contributions
Conceptualization, H.L. and Q.W.; Methodology, H.L.; Software, Z.Z.; Validation, J.C.; Investigation, H.L.; Resources, S.K.; data curation, Z.Z.; Writing—original draft preparation, H.L.; Writing—review & editing, H.L., Z.Z. and Q.W.; visualization, Z.Z.; Supervision, H.L.; project administration, H.L.; funding acquisition, H.L. All authors have read and agreed to the published version of the manuscript.
Funding
This research was funded by Haiqiang Liu, grant number 23052107-Y and 20050965-J.
Institutional Review Board Statement
Not applicable.
Informed Consent Statement
Not applicable.
Data Availability Statement
The data used are all public data that can be downloaded from the websites mentioned in the paper.
Conflicts of Interest
The authors declare no conflict of interest.
References
- Yao, L.; Sun, S.; Song, C.; Li, J.; Xu, W.; Xu, Y. Understanding the Spatiotemporal Pattern of the Urban Heat Island Footprint in the Context of Urbanization, a Case Study in Beijing, China. Appl. Geogr. 2021, 133, 102496. [Google Scholar] [CrossRef]
- Huang, X.; Hao, L.; Sun, G.; Yang, Z.-L.; Li, W.; Chen, D. Urbanization Aggravates Effects of Global Warming on Local Atmospheric Drying. Geophys. Res. Lett. 2022, 49, e2021GL095709. [Google Scholar] [CrossRef]
- Zhou, D.; Xiao, J.; Frolking, S.; Zhang, L.; Zhou, G. Urbanization Contributes Little to Global Warming but Substantially Intensifies Local and Regional Land Surface Warming. Earth’s Future 2022, 10, e2021EF002401. [Google Scholar] [CrossRef]
- Feinberg, A. Urbanization Heat Flux Modeling Confirms It Is a Likely Cause of Significant Global Warming: Urbanization Mitigation Requirements. Land 2023, 12, 1222. [Google Scholar] [CrossRef]
- National Bureau of Statistics of China. Available online: http://www.stats.gov.cn/english/ (accessed on 19 November 2023).
- Ritchie, H.; Roser, M. Urbanization. Available online: https://ourworldindata.org/urbanization (accessed on 19 November 2023).
- Dadashpoor, H.; Azizi, P.; Moghadasi, M. Land Use Change, Urbanization, and Change in Landscape Pattern in a Metropolitan Area. Sci. Total Environ. 2019, 655, 707–719. [Google Scholar] [CrossRef]
- Zhai, H.; Lv, C.; Liu, W.; Yang, C.; Fan, D.; Wang, Z.; Guan, Q. Understanding Spatiotemporal Patterns of Land Use/Land Cover Change under Urbanization in Wuhan, China, 2000–2019. Remote Sens. 2021, 13, 3331. [Google Scholar] [CrossRef]
- Wang, Z.; Zhang, S.; Peng, Y.; Wu, C.; Lv, Y.; Xiao, K.; Zhao, J.; Qian, G. Impact of Rapid Urbanization on the Threshold Effect in the Relationship between Impervious Surfaces and Water Quality in Shanghai, China. Environ. Pollut. 2020, 267, 115569. [Google Scholar] [CrossRef] [PubMed]
- Yan, Z.; Teng, M.; He, W.; Liu, A.; Li, Y.; Wang, P. Impervious Surface Area Is a Key Predictor for Urban Plant Diversity in a City Undergone Rapid Urbanization. Sci. Total Environ. 2019, 650, 335–342. [Google Scholar] [CrossRef] [PubMed]
- Feng, B.; Zhang, Y.; Bourke, R. Urbanization Impacts on Flood Risks Based on Urban Growth Data and Coupled Flood Models. Nat. Hazards 2021, 106, 613–627. [Google Scholar] [CrossRef]
- Uddin, A.S.M.S.; Khan, N.; Islam, A.R.M.T.; Kamruzzaman, M.; Shahid, S. Changes in Urbanization and Urban Heat Island Effect in Dhaka City. Theor. Appl. Clim. 2022, 147, 891–907. [Google Scholar] [CrossRef]
- Yu, Z.; Yang, G.; Zuo, S.; Jørgensen, G.; Koga, M.; Vejre, H. Critical Review on the Cooling Effect of Urban Blue-Green Space: A Threshold-Size Perspective. Urban For. Urban Green. 2020, 49, 126630. [Google Scholar] [CrossRef]
- Jauregui, E. Heat Island Development in Mexico City. Atmos. Environ. 1997, 31, 3821–3831. [Google Scholar] [CrossRef]
- Yang, G.; Yu, Z.; Jørgensen, G.; Vejre, H. How Can Urban Blue-Green Space Be Planned for Climate Adaption in High-Latitude Cities? A Seasonal Perspective. Sustain. Cities Soc. 2020, 53, 101932. [Google Scholar] [CrossRef]
- Chapman, S.; Watson, J.E.M.; Salazar, A.; Thatcher, M.; McAlpine, C.A. The Impact of Urbanization and Climate Change on Urban Temperatures: A Systematic Review. Landsc. Ecol. 2017, 32, 1921–1935. [Google Scholar] [CrossRef]
- Nuissl, H.; Siedentop, S. Urbanisation and Land Use Change. In Sustainable Land Management in a European Context: A Co-Design Approach; Weith, T., Barkmann, T., Gaasch, N., Rogga, S., Strauß, C., Zscheischler, J., Eds.; Human-Environment Interactions; Springer International Publishing: Cham, Switzerland, 2021; pp. 75–99. ISBN 978-3-030-50841-8. [Google Scholar]
- Guha, S.; Govil, H.; Gill, N.; Dey, A. A Long-Term Seasonal Analysis on the Relationship between LST and NDBI Using Landsat Data. Quat. Int. 2021, 575–576, 249–258. [Google Scholar] [CrossRef]
- He, B.-J.; Zhao, Z.-Q.; Shen, L.-D.; Wang, H.-B.; Li, L.-G. An Approach to Examining Performances of Cool/Hot Sources in Mitigating/Enhancing Land Surface Temperature under Different Temperature Backgrounds Based on Landsat 8 Image. Sustain. Cities Soc. 2019, 44, 416–427. [Google Scholar] [CrossRef]
- Lemus-Canovas, M.; Martin-Vide, J.; Moreno-Garcia, M.C.; Lopez-Bustins, J.A. Estimating Barcelona’s Metropolitan Daytime Hot and Cold Poles Using Landsat-8 Land Surface Temperature. Sci. Total Environ. 2020, 699, 134307. [Google Scholar] [CrossRef]
- Jiang, H.; Yao, R.; Han, S.; Du, C.; Yu, W.; Chen, S.; Li, B.; Yu, H.; Li, N.; Peng, J.; et al. How Do Urban Residents Use Energy for Winter Heating at Home? A Large-Scale Survey in the Hot Summer and Cold Winter Climate Zone in the Yangtze River Region. Energy Build. 2020, 223, 110131. [Google Scholar] [CrossRef]
- Kafy, A.-A.; Abdullah-Al-Faisal; Rahman, M.S.; Islam, M.; Al Rakib, A.; Islam, M.A.; Khan, M.H.H.; Sikdar, M.S.; Sarker, M.H.S.; Mawa, J.; et al. Prediction of Seasonal Urban Thermal Field Variance Index Using Machine Learning Algorithms in Cumilla, Bangladesh. Sustain. Cities Soc. 2021, 64, 102542. [Google Scholar] [CrossRef]
- Li, F.; Sun, W.; Yang, G.; Weng, Q. Investigating Spatiotemporal Patterns of Surface Urban Heat Islands in the Hangzhou Metropolitan Area, China, 2000–2015. Remote Sens. 2019, 11, 1553. [Google Scholar] [CrossRef]
- Wu, W.; Li, L.; Li, C. Seasonal Variation in the Effects of Urban Environmental Factors on Land Surface Temperature in a Winter City. J. Clean. Prod. 2021, 299, 126897. [Google Scholar] [CrossRef]
- Du, P.; Chen, J.; Bai, X.; Han, W. Understanding the Seasonal Variations of Land Surface Temperature in Nanjing Urban Area Based on Local Climate Zone. Urban Clim. 2020, 33, 100657. [Google Scholar] [CrossRef]
- Lemonsu, A.; Viguié, V.; Daniel, M.; Masson, V. Vulnerability to Heat Waves: Impact of Urban Expansion Scenarios on Urban Heat Island and Heat Stress in Paris (France). Urban Clim. 2015, 14, 586–605. [Google Scholar] [CrossRef]
- Yang, J.; Yang, Y.; Sun, D.; Jin, C.; Xiao, X. Influence of Urban Morphological Characteristics on Thermal Environment. Sustain. Cities Soc. 2021, 72, 103045. [Google Scholar] [CrossRef]
- Yang, C.; He, X.; Wang, R.; Yan, F.; Yu, L.; Bu, K.; Yang, J.; Chang, L.; Zhang, S. The Effect of Urban Green Spaces on the Urban Thermal Environment and Its Seasonal Variations. Forests 2017, 8, 153. [Google Scholar] [CrossRef]
- Unger, J.; Skarbit, N.; Kovács, A.; Gál, T. Comparison of Regional and Urban Outdoor Thermal Stress Conditions in Heatwave and Normal Summer Periods: A Case Study. Urban Clim. 2020, 32, 100619. [Google Scholar] [CrossRef]
- MacLachlan, A.; Biggs, E.; Roberts, G.; Boruff, B. Sustainable City Planning: A Data-Driven Approach for Mitigating Urban Heat. Front. Built Environ. 2021, 6, 519599. [Google Scholar] [CrossRef]
- Battista, G.; Evangelisti, L.; Guattari, C.; De Lieto Vollaro, E.; De Lieto Vollaro, R.; Asdrubali, F. Urban Heat Island Mitigation Strategies: Experimental and Numerical Analysis of a University Campus in Rome (Italy). Sustainability 2020, 12, 7971. [Google Scholar] [CrossRef]
- Stokols, D. Social Ecology in the Digital Age—Solving Complex Problems in a Globalized World; Academic Press: Cambridge, MA, USA, 2018. [Google Scholar]
- Sun, R.; Chen, L. How Can Urban Water Bodies Be Designed for Climate Adaptation? Landsc. Urban Plan. 2012, 105, 27–33. [Google Scholar] [CrossRef]
- Lee, D.; Oh, K.; Seo, J. An Analysis of Urban Cooling Island (UCI) Effects by Water Spaces Applying UCI Indicies. Int. J. Environ. Sci. Dev. 2016, 7, 810–815. [Google Scholar] [CrossRef]
- Khan, M.S.; Ullah, S.; Chen, L. Variations in Surface Urban Heat Island and Urban Cool Island Intensity: A Review Across Major Climate Zones. Chin. Geogr. Sci. 2023, 33, 983–1000. [Google Scholar] [CrossRef]
- Goodess, C.; Berk, S.; Ratna, S.B.; Brousse, O.; Davies, M.; Heaviside, C.; Moore, G.; Pineo, H. Climate Change Projections for Sustainable and Healthy Cities. Build. Cities 2021, 2, 812–836. [Google Scholar] [CrossRef]
- Memon, R.A.; Leung, D.Y.C.; Liu, C.-H. An Investigation of Urban Heat Island Intensity (UHII) as an Indicator of Urban Heating. Atmos. Res. 2009, 94, 491–500. [Google Scholar] [CrossRef]
- Meng, Q.; Zhang, L.; Sun, Z.; Meng, F.; Wang, L.; Sun, Y. Characterizing Spatial and Temporal Trends of Surface Urban Heat Island Effect in an Urban Main Built-up Area: A 12-Year Case Study in Beijing, China. Remote Sens. Environ. 2018, 204, 826–837. [Google Scholar] [CrossRef]
- Kim, S.W.; Brown, R.D. Urban Heat Island (UHI) Intensity and Magnitude Estimations: A Systematic Literature Review. Sci. Total Environ. 2021, 779, 146389. [Google Scholar] [CrossRef] [PubMed]
- Kolokotroni, M.; Giridharan, R. Urban Heat Island Intensity in London: An Investigation of the Impact of Physical Characteristics on Changes in Outdoor Air Temperature during Summer. Sol. Energy 2008, 82, 986–998. [Google Scholar] [CrossRef]
- Ji, W.; Ma, J.; Twibell, R.W.; Underhill, K. Characterizing Urban Sprawl Using Multi-Stage Remote Sensing Images and Landscape Metrics. Comput. Environ. Urban Syst. 2006, 30, 861–879. [Google Scholar] [CrossRef]
- Shi, D.; Song, J.; Huang, J.; Zhuang, C.; Guo, R.; Gao, Y. Synergistic Cooling Effects (SCEs) of Urban Green-Blue Spaces on Local Thermal Environment: A Case Study in Chongqing, China. Sustain. Cities Soc. 2020, 55, 102065. [Google Scholar] [CrossRef]
- Fan, P.; Lee, Y.-C.; Ouyang, Z.; Huang, S.-L. Compact and Green Urban Development—Towards a Framework to Assess Urban Development for a High-Density Metropolis. Environ. Res. Lett. 2019, 14, 115006. [Google Scholar] [CrossRef]
- Wong, P.P.-Y.; Lai, P.-C.; Low, C.-T.; Chen, S.; Hart, M. The Impact of Environmental and Human Factors on Urban Heat and Microclimate Variability. Build. Environ. 2016, 95, 199–208. [Google Scholar] [CrossRef]
- Middel, A.; Nazarian, N.; Demuzere, M.; Bechtel, B. Urban Climate Informatics: An Emerging Research Field. Front. Environ. Sci. 2022, 10, 867434. [Google Scholar] [CrossRef]
- Ahmad, A.; Quegan, S. Analysis of Maximum Likelihood Classification on Multispectral Data. Appl. Math. Sci. 2012, 6, 6425–6436. [Google Scholar]
- Erbek, F.S.; Özkan, C.; Taberner, M. Comparison of Maximum Likelihood Classification Method with Supervised Artificial Neural Network Algorithms for Land Use Activities. Int. J. Remote Sens. 2004, 25, 1733–1748. [Google Scholar] [CrossRef]
- Ma, Z.; Shi, Z.; Zhou, Y.; Xu, J.; Yu, W.; Yang, Y. A Spatial Data Mining Algorithm for Downscaling TMPA 3B43 V7 Data over the Qinghai–Tibet Plateau with the Effects of Systematic Anomalies Removed. Remote Sens. Environ. 2017, 200, 378–395. [Google Scholar] [CrossRef]
- Chen, X.; Long, D.; Hong, Y.; Zeng, C.; Yan, D. Improved Modeling of Snow and Glacier Melting by a Progressive Two-Stage Calibration Strategy with GRACE and Multisource Data: How Snow and Glacier Meltwater Contributes to the Runoff of the Upper Brahmaputra River Basin? Water Resour. Res. 2017, 53, 2431–2466. [Google Scholar] [CrossRef]
- Qin, Z.; Karnieli, A.; Berliner, P. A Mono-Window Algorithm for Retrieving Land Surface Temperature from Landsat TM Data and Its Application to the Israel-Egypt Border Region. Int. J. Remote Sens. 2001, 22, 3719–3746. [Google Scholar] [CrossRef]
- Horiuchi, Y.; Chino, A.; Matsuo, Y.; Kishihara, T.; Uragami, N.; Fujimoto, Y.; Ueno, M.; Tamegai, Y.; Hoshino, E.; Igarashi, M. Diagnosis of Laterally Spreading Tumors (LST) in the Rectum and Selection of Treatment: Characteristics of Each of the Subclassifications of LST in the Rectum. Dig. Endosc. 2013, 25, 608–614. [Google Scholar] [CrossRef] [PubMed]
- Zeng, C.; Shen, H.; Zhong, M.; Zhang, L.; Wu, P. Reconstructing MODIS LST Based on Multitemporal Classification and Robust Regression. IEEE Geosci. Remote Sens. Lett. 2015, 12, 512–516. [Google Scholar] [CrossRef]
- Kashki, A.; Karami, M.; Zandi, R.; Roki, Z. Evaluation of the Effect of Geographical Parameters on the Formation of the Land Surface Temperature by Applying OLS and GWR, A Case Study Shiraz City, Iran. Urban Clim. 2021, 37, 100832. [Google Scholar] [CrossRef]
Figure 1.
The geographical location of West Lake and the main urban area in Hangzhou, China.
Figure 1.
The geographical location of West Lake and the main urban area in Hangzhou, China.
Figure 2.
West Lake’s surroundings classified by angles and distances.
Figure 2.
West Lake’s surroundings classified by angles and distances.
Figure 3.
1990–2020 land use and land cover maps of the core urban area of Hangzhou, China.
Figure 3.
1990–2020 land use and land cover maps of the core urban area of Hangzhou, China.
Figure 4.
1990–2020 land use/land cover (LULC) transformation Sankey diagram.
Figure 4.
1990–2020 land use/land cover (LULC) transformation Sankey diagram.
Figure 5.
1990–2020 seasonal seven-level LST value distribution analysis.
Figure 5.
1990–2020 seasonal seven-level LST value distribution analysis.
Figure 6.
1990–2020 seasonal LULC type LST proportion bar chart and trend line.
Figure 6.
1990–2020 seasonal LULC type LST proportion bar chart and trend line.
Figure 7.
1990–2020 summer LST box chart divided by LULC type and directional zone.
Figure 7.
1990–2020 summer LST box chart divided by LULC type and directional zone.
Figure 8.
1990–2020 seasonal LST distribution statistics and trend fitting curves by distance gradient.
Figure 8.
1990–2020 seasonal LST distribution statistics and trend fitting curves by distance gradient.
Figure 9.
1990–2020 summer LST box chart divided by Distance Gradient and LULC.
Figure 9.
1990–2020 summer LST box chart divided by Distance Gradient and LULC.
Figure 10.
1990–2020 seasonal LST distribution statistics and trend fitting curves by the WBSI.
Figure 10.
1990–2020 seasonal LST distribution statistics and trend fitting curves by the WBSI.
Figure 11.
1990–2020 summer LST box chart divided by the WBSI and LULC.
Figure 11.
1990–2020 summer LST box chart divided by the WBSI and LULC.
Table 1.
Metadata of the Landsat images used for this study.
Table 1.
Metadata of the Landsat images used for this study.
| Source | Acquired Date
(YYYY-MM-DD) | Acquired Time | Sensor ID | Cloud Cover | Spatial Resolution |
|---|
| Landsat5 | 1991-07-23 | 09:54:47 GMT + 8:00 | TM | 0.00 | 30 × 30 M |
| Landsat5 | 1998-08-11 | 10:09:47 GMT + 8:00 | TM | 0.00 | 30 × 30 M |
| Landsat7 | 2010-08-12 | 10:21:41 GMT + 8:00 | ETM+ | 7.00 | 30 × 30 M |
| Landsat8 | 2022-07-28 | 10:31:42 GMT + 8:00 | OLI_TIRS | 0.98 | 30 × 30 M |
Table 2.
Bands and spectral signatures of Landsat 5, 7, 8 images. Source: USGS handbook.
Table 2.
Bands and spectral signatures of Landsat 5, 7, 8 images. Source: USGS handbook.
| Source | SWIR | NIR | MIR | IR |
|---|
| Landsat5 | Band 7 | Band 4 | Band 5 | Band 3 |
| Landsat7 | Band 7 | Band 4 | Band 5 | Band 6 |
| Landsat8 | Band 7 | Band 5 | Band 6 | Band 4 |
Table 3.
Density segmentation method for LST classification.
Table 3.
Density segmentation method for LST classification.
| Thermal Type | LST Level Description | Standard Deviation Threshold | Threshold |
|---|
| T1 | extreme cold zone | | |
| T2 | cold zone | | |
| T3 | cool zone | | |
| T4 | moderate zone | | |
| T5 | warm zone | | |
| T6 | hot zone | | |
| T7 | extreme hot zone | | |
Table 4.
1990–2020 land use/land cover (LULC) type area and percentage statistics.
Table 4.
1990–2020 land use/land cover (LULC) type area and percentage statistics.
| Land Use Type | 1990 Total Area (ha) | 2000 Total Area (ha) | 2010 Total Area (ha) | 2020 Total Area (ha) |
|---|
| 1990 Area Percentage (%) | 2000 Area Percentage (%) | 2010 Area Percentage (%) | 2020 Area Percentage (%) |
|---|
| Cropland | 16,466.40 | 13,632.48 | 7176.96 | 433.44 |
| 28.92 | 23.94 | 12.61 | 0.76 |
| Forest | 22,583.52 | 10,159.20 | 6968.63 | 7896.65 |
| 39.67 | 17.84 | 12.24 | 13.87 |
| Greenfield | 3221.28 | 7663.68 | 6958.08 | 7429.79 |
| 5.66 | 13.46 | 12.22 | 13.05 |
| Commercial | 944.64 | 7277.76 | 8102.88 | 9446.40 |
| 1.67 | 12.78 | 14.23 | 16.59 |
| Residential | 5755.68 | 7102.08 | 8465.98 | 14,740.03 |
| 10.11 | 12.47 | 14.87 | 25.89 |
| Water | 3867.84 | 4462.56 | 4487.04 | 4597.92 |
| 6.79 | 7.84 | 7.88 | 8.08 |
| Road | 2170.08 | 3768.48 | 7784.64 | 9023.92 |
| 3.81 | 6.62 | 13.67 | 15.85 |
| Industry | 1923.84 | 2867.04 | 6992.64 | 3363.84 |
| 3.38 | 5.04 | 12.28 | 5.91 |
| Total | 56,933.28 | 56,933.28 | 56,933.28 | 56,933.28 |
| 100.00 | 100.00 | 100.00 | 100.00 |
Table 5.
1990–2020 seasonal land use type land surface temperature (LST) median and average statistics.
Table 5.
1990–2020 seasonal land use type land surface temperature (LST) median and average statistics.
| Year | Season | Property | Forest | Cropland | Greenfield | Residential | Road | Commercial | Industry | Water |
|---|
| 1990 | spring | median | 16.04468 | 16.04468 | 16.90057 | 16.90057 | 17.75073 | 18.17094 | 16.90057 | 13.66022 |
| mean | 15.93807 | 16.1475 | 16.91632 | 17.11824 | 17.76333 | 18.58474 | 16.98057 | 13.56742 |
| summer | median | 25.40057 | 25.40057 | 26.67371 | 27.93436 | 27.51553 | 29.18295 | 27.51553 | 21.94138 |
| mean | 25.28314 | 25.658 | 26.74502 | 27.94269 | 27.56512 | 28.60135 | 27.50613 | 22.10568 |
| autumn | median | 14.71396 | 15.17886 | 15.64191 | 16.10309 | 16.10309 | 16.56247 | 16.10309 | 15.17886 |
| mean | 14.76979 | 15.07609 | 15.83833 | 16.23091 | 15.92025 | 16.70009 | 16.01767 | 15.1845 |
| winter | median | 5.495605 | 5.495605 | 5.495605 | 6.000641 | 5.495605 | 6.503265 | 5.495605 | 4.988159 |
| mean | 5.202796 | 5.525734 | 5.765921 | 6.021916 | 5.710056 | 6.316591 | 5.775147 | 5.128916 |
| 2000 | spring | median | 14.61893 | 14.61893 | 14.61893 | 15.50217 | 15.06131 | 15.50217 | 14.61893 | 9.178864 |
| mean | 14.76336 | 14.49646 | 14.64769 | 15.72813 | 15.23546 | 15.48921 | 14.69877 | 9.728438 |
| summer | median | 27.51553 | 27.93436 | 28.3519 | 31.64517 | 30.41977 | 31.23795 | 28.7681 | 25.82635 |
| mean | 27.74625 | 28.27298 | 28.43634 | 31.62341 | 30.40376 | 31.19938 | 28.59332 | 25.73865 |
| autumn | median | 20.61893 | 21.06131 | 21.06131 | 21.50217 | 21.50217 | 21.50217 | 21.06131 | 17.47589 |
| mean | 20.87516 | 20.92066 | 21.05335 | 21.77076 | 21.46355 | 21.68859 | 21.17359 | 17.66864 |
| winter | median | 4.478271 | 7.003571 | 7.003571 | 7.501587 | 7.501587 | 7.501587 | 7.501587 | 7.997284 |
| mean | 4.653928 | 7.043201 | 7.04425 | 7.587824 | 7.531243 | 7.498746 | 7.28324 | 7.998072 |
| 2010 | spring | median | 16.90057 | 19.01553 | 17.75073 | 21.0965 | 20.2681 | 21.91977 | 21.50879 | 9.882355 |
| mean | 17.07107 | 18.9046 | 18.13147 | 21.23243 | 20.09084 | 21.81978 | 21.60188 | 10.61995 |
| summer | median | 24.9733 | 25.82635 | 25.40057 | 27.51553 | 26.67371 | 27.51553 | 27.51553 | 22.81519 |
| mean | 25.09188 | 25.82596 | 25.51176 | 27.32145 | 26.65884 | 27.41189 | 27.41945 | 22.98751 |
| autumn | median | 15.17886 | 16.10309 | 16.10309 | 16.10309 | 16.10309 | 16.10309 | 16.56247 | 12.83545 |
| mean | 15.00033 | 16.07167 | 15.79531 | 16.30177 | 16.0448 | 16.26065 | 16.53944 | 13.07103 |
| winter | median | 1.365479 | 2.413513 | 2.413513 | 2.413513 | 2.413513 | 2.413513 | 2.413513 | 5.495605 |
| mean | 1.204552 | 2.438516 | 2.306402 | 2.388947 | 2.568051 | 2.592431 | 2.670691 | 5.35603 |
| 2020 | spring | median | 16.90057 | 14.95184 | 16.1994 | 17.51175 | 18.35596 | 18.43561 | 18.27277 | 8.615753 |
| mean | 14.67554 | 14.8674 | 16.06578 | 17.58551 | 18.39342 | 18.49794 | 18.34303 | 9.001349 |
| summer | median | 24.9733 | 27.08307 | 27.61746 | 28.83603 | 29.73404 | 29.66306 | 29.48549 | 25.66431 |
| mean | 26.5182 | 27.15246 | 27.69375 | 28.83258 | 29.75992 | 29.70961 | 29.36934 | 25.85812 |
| autumn | median | 15.17886 | 17.60965 | 17.28909 | 17.83038 | 18.07095 | 18.20496 | 18.29587 | 16.19583 |
| mean | 15.82356 | 17.56839 | 17.3385 | 17.82818 | 18.06763 | 18.21729 | 18.40934 | 16.32962 |
| winter | median | 1.365479 | 12.39044 | 11.09726 | 11.31842 | 10.95679 | 11.42072 | 11.81827 | 7.746918 |
| mean | 10.57356 | 12.17768 | 11.12146 | 11.19293 | 10.87254 | 11.37231 | 11.72043 | 7.870133 |
Table 6.
1990–2020 seasonal average LST by directional zone statistics.
Table 6.
1990–2020 seasonal average LST by directional zone statistics.
| Direction | WBSI | Year | LST |
|---|
| Spring | Summer | Autumn | Winter |
|---|
| E-NE | 1.5253 | 1990 | 16.5274 | 26.1608 | 15.8972 | 5.7939 |
| 2000 | 14.5901 | 30.1015 | 20.9587 | 7.6255 |
| 2010 | 20.0421 | 26.7125 | 15.9076 | 3.0211 |
| 2020 | 17.1115 | 29.4800 | 18.0686 | 10.9604 |
| E-SE | 1.3507 | 1990 | 16.3295 | 25.5706 | 15.6888 | 5.7715 |
| 2000 | 13.7825 | 29.4010 | 20.7432 | 7.5420 |
| 2010 | 18.7765 | 26.7246 | 15.5020 | 3.4523 |
| 2020 | 15.9935 | 29.0292 | 17.1190 | 9.7446 |
| N-NE | 1.5338 | 1990 | 16.8639 | 27.0799 | 15.7994 | 5.6658 |
| 2000 | 15.3599 | 30.2815 | 21.6966 | 7.2634 |
| 2010 | 21.1895 | 26.6782 | 16.1914 | 2.4047 |
| 2020 | 18.3811 | 29.2943 | 18.2673 | 11.4559 |
| N-NW | 1.5038 | 1990 | 17.1133 | 26.6236 | 15.5817 | 5.1823 |
| 2000 | 15.4313 | 30.1639 | 21.3931 | 7.4696 |
| 2010 | 21.3885 | 26.8768 | 16.1721 | 2.29886 |
| 2020 | 18.1732 | 29.0066 | 17.9217 | 10.61853 |
| S-SE | 1.5861 | 1990 | 16.0136 | 25.0502 | 14.9146 | 5.7233 |
| 2000 | 13.7579 | 28.3222 | 20.6894 | 7.2375 |
| 2010 | 17.9213 | 26.2513 | 15.5088 | 3.0696 |
| 2020 | 15.6908 | 28.6032 | 17.1172 | 10.5511 |
| S-SW | 1.6509 | 1990 | 15.5259 | 24.6928 | 14.6832 | 5.3574 |
| 2000 | 13.9667 | 27.6944 | 20.3486 | 6.8755 |
| 2010 | 17.0425 | 25.4327 | 15.4793 | 2.5305 |
| 2020 | 14.9548 | 27.6250 | 16.9964 | 10.7520 |
| W-NW | 1.8282 | 1990 | 15.6137 | 25.6706 | 14.7730 | 5.4439 |
| 2000 | 14.5380 | 28.4271 | 20.5172 | 6.5807 |
| 2010 | 19.5068 | 26.0381 | 15.9196 | 2.1005 |
| 2020 | 17.1280 | 27.6665 | 17.6144 | 10.9529 |
| W-SW | 1.4751 | 1990 | 16.1473 | 25.5600 | 14.8520 | 5.0256 |
| 2000 | 14.9192 | 28.3589 | 21.3178 | 5.0253 |
| 2010 | 18.2650 | 25.6243 | 15.4889 | 1.7201 |
| 2020 | 15.7135 | 27.0130 | 16.4139 | 10.9931 |
| Disclaimer/Publisher’s Note: The statements, opinions and data contained in all publications are solely those of the individual author(s) and contributor(s) and not of MDPI and/or the editor(s). MDPI and/or the editor(s) disclaim responsibility for any injury to people or property resulting from any ideas, methods, instructions or products referred to in the content. |
© 2024 by the authors. Licensee MDPI, Basel, Switzerland. This article is an open access article distributed under the terms and conditions of the Creative Commons Attribution (CC BY) license (https://creativecommons.org/licenses/by/4.0/).


