Article

Can an Energy Transition Strategy Induce Urban Green Innovation? Evidence from a Quasi-Natural Experiment in China

1
College of City Construction, Jiangxi Normal University, Nanchang 330022, China
2
School of Economics and Management, Nanchang University, Nanchang 330031, China
3
School of Economics and Trade, Hubei University of Economics, Wuhan 430205, China
*
Author to whom correspondence should be addressed.
Sustainability 2024, 16(8), 3263; https://doi.org/10.3390/su16083263
Submission received: 18 February 2024 / Revised: 4 April 2024 / Accepted: 11 April 2024 / Published: 13 April 2024
(This article belongs to the Section Energy Sustainability)

Abstract

:
Green innovation is a new driving force to promote green and low-carbon development. Whether an energy transition strategy can induce green innovation is an important question that has not been clearly answered. With the help of panel data from 281 cities in China during 2007–2021, this study considers China’s new energy exemplary city policy as a quasi-natural experiment and conducts a difference-in-differences model to explore the effects and mechanisms of energy transition strategy on urban green innovation. The results show that a new energy exemplary city effectively induces urban green innovation, with mediating mechanisms of increasing government financial support, promoting human capital agglomeration, and improving energy efficiency. The moderating mechanisms test reveals that environmental regulation and intellectual property protection play a positive moderating role in the promotion of green innovation through the new energy exemplary city policy. Heterogeneity analysis suggests that the new energy exemplary city policy has a stronger effect on promoting green innovation in eastern regions and non-resource-based cities. Our findings not only enrich our understanding of the relationship between energy transition strategy and green innovation but also provide a reference for policymakers to promote energy transition and green innovation.

1. Introduction

Green innovation (GI) is a key support system for achieving peak carbon emission and carbon neutrality goals and promoting high-quality economic development [
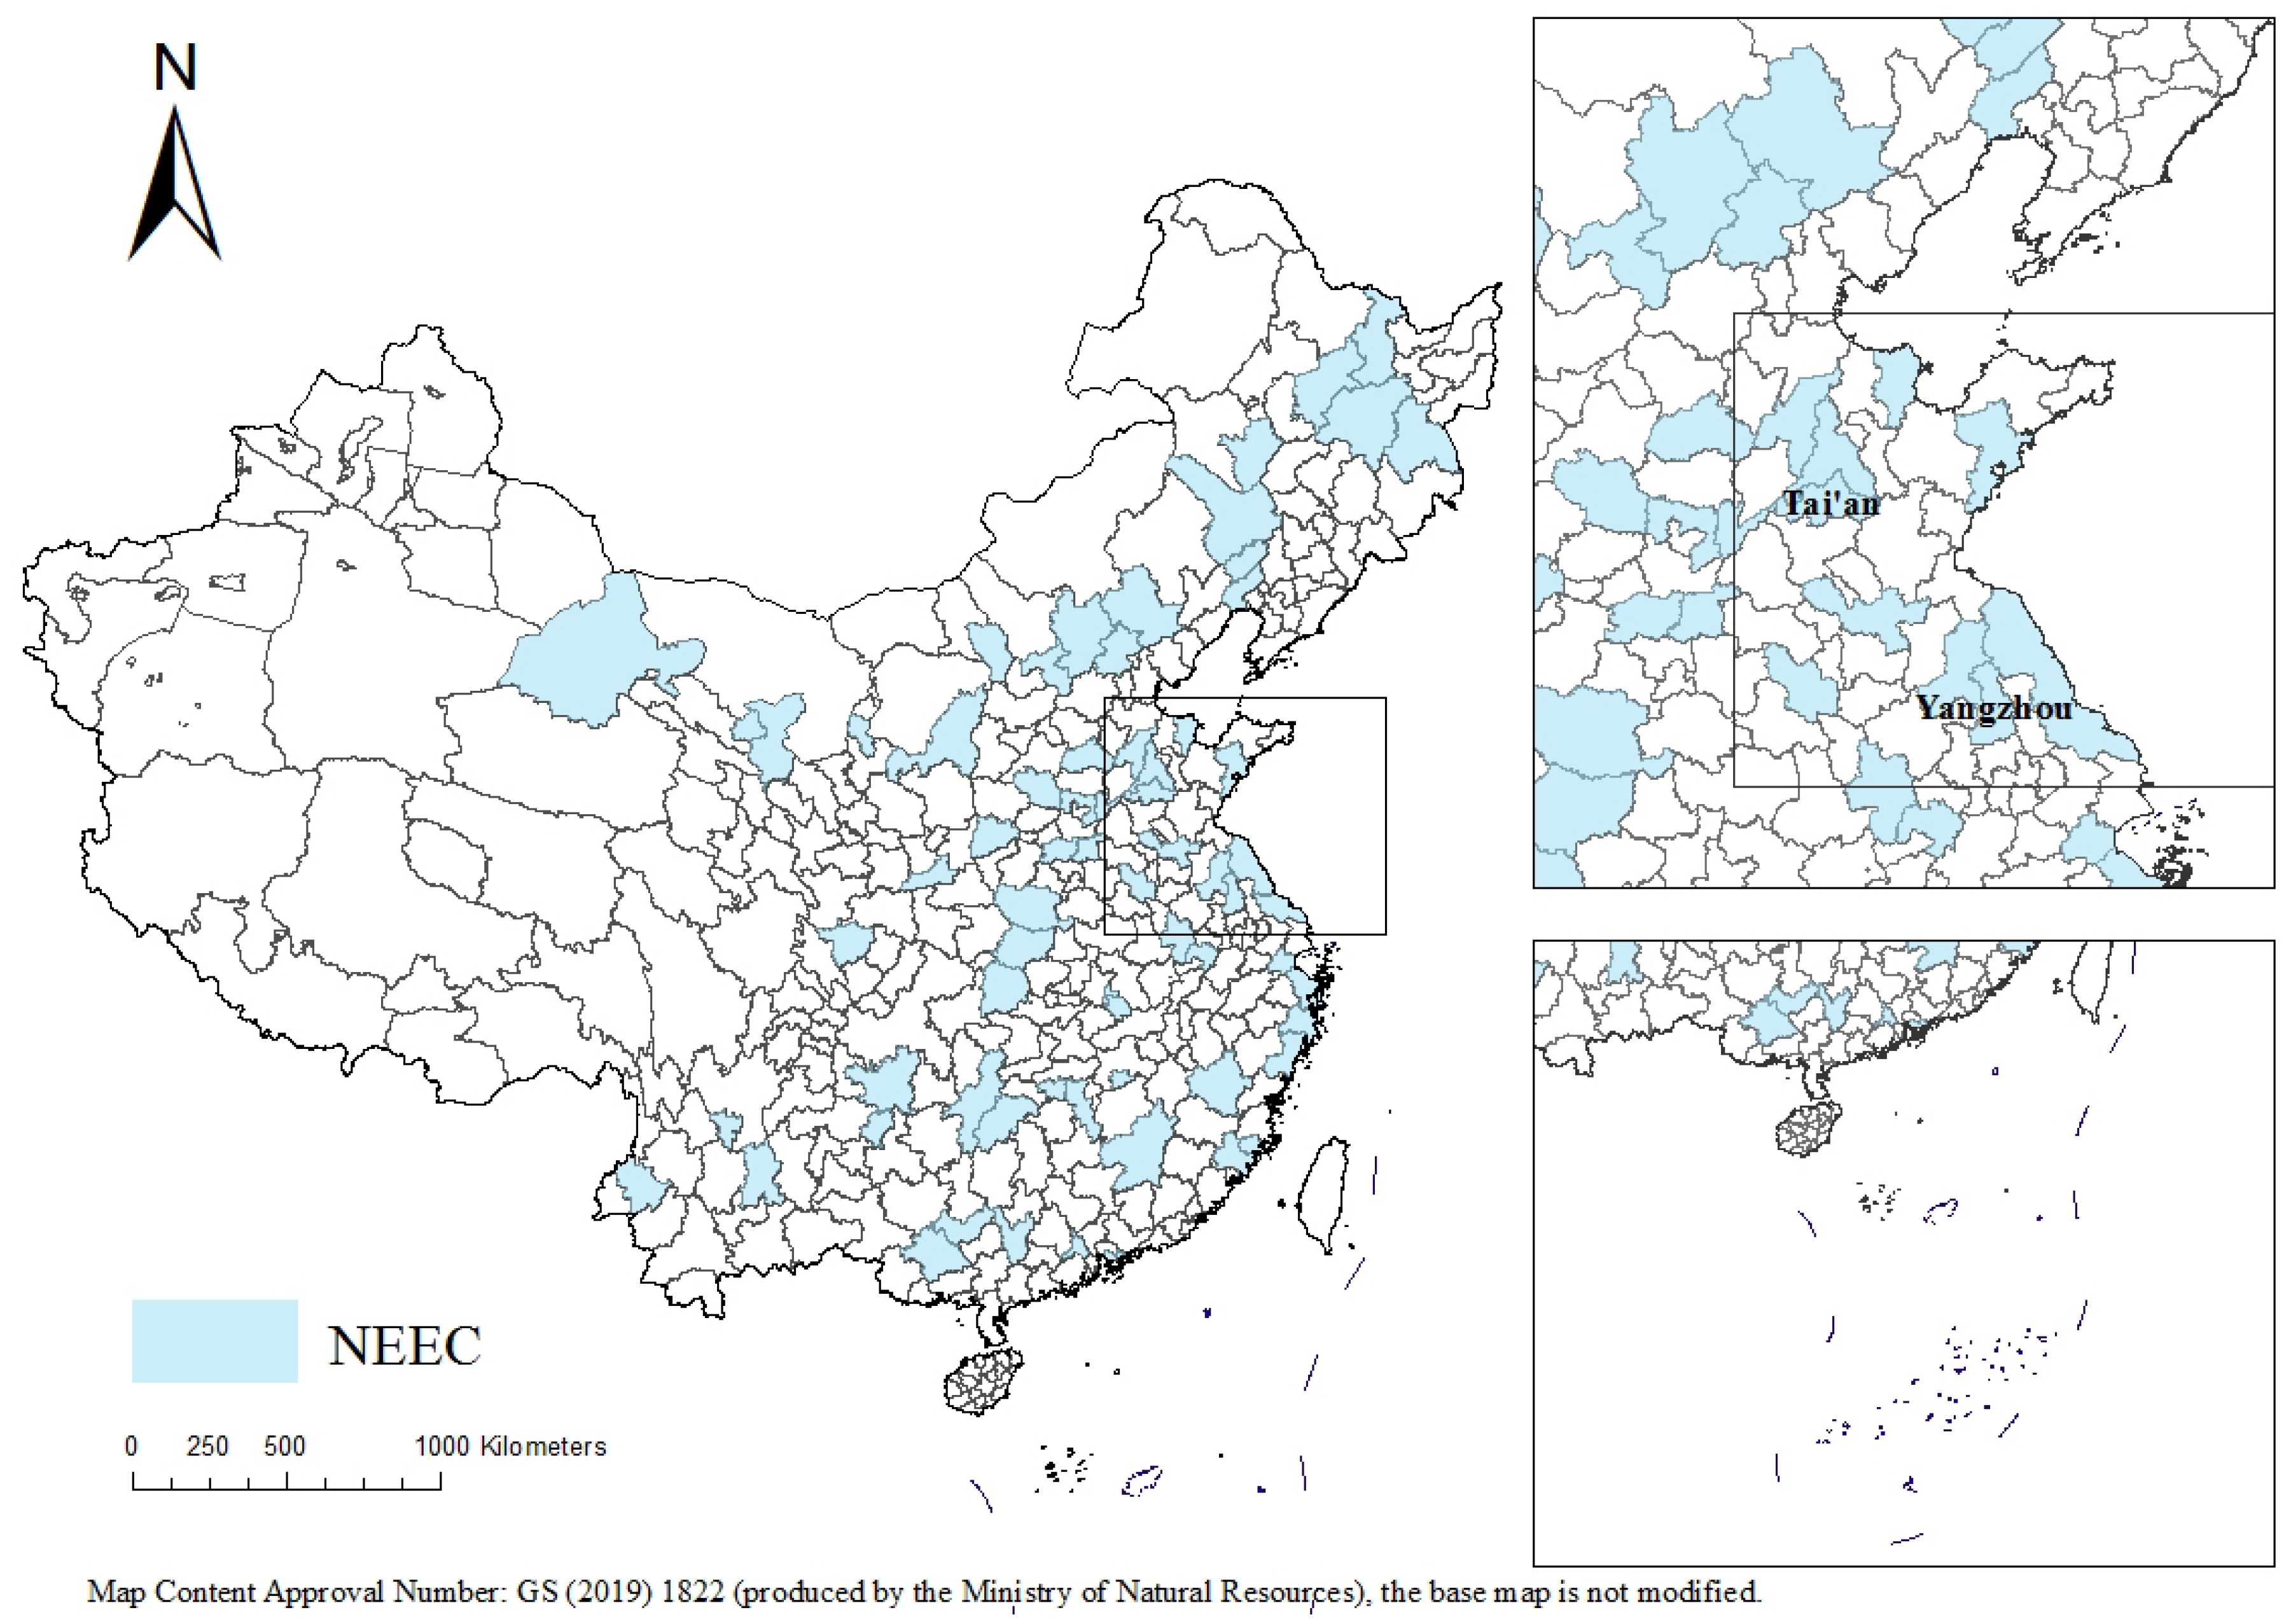
1]. Cities are important carriers of GI activities; therefore, how the urban GI level can be efficiently enhanced and the “win-to-win” of economic and ecological efficiencies can be realized are important research topics. Moreover, another major and urgent task is to accelerate the energy structure transformation, so that we can build a clean, low-carbon, secure and effective energy system. In order to encourage and support new energy development, in January 2014, China launched the new energy exemplary city (NEEC) construction project, which includes 81 cities (districts). The aim was for these cities to accumulate experience in energy transition and assume a leading and demonstrative role for other cities. In the deployment of the project, the NEEC especially emphasized the promotion of energy transition by vigorously developing new energy, renewable energy, and other GI technologies. An obvious question is whether the NEEC can induce the development of urban GI? If the answer is yes, what are the potential mechanisms? Is the NEEC’s GI effect heterogeneous? Clarifying these questions would consolidate the early development achievements of the NEEC and provide a reference for further promotion of the NEEC, which would accelerate energy transition and promote GI technologies.
This study explores the GI effect of the NEEC, which is mainly related to two types of literature. In essence, the NEEC belongs to one kind of environmental regulation (ER); therefore, the first kind of literature related to our study mainly concentrates on the correlation between ER and GI, which has drawn different research conclusions. First, some scholars think that ER can have an “innovation compensation” effect, which means that the opposite ER can force firms to undertake more innovative activities and increase their productivity, compensating for environmental management costs [2]. For example, using 39 independent research papers published from 2006–2020 in China, Ren and Chen [3] analyzed the relationship between ER and enterprise GI, and a positive effect was reported for the ER on enterprise GI. Similarly, the GI of firms in pilot areas was introduced into China’s carbon emissions trading pilot policy [4]. Utilizing the panel dataset of 25 European nations from 1994–2020, Khurshid et al. [5] used the Spatial Durbin model to find that ER promoted GI. In addition, plenty of literature has demonstrated the promotional effect of ER on GI from different perspectives [6,7,8,9,10,11]. Secondly, some scholars suggest that ER will produce a “compliance cost” effect, which means ER will increase how enterprises invest in environmental treatment and produce a “capital crowding-out” effect [12]. For example, Liang et al. [13] used 285 cities from 2010–2020 to show that ER inhibited GI. Similarly, Xu et al. [14] also reached this conclusion. In addition, some scholars think that there is a non-linear relationship between ER and GI. For example, Song et al. [15] found a U-shaped relationship between ER and GI, indicating that as ER increases, its role will gradually change from suppressing to stimulating GI. Yang and Zhao [16], as well as Khattak [17], studied the impact of ER on GI and arrived at the same conclusion.
The second type of literature is mainly centered on the influences of energy policy on environmental contamination prevention. In general, most of the current literature confirms the positive role of energy policy in environmental contamination control. Iqbal et al. [18] used non-radial data envelopment analysis and found that energy policies had a significant role in promoting environmental pollution prevention and control. Ghazouani et al. [19] reported that environmental taxes were effective in reducing overall pollution efflux. Kiss and Popovics [20] revealed that energy policy implementation at the national level was successful at reducing per capita CO2 emissions. Yang et al. [21] reported that green finance could dramatically reduce environmental pollution, while Khan et al. [22] found that renewable energy affected CO2 emissions based on consumption.
The NEEC is a typical energy policy, and since its implementation, its effectiveness has received much scholarly attention. For example, utilizing the DID model, Wang and Ma [23] employed the effect of the NEEC on air pollution and explored that the NEEC could essentially reduce SO2. Zhou et al. [24] used panel data from 271 Chinese cities and detected that the NEEC significantly enhanced energy efficiency. Feng and Nie [25] used the DID framework and suggested that the NEEC could reduce pollutant emission intensity, while Zhang et al. [26] found that the NEEC promoted green energy consumption.
Some studies focused on the relationship between ER and GI [27,28], and the impact of energy policy on environmental contamination prevention [29,30,31], but few studies focused on the impact of energy policy on GI through the NEEC policy. From the existing literature, although local policies represented by NEEC are also discussed by scholars, they are mainly related to air pollution [23], energy efficiency [26], and carbon emissions [32]. In practice, relevant departments emphasized the importance of GI activities in the implementation of energy policy. However, whether energy policy can effectively improve GI lacks theoretical research and empirical evidence. In particular, there is limited specialized research on the GI effect of the NEEC. Therefore, the NEEC is considered a quasi-natural experiment and uses the DID model for urban GI.
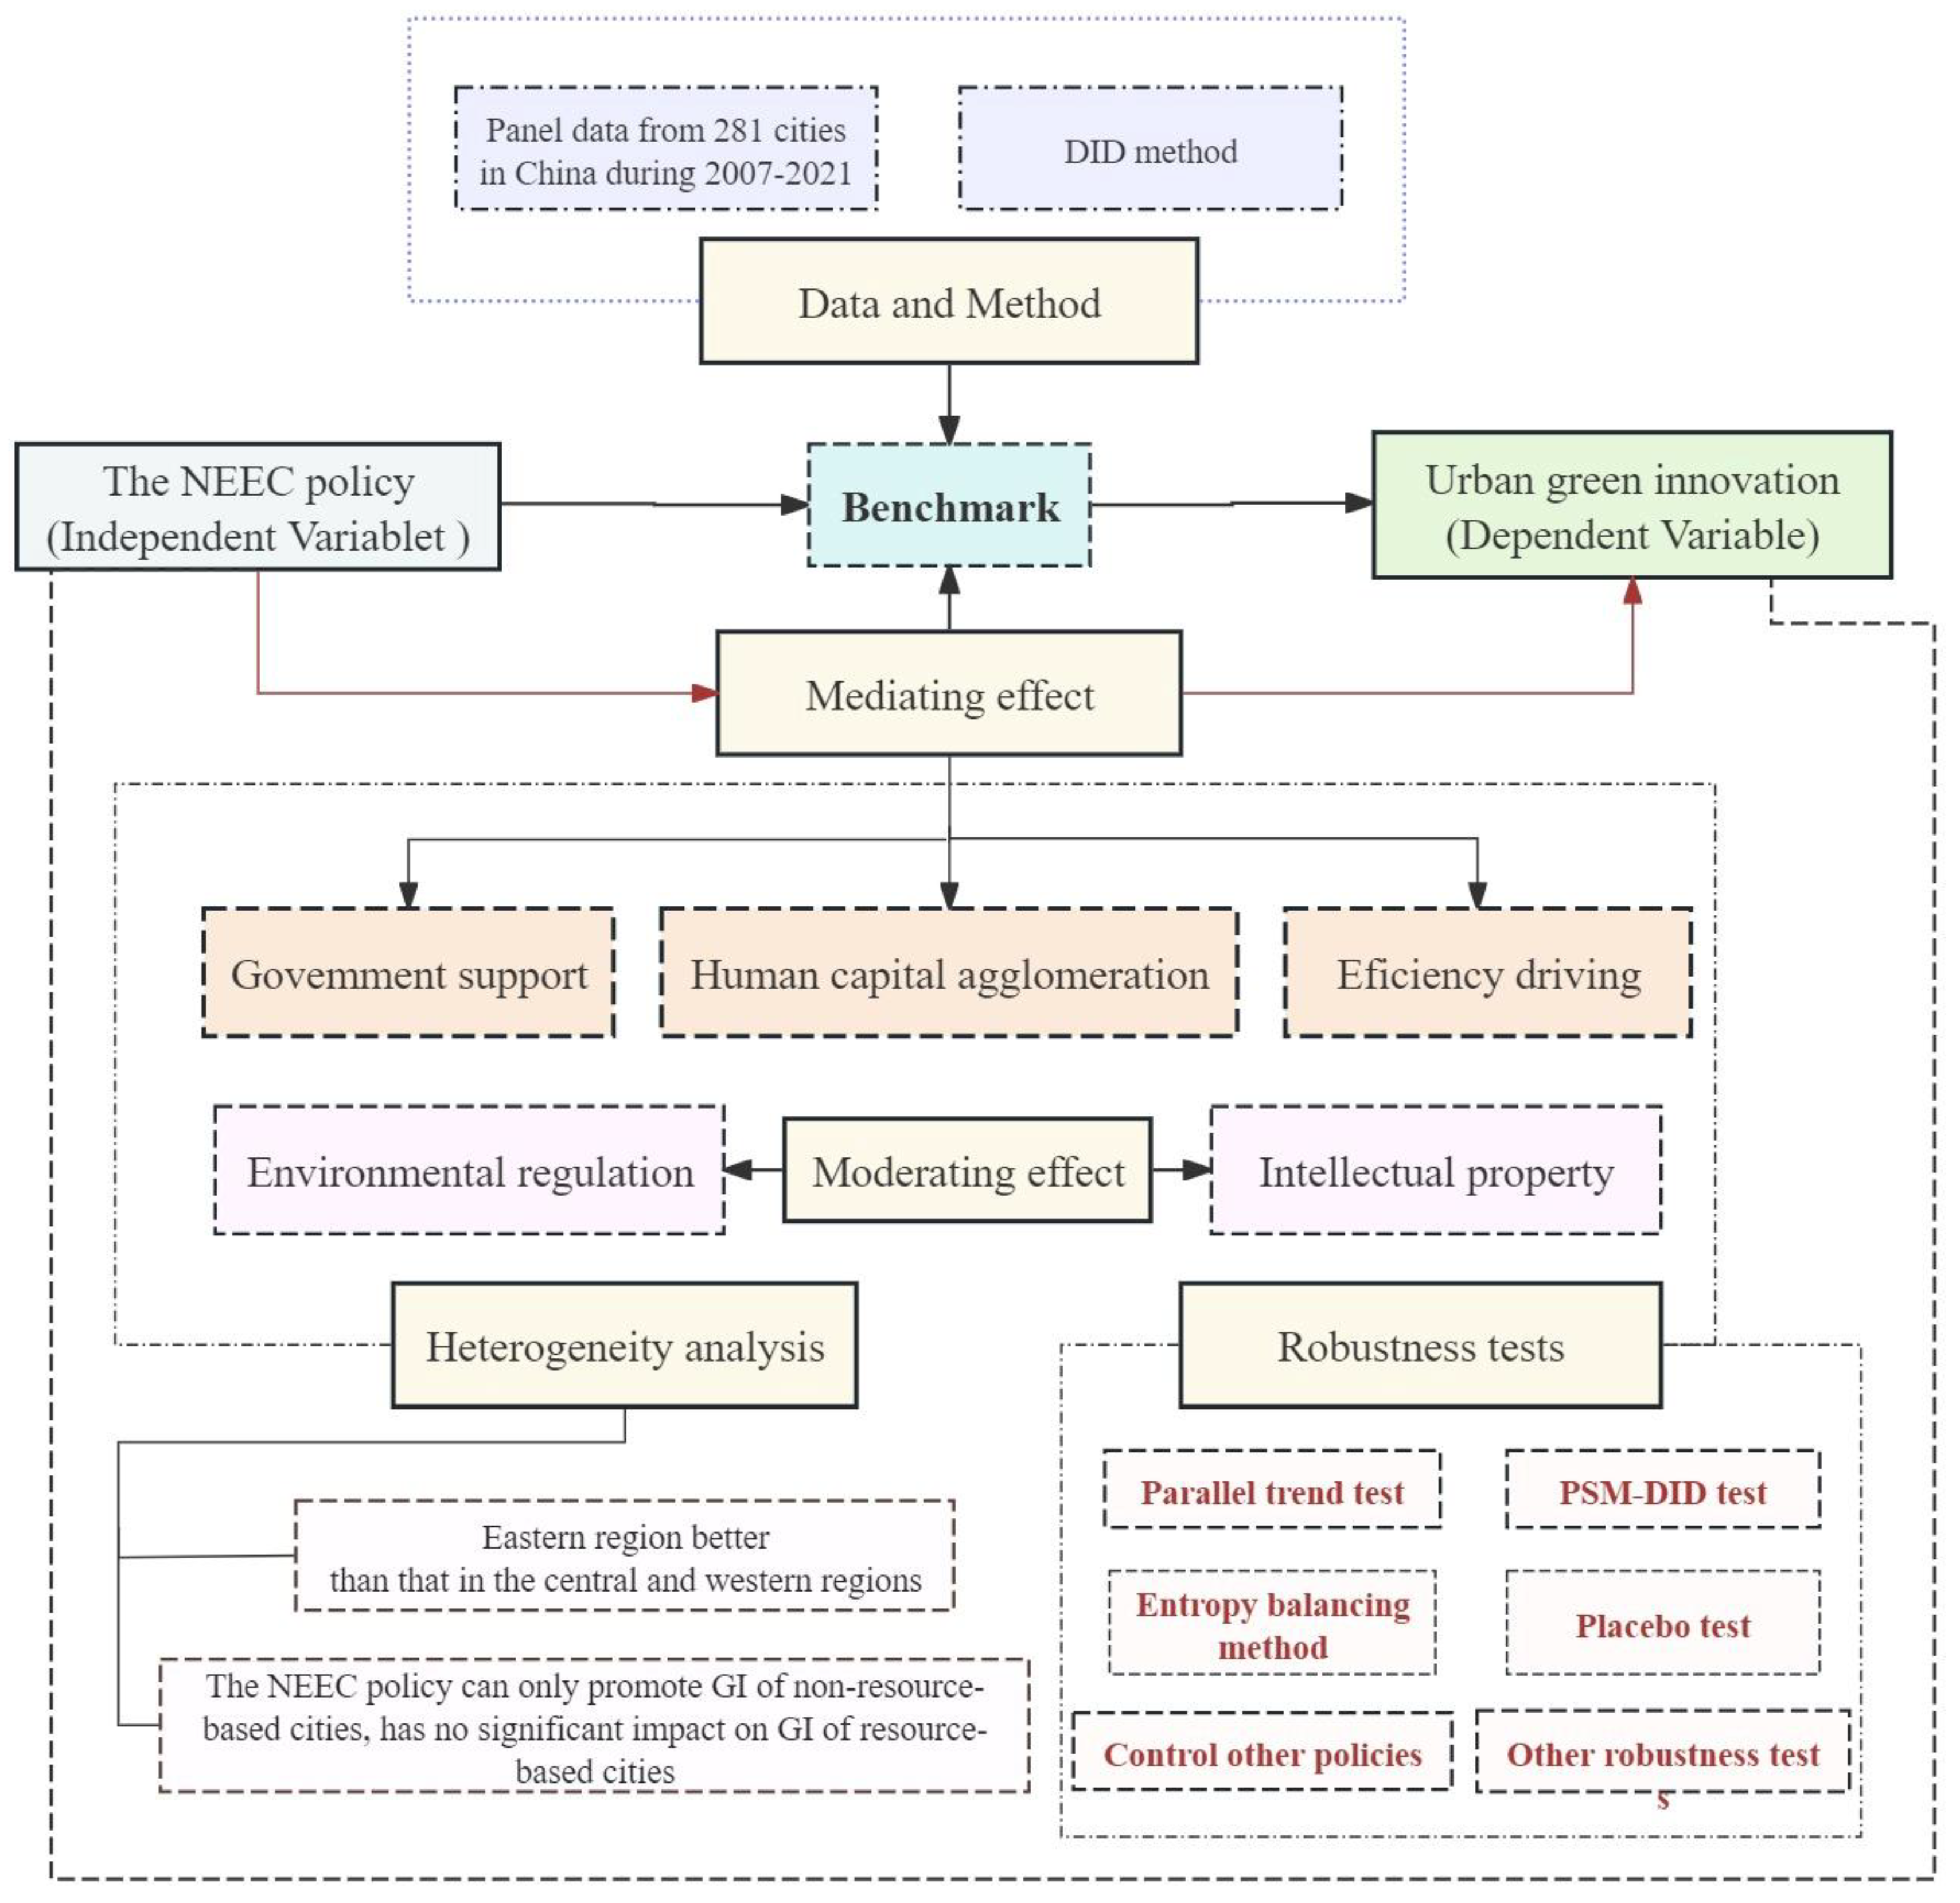
To examine the impact and workings of the energy transition strategy on urban GI, we employed the NEEC as a quasi-natural experiment in this context. Our key conclusions are threefold. Firstly, for every 1% increase in the NEEC, per capita green patent application number, per capita green invention patent application number, and per capita green utility model patent application number increase by 0.403, 0.234, and 0.169, respectively. It means that the NEEC can promote GI. Secondly, based on the mediation model, we verify that the NEEC can promote GI by increasing government support, human capital, and energy intensity. Thirdly, by using the moderation effect model, we discover that as ER and intellectual property protection rise, so does the GI effect of NEEC.
There are mainly three innovations in this study. First, in the exploration of the research theme, based on the NEEC, we investigate the influence of energy transition strategy with respect to urban GI, which enriches the literature on the evaluation of the effects of energy transition strategy represented by the NEEC and the influencing factors of GI. Second, as an identification strategy, our study uses the NEEC as a natural exogenous shock and adopts the DID method to distinguish the causality between the NEEC and GI, which alleviates possible endogenous problems such as reverse causality and missing variables to a certain extent. Further, the empirical results provide robustness to the overall findings. Third, for study content, in addition to studying the direct impact, we further investigate the mediating, moderating, and heterogeneity of NEEC’s impact on GI, which helps to provide references for the scientific implementation of energy transition strategies and the promotion of GI.

2. Policy Background and Theoretical Hypotheses

2.1. Policy Background

Faced with increasingly severe energy and environmental challenges, countries worldwide have developed new energy as an important way to transform energy development modes and optimize their energy structures. For China, despite breakthroughs in energy transition since the reform and opening up, the proportion of non-fossil energy production and consumption increased from 3.1% and 3.4% in 1978 to 18.8% and 15.3% in 2019, respectively. However, the coal-dominated energy structure has not been fundamentally reversed. The Chinese government attaches great importance to the development of new energy. As early as in the Tenth Five-Year Plan, they put forward the strategic deployment of “developing wind, solar, biomass and other new energy sources in the light of local conditions”. Thereafter, the Eleventh Five-Year Plan and the Thirteenth Five-Year Plan put forward new and higher requirements for new energy industry development. These plans set out a binding target for “raising the share of non-fossil energy in total energy consumption to around 20 percent”. At the legislative level, the Law of the People’s Republic of China on Energy Conservation and the Law of the People’s Republic of China on Renewable Energy were implemented in 1998 and 2006, respectively, to provide a legal basis for supporting and encouraging new energy development. In May 2012, the National Energy Administration (NEA) first proposed the NEEC to promote the energy revolution and explore new ways and models of energy transition. The aim was to develop cities that could fully utilize local renewable energy and increase the percentage or scale of renewable energy in energy consumption. In January 2014, the list of 81 cities (districts) selected as the first batch of the NEEC was released, marking the official implementation of the NEEC. It should aim to promote sustainable urban development, combining with the construction of new urbanization, following the development concept of new towns, new energy, and new life. The priority development strategy for renewable energy should be established to make full use of local renewable energy resources. Furthermore, the NEEC actively promotes the application of various new energy and renewable energy technologies in the fields of electricity, heating, gas supply, transportation, and construction in urban areas and significantly increases the proportion of urban renewable energy consumption. Among them, the eastern, central, and western regions include 26, 28, and 27 exemplary cities, respectively. These cities covered a wide area, were evenly distributed throughout the regions, and were representative enough to provide valuable opportunities for evaluating the GI effect of the NEEC.

2.2. Theoretical Hypotheses

2.2.1. Direct Effect

In contrast to traditional innovation activities, GI activities are more costly, difficult, and riskier. Therefore, GI activities cannot be conducted without the guidance of relevant government policies and measures [33]. For example, the low-carbon city pilot policy was implemented to stimulate GI by providing financial support, such as government subsidies, to relevant enterprises [34]. Implementation of The Green Credit Guideline can reduce agency costs and refine corporate investment efficiency, thereby increasing corporate GI [35]. As a typical example of China’s energy policy system, the NEEC cannot be separated from the guidance and support of the GI for enhancing the energy transition. Considering the requirements for the NEEC, each exemplary city should be founded on its own new energy resource basis, industrial structure, and other conditions for construction. In the specific work deployment, the NEA took “promote renewable energy and technology application” and “promote technological progress adapt to new energy utilization” as the principal content of the NEEC. The NEA also clearly proposed to “actively explore all kinds of new energy technology in the application of city supply”. On the basis of these requirements, exemplary cities have drawn up development plans, most of which specify promoting GI through technology in the process of energy transition. For example, the Implementation Plan for Creating the NEEC in Yangzhou proposed developing new technologies with independent intellectual property rights to focus on supporting cutting-edge technology research and development in areas such as photovoltaic power generation and geothermal utilization. The Implementation Plan of Building the NEEC in Tai ‘an emphasized the long term development and transformation of solar energy utilization technology. Therefore, the NEEC implementation is likely to induce GI. According to these examples, we suggested Hypothesis 1:
Hypothesis 1. 
The NEEC can improve urban GI.

2.2.2. Mediating Mechanisms

Based on a systematic examination of the policy background and pertinent literature, we suggest that the NEEC is conducive to increasing the government’s financial support, enhancing human capital agglomeration, and promoting energy utilization efficiency, thus strengthening the GI level of the NEEC.
(1) Government support: Local government competition is an unavoidable and important research topic. As China’s economic development continues to rise, competition among local governments has gradually evolved into multi-dimensional competition and expanded into broader fields, such as environmental protection [36]. Therefore, the NEEC is an important incentive for regional governments. On the one hand, renewable energy is different from traditional fossil energy that is inexhaustible [37]. Therefore, the NEEC can enhance the environmental quality of the jurisdiction and increase the “power” of local officials in non-economic competition. On the other hand, the NEEC is an honorary title, and the successful completion of the NEEC may provide more opportunities for the promotion of local officials. Hence, the local government will formulate a series of economic support policies that are conducive to urban new energy development to achieve the NEEC objectives. In addition, the NEEC Evaluation Index System and Explanation (Trial) also puts forward clear assessment criteria for local policy support, requiring local governments to support the NEEC by establishing special funds for new energy technologies. Under the influence of policy guidance and financial support, the information asymmetry and financing constraints faced by enterprises in the NEEC to carry out GI activities will be reduced, promoting GI improvements in cities [38].
(2) Human capital agglomeration: With the major changes in development mode, ecological environmental degradation is more severe than ever before. The pressure to adjust the economic structure, improve energy efficiency, and ensure energy security is increasing [39]. In the historical course of new energy gradually replacing fossil energy, it will also have a profound impact on industrial development. Specifically, in the process of NEEC implementation, local governments will develop corresponding industrial policies to achieve energy transition goals [40], which may have dual effects of both damaging and reshaping the industrial structure. Because the NEEC reduces fossil energy consumption, the development of industries that consume high energy and traditional fossil energy will be limited. However, because new energy sources are supported, low-energy industries that consume and rely less on traditional fossil energy will usher in rapid development opportunities [41]. With the upgrading of industrial structures, the attractiveness and demand for talents will also correspondingly increase, thereby promoting human capital aggregation in the exemplary cities. Moreover, human capital aggregation will contribute to the extension of new energy and further enhance GI in cities [39].
(3) Efficiency driving: The core objective of the NEEC is to increase the percentage of new energy consumption and accelerate the realization of the energy transition. In terms of theory, this can be achieved in two ways. First, the development scale and new energy utilization must be expedited. Second, the use of traditional fossil fuels needs to be limited and decreased. This is because the first will increase the proportion of technology- and knowledge-intensive industries to promote energy efficiency [18], and the second will play a “reverse force” role to promote energy efficiency. Yang et al. [41] suggested that the NEEC can improve the efficiency of resource allocation through technological innovation. Furthermore, it can promote GI technology development and play a crucial role in driving urban GI. For this, we suggested Hypothesis 2:
Hypothesis 2. 
The NEEC enhances GI through three channels: government support, human capital agglomeration, and efficiency driving.

2.2.3. Moderating Mechanisms

In addition to energy policies such as the NEEC, GI activity development also relies on other relevant institutional guarantees. Whether the GI effect of the NEEC is really transformative depends on other institutional factors in the city. We mainly examined the moderating mechanisms of the NEEC to promote urban GI from two perspectives: ER and intellectual property protection.
(1) ER: ER can entice innovation activities through the “innovation compensation” effect and enhance the promotion of GI. The stronger the urban ER is, the stronger the motivation of domestic firms to conduct GI activities. Therefore, the NEEC also plays a relatively strong role in enhancing GI.
(2) Intellectual property protection: As a crucial institutional arrangement for protecting innovation, intellectual property protection undoubtedly has an important impact on GI development. The Guiding Opinions set forth clear requirements for intellectual property protection, promoting GI. Therefore, the higher the intellectual property protection level, the more it can stimulate GI activities, and the NEEC can provide more significant support for GI. Thus, we suggested Hypothesis 3:
Hypothesis 3. 
The stronger the ER and the higher the intellectual property protection level, the more significant the promotional effect the NEEC construction will have on the urban GI level.
Figure 1 shows a theoretical framework for how the NEEC promotes urban GI.

3. Research Design

3.1. Model

The DID method is mainly used to evaluate the impact of a particular event or policy. It treats the implementation of a policy as a natural experiment by adding a control group that is not affected by the policy to the sample. It then compares this control group with the sample points originally affected by the policy to analyze the net impact of the policy implementation on the subject of analysis. The first difference is that the experimental group and the control group are separately differenced (subtracted) before and after policy implementation to obtain two sets of differences, representing the relative relationship of the experimental group and the control group before and after intervention; the second difference: the two sets of differences are differenced a second time to eliminate the inherent differences between the experimental group and the control group, ultimately obtaining the net effect brought about by the intervention. Therefore, the NEEC is used as a quasi-natural experiment, and we use the DID model to explore the effects of the NEEC on urban GI. Specifically, we construct a basic regression equation as follows:
Y i t = β 0 + β 1 P i l o t i T i m e t + β 2 X i t + μ i + δ t + ε i t
where the subscript i denotes the city and t indicates the year. Y denotes the urban GI level, the higher the Y value, the greater the urban GI level. The higher GI can promote economic growth and improve the environment. PilotTime is the interaction term between the grouping dummy variable and the policy implementation dummy variable, which refers to China’s NEEC construction policy. The year since it was selected as NEEC is 1, otherwise it is 0. X represents a range of control variables; μi and δt indicate the city and year fixed effects, respectively; and εit is the error term. We mainly focus on β1 in the above model. A positively significant β1 indicates that the NEEC will promote urban GI levels.

3.2. Variables

3.2.1. Dependent Variables

Green patents are the most widely used indicators for measuring GI levels. Among them, the number of green patents is allocated to application and authorization numbers. Since there is a time lag of 1–3 years between patent application and authorization and patent authorization is affected by testing, annual fee payment, and other factors, there is a high level of uncertainty in using green patents as a measure for GI. Therefore, the GI level is more accurately reflected through the green patent application number. On this basis, to eliminate the impact of urban scale, we use the per capita green patent application number as the dependent variable. Specifically, there are three dependent variables in this article: per capita green patent application number (per_gpata), per capita green invention patent application number (per_ingrva), and per capita green utility model patent application number (per_ugrma) [36].

3.2.2. Independent Variable

The independent variable is PilotTime. Pilot mainly reflects the difference between NEEC and non-NEEC. If a city belongs to exemplary cities, the value of Pilot is 1, otherwise it is 0. Time mainly reflects the difference before and after the implementation of the NEEC policy. If the time is in the year of policy implementation (i.e., 2014) and after, the value of Time takes 1, otherwise it takes 0. Specifically, the sample in this study contains 68 NEEC and 213 non-NEEC. Figure 2 shows the distribution of NEEC.

3.2.3. Control Variables

Drawing on previous studies [25,42,43], we select a series of control variables: (1) Economic development (growth), which is measured as the GDP growth rate. Economic growth can invest more funds in GI. (2) Industrial structure (indus), which is expressed as the proportion of added value of the secondary industry to GDP. The industrial structure and development of a city are highly correlated with its GI level. (3) Government intervention (gov), which is calculated by the ratio of fiscal expenditure to GDP. Excessive government intervention may inhibit the vitality of GI. (4) Infrastructure construction (infra), which is represented by the per capita urban road area. New infrastructure construction can reduce the consumption of fossil fuels to a certain extent, which is an important factor affecting carbon emissions and may have a certain impact on GI. (5) Population density (popden), which is expressed as the natural logarithm of population per unit area. A larger population density means more labor resources, which may be conducive to the development of GI. (6) Openness (open), which is calculated by the ratio of total imports and exports to GDP. New technologies introduced from abroad may have a certain impact on GI.

3.3. Data and Descriptive Statistics

This study employs panel data from 281 cities in China from 2007–2021, which includes research samples from seven years before and after NEEC implementation. Green patent data are from the CNRDS Platform database, and other data are mainly collated from the China Urban Statistical Yearbook (2008–2022) and the CEIC database. Descriptive statistics of variables are presented in Appendix A Table A1. We can see that the range of per_gpata values in the sample is from 0.002 to 35.407, indicating a significant difference in GI level between different cities. The same is true for per_ingrva and per_ugrma.

4. Empirical Results

4.1. Basic Regression

Table 1 reports the basic results. Columns (1), (3), and (5) do not include control variables, while columns (2), (4), and (6) add the urban level control variables for regression. We can see that the coefficients of PilotTime are all significantly positive at the 1% level, indicating that the NEEC positively affects the GI level, which preliminarily confirms Hypothesis 1. From an economic perspective, assuming all other factors remain the same, the establishment of the NEEC has, on average, resulted in a 0.403, 0.234, and 0.169 increase in the number of per capita green patent applications, green invention patent applications, and green utility model patent applications in exemplary cities relative to non-exemplary cities. Since the NEEC started in 2014, we have captured the average treatment effect of eight years, which is equivalent to increases of 0.050, 0.029, and 0.021 for the three dependent variables in the exemplary cities each year, respectively; with 5.40%, 7.07%, and 4.07% of the sample averages, respectively. These results indicate that the NEEC can induce urban GI activities and improve urban GI levels.

4.2. Mediating Mechanisms Test

In order to identify how the NEEC induces urban GI, we use the mediating effect model:
Y i t = β 0 + β 1 P i l o t i T i m e t + β 2 X i t + μ i + δ t + ε i t
M i t = θ 0 + θ 1 P i l o t i T i m e t + θ 2 X i t + μ i + δ t + ε i t
Y i t = γ 0 + γ 1 P i l o t i T i m e t + γ 2 M i t + γ 3 X i t + μ i + δ t + ε i t
where M represents the mediating variables, including: (1) government support (Fiscal), which is expressed as urban per capita fiscal expenditures on science, technology, and education; (2) human capital (Hc), which is expressed as the proportion of college students in the total population; and (3) energy intensity (Efficiency), which is expressed as electricity consumption per unit GDP.
According to the test steps, Model (2) describes the total effect of the NEEC on urban GI level and is coincident with the basic regression. Model (3) reflects the influence of the NEEC on mediating variables, and Model (4) also examines the influence of the NEEC and intermediary variables on the urban GI level. In the process of empirical analysis, we are mainly concerned with the significance and magnitude of β1, θ1, γ1, and γ2. When both θ1 and γ2 are significant, it indicates the presence of a mediating effect. In this case, if γ1 is not significant, it means there is a complete mediating effect; if γ1 is significant and its value is less than β1, it indicates a partial mediating effect.

4.2.1. Government Support

As the main body of the NEEC implementation, local governments will provide the necessary financial support and implement the development of urban GI activities to expedite the transformation and upgrading of the energy structure and achieve the construction targets. To test this mechanism, we use Fiscal as a government-supported proxy variable and estimate. Column (1) of Table 2 shows that the coefficient of PilotTime is significantly positive at the 1% level, providing evidence that the NEEC can change the fiscal expenditure bias of local governments and increase the financial investment of local governments in science, technology, and education. Columns (2) to (4) show that regardless of the way in which GI is measured, the coefficients of Fiscal are significantly positive, meaning that the increase in per capita fiscal expenditures on science, technology, and education contributes to urban GI improvement. Additionally, in columns (2) to (4), the estimated coefficients of PilotTime are smaller than the corresponding basic regression coefficients, suggesting that government support plays a partially mediating role in how the NEEC promotes GI level. This conclusion is consistent with Sun, Zhang and Zhu [44].

4.2.2. Human Capital Agglomeration

During the NEEC implementation, the policy dividend will help attract talent and promote human capital agglomeration, thereby promoting the improvement of GI. To verify this channel, we use Hc as a proxy variable to conduct a mediating effects test. Table 3 presents the estimation results. Column (1) reports that the coefficient of PilotTime is 0.064 and significant at the 10% level, indicating that the NEEC promotes human capital agglomeration. Columns (2) to (4) show that Hc has a positive contribution to urban GI. Additionally, the estimated coefficients of PilotTime are all smaller than the corresponding basic regression coefficients, indicating that human capital plays a partial intermediary role in how the NEEC promotes GI level. This conclusion is consistent with Yang et al. [45]. This may be due to the fact that the areas with human capital agglomeration have a stronger knowledge and technical foundation of GI, thus promoting its development.

4.2.3. Efficiency Driving

The NEEC will reduce traditional fossil energy consumption and improve energy utilization efficiency, thereby enhancing urban GI levels. We use Efficiency as the proxy variable for energy utilization efficiency [46] to test its mediating effect. In Table 4, column (1) indicates that the NEEC significantly reduces electricity consumption per unit GDP and improves energy utilization efficiency. Columns (2) to (4) show that the reduction of electricity consumption per unit GDP significantly improves urban GI. Moreover, the coefficients of PilotTime in columns (2) to (4) are smaller than the corresponding basic regression coefficients, indicating that the NEEC can improve urban GI levels by facilitating energy utilization efficiency, and thus efficiency driving is a mechanism by which the NEEC promotes urban GI. This conclusion is consistent with Chen et al. [47].

4.3. Moderating Mechanisms Test

We further examine the moderating mechanisms by which the NEEC promotes urban GI. The moderating effect model is:
Y i t = β 0 + β 1 P i l o t i T i m e t + β 2 A i t + β 3 A i t × P i l o t i T i m e t + β 4 X i t + μ i + δ t + ε i t
where A is the moderating variable. We explore the moderating effects from the perspective of ER and intellectual property protection according to Hypothesis 3.

4.3.1. The Moderating Role of ER

ER (ER) is expressed as the frequency of environmental protection terms in each city’s government work reports, including 15 words such as “haze”, “energy consumption”, and “emission reduction”. Table 5 reports the moderating effect model results. As we can see, the estimated coefficients of PilotTime × ER in columns (1)–(3) are all significantly positive, suggesting that urban ER intensity is a positive moderator in the NEEC’s promotion of urban GI. This indicates that ER can compel companies to engage in more innovative activities and enhance their productivity, thereby offsetting environmental management costs, consistent with the conclusion of Yang, Liu and Wang [48].

4.3.2. The Moderating Role of Intellectual Property Protection

Intellectual property protection (IPP) is expressed as intellectual property trial numbers for each city. The data were collected from the database of judicial cases at Peking University. Table 6 reports the moderating effect model results. As we can see, the estimated coefficients of PilotTime × IPP in columns (1)–(3) are all significantly positive at the 1% level, indicating that urban intellectual property protection intensity is a positive moderator in the promotion of urban GI by the NEEC. This result is consistent with Feng and Nie’s description of the role of intellectual property protection in urban GI on Broadband Infrastructure Construction [49].

4.4. Heterogeneity Analysis

4.4.1. Geographical Location Heterogeneity

We divide the sample into two sub-samples according to the city’s geographical location [50]. Table 7 shows that the coefficients of PilotTime in columns (1)–(6) are all significantly positive. Comparing the coefficients of different models, we observe that regardless of how GI is measured, the coefficients of PilotTime are higher in the eastern region than in the central and western regions. In other words, the GI effect of the NEEC policy is greater in the eastern region. This conclusion is consistent with Wang and Yi [51]. The potential reason may be that the eastern region has more sufficient financial support and talent supply, which can better leverage the policy dividends of the NEEC.

4.4.2. Resource Endowment Heterogeneity

Based on the National Sustainable Development Plan for Resource based Cities released by the State Council, we divide 281 cities into two types: non-resource-based cities and resource-based cities. Table 8 shows that the coefficients of PilotTime in columns (1), (3), and (5) are significantly positive, while they are not significant in columns (2), (4), and (6). This result indicates that the NEEC policy can only promote GI in non-resource-based cities and has no significant impact on GI in resource-based cities. This conclusion is consistent with Lin and Xu [52]. The possible reason is that the economic development of resource-based cities is heavily reliant on resource paths, leading to a relatively narrow industrial structure. Consequently, the development of replacement industries lags behind, resulting in a lack of sustainable urban development momentum, a relative shortage of high-tech talents, and insufficient support for GI activities.

4.5. Robustness Tests

4.5.1. Parallel Trend Test

Before using the DID model, we should meet the parallel trend supposition, which reflects the change of samples in the experimental and control cities and should be consistent before policy implementation [53]. For the purposes of this study, the consistent GI trend of the NEEC and non-NEEC is what we need to understand before policy implementation. Otherwise, we cannot confirm that the improvement in GI level is caused by the NEEC policy implementation. Therefore, we use an event-study strategy to test the parallel trend:
Y i t = β 0 + t = 5 + 2 β t × b e f o r e i t + t = 0 5 + β t × a f t e r i t + φ X i t + μ i + δ t + ε i t
where the policy dummy variables from the NEEC implementation year are represented by the core independent variables beforeit and afterit. If the experimental cities are established as NEEC in the t year before (after), the value of beforeit (afterit) takes 1, otherwise it takes 0. We use 1 year before policy implementation as the benchmark group to estimate Equation (6).
Figure 3 illustrates the beforeit and afterit regression coefficients within the 90% confidence intervals. We can see that the coefficients of beforeit are not significant, which indicates that there is no systemic difference in the change in GI level between the NEEC and non-NEEC cities before 2014, thus satisfying the parallel trend hypothesis.

4.5.2. Propensity Score Matching (PSM)-DID Test

The PSM method is used to select individuals from the control group who have the same or similar propensity scores as a certain individual in the experimental group for matching. DID is responsible for identifying the impact of policy shocks. In reality, policies are essentially a form of quasi-natural experiment, so the DID method used in policy effect evaluation inevitably suffers from self-selection bias. However, using the PSM method, we can match each experimental group sample to a specific control group sample, making the quasi-natural experiment approximate randomization. To overcome the selection bias problem, we employ the PSM-DID method to estimate the effect of the NEEC policy on GI [49]. Specifically, the dependent variable is used as the result variable, the six control variables are used as the matching variables, and the nearest neighbor matching method is used to fit the control and experimental city samples. The results show that all matching variables in the control and experimental groups are not exceeding 10%, and the mean difference of all fitting variables is not significant, indicating that the matching effect is good. On this basis, we employ the DID model to estimate the results. As is presented in Table 9, the coefficients of PilotTime in columns (1)–(3) are still significantly positive, which supports the basic regression result.

4.5.3. Entropy Balancing Method

To further overcome the problem of selective bias without causing sample size loss, we refer to Feng et al. [53] and use the entropy balancing method for estimation. Specifically, we use the six control variables in the benchmark model as feature variables and then find a set of weights that make the mean, variance, and skewness of the main feature variables of the experimental group and the control group basically equal. On this basis, we employ this weight to perform weighted least squares estimation. As is reported in Table 10, the coefficients of PilotTime in columns (1)–(3) are still significantly positive, which is consistent with our core finding.

4.5.4. Placebo Test

Drawing on Lee and Nie [54], we conducted a placebo test to ensure the robustness of our study. Specifically, we randomly select 68 cities from 281 sample cities as the false experimental group cities and estimate them based on the DID framework. We repeat this process 1000 times to obtain 1000 false regression coefficients and plot them into a kernel density curve as shown in Figure 4. It can be seen that no matter how GI is measured, the kernel density curve is close to a normal distribution, which further proves the reliability of the conclusions of this study.

4.5.5. Control Other Policies

Within the sample interval of this study, China has also implemented a range of other policies that influence urban GI levels and conflict with our estimated results. Thus, we further control for these policies. Specifically, we control for four representative policies: (1) The innovative city construction policy, which has a strong driving effect on the urban GI level because it can enhance and aggregate innovative elements [55]. (2) The low-carbon city construction policy, which can force firms to innovate technology and improve GI levels [22]. (3) The carbon emission trading pilot project, which is an important policy tool for controlling carbon emissions and can induce GI activity development while achieving carbon reduction [56]. (4) The new environmental protection law implementation, which have shown to have an important driving effect on firm GI levels [57]. As is reported in Table 11, the estimated coefficients of PilotTime are still positive and significant at the 1% level, indicating that the benchmark regression results are robust.

4.5.6. Other Robustness Tests

On the basis of the above series of robustness tests, we also conduct the following five aspects of testing:
(1) Alternate dependent variables. We use the number of per capita green patents obtained as the explained variable and re-estimate. As shown in Panel A of Table 12, the coefficients of PilotTime are still positive and significant at the 1% level, which proves the benchmark regression results are robust.
(2) Exclude municipalities sample. Considering that there are differences in administrative levels between municipalities and other prefecture-level cities, we exclude Beijing, Shanghai, Tianjin, and Chongqing, and then re-estimate. As shown in Panel B of Table 12, the coefficients of PilotTime are still positive and significant at the 1% level, which supports the benchmark regression finding.
(3) Control province-year joint fixed effects. To eliminate the effect of unobservable provincial changes over time, we further control province-year joint fixed effects [53]. As shown in Panel C of Table 12, the coefficients of PilotTime are still positive and significant at the 1% level, which indicates our finding is reliable.
(4) Consider the impact of COVID-19. Since it was the COVID-19 outbreak at the beginning of 2020, we removed the data for 2020 and 2021 and re-estimated them. As shown in Panel D of Table 12, the coefficients of PilotTime are still positive and significant at the 1% level, which indicates our finding is reliable.
(5) Consider the impact of finance. Many studies have shown that finance is also a very important factor affecting green innovation [58], so we consider the impact of finance again. As shown in Panel E of Table 12, the coefficients of PilotTime are still positive and significant at the 1% level, which indicates our finding is reliable.

5. Discussion

5.1. Research Findings

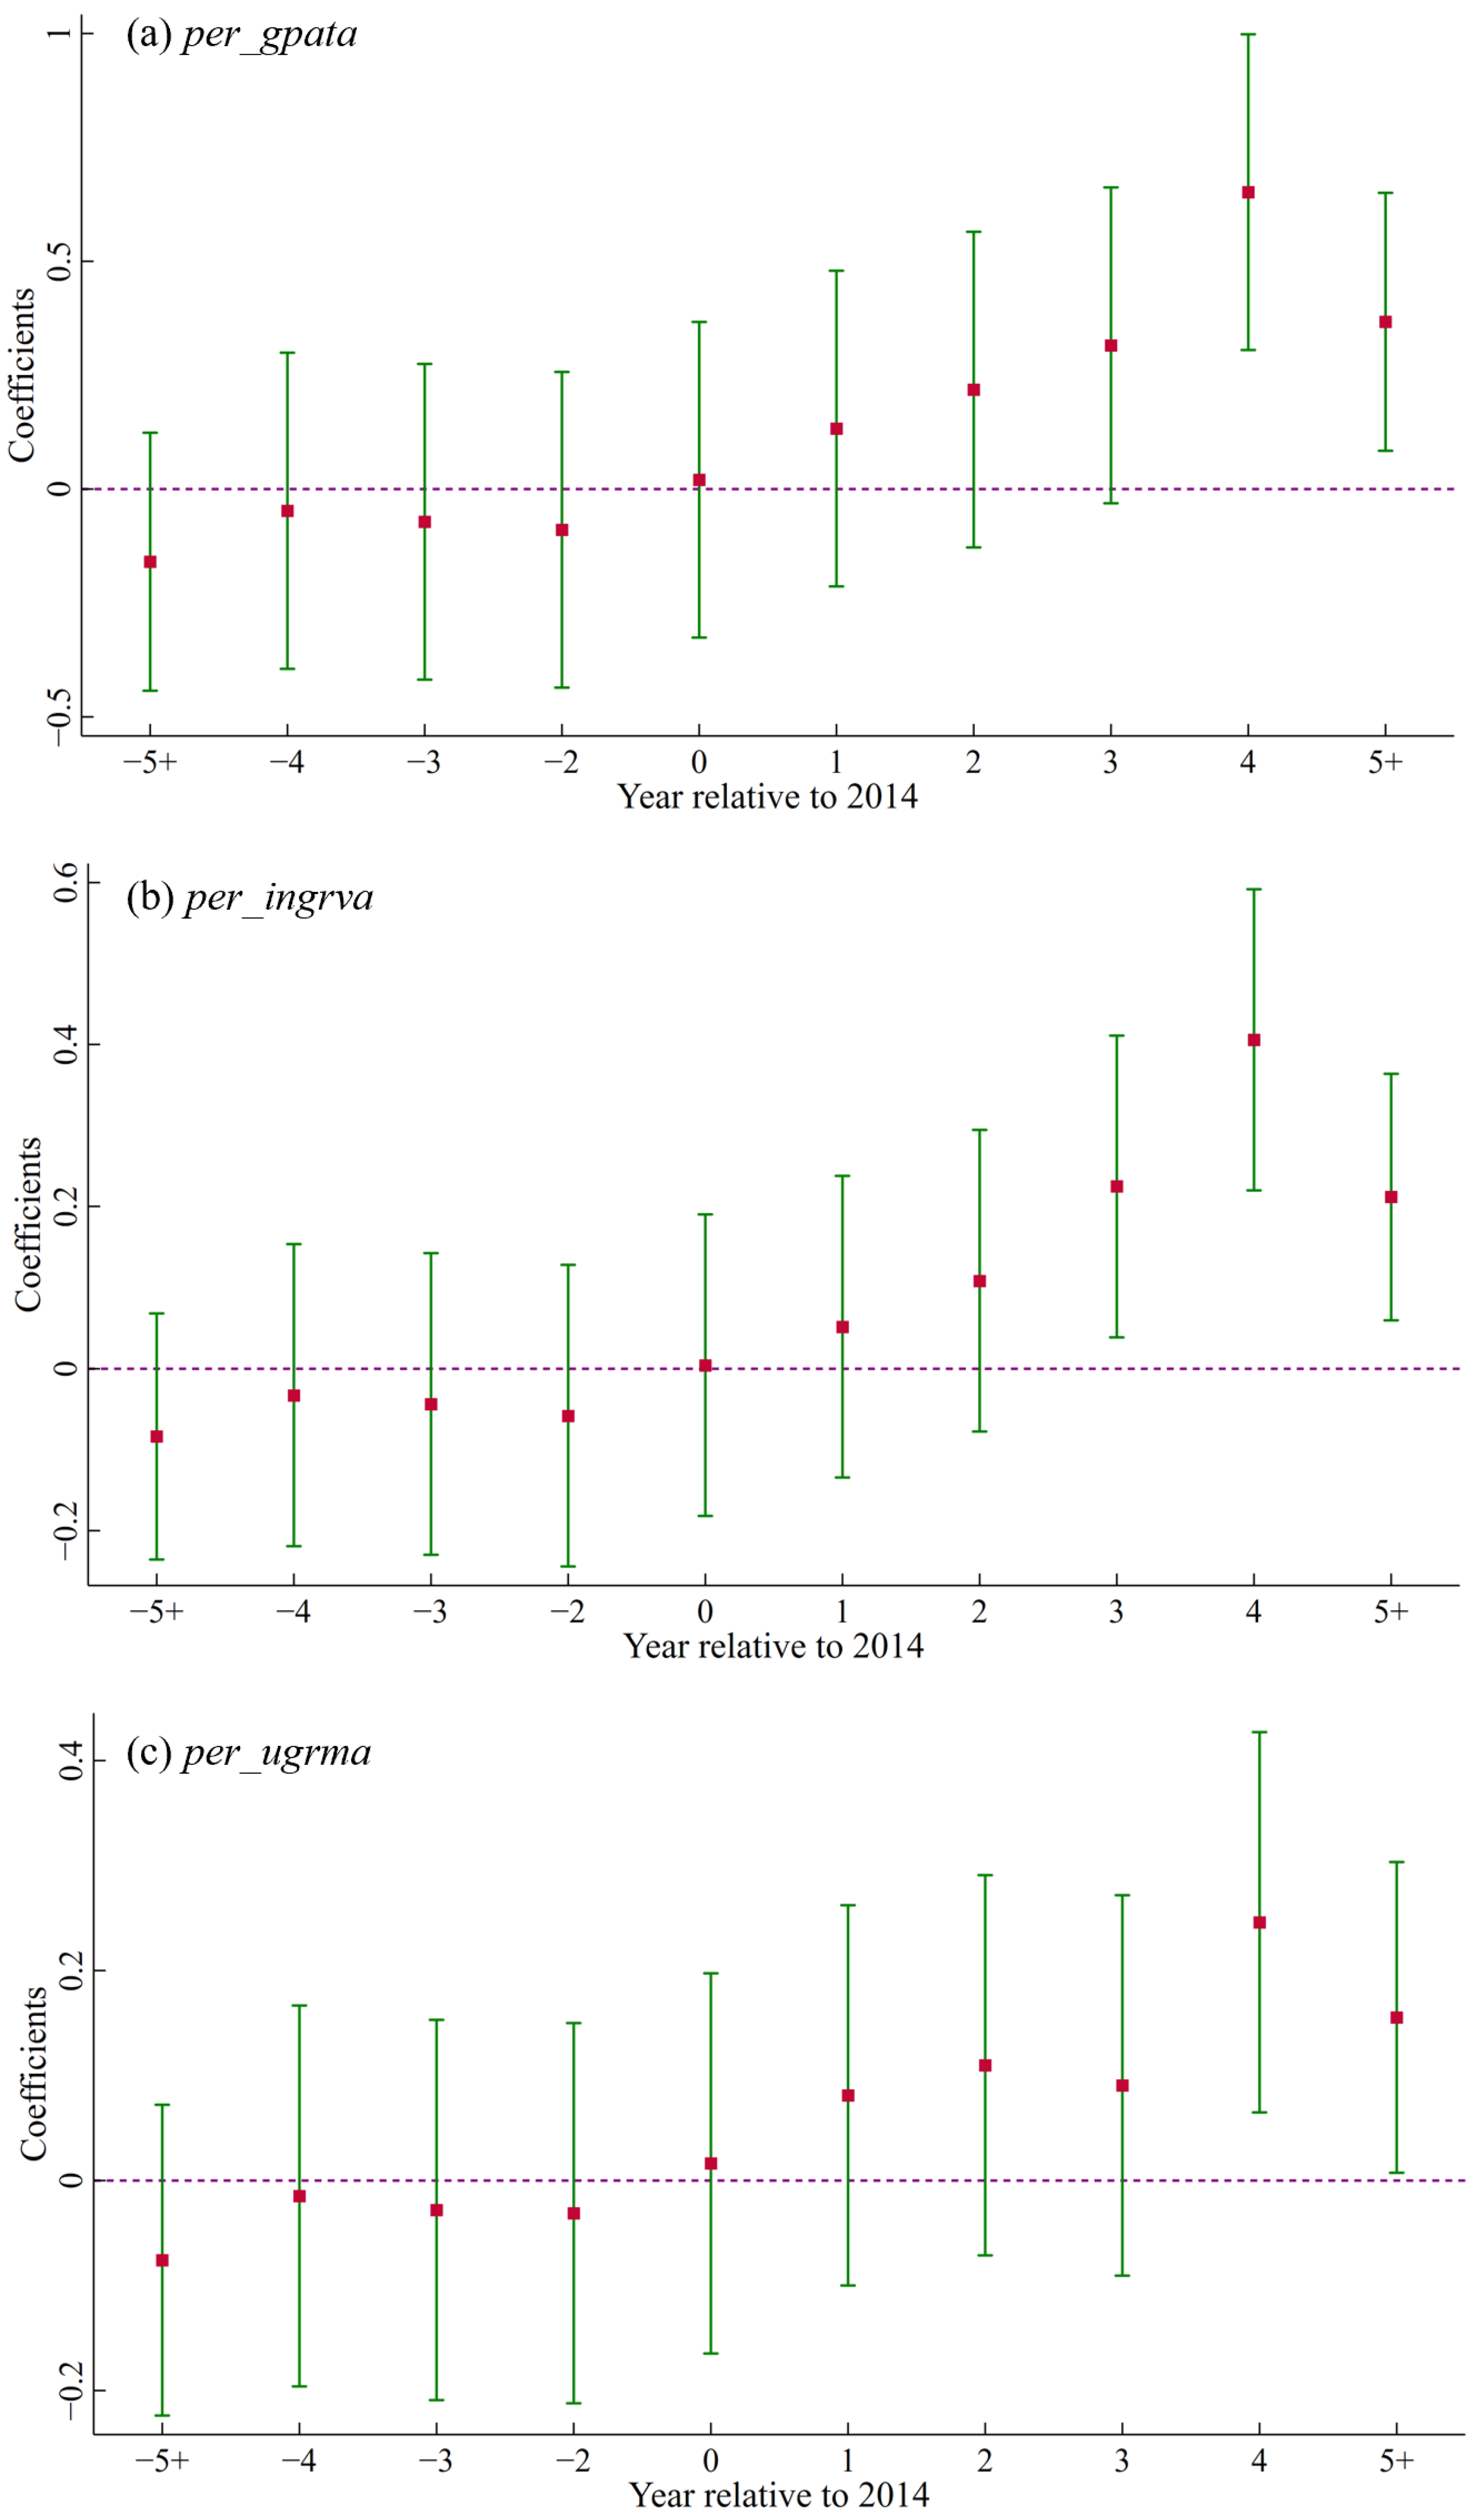
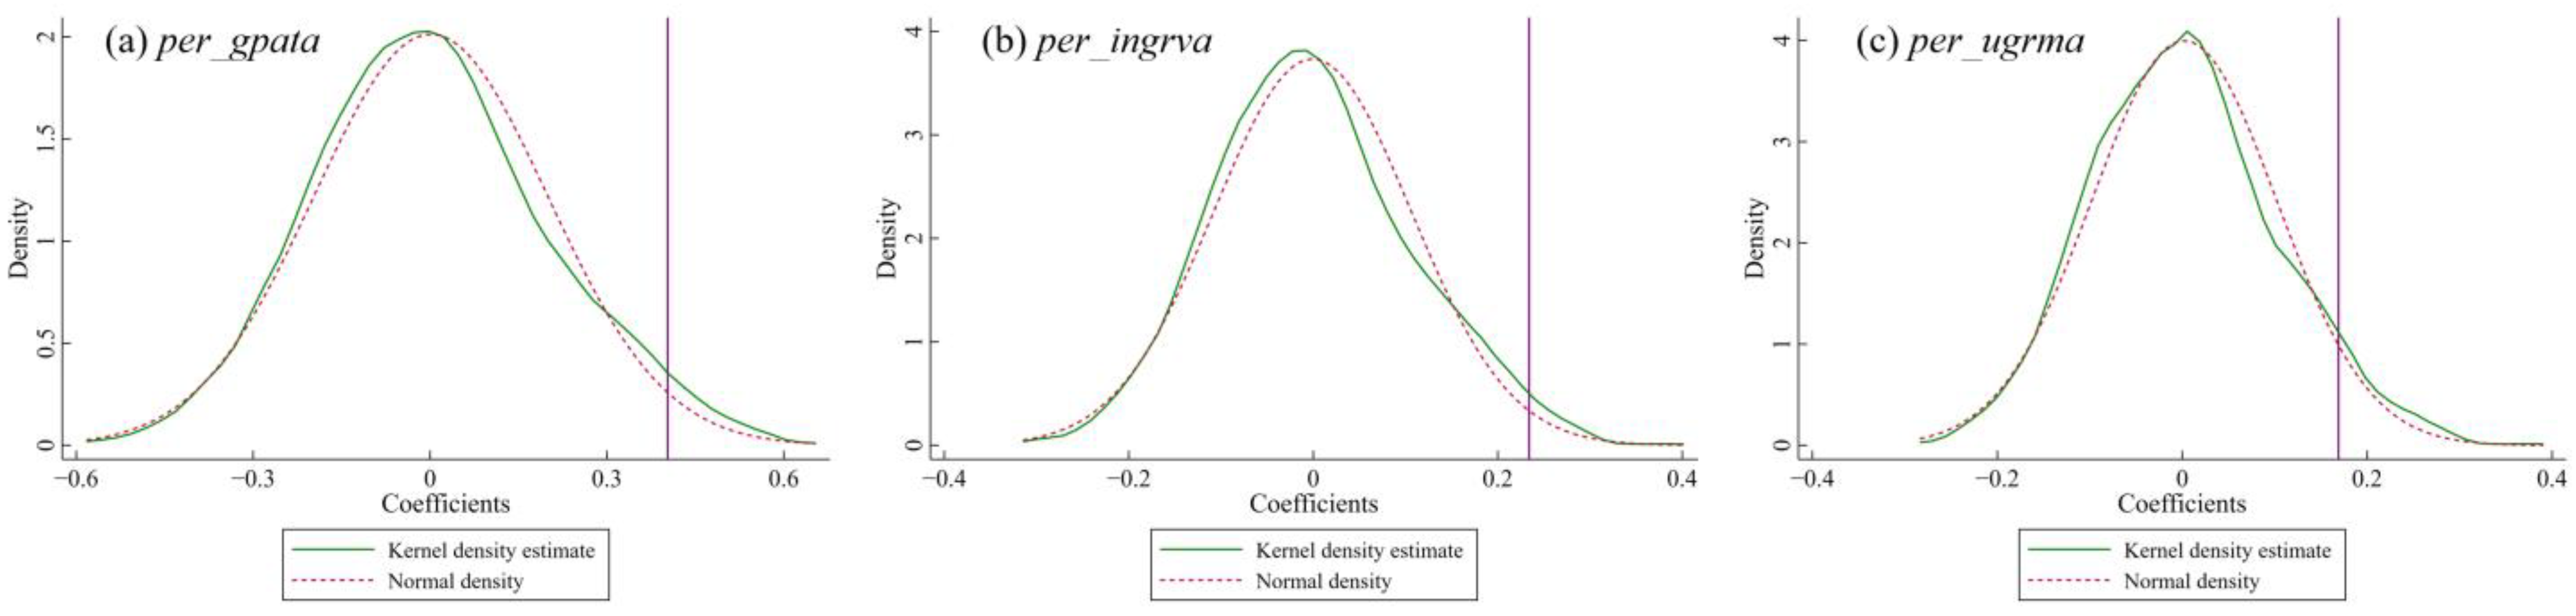
To accelerate the energy revolution, the NEA implemented the NEEC policy to enhance the transition of energy production and consumption structures and promote new energy as an integral part of economic and social development. In this study, we explore whether the implementation of an energy transition strategy induces urban GI. Using panel data from 281 cities in China during 2007–2021, we investigate the impact of the NEEC on urban GI with the DID model and draw the following main conclusions: first, the NEEC induces GI, which verified the effectiveness of the policy. After conducting a parallel trend test, PSM-DID model estimation, entropy balancing method estimation, conducting a placebo teat, controlling other policy interference, and several other robustness tests, the core research conclusions are still valid. Second, the NEEC mainly improves urban GI levels through three channels: government support, human capital agglomeration, and efficiency driving. Third, the degrees of urban ER and intellectual property protection have a significant positive moderating effect on the effect of the NEEC on urban GI. Fourth, the effect of the NEEC on urban GI levels is heterogeneous and more significant in eastern regions and non-resource-based cities.

5.2. Theoretical Contributions

From a global perspective, the significance of an energy transition plan has become evident on a worldwide scale. In order to encourage the energy revolution, several nations have created laws and policies. Examples of these include energy efficiency standards, carbon emission trading programs, and subsidies for renewable energy sources. From the existing literature, this study enriches the NEEC evaluation literature and expands the related research on GI. Although the NEEC has been implemented for many years, the existing literature fails to give a clear answer to whether the policy can effectively induce GI. Combined with the existing literature and the NEEC practice, this study not only theoretically analyzes how the NEEC affects GI but also scientifically verifies this effect by using the econometric analysis model. The conclusions serve as a useful reference for further NEEC implementation, accelerating the energy transition, and promoting GI.

5.3. Practical Implications

The conclusions have several policy implications. First, we show that the NEEC has positive effects on urban GI. Therefore, the relevant departments should summarize the typical cases and successful experiences in the course of policy implementation. They should gradually expand the NEEC’s exemplary scope and further promote the NEEC to provide effective impetus and boost GI development on a national scale. Encourage the development of new energy sources and the modernization of associated industries’ technology. Give it full credit for its ability to reduce pollution and carbon emissions at the same time in order to further advance superior economic development.
Second, the mediating mechanisms of the NEEC on GI are that the policy can increase government financial support, accelerate human capital agglomeration, and enhance energy efficiency. Therefore, in the implementation process of the NEEC, the GI effect can be promoted in multiple dimensions by adjusting the evaluation and assessment indicators. Strengthening the guiding role of the government, ensuring the priority development of the new energy industry through legislative and financial means, and establishing a sound market mechanism to attract private investment in new energy projects. Promoting the optimization and upgrading of industrial structures, supporting the development and application of new energy technologies, encouraging traditional industries to achieve green transformation through technological upgrades, nurturing emerging industries, and establishing new economic growth opportunities. Enhance energy efficiency and promote energy-saving technologies and management measures. Implement energy efficiency standards and labeling systems. Encourage businesses and residents to adopt energy-efficient equipment to reduce energy consumption and carbon emissions.
Third, we find that urban ER and intellectual property protection are key factors that significantly affect GI. Therefore, during the NEEC implementation, the local governments should focus on the construction of and strengthen the city’s own institutional supply capacity and establish a good institutional environment for GI. Further, the local governments could strengthen environmental protection, formulate strict environmental standards and regulatory mechanisms to ensure the sustainability of new energy projects while protecting the ecological environment and improving the quality of urban life. At the same time, strengthening the protection of intellectual property rights, providing legal protection for green innovation, encouraging enterprises and individuals to devote themselves to the R & D and innovation activities of new energy technologies, promoting technological progress, and industrial upgrading are necessary.
Finally, taking account of the heterogeneity of the NEEC effect on GI, we should fully consider local conditions and use the “one place, one policy” strategy. For those cities that fail to put the policy into effect, corresponding support policies should be adopted to ensure that the policy can be implemented to its greatest potential. The NEEC encourages technological innovation, which can provide technical support and experience sharing for other regions and cities, promoting the research and application of new energy technologies. By sharing knowledge and strategies for industrial growth with other cities and regions, the NEEC fosters the growth of new energy industries and aids in the establishment and advancement of the new energy industry chain.

5.4. Limitations and Future Directions

This paper also has some limitations. First, the NEEC as a local policy; the effectiveness of the energy transition strategy in stimulating green innovation remains to be further examined in other countries. Second, because of the challenges in gathering data and the scarcity of research resources, we have limited our attention to three primary mechanisms in this study. In addition to the topic of study, there are numerous other potential affecting elements and mechanisms. It is a future research direction. Nonetheless, the issue addressed in this study is global in nature and calls for international attention. Moreover, the research methodology can be extended to assess the impact of other place-based policies.

Author Contributions

Conceptualization, Y.F., Y.L. and C.N.; methodology, Y.L.; software, C.N.; validation, Y.F.; formal analysis, Z.C.; investigation, Y.F. and Y.L.; resources, Y.F.; data curation, C.N.; writing—original draft preparation, Y.F.; writing—review and editing, Y.F., Y.L., C.N. and Z.C.; visualization, C.N.; supervision, Z.C.; project administration, Z.C.; funding acquisition, C.N. All authors have read and agreed to the published version of the manuscript.

Funding

This research is funded by 2023 Postgraduate Innovation Fund Project “Analysis of Mechanisms and Paths for Driving the Land Green Use Efficiency through the Digital Economy” (YJS2023007).

Data Availability Statement

No new data were created or analyzed in this study. Data sharing is not applicable to this article.

Conflicts of Interest

The authors declare no conflicts of interest.

Abbreviations

NEECNew energy exemplary city
DIDDifference-in-differences
GIGreen innovation
PSMPropensity score matching
EREnvironmental regulation
NEANational Energy Administration

Appendix A

Table A1. Descriptive statistics.
VariablesUnitObsMeanStd.Dev.MinimumMaximum
per_gpatapieces42150.9262.1550.00235.407
per_ingrvapieces42150.4101.0910.00018.708
per_ugrmapieces42150.5161.1230.00016.699
PilotTime42150.1290.3350.0001.000
growth%42159.6204.570−20.63032.900
indus%421546.66111.20310.68090.970
gov42150.1870.0980.0431.485
infram242154.8545.9260.18173.042
popdenPeople/square kilometer4215−3.4690.924−7.637−0.125
open42150.1910.3320.0006.021

References

  1. Shan, S.; Genç, S.Y.; Kamran, H.W.; Dinca, G. Role of green technology innovation and renewable energy in carbon neutrality: A sustainable investigation from Turkey. J. Environ. Manag. 2021, 294, 113004. [Google Scholar] [CrossRef] [PubMed]
  2. Porter, M.E.; Linde, C.V.D. Toward a new conception of the environment-competitiveness relationship. J. Econ. Perspect. 1995, 9, 97–118. [Google Scholar] [CrossRef]
  3. Ren, G.; Chen, Y. Is the impact of environmental regulation on enterprise green technology innovation incentives or inhibitions? A re-examination based on the China meta-analysis. Front. Environ. Sci. 2023, 10, 1038607. [Google Scholar] [CrossRef]
  4. Liu, M.; Li, Y. Environmental regulation and green innovation: Evidence from China’s carbon emissions trading policy. Finance Res. Lett. 2022, 48, 103051. [Google Scholar] [CrossRef]
  5. Khurshid, A.; Huang, Y.; Cifuentes-Faura, J.; Khan, K. Beyond borders: Assessing the transboundary effects of environmental regulation on technological development in Europe. Technol. Forecast. Soc. Change 2024, 200, 123212. [Google Scholar] [CrossRef]
  6. Farooq, U.; Wen, J.; Tabash, M.I.; Fadoul, M. Environmental regulations and capital investment: Does green innovation allow to grow? Int. Rev. Econ. Finance 2024, 89, 878–893. [Google Scholar] [CrossRef]
  7. Gugler, K.; Szücs, F.; Wiedenhofer, T. Environmental Policies and directed technological change. J. Environ. Econ. Manag. 2024, 124, 102916. [Google Scholar] [CrossRef]
  8. Hasan, M.M.; Du, F. Nexus between green financial development, green technological innovation and environmental regulation in China. Renew. Energy 2023, 204, 218–228. [Google Scholar] [CrossRef]
  9. Rehman, S.; Manickavasagam, J.; Sharma, S. Does Institutionalism Coupled with Venture Capital Drive Green Innovation? J. East-West Bus. 2023, 29, 323–344. [Google Scholar] [CrossRef]
  10. Tariq, A.; Hassan, A. Role of green finance, environmental regulations, and economic development in the transition towards a sustainable environment. J. Clean. Prod. 2023, 413, 137425. [Google Scholar] [CrossRef]
  11. Wu, B.; Fang, H.; Jacoby, G.; Li, G.; Wu, Z. Environmental regulations and innovation for sustainability? Moderating effect of political connections. Emerg. Mark. Rev. 2021, 50, 100835. [Google Scholar] [CrossRef]
  12. Lah, L.M.; Kotnik, Z. A Literature Review of the Factors Affecting the Compliance Costs of Environmental Regulation and Companies’ Productivity. Cent. Eur. Public Adm. Rev. 2022, 20, 57–80. [Google Scholar] [CrossRef]
  13. Liang, P.; Xie, S.; Qi, F.; Huang, Y.; Wu, X. Environmental Regulation and Green Technology Innovation under the Carbon Neutrality Goal: Dual Regulation of Human Capital and Industrial Structure. Sustainability 2023, 15, 2001. [Google Scholar] [CrossRef]
  14. Xu, X.; Hou, P.; Liu, Y. The impact of heterogeneous environmental regulations on the technology innovation of urban green energy: A study based on the panel threshold model. Green Financ. 2022, 4, 115–136. [Google Scholar] [CrossRef]
  15. Song, M.; Wang, S.; Zhang, H. Could environmental regulation and R&D tax incentives affect green product innovation? J. Clean. Prod. 2020, 258, 120849. [Google Scholar] [CrossRef]
  16. Yang, B.; Zhao, Q. The effects of environmental regulation and environmental protection investment on green technology innovation of enterprises in heavily polluting industries—Based on threshold and mediation effect models. Front. Environ. Sci. 2023, 11, 1167581. [Google Scholar] [CrossRef]
  17. Khattak, S.I.; Khan, A.M.; Khan, M.K.; Li, C.; Liu, J.; Pi, Z. Do regional government green innovation preferences promote industrial structure upgradation in China? Econometric assessment based on the environmental regulation threshold effect model. Front. Environ. Sci. 2022, 10, 995990. [Google Scholar] [CrossRef]
  18. Iqbal, W.; Tang, Y.M.; Lijun, M.; Chau, K.Y.; Xuan, W.; Fatima, A. Energy policy paradox on environmental performance: The moderating role of renewable energy patents. J. Environ. Manag. 2021, 297, 113230. [Google Scholar] [CrossRef] [PubMed]
  19. Ghazouani, A.; Ben Jebli, M.; Shahzad, U. Impacts of environmental taxes and technologies on greenhouse gas emissions: Contextual evidence from leading emitter European countries. Environ. Sci. Pollut. Res. 2021, 28, 22758–22767. [Google Scholar] [CrossRef]
  20. Kiss, T.; Popovics, S. Evaluation on the effectiveness of energy policies—Evidence from the carbon reductions in 25 countries. Renew. Sustain. Energy Rev. 2021, 149, 111348. [Google Scholar] [CrossRef]
  21. Yang, X.; Wei, M.; Li, Y.; Jiang, Y. Research on the policy effect and mechanism of green finance to reduce environmental pollution: Micro evidence from 285 cities in China. Environ. Sci. Pollut. Res. 2023, 30, 70854–70870. [Google Scholar] [CrossRef]
  22. Khan, Z.; Ali, S.; Umar, M.; Kirikkaleli, D.; Jiao, Z. Consumption-based carbon emissions and International trade in G7 countries: The role of Environmental innovation and Renewable energy. Sci. Total. Environ. 2020, 730, 138945. [Google Scholar] [CrossRef] [PubMed]
  23. Wang, S.; Ma, L. Does new energy demonstration city policy curb air pollution? Evidence from Chinese cities. Sci. Total. Environ. 2024, 918, 170595. [Google Scholar] [CrossRef] [PubMed]
  24. Zhou, A.; Wang, S.; Chen, B. Impact of new energy demonstration city policy on energy efficiency: Evidence from China. J. Clean. Prod. 2023, 422, 138560. [Google Scholar] [CrossRef]
  25. Feng, Y.; Nie, C. Re-examining the effect of China’s new-energy demonstration cities construction policy on environmental pollution: A perspective of pollutant emission intensity control. J. Environ. Plan. Manag. 2022, 65, 2333–2361. [Google Scholar] [CrossRef]
  26. Zhang, Q.; Huang, X.; Xu, Y.; Bhuiyan, M.A.; Liu, P. New energy demonstration city pilot and green energy consumption: Evidences from China. Energy Rep. 2022, 8, 7735–7750. [Google Scholar] [CrossRef]
  27. Ma, W.; Wang, M. Discussion on the Relationship between Environmental Regulation and Green Technology Innovation from the Perspective of Innovation External Cooperation: Evidence from Chinese Private Enterprises. Sustainability 2023, 15, 16333. [Google Scholar] [CrossRef]
  28. Li, L.; Wang, Y.; Tan, M.; Sun, H.; Zhu, B. Effect of Environmental Regulation on Energy-Intensive Enterprises’ Green Innovation Performance. Sustainability 2023, 15, 10108. [Google Scholar] [CrossRef]
  29. Liao, H.; Chen, Y.; Tan, R.; Chen, Y.; Wei, X.; Yang, H. Can natural resource rent, technological innovation, renewable energy, and financial development ease China’s environmental pollution burden? New evidence from the nonlinear-autoregressive distributive lag model. Resour. Policy 2023, 84, 103760. [Google Scholar] [CrossRef]
  30. Liu, X.; Yang, D.; Arentze, T.; Wielders, T. The willingness of social housing tenants to participate in natural gas-free heating systems project: Insights from a stated choice experiment in the Netherlands. Appl. Energy 2023, 350, 121706. [Google Scholar] [CrossRef]
  31. Hu, Y.-J.; Zhang, R.; Wang, H.; Li, C.; Tang, B.-J. Synergizing policies for carbon reduction, energy transition and pollution control: Evidence from Chinese power generation industry. J. Clean. Prod. 2024, 436, 140460. [Google Scholar] [CrossRef]
  32. Chen, B.; Jin, F.; Li, G.; Zhao, Y. Can the New Energy Demonstration City Policy Promote Green and Low-Carbon Development? Evidence from China. Sustainability 2023, 15, 8727. [Google Scholar] [CrossRef]
  33. Wu, G.; Xu, Q.; Niu, X.; Tao, L. How Does Government Policy Improve Green Technology Innovation: An Empirical Study in China. Front. Environ. Sci. 2022, 9, 799794. [Google Scholar] [CrossRef]
  34. Ma, J.; Hu, Q.; Shen, W.; Wei, X. Does the Low-Carbon City Pilot Policy Promote Green Technology Innovation? Based on Green Patent Data of Chinese A-Share Listed Companies. Int. J. Environ. Res. Public Health 2021, 18, 3695. [Google Scholar] [CrossRef]
  35. Hong, M.; Li, Z.; Drakeford, B. Do the Green Credit Guidelines Affect Corporate Green Technology Innovation? Empirical Research from China. Int. J. Environ. Res. Public Health 2021, 18, 1682. [Google Scholar] [CrossRef] [PubMed]
  36. Su, X.; Liu, G.; Xu, Y.; Ge, W.; Shen, B.; Ran, Q.; Zhou, H. How Multi-Dimensional Local Government Competition Impacts Green Economic Growth? A Case Study of 272 Chinese Cities. Front. Environ. Sci. 2022, 10, 911004. [Google Scholar] [CrossRef]
  37. Wang, Q.; Li, S.; Pisarenko, Z. Heterogeneous effects of energy efficiency, oil price, environmental pressure, R&D investment, and policy on renewable energy -- evidence from the G20 countries. Energy 2020, 209, 118322. [Google Scholar] [CrossRef]
  38. Pan, Z.; Liu, L.; Bai, S.; Ma, Q. Can the social trust promote corporate green innovation? Evidence from China. Environ. Sci. Pollut. Res. 2021, 28, 52157–52173. [Google Scholar] [CrossRef]
  39. Jiang, Z.; Lyu, P.; Ye, L.; Zhou, Y.W. Green innovation transformation, economic sustainability and energy consumption during China’s new normal stage. J. Clean. Prod. 2020, 273, 123044. [Google Scholar] [CrossRef]
  40. Wu, J.; Zuidema, C.; Gugerell, K. Experimenting with decentralized energy governance in China: The case of New Energy Demonstration City program. J. Clean. Prod. 2018, 189, 830–838. [Google Scholar] [CrossRef]
  41. Yang, X.; Zhang, J.; Ren, S.; Ran, Q. Can the new energy demonstration city policy reduce environmental pollution? Evidence from a quasi-natural experiment in China. J. Clean. Prod. 2021, 287, 125015. [Google Scholar] [CrossRef]
  42. Du, K.; Li, P.; Yan, Z. Do green technology innovations contribute to carbon dioxide emission reduction? Empirical evidence from patent data. Technol. Forecast. Soc. Change 2019, 146, 297–303. [Google Scholar] [CrossRef]
  43. Luo, Y.; Salman, M.; Lu, Z. Heterogeneous impacts of environmental regulations and foreign direct investment on green innovation across different regions in China. Sci. Total. Environ. 2021, 759, 143744. [Google Scholar] [CrossRef] [PubMed]
  44. Sun, X.; Zhang, A.; Zhu, M. Impact of Pilot Zones for Green Finance Reform and Innovations on green technology innovations: Evidence from Chinese manufacturing corporates. Environ. Sci. Pollut. Res. 2023, 30, 43901–43913. [Google Scholar] [CrossRef] [PubMed]
  45. Yang, J.; Wang, S.; Sun, S.; Zhu, J. Influence Mechanism of High-Tech Industrial Agglomeration on Green Innovation Performance: Evidence from China. Sustainability 2022, 14, 3187. [Google Scholar] [CrossRef]
  46. Yuan, H.; Feng, Y.; Lee, C.-C.; Cen, Y. How does manufacturing agglomeration affect green economic efficiency? Energy Econ. 2020, 92, 104944. [Google Scholar] [CrossRef]
  47. Chen, M.; Su, Y.; Piao, Z.; Zhu, J.; Yue, X. The green innovation effect of urban energy saving construction: A quasi-natural experiment from new energy demonstration city policy. J. Clean. Prod. 2023, 428, 139392. [Google Scholar] [CrossRef]
  48. Yang, N.; Liu, Q.; Wang, X. How does industrial coagglomeration affect regional green innovation? Evidence from Chinese cities. Technol. Anal. Strat. Manag. 2024, 36, 152–165. [Google Scholar] [CrossRef]
  49. Feng, Y.; Nie, C. The effect of government informatization construction on corporate digital technology innovation: New evidence from China. Bus. Ethic Environ. Responsib. 2023, 33, 1–20. [Google Scholar] [CrossRef]
  50. Huang, H.; Mbanyele, W.; Fan, S.; Zhao, X. Digital financial inclusion and energy-environment performance: What can learn from China. Struct. Change Econ. Dyn. 2022, 63, 342–366. [Google Scholar] [CrossRef]
  51. Wang, Q.; Yi, H. New energy demonstration program and China’s urban green economic growth: Do regional characteristics make a difference? Energy Policy 2021, 151, 112161. [Google Scholar] [CrossRef]
  52. Lin, B.; Xu, C. Reaping green dividend: The effect of China’s urban new energy transition strategy on green economic performance. Energy 2024, 286, 129589. [Google Scholar] [CrossRef]
  53. Nie, C.; Ye, S.; Feng, Y. Place-based policy and urban green technology innovation: Evidence from the revitalization of old revolutionary base areas in China. Econ. Anal. Policy 2024, 81, 1257–1272. [Google Scholar] [CrossRef]
  54. Lee, C.-C.; Nie, C. Place-based policy and green innovation: Evidence from the national pilot zone for ecological conservation in China. Sustain. Cities Soc. 2023, 97, 104730. [Google Scholar] [CrossRef]
  55. Zhang, M.; Hong, Y.; Zhu, B. Does national innovative city pilot policy promote green technology progress? Evidence from China. J. Clean. Prod. 2022, 363, 132461. [Google Scholar] [CrossRef]
  56. Du, G.; Yu, M.; Sun, C.; Han, Z. Green innovation effect of emission trading policy on pilot areas and neighboring areas: An analysis based on the spatial econometric model. Energy Policy 2021, 156, 112431. [Google Scholar] [CrossRef]
  57. Liu, B.; Wang, J.; Li, R.Y.M.; Peng, L.; Mi, L. Achieving Carbon Neutrality—The Role of Heterogeneous Environmental Regulations on Urban Green Innovation. Front. Ecol. Evol. 2022, 10, 923354. [Google Scholar] [CrossRef]
  58. Jia, J.; He, X.; Zhu, T.; Zhang, E. Does green finance reform promote corporate green innovation? Evidence from China. Pac. Basin Financ. J. 2023, 82, 102165. [Google Scholar] [CrossRef]
Figure 1. Theoretical framework of the NEEC policy on urban GI.
Sustainability 16 03263 g001
Figure 2. Distribution of NEEC. Source: Visualization of NEEC by ArcGIS 10.7.
Sustainability 16 03263 g002
Figure 3. Parallel trend test. The benchmark group is based on the year before the implementation of the policy.
Sustainability 16 03263 g003
Figure 4. Placebo test of the NEEC promoting GI.
Sustainability 16 03263 g004
Table 1. Basic regression.
Variablesper_gpataper_ingrvaper_ugrma
(1)(2)(3)(4)(5)(6)
PilotTime0.532 ***0.403 ***0.298 ***0.234 ***0.235 ***0.169 ***
(0.087)(0.077)(0.045)(0.042)(0.046)(0.040)
growth 0.025 *** 0.013 *** 0.012 ***
(0.007) (0.003) (0.003)
indus −0.006 −0.004 * −0.002
(0.004) (0.002) (0.002)
gov −1.832 *** −1.011 *** −0.821 ***
(0.428) (0.230) (0.223)
infra 0.111 *** 0.041 *** 0.070 ***
(0.008) (0.005) (0.004)
popden 3.059 *** 1.211 *** 1.848 ***
(0.216) (0.116) (0.113)
open −2.919 *** −1.426 *** −1.493 ***
(0.125) (0.067) (0.065)
Constant0.122 *11.350 ***0.0564.654 ***0.067 *6.696 ***
(0.072)(0.788)(0.038)(0.424)(0.038)(0.412)
City FE
Year FE
N421542154215421542154215
R20.2460.4090.1850.3210.2790.446
Note: Standard errors are in parentheses; *** p < 0.01, * p < 0.1.
Table 2. Government support mechanisms.
VariablesFiscalper_gpataper_ingrvaper_ugrma
(1)(2)(3)(4)
PilotTime1.325 ***0.199 ***0.128 ***0.070 **
(0.390)(0.049)(0.028)(0.028)
Fiscal 0.154 ***0.079 ***0.074 ***
(0.002)(0.001)(0.001)
City FE
Year FE
N4215421542154215
R20.6270.7640.6980.732
Note: Control variables are covered in all models. Standard errors are in parentheses; *** p < 0.01, ** p < 0.05.
Table 3. Human capital agglomeration mechanism.
VariablesHcper_gpataper_ingrvaper_ugrma
(1)(2)(3)(4)
PilotTime0.064 *0.395 ***0.232 ***0.163 ***
(0.035)(0.077)(0.042)(0.040)
Hc 0.118 ***0.0190.098 ***
(0.035)(0.019)(0.018)
City FE
Year FE
N4215421542154215
R20.2820.4110.3210.450
Note: Control variables are covered in all models. Standard errors are in parentheses; *** p < 0.01, * p < 0.1.
Table 4. Efficiency driving mechanism.
VariablesEfficiencyper_gpataper_ingrvaper_ugrma
(1)(2)(3)(4)
PilotTime−0.009 **0.383 ***0.223 ***0.160 ***
(0.003)(0.077)(0.041)(0.040)
Efficiency −2.214 ***−1.214 ***−1.000 ***
(0.356)(0.191)(0.186)
City FE
Year FE
N4215421542154215
R20.2070.4150.3280.450
Note: Control variables are covered in all models. Standard errors are in parentheses; *** p < 0.01, ** p < 0.05.
Table 5. The moderating role of ER.
Variablesper_gpataper_ingrvaper_ugrma
(1)(2)(3)
PilotTime0.1390.1130.026
(0.149)(0.080)(0.078)
ER−0.010 ***−0.005 ***−0.005 ***
(0.002)(0.001)(0.001)
PilotTime×ER0.012 **0.006 *0.007 **
(0.006)(0.003)(0.003)
City FE
Year FE
N421542154215
R20.4120.3230.448
Note: Control variables are covered in all models. Standard errors are in parentheses; *** p < 0.01, ** p < 0.05, * p < 0.1.
Table 6. The moderating role of intellectual property protection.
Variablesper_gpataper_ingrvaper_ugrma
(1)(2)(3)
PilotTime0.1060.0260.080 *
(0.079)(0.042)(0.042)
IPP−0.001−0.001−0.000
(0.006)(0.003)(0.003)
PilotTime × IPP0.129 ***0.090 ***0.038 ***
(0.010)(0.005)(0.005)
City FE
Year FE
N421542154215
R20.4380.3770.455
Note: Control variables are covered in all models. Standard errors are in parentheses; *** p < 0.01, * p < 0.1.
Table 7. Geographical location heterogeneity.
Variablesper_gpataper_ingrvaper_ugrma
EasternCentral and WesternEasternCentral and WesternEasternCentral and Western
(1)(2)(3)(4)(5)(6)
PilotTime0.689 ***0.343 ***0.398 ***0.195 ***0.291 ***0.148 ***
(0.187)(0.043)(0.101)(0.025)(0.098)(0.021)
City FE
Year FE
N148527301485273014852730
R20.5020.4580.4170.2990.5270.552
Note: Control variables are covered in all models. Standard errors are in parentheses; *** p < 0.01.
Table 8. Resource endowment heterogeneity.
Variablesper_gpataper_ingrvaper_ugrma
Non-Resource-BasedResource-BasedNon-Resource-BasedResource-BasedNon-Resource-BasedResource-Based
(1)(2)(3)(4)(5)(6)
PilotTime0.731 ***0.0280.424 ***0.0040.307 ***0.023
(0.121)(0.038)(0.065)(0.019)(0.063)(0.023)
City FE
Year FE
N252016952520169525201695
R20.4610.5170.3820.3170.4840.583
Note: Control variables are covered in all models. Standard errors are in parentheses; *** p < 0.01.
Table 9. PSM-DID test.
Variablesper_gpataper_ingrvaper_ugrma
(1)(2)(3)
PilotTime0.403 ***0.234 ***0.169 ***
(0.078)(0.042)(0.041)
City FE
Year FE
N418241824182
R20.4110.3230.448
Note: Control variables are covered in all models. Standard errors are in parentheses; *** p < 0.01.
Table 10. Entropy balancing method.
Variablesper_gpataper_ingrvaper_ugrma
(1)(2)(3)
PilotTime0.318 ***0.188 ***0.130 ***
(0.074)(0.041)(0.037)
City FE
Year FE
N421542154215
R20.7910.7650.790
Note: Control variables are covered in all models. Standard errors are in parentheses; *** p < 0.01.
Table 11. Control other policies.
Variablesper_gpataper_ingrvaper_ugrma
(1)(2)(3)
PilotTime0.295 ***0.178 ***0.117 ***
(0.076)(0.041)(0.040)
City FE
Year FE
N421542154215
R20.4470.3580.478
Note: Control variables are covered in all models. Standard errors are in parentheses; *** p < 0.01.
Table 12. Other robustness tests.
Variablesper_gpataper_ingrvaper_ugrma
(1)(2)(3)
Panel A: Alternate dependent variables
PilotTime0.220 ***0.064 ***0.156 ***
(0.049)(0.011)(0.041)
N421542154215
R20.4210.2820.430
Panel B: Exclude municipalities sample
PilotTime0.332 ***0.171 ***0.162 ***
(0.075)(0.039)(0.040)
N415541554155
R20.3940.3090.433
Panel C: Control province-year joint fixed effects
PilotTime0.295 ***0.158 ***0.137 ***
(0.071)(0.037)(0.037)
N421542154215
R20.5880.5440.611
Panel D: Consider the impact of COVID-19
PilotTime0.353 ***0.209 ***0.144 ***
(0.075)(0.040)(0.039)
N365336533653
R20.4410.3710.465
Panel E: Consider the impact of finance
PilotTime0.403 ***0.234 ***0.169 ***
(0.077)(0.042)(0.040)
N421542154215
R20.4090.3210.446
City FE
Year FE
Note: Control variables are covered in all models. Standard errors are in parentheses; *** p < 0.01.
Disclaimer/Publisher’s Note: The statements, opinions and data contained in all publications are solely those of the individual author(s) and contributor(s) and not of MDPI and/or the editor(s). MDPI and/or the editor(s) disclaim responsibility for any injury to people or property resulting from any ideas, methods, instructions or products referred to in the content.

