Abstract
The surge in shopping center construction within urban areas, especially without a strategic plan, has been particularly notable in Eastern Balkan cities during the 21st century. This tendency may lead to decreased economic activity and noticeable shifts in social and cultural dynamics. The primary objective of this study is to introduce and apply the Methodology for Determining Architectural Programs (MDAP), a mathematical model designed to optimize the planning process of shopping centers. Focused on spatial disposition and internal program distribution, MDAP extends the foundational Huff model by incorporating relevant economic parameters—consumers’ purchasing power and potential investors’ costs. Examining the city of Novi Sad, Republic of Serbia, the results indicate the consistency of the MDAP’s results compared to the application of the basic Huff model. This approach could contribute to a more balanced economic distribution within cities, promoting social and cultural relations while offering investors a relevant feasibility study and preserving shopping centers’ profitability. This study underscores the significance of considering social sustainability in urban planning, emphasizing how strategic urban retail development can positively impact social dynamics alongside economic viability by maximizing the potential utilization of existing retail spaces. However, potential limitations include unforeseen social, economic, and political factors influencing shopping center location decisions, posing challenges in real-world applications relying on complex social relations.
1. Introduction
In the era of excessive consumerism, retail spaces have become an integral and defining feature of urban landscapes. The surge in consumer culture has led to a proliferation of shopping centers, shaping the very fabric of our cities. However, their strategic placement maintains profound implications for the social and economic sustainability of urban settlements. As urbanization accelerates and consumer demand increases, the importance of deliberately locating shopping centers cannot be overstated. When shopping centers are wrongly positioned, the repercussions extend beyond mere spatial inconvenience. The social fabric of communities may face disruption, as residents contend with altered traffic patterns, increased noise levels, and shifts in community dynamics [1,2]. The economic landscape, too, may experience turbulence, with potential consequences for local businesses and property values [3,4]. This research underscores the need for strategic urban planning to navigate the challenges posed by consumer-driven trends, ensuring that retail spaces contribute positively to the vitality and resilience of our urban environments. Moreover, it advocates for a synergistic approach that aligns investor profits with the broader goals of social and economic sustainability.
This research endeavors to introduce a novel Methodology for Determining Architectural Programs (MDPA), which aims to determine the optimal distribution of programs within a shopping center, coupled with an analysis of its location suitability. Its premise is rooted in the hypothesis that strategically determining the optimal programmatic composition and attractive positioning of a shopping center correlates positively with social sustainability. This correlation, in turn, is viewed as essential for the maintenance and advancement of economic factors within the local environment. Furthermore, the structure of a defined threshold area for the shopping center, rather than constructing excessively large retail space, holds the potential to generate distinctive surplus area. This surplus can be repurposed for non-commercial activities, thereby fostering cultural and social enrichment within the community.
1.1. Context Background
The development of shopping centers in the Western Balkan countries was initiated significantly later than in Western European nations; however, their typological evolution followed models established in more developed economies [5]. Over the course of several decades, advanced European nations have closely examined the issues deriving from extensive retail development. Initially, the primary emphasis revolved around economic components, encompassing the decline of city centers, the creation of new job opportunities, and the reduction in existing trading areas. However, there was a noteworthy shift in focus towards acknowledging environmental and social outcomes [6]. Consequently, Western European developed countries underwent the formulation of retail location policies. Despite a relaxation of these policies in France, Belgium, and Germany during the 1960s, followed by the UK and Mediterranean countries, the 1990s saw the imposition of regulations that limited the extensive and unplanned construction of retail developments [7]. The commercialization in post-socialist countries occurred approximately three decades later than in developed European nations. The delayed emergence of shopping centers in the Western Balkans, compared to the rest of Europe, can be attributed to the complex political situation, which shaped economic conditions, only recognizing the open market as a necessary developmental direction at the beginning of the 21st century. Privatizations in the early 21st century in the Western Balkan countries resulted in the establishment of new types of retail spaces, predominantly traditional shopping centers and hypermarkets [8]. These entities substituted former city department stores and streetfront commerce, a phenomenon not isolated to the Western Balkans but also observed in other less developed European economies, such as Portugal [9,10]. When considering the Western Balkan countries’ and large retail stores’ development, the psychological aspect must be acknowledged. It signifies the populations’ desire to transition from the limited and concentrated supply of goods associated with the previous socialist regime to a variety of choices symbolizing a new society and general progress [11,12]. Encouraged by the populations’ eagerness for economic changes and alterations in the physical environment, newly constructed shopping centers emerged as significant indicators of real societal changes and states’ readiness to develop the economy [13]. Nevertheless, during the 1990s, land use planning in Western Balkan countries, particularly at the local level, was predominantly marked by spontaneous political decisions instead of a long-term strategic vision. This was coupled with inadequate control over development and an approach to urban development that leaned towards self-regulation [14]. Moreover, the development of shopping centers has induced several negative changes, the consequences of which, as well as their causes, may not be immediately apparent.
The construction of shopping centers in the Western Balkan countries was often unplanned, or existing plans were altered to align with the current market needs and short-term goals [11,15,16]. An analysis of adopted regional spatial plans in the Republic of Serbia revealed a lack of guidelines addressing the construction of large retail stores. Regional spatial plans that detail settlement networks at the regional level and spatial plans of local government units focusing on settlements at the local level fail to incorporate the aspects of large-scale retail construction. Additionally, they do not establish a correlation between retail hierarchy and urban networks. Furthermore, when introducing new shopping center developments, there is a lack of assessments regarding the impacts of opening such establishments on existing retail. This deficiency extends to the local level, where spatial plans crafted by units of local self-government also fail to provide guidance for the development of big retail stores. As a result, the determination of locations for shopping centers falls within the domain of urban plans at the local level, incorporating general urban plans and plans of general regulation [17]. These practices resulted in the chaotic development of various types of retail spaces, driven by opportunities for foreign investment and contributing to the increase in job opportunities, a significant factor in national development. However, this growth occurred without a focused analysis of broader impacts. Consequences that must be considered include those affecting small entrepreneurs, who represent a crucial pillar of transitional economies [18]. An often neglected consequence involves changes in the cultural and social life of the environment where shopping centers are established following shifts in economic movements [19,20].
The study of these two interconnected consequences forms the basis for complex interdisciplinary research. One fundamental issue, serving as the foundation for this research, is the negligence of city–place hierarchy due to the unplanned construction of shopping centers in central areas. This primarily entails the relocation of commercial spaces from sites traditionally associated with streetfronts. The cause of this phenomenon is linked to the conveniences offered to entrepreneurs by shopping centers, such as safety, air conditioning, easy accessibility from main roads, and secured parking for visitors [21,22,23]. On the other hand, an essential topic for discussion is the fate of entrepreneurs unable to afford leases within shopping centers. Following the withdrawal of anchor commercial spaces from central city areas and their relocation to shopping centers, smaller stores can only rely on a significantly smaller percentage of customers, primarily driven by hedonic shopping. The majority of potential customers choose to visit shopping centers for utilitarian shopping purposes [24,25]. While this may not appear problematic initially, especially under the conditions of a neoliberal capitalist society, it is crucial to consider that the social and cultural aspects of society are inseparable from the disposition of economic movements, particularly in central city areas. The reduced visits of a population to a central city core, as the focal point of cultural events, result in fewer social interactions and, consequently, the degradation of the observed society’s culture [22,26,27]. It is essential to emphasize that the context in which this subject research was conducted is a city in a country still characterized by a transitional economy. The rapid changes that occurred may have been too fast for society to adapt to just yet. This fact underscores the countries of the Western Balkans as a relevant example for studying the influence of shopping centers, as the culture of the consumer society in this context is still in the process of development. Thus, the central topic of this research focuses on optimizing the disposition of inner city shopping centers and their program distribution by introducing economic parameters, with the aim of preserving activities in the central city core. However, it is unequivocal that shopping centers are typologies that are unavoidable in urban areas, suitable for the needs of a modern consumer society. Consequently, this research does not ignore the need for shopping centers to preserve their lucrative character. Instead, it addresses the delicate balance between maintaining their success and preserving the character of central city areas. To achieve this, we introduce an innovative methodology, the Methodology for Determining Architectural Programs of Shopping Centers (MDAP), which adapts the fundamental Huff model.
1.2. Literature Review
Gravity models, grounded in Newton’s law of universal gravitation, have been widely employed to describe spatial interactions [28,29,30,31,32]. These models are theoretical frameworks applicable to the analysis of all cases involving a spatial dimension. Given that traditional retail involves the exchange of products for money and requires the presence of consumers at a specific location, gravity models predominantly focus on analyzing and clarifying consumer behavior concerning their geographical locations. Notably, Reilly (1931) [33,34] and Converse (1949) [35] applied this model to estimate retail market areas. Huff (1964) [36,37] further advanced their contributions by determining the probability that a consumer at a specified demand point, i, will travel to a facility situated at point j. This probability is determined by the travel time from the demand points to the facilities and the size of these facilities. The fundamental assumption is that the probability of a consumer visiting a particular shopping center reduces with the increasing distance between the facility and the consumer. In 1964, David L. Huff proposed a model for calculating the potential number of consumers gravitating towards a specific retail store:
where is the expected number of consumers at point or area i who are likely to visit shopping center j, represents the probability that a consumer in point or area i will visit shopping center j, and is the number of consumers in point or area i.
Further, Huff proposes a mathematical expression for calculating the probability :
where is the gross leasable area (GLA) of the of the shopping center j, is the travel time from the point where the potential consumer is to shopping center j, and λ is a parameter that reflects the relationship between the travel time and the type of shopping center visit, which is determined empirically.
Since the formulation of the foundational Huff model, numerous studies have explored the relationship between the quality of a retail location and factors including specific demographic data, particularly concerning the distance of potential customers from these sites. The majority of the existing literature includes studies of the diversification of attractiveness attributes. In addition to fundamental attributes, analyses have extended to factors such as the diversity of tenants within a shopping center, retail agglomeration in proximity to a shopping center, distance to metro stations, price levels, and the types of companies in a trade region [38,39,40]. Furthermore, specific studies have focused on the significance of the competitiveness of a shopping center compared to other competitive stores in the commercial area, predicting the market share of a potential establishment at a given location [41,42,43]. Within certain studies, an advanced method of data collection for the analysis of the attractiveness of retail can be observed, incorporating information gathered from mobile devices of the population, as well as from social media [44,45,46]. The results highlight the relevance of such databases, given that the data are collected in real-time and in considerable quantities. This comprehensive study aims to enhance our understanding of the complex dynamics influencing the appeal and success of retail. On the other hand, nearly all of the available literature underscores the fact that models for determining the attractiveness of shopping centers may not provide entirely realistic results, as they depend on non-quantitative factors such as social interactions, accelerated population migrations, and unpredictable fluctuations in economic conditions [47,48].
1.3. Research Objectives
While the presented studies explore a broad spectrum of approaches to researching the potentials of retail, a notably underexplored topic is the introduction of relevant economic parameters as attributes of attractiveness, which represents the central focus of this study. The primary objective of this research is to propose a novel methodological process for optimizing the distribution of programs within shopping centers by introducing economic parameters related to the feasibility of their construction. The Methodology for Determining Architectural Programs (MDAP), derived from this research, represents a modification of the Huff model. This adaptation introduces economic parameters at both ends, including the purchasing power of the population and the cost of constructing and equipping the potential shopping center. The primary hypothesis of this research suggests that the inclusion of the aforementioned economic parameters results in outcomes that correlate with the real conditions in the given context. Through cross-referencing the results representing optimal areas for various product categories at different potential locations, derived from the MDAP, with the basic application of the Huff model obtained through the QGIS Location Analytics tool [49], this research aims to enhance the reliability and applicability of the MDAP in optimizing the disposition of inner city shopping centers and their distribution of programs.
The scientific problem under consideration involves restricting the growth of a shopping center’s surface area, as a fundamental attribute of its attractiveness. As the potential of a shopping center increases with the expansion of its potential area, this area theoretically tends towards infinity. Within the proposed model, this growth is constrained based on cost-effectiveness factors at the selected location and the average purchasing power of the nearby population.
An additional outcome of this research simplifies result acquisition by offering an alternative workspace within the Anaconda platform, thereby optimizing the methodology for obtaining conclusive findings. The assumption is that streamlining the methodological process by eliminating the requirement for visual analysis, such as gravity percentage maps, and by using the commonly employed iterative procedure can result in a faster and more straightforward approach to obtaining results without compromising their accuracy.
2. Materials and Methods
2.1. Study Area
This research is centered around the city of Novi Sad, situated in the Autonomous Province of Vojvodina, which is the second largest city in the Republic of Serbia (see Figure 1), with an area of 129.4 km2 and approximately 409,000 inhabitants [50]. Novi Sad is situated in the northern part of the country, located 95 km away from the capital city of the Republic of Serbia—Belgrade (see Figure 2). In this regard, Novi Sad is favorably positioned within national boundaries, as it is only an hour’s drive from the administrative center of Serbia, reflecting positively on the development of commercial purposes within the city. Being the second largest city in the country, the need for the development of shopping centers was certain. However, unlike the capital, where the population is more than three times larger [51] and includes a significant number of shopping centers [52], the construction of such centers in Novi Sad was delayed by several years. Considering the aforementioned, the selection of Novi Sad as a suitable area for this subject research was based on data related to the number and size of shopping centers. Collecting such data for the city of Belgrade would have been challenging due to the significantly larger population and the likely unavailability of data for all existing large-scale retail facilities. As this research introduces a new methodology where the quantity of shopping centers is not of essential importance, Novi Sad was chosen as the optimal area for research. The chosen area was selected as a test location due to the availability of relevant data; however, the MDPA, as the primary outcome of this research, can be applied to any sub-area with the necessary database accessibility.
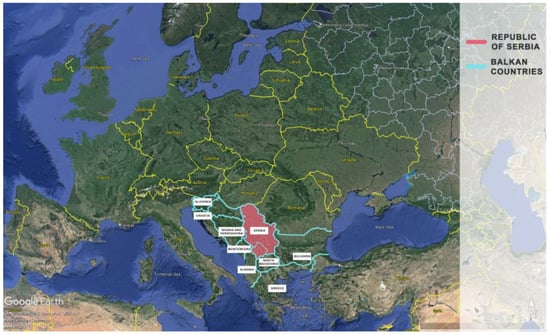
Figure 1.
Continental location of the Republic of Serbia. Google Earth Pro 7.3.6.9796 [8 March 2024]. Eye alt. 2536 mi.
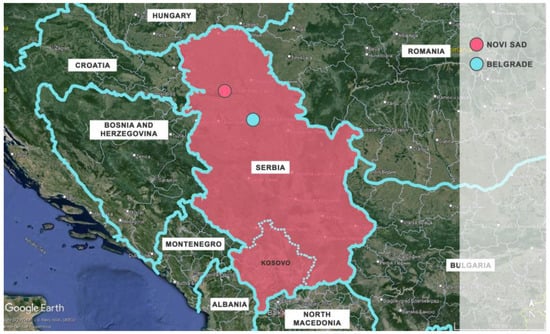
Figure 2.
Geographical locations of Novi Sad and Belgrade within the Republic of Serbia. Google Earth Pro 7.3.6.9796 [8 March 2024]. Eye alt. 488 mi.
The development of shopping centers in their contemporary form occurred in Novi Sad at the outset of the 21st century, stimulated by shifts in economic and political conditions within the Republic of Serbia. Prior to this period, Novi Sad housed commercial buildings characterized by multiple tenants or owners of business premises within the same structure. However, these structures did not qualify as shopping centers due to the absence of central management and the lack of additional features characteristic of modern shopping center typology. Over the initial two decades of the 21st century, three modern shopping centers were built in Novi Sad. For the purpose of the MDAP evaluation, these shopping centers, designated as TC01, TC02, and TC03, were subjected to the testing process (see Figure 3). Within this research, the market area is bound to the territory of the city of Novi Sad, with the statistical units identified as the local communities, totaling 47.
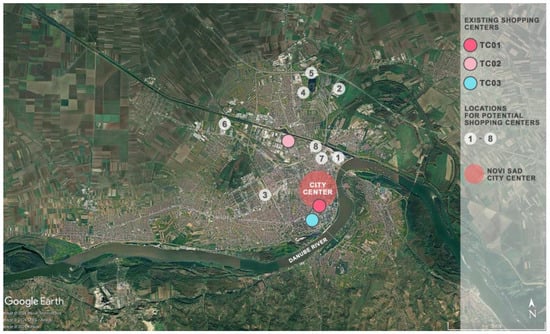
Figure 3.
Positions of existing shopping centers and potential locations for shopping centers within the City of Novi Sad. Google Earth Pro 7.3.6.9796 [8 March 2024]. Eye alt. 15.5 mi.
2.2. Data Sources
For the purposes of this study, it was necessary to gather several initial datasets, including the following:
- coordinates of existing shopping centers;
- gross leasable areas of existing shopping centers, specifying areas for each product group;
- centroids of local communities;
- the number of residents in each local community;
- coordinates of potential shopping centers’ locations.
The coordinates of shopping centers were determined based on maps available within the GeoSrbija platform [53]. In the case of this study, the gross leasable area (GLA) for each individual shopping center was used as an indicator of attractiveness, representing areas designated for specific product classes, depending on the desired type of business model. The gross leasable area of each shopping center was gathered using maps available on the websites of given shopping centers [54,55,56]. After scaling the maps in relation to the sizes of plots obtained from the GeoSrbija platform, floor plans of all levels of the respective buildings were drawn using the AutoCAD 2020 software. Subsequently, the areas of rental spaces were measured for each product category.
Local communities represent formal administrative districts as defined by the City Assembly of Novi Sad [57]. The choice of a local community as a statistical unit was based on the availability of data regarding the population count in the local communities of Novi Sad [50]. This choice is further supported by the determination that the number of local communities was adequate for analyzing the results. Consequently, it can be implied that the statistical units are delineated by the area and the number of inhabitants, signifying the population density. In addition to the locations of existing shopping centers, this research incorporated the locations of potential future shopping centers, sourced from the Detailed Regulation Plans of the city of Novi Sad (see Figure 3) [58].
For the purpose of testing the proposed methodology, it was necessary to prepare data in CSV format. As part of this study, the distances between consumers and existing or potential shopping centers were computed using the road network [59], recognizing that consumer movement was constrained by existing infrastructure (refer to Figure 4). The necessary distance matrices were obtained by running the Distance Matrix script within the QGIS Location Analytics spatial analysis framework [49]. The shapefiles serving as a basis for positioning significant points within the QGIS 3.4.7 software were plotted within the GeoSrbija platform [53] and subsequently downloaded in the .shp format. Shapefiles used for the graphical representation of water surfaces and road networks were obtained from the Geofabrik website [60], representing data generated within the OpenStreetMap internet platform [61].
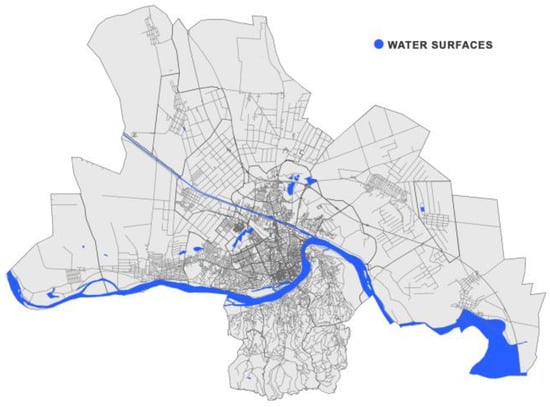
Figure 4.
Road network in Novi Sad.
Within this research, data were collected both through fieldwork and from available databases, necessitating the preparation of the data in the described manner. The data for this subject research were collected during 2019 and 2020. After arranging all datasets properly and obtaining the distance matrices, we were able to export them as CSV files from the GIS software and subsequently load them into the proposed model. This process will be explained in detail within Section 2.4.3. It is essential to emphasize that the use of GIS software becomes redundant in cases where databases are already available in CSV format.
Additionally, as control research was conducted within this study, involving the application of the QGIS Location Analytics package within the QGIS software, the results, depicting maps with gravity degrees of population towards shopping centers, required data preparation following the previously mentioned procedure. The QGIS Location Analytics package represents a script that essentially implements the basic Huff model. Since this is an existing tool used in this case solely for the validation of the proposed model, its application will be briefly described in the following section before presenting the new proposed methodology.
2.3. Verification Research Methodology—Application of the Basic Huff Model
The verification research employed an existing spatial analysis tool named QGIS Location Analytics [49], consisting of two main components: generating distances from shopping centers to consumers and determining the probability values that a specific consumer group would visit a particular facility, i.e., applying the basic Huff model. To create a dataset related to the distances between shopping centers and consumers, it was necessary to establish a layer within the QGIS software containing shapefile data of local communities with coordinates of their centroids (refer to Figure 5a). Additionally, a layer in shapefile format, depicting the road network in the Novi Sad area, was added (Figure 4). With data groups now available for points where potential consumers are located and the road network as a constraining element, it was necessary to further develop a database related to shopping centers.
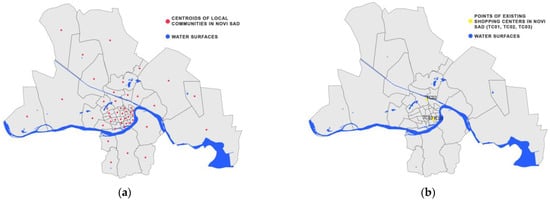
Figure 5.
(a) Local communities in Novi Sad; (b) Positions of existing shopping centers in Novi Sad.
Introducing a shapefile layer and defining precise positions of given points concerning the market area map generated points TC01, TC02, and TC03, representing existing shopping centers for analysis (see Figure 5b). The attributes defining these points include an identification label and coordinates. After the formation of these layers, activating the Distance Matrix script facilitated the generation of a distance matrix between points TC01, TC02, and TC03 and the centroid points of the polygons depicting local communities. Once the distance matrix was formed, it was stored as a separate layer containing not only identification labels for local community polygons but also distance values between the centroids of each local community polygon and each shopping center point.
The process of generating the distance matrix needs to be repeated for each individual case when introducing new points. In this study, the total GLA of each individual shopping center was used as an attractiveness indicator, i.e., the area designated for specific product classes, depending on the desired type of model results. Additionally, a layer containing only polygons of local communities with an identification label attribute needed to be created.
In addition to the aforementioned layers, upon running the script containing the Huff model, previously formed layers were utilized in the following forms: the distance matrix layer and the layer with centroids of local community polygons. After preparing these layers and their attributes, the Huff Model script was activated within the Processing Toolbox segment, selecting the layers and attributes involved in calculating the population gravity degrees from local communities to shopping centers. The model results consisted of attributes generated in the prepared layer of local community polygons, depicting gravity values or the probability of the population from a specific local community visiting a particular shopping center. This procedure was repeated for each case involving changes in the considered layers or alterations in the selected attractiveness-related attributes.
The results of this verification research and the application of the new proposed methodology will be compared in the Section 3. In the following sections, we will formally introduce the Methodology for Determining Architectural Programs of Shopping Centers (MDAP). The methodology will be presented in a formal manner, utilizing precise language and, when appropriate, mathematical formalism. The authors acknowledge that these sections may have a different style compared to the rest of the manuscript. However, this approach aims to ensure that the presented ideas are clear and repeatable, enabling others to easily extend our approach or adapt it for similar applications.
2.4. Methodology for Determining Architectural Programs of Shopping Centers
As previously emphasized in earlier research, the development of shopping centers should be framed within the specific environment in which they are constructed. While the utilized input data within a basic Huff model, or QGIS Location Analytics applied in verification research, are tied to the territory under study, they do not incorporate factors associated with economic conditions, which play a crucial role in investment decision-making. The Methodology for Determining Architectural Programs of Shopping Centers (MDAP), a main result of this subject research, incorporates additional parameters when determining the suitability of their distribution. These introduced parameters are associated with the following economic factors:
- the purchasing power of the population within the considered area i;
- the cost of building and equipping a shopping center at the considered location.
The primary objective of the MDAP is to generate insights into the optimal distribution of programs within a potential shopping center in the considered location, expressed through the areas occupied by the respective programs. The key contribution of the proposed methodology, relative to existing models, lies in its introduction of specific economic factors that influence the final result. The subsequent text will present the formal setting of the problem, along with a description and testing of the proposed methodology.
2.4.1. Input Data
The used input data can be divided into several groups.
Statistical units. Let A be a set of statistical units (in this case, local communities of interest) A. For each area a ∈ A, let w(a) be the relative importance of that area. Relative importance can be defined as the share of the total number of inhabitants populating that area, or it can represent the share of the total purchasing power possessed by the inhabitants of that area. The collection of all considered statistical units constitutes the market area.
Product groups. Consider a set of product groups, denoted as G. The product groups under consideration include groceries; wardrobe and accessories; appliances; home furnishings; and entertainment. For each product group g ∈ G, let γ(g) be the importance of the given group in the future business plan of the potential shopping center. The business plan is determined by the investor and it refers to the definition of the importance of each of the product groups.
Shopping centers. Consider a set of existing shopping centers, denoted as S. For each shopping center s ∈ S, let α(s,g) be the objective attractiveness of the given shopping center for a specific group of products g ∈ G.
Distance matrix. For each of the shopping centers s ∈ S and each of the statistical units a ∈ A, the distance between them d(s,a) is defined.
2.4.2. Formal Setting of the Optimization Problem
The probability that a consumer from area a ∈ A will visit shopping center s ∈ S to buy a product of product group g ∈ G with respect to the setting of the Huff model is
where s is the shopping center s ∈ S; g is a product group g ∈ G; a represents a local community a ∈ A; and α(s,g,a) is the objective attractiveness, which takes into consideration distance d(s,a) between s and a and the inertia factor λ (see Equation (2)).
Further, the overall attractiveness of the shopping center in relation to all product groups from set G can be expressed as
where ω(a) is the relative importance of area a ∈ A and γ(g) stands for the importance of product group g ∈ G in the desired business plan of the shopping center.
Therefore, the final mathematical expression for the overall attractiveness of a shopping center is
where the following size categories are defined by color: black—data collected through field research; red—sizes selected during optimization; green—sizes that define the state of competing objects; and blue—size that determines the desired business plan of a potential shopping center.
Equation (5) can be considered an optimality criterion. However, as it stands, this criterion is insufficient, as it solely strives for the selection of maximally attractive, i.e., maximally large buildings. It neglects the consideration of construction and equipping costs, which escalate with the rise in subjective attractiveness. A more appropriate optimality criterion, factoring in construction costs, can be defined as the following:
where P stands for a positive penalty function whose value increases with the expansion of the shopping center area and C > 0 serves as the scale factor equalizing the dimensions of the two components of the total criterion (J and P).
The initial choice for P is
where μ is an exponential factor determined empirically (the values of 1 or 2 are most often taken).
There is also a natural constraint that the overall attractiveness of a shopping center, in this case, its total area, must not surpass a predetermined threshold value A > 0. Hence,
where A is the limit value of the area, that is, the maximum possible area at a certain location.
To simplify the notation, the variables chosen in the optimization process will be denoted as . If s ∈ S is the new potential location under consideration, then the observed problem comes down to
so, it is
where represent variables that are selected in the optimization process and s ∈ S is the new potential site under consideration.
As both β(g,a) and δ(g,a) can be calculated in advance and do not depend on the sizes we choose, the original criterion J, given by Equation (8), can be expressed as
The solution of the problem comes down to the introduction of the Karush–Kuhn–Tucker (KKT) conditions [62] and introduction of the Lagrangian [63]
The Karush–Kuhn–Tucker conditions assume a particularly simple form when μ = 1, signifying that the construction cost increases linearly with the area. Further, instead of the rigid constraint (11), the maximum total area can be restricted by augmenting the factor C under the Karush–Kuhn–Tucker conditions. Consequently, the constraint equation is omitted from consideration, i.e., the scenario ν = 0 is observed. Therefore, the conditions are reduced to solving the following series of entirely independent equations for a given fixed C > 0:
Once the problem is solved, the total area of the shopping center is calculated using the formula:
If , the solution is accepted. Otherwise, it is necessary to increment the parameter C to derive a new solution. The procedure is repeated until the total area becomes acceptable.
For the purposes of easier future referencing, a special notation is introduced for the left side of the equation:
In practice, the areas designated for a specific group of products are measured in thousands of square meters and surpass the value 1 by several orders of magnitude in the expression. Therefore, with a high level of precision:
From the last equation, it can be seen that decreases with the increase in (given that each individual term in the sum is a decreasing function of the argument).
This expression indicates that when increases indefinitely, tends towards zero. If viewed conversely, without accounting for construction costs, the optimal area of the shopping center in the observed location would be infinite. This is a logical response, considering that location restrictions (maximum permissible area) are not considered. The aforementioned issue is addressed by determining the minimum permissible value of the parameter C. Any higher values of this parameter will result in acceptable optimal areas.
Another intriguing question is the following: How much must C be (indicating the construction and furnishing costs) if the optimal area of the shopping center (intended for a given group of products) is 0? In other words: How high must C be so that it is not worthwhile to build a shopping center (offering a given group of products) at the considered location? This value is obtained from Equation (15), by setting , as the following:
In this case, the approximate formula cannot be applied since the approximation is valid for , while the observed case is .
Ultimately, it is not worthwhile to construct a shopping center at the considered location if C, representing the cost of construction and furnishing, is greater than or equal to
The final mathematical formalism was interpreted into a Python script within the Anaconda platform to provide the user with an interface for loading CSV files, selecting parameters, and visualizing the results. The subsequent section will comprehensively explain the practical application process of the proposed methodology.
2.4.3. Practical Applications of the MDPA
The initial step involves loading data from a previously prepared CSV file. The databases intended for loading are enumerated as the following:
Distance Matrix. This matrix encompasses the distances between the centroids of polygons representing statistical units (i.e., centroids of local communities), denoted as PL01–PL47, and the geographical coordinates of existing shopping centers (TC01–TC03) and potential locations (L1–L8). Post-loading, the complete distance matrix is divided into two matrices: one relating to distances from centroids to existing shopping centers (distances_tc) and the other including distances from centroids to potential locations (distances_loc).
Importance of statistical units. Data are focused on the list of statistical units (i.e., local communities) denoted as PL, emphasizing the column specifying their relative importance (w). The relative importance is determined by the population size of each local community, forming the dataset labeled as area_data.
Attractiveness of existing shopping centers. Information regarding the attractiveness of existing shopping centers relates to the areas allocated for different product categories (G1–G5) within these facilities, cumulatively constituting their total area labeled as TOTAL. This dataset is identified as tc_data.
Upon completion of the loading of the existing databases, it is necessary to define auxiliary constants, namely Na, Ng, and Ntc, which further specify the dimensions of the vector: Na (number of local communities) = 47; Ng (number of product groups) = 5; and Ntc (number of existing shopping centers) = 3.
The next step is the definition of data for user decision-making during the optimization process.
Location under consideration. The user can select a location for which the potential shopping center’s area is to be calculated. Within the scope of this research, eight potential locations (L1–L8) are considered [54].
Value of consumer basket per inhabitant. In this study, the value of the consumer basket (pk) per inhabitant was set at EUR 320. It is noteworthy that this value is subject to adjustments based on the prevailing economic context during the research.
Cost of building and equipping the building per m2. The cost for building and equipping the structure (m2price_base) was established at EUR 1050. It is important to note that this figure is adaptable and can be modified to align with real-world conditions.
Zone coefficient. The zone coefficient (kz) utilized for calculating taxes in the Republic of Serbia was subject to the city zone where the construction site was situated. The corresponding zone coefficients, ranging from 0.007 (eighth zone) to 0.1 (extra zone), were assigned based on the specific location (L1–L8) [64].
Purpose coefficient. The purpose coefficient (kn) remains constant at 1.5, reflecting the categorization of trading facilities under commercial purposes [64].
Relative importance of product groups. Values defining the relative importance of product groups (G1: groceries; G2: wardrobe and accessories; G3: appliances; G4: home furnishings; G5: entertainment) are determined by the investor’s business plan. Collectively, their importance totals 1, and individual values for each product category, denoted as gamma, are inputted during the process.
Total. The gross leasable area serves as a reference point. Notably, this size does not factor into the calculation of areas designated for different product categories (MDAP results apply uniformly across all areas). The total size is introduced for ease of result interpretation, allowing the user to specify the total area for obtaining precise measurements under categories G1–G5. Additionally, it is important to acknowledge that the displayed gross leasable area may marginally deviate due to the discrete system controlling a series of units determining the area.
Upon entering values for m2price_base, kz, and kn, the approximate total construction cost at the designated location is calculated using the formula:
Upon user input, where loc represents the considered location (L1–L8), pk signifies the consumer basket value per inhabitant, m2price_base is the cost of building and equipping the building per m2, kz stands for the zone coefficient, kn is the purpose coefficient, gamma denotes the relative importance of product groups, and total represents the total area for rent, the MDAP results in a conclusive graph. This graphical representation illustrates the areas occupied by all product groups relative to the total GLA of the potential shopping center. This representation considers the loaded databases (distances_tc, distances_loc, area_data, and tc_data) as constants for all tests, providing consistency. It is important to note that the size of user input data may vary.
For the testing phase, conducted within a specific geographical area characterized by uniform economic conditions, the values of pk (the value of the consumer basket per inhabitant) and m2price_base (the cost of building and equipping per m2) remain constant. The consistency extends to the kn coefficient, which is constant as the shopping centers are classified as commercial purposes. The total GLA, for the purpose of comparing results, is also constant for testing the MDAP. Other values are entered depending on the position of the potential location and the desired business plan. It is important to emphasize that all sizes can be variable; however, for the ease of result tracking, some of them are held constant within the tests. Table 1 illustrates the variability in sizes within the tests and Table 2 shows zone coefficient values for tested locations.

Table 1.
Variability in entered values.
Table 2.
Zone coefficient values for tested locations.
Once all the relevant sizes within the MDAP framework have been established, the user’s final task involves inputting data specific to the desired business plan, particularly choosing the importance of different product categories.
3. Results
This section showcases the results derived from the application of the Methodology for Determining Architectural Programs of Shopping Centers (MDPA). The outcomes specifically concern the evaluation of shopping center location suitability, emphasizing optimal areas for diverse product categories. Essentially, the MDPA streamlines the application process of the basic Huff model, circumventing the necessity for an iterative approach while introducing economic indicators as relevant input data. The following text will elaborate the results derived from three distinct business plans, each characterized by varying values of the gamma coefficient which represents the importance of each product category. Test 2 focuses on the traditional type of shopping center, which is the most common within urban areas. The outcomes derived from the application of the basic Huff model, or the QGIS Location Analytics tool, serving as a control study to validate the results of the proposed model, will be juxtaposed within Test 2. The selected total area for a potential shopping center, chosen to ensure a clear comparison of results, will remain constant at 41,000 m2. That area was chosen as a threshold because, even though it is around 7000 m2 smaller than the largest shopping center in Novi Sad, within the iterative process presented in Section 3.2.1, it consistently exhibited the highest levels of gravity for the majority of the considered product categories in a potential shopping center. However, it is important to note that the total area is a variable within the model and can be adjusted based on the specific context or legislative constraints.
3.1. Test 1: Equal Importance of Product Categories
In the initial test, the business plan under analysis postulates that all product categories (G1: groceries; G2: wardrobe and accessories; G3: appliances; G4: home furnishings; and G5: entertainment) hold equal importance (Table 3). By analyzing this scenario, valuable insights can be obtained into the market dynamics and the potential predominant activities within the shopping center.
Table 3.
Test 1: Importance of product categories.
Upon analyzing the graphs shown in Figure 6, two primary patterns emerged consistently across all examined locations. The initial observation was that the area designated for G2 (wardrobe and accessories) consistently remained at zero. This outcome was grounded in the presence of substantial areas within existing competitive facilities (TC01, TC02, and TC03) mostly allocated for wardrobe and accessories. Consequently, constructing a facility solely focused on this product category, comprising only 20% of the total area, proves economically unviable. In essence, given the specified conditions where all product categories hold equal importance within a facility of 41,000 m2, it is more profitable to allocate the available space to categories unrelated to wardrobe. Expanding the boundaries in Figure 7 revealed that category G2, under the given conditions (as exemplified by location L3), only occurred at a total GLA value of 150,000 m2. This value, considering real-world factors such as the population density, purchasing power, and spatial extent of competing facilities, is considered highly unprofitable.
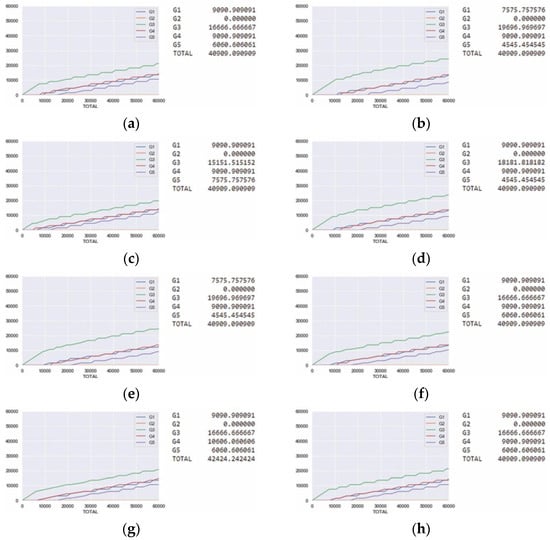
Figure 6.
Results of Test 1—Equal importance of product categories: (a) L1; (b) L2; (c) L3; (d) L4; (e) L5; (f) L6; (g) L7; (h) L8.
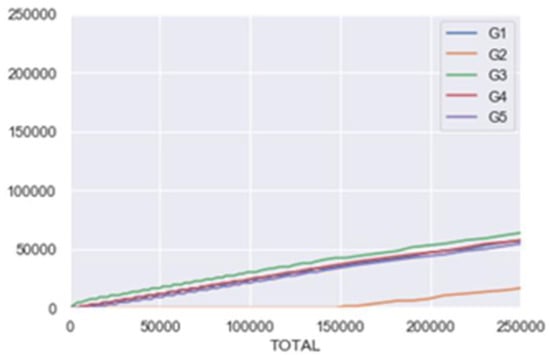
Figure 7.
Expanded graph for the location L3.
Another detected pattern was the consistently significant area allocated to category G3 (appliance) across all tested locations. This outcome is a direct consequence of the competitive facilities, which lack substantial areas specifically designated for appliances. Once more, in the context of the actual market conditions and the demand for appliances, it becomes imperative to reassess the basis for assigning a substantial area to these products. The findings from Test 1 merely highlight the potential within the analyzed market area and can act as a guiding reference for shaping a future business plan. It underscores the importance of considering market dynamics, competition, and consumer demand when determining the optimal allocation of space for different product categories within a shopping center.
3.2. Test 2: Traditional Type of Shopping Center
In Test 2, the parameters directing the significance of product categories within the business plan are altered to configure the potential shopping center as a traditional type. In this context, a traditional shopping center prioritizes products from the sphere of wardrobe and accessories as the most crucial, with the remaining GLA distributed among other categories. This adjustment aims to simulate and assess the viability of a traditional shopping center, where the emphasis is placed on meeting the demand for wardrobe and accessories (Table 4).
Table 4.
Test 2: Importance of product categories.
The analysis of Test 2 showed that the results for all examined locations were identical, with variations noted only in the total area available for rent. This implies that, under the specified business plan for a traditional shopping center, each analyzed location is theoretically equally profitable. While the results showcase the distribution of areas across different product categories, they also underscore a limitation of the MDAP, specifically in addressing the attractiveness of locations and potential shopping centers. In the proposed methodology, the attractiveness of shopping centers is expressed through their square footage, overlooking the nuanced aspect of location attractiveness—defined as the gravitational pull of a population. Introducing additional economic parameters linked to the average consumer basket per statistical unit could enhance the determination of location attractiveness. Essentially, areas with a population exhibiting higher average incomes would be regarded more attractive, while those in regions with lower average incomes would be less attractive. This improvement would offer a more comprehensive evaluation of location desirability and contribute to a more nuanced understanding of the potential success of shopping centers in diverse areas.
Upon analyzing the graphs in Figure 8, a noteworthy observation is that the optimal area for category G4 (home furnishings) was consistently zero across all tested locations. This outcome is a direct consequence of the presence of a competitive shopping center (TC02) that already incorporated a significant area dedicated to this specific product category. Consequently, for category G4 to have a non-zero optimal area, it should be assigned greater importance within an overall business plan.
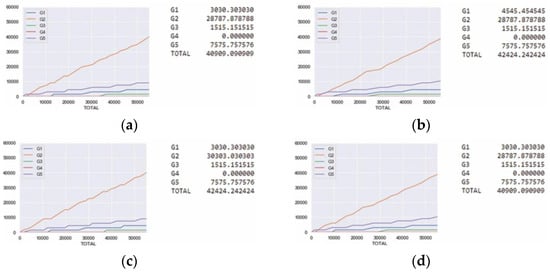
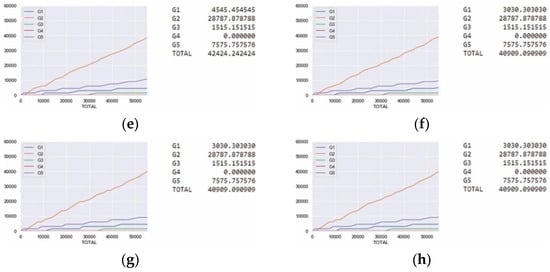
Figure 8.
Results of Test 2—Traditional type of shopping center: (a) L1; (b) L2; (c) L3; (d) L4; (e) L5; (f) L6; (g) L7; (h) L8.
3.2.1. Application of the Basic Huff Model Results
The selected location for the application of the basic Huff model and comparison of the results with the MDPA outcomes is potential location 3 (L3), as it exhibited the highest degree of population gravity within the application of the QGIS Location Analytics script [49] (see Figure 9).
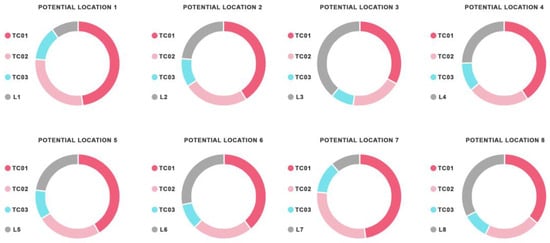
Figure 9.
Retail gravitation for the test locations using the basic Huff model.
Further, the determination of the most favorable distribution of programs within a potential shopping center at a test location 3, when employing the QGIS Location Analytics package, involved an iterative process. This process implied adjusting the parameters of attractiveness attributes and analyzing the results across six cases. The initial parameters related to attractiveness by product classes were established based on the existing shopping center with the highest gravity, where the highest values were scaled down to account for the threshold area. The altered parameters primarily focused on the areas designated for different product classes, with the objective of achieving the highest population gravity values for the test location. To support a concise overview of the results, the final parameters are outlined in Table 5, and the corresponding outcomes are presented in Figure 10.
Table 5.
Final set of attractiveness parameters for the test location.
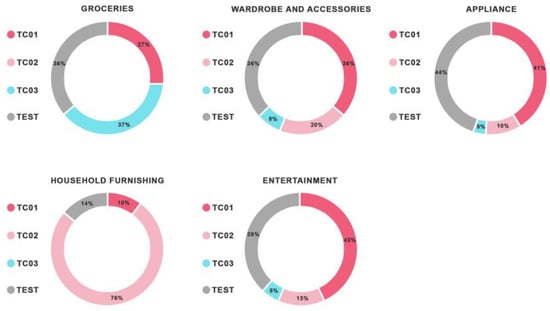
Figure 10.
Retail gravitation for the test location in accordance with the final set of parameters using the basic Huff model.
Upon analyzing the results, it is evident that the potential shopping center at the test location exhibited the highest or nearly the highest gravity values in all considered areas, except for the household furnishing class of products. These results are regarded as acceptable in comparison to the analysis of competing facilities. Considering the test location’s position in the city, particularly its proximity to densely populated areas, it can be assumed that the appropriate predominant activity of the shopping center should revolve around the daily needs of potential consumers. Moreover, the spatial proximity of the shopping center specializing in home furnishings (TC02) justifies the reduction in the area allocated for this content. The potential shopping center, although still competitive in terms of home furnishing products, does not predominantly focus on this category.
3.2.2. Comparative Analysis of Results: Basic Huff Model and MDPA
In Table 6, the optimal areas per product category resulting from the application of the Huff model, i.e., the QGIS Location Analytics script, and the optimal areas achieved through the MDPA for a potential location 3 can be observed. A high consistency of results was evident through the comparison. The primary distinction was related to the home furnishings product category, which was reduced to zero within the MDPA. In other words, the methodology assumes that introducing this product category does not impact the overall profitability of the shopping center due to the proximity of other centers already containing significant areas under that category. For the same reason, within the iterative process, this category is minimized. This indicates that the model recognizes real market parameters relative to the data on the competitive facilities used.
Table 6.
Comparison of results: Huff Model and MDPA.
Additionally, within the MDPA results, the product category under groceries was slightly smaller compared to the application of the basic Huff model. The assumption is that such a result was also influenced by the spatial proximity of facilities that were partially specialized for that purpose. The remaining results demonstrate a significant level of consistency, as the iterative process utilizing the QGIS Location Analytics package involved empirical reasoning throughout the testing of optimal product areas. The small differences between the results may indicate a confirmation of the validity of the proposed methodology.
3.3. Test 3: Specialized Type of Shopping Center
In the context of the third test, the analysis focuses on a business plan encompassing a specialized type of shopping center. The total importance assigned to product categories is distributed among G1 (groceries), G3 (appliances), G4 (home furnishings), and G5 (entertainment), while the significance of category G2 (wardrobe and accessories) is set to zero (see Table 7). This business plan envisions a shopping center primarily dedicated to marketing products in the appliance and home furnishing spheres, featuring a designated area for grocery products, akin to a hypermarket. Notably, in this scenario, entertainment serves as a category contributing to the overall attractiveness of the specialized shopping center. The results of this analysis are depicted in Figure 11.
Table 7.
Test 3: Importance of product categories.
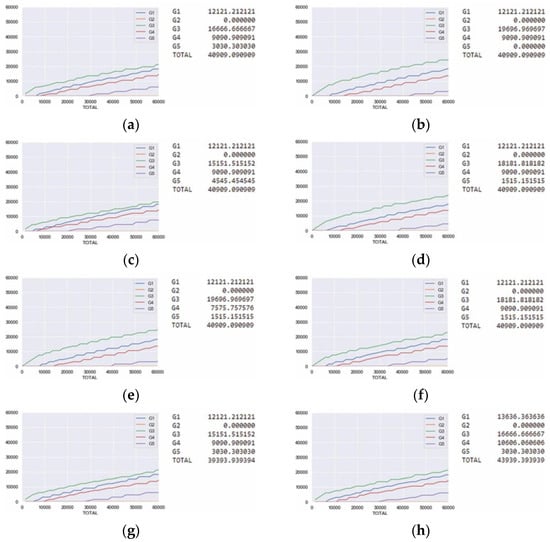
Figure 11.
Results of Test 3—Specialized type of shopping center: (a) L1; (b) L2; (c) L3; (d) L4; (e) L5; (f) L6; (g) L7; (h) L8.
In the case of this business plan, where category G2 was assigned zero importance, the optimal area for this category was consistently zero across all locations. However, differences in optimal areas were evident for the remaining product categories, except for category G1, where the optimal area remained constant. These results were influenced by the competitive landscape, their respective distances from the analyzed locations, and the centroids of the statistical units. The presented graphs (Figure 11) can serve as valuable guidelines for establishing the content distribution within a planned facility. They provide insights into the potential of each category, helping in the strategic determination of optimal areas to maximize the effectiveness and appeal of a specialized shopping center.
4. Discussion
The principal contribution of the proposed methodology is based on the simplification of the process for determining the distribution of programs by formalizing and systematizing the overall process. Additionally, this methodology introduced input parameters associated with the economic aspects of the context in which the research was conducted. Economic parameters represent variables that directly hinge on the area where the shopping center is planned, and in realistic circumstances, can significantly impact its function and capabilities. The MDAP provides insights into results in diverse situations as determined by the user. Since the parameters affecting the results can vary, it can be inferred that the MDAP can be applied in various geographical settings, as long as the gathered data are relevant to competing facilities and a group of potential consumers within the target market area.
The innovation of the proposed methodology, alongside the incorporation of economic parameters, is in providing an alternative approach to interpreting results regarding the program distribution within shopping centers, with an emphasis on numerical results. The primary theoretical significance of this research addresses the issue of constraining the growth of a potential shopping center’s area, a fundamental attribute of attractiveness, achieved through the introduction of a penalty function within the mathematical framework of the methodology.
4.1. Comparative Review of Existing Studies
The evaluation of the proposed methodology involved a comparison with both a foundational Huff model and adapted versions found in the relevant literature. However, comparisons with other models proved challenging due to the widespread use of diverse input data in many studies—data that are often inaccessible or not applicable beyond the specific conditions of their test environments.
Most models addressing the determination of the attractiveness of existing retail sites or the assessment of their potential locations focus on economic factors related solely to the purchasing power of the population. A recent study, employing particle swarm optimization to calibrate T-Huff model parameters, emphasized the significance of population purchasing power in estimating a store’s temporal visits and the performance of a specific store compared to its competitors [65]. In another comprehensive study aiming at creating a widely applicable model, aligning with the goal of the methodology proposed in this paper, the Huff model was extended [66]. This extension incorporated additional spatially influencing factors such as brand recognition and internal sales cannibalization between stores. Fundamental economic factors within the model included annual store turnovers from the same grocery retailer and the yearly reported group turnovers for all competitors. While the results suggested the adequacy of such a model in selecting future retail locations, a notable obstacle was the considerable calculation time per iteration.
Regarding the significance of input data, there is certainly potential for their more accurate valuation. In a study focusing on locating a supermarket using a locally calibrated Huff model, the research utilized a local regression model, deviating from the typical global ordinary least squares (OLS) model [67]. This approach aimed to consider spatial variability in the model parameters, assuming that nearby customers exhibited similar preferences. The results highlighted the vital importance of the non-stationarity of the parameters used when assessing store viability. In comparison, the potential for upgrading the MDPA model could be linked to the valuation of the significance of relevant data concerning the distance of consumers from potential locations. On the other hand, even though the level of attractiveness in the mentioned studies was expressed by consumer distance from retail stores, the total number of consumers and their average incomes, which are factors that link store attractiveness to investor costs, were not included. This, precisely, represents the primary contribution of the MDPA model compared to other versions shown in relevant research.
4.2. Urban Sustainability Implications
In the field of urban development, strategic planning for shopping centers is not merely a logistical consideration; it is a fundamental component in sustaining the vitality of the central city core [68,69]. At the heart of this initiative lies the delicate balance between preserving the activities at the street level, particularly those of small businesses, and acknowledging the economic and social sustainability requirements of contemporary cities. Preserving the economic landscape of small businesses is a cornerstone of urban sustainability. These enterprises contribute to the unique character of city streets, fostering community identity and cultural diversity [70,71,72]. Yet, in recognizing the evolving dynamics of modern cities, we must also acknowledge the role of shopping centers as inherent components of urban life [73,74,75]. The proposed methodology introduces a practical approach to addressing this dual imperative. By allowing investors to define a threshold area for potential shopping centers, this model advocates for responsible urban development. This not only reduces the construction of overly expansive structures but also opens opportunities for incorporating non-commercial programs, thereby enriching the urban experience.
Furthermore, this model facilitates the optimal distribution of inner programs within shopping centers. By aligning programmatic structures with the real-life urban context, it aims to optimize economic parameters. This approach alleviates the risk of vacant spaces, a challenge further intensified by the post-Covid era, the surge in online shopping, and the instability of the global economy [76,77,78]. The MDPA aims at adapting shopping centers to the contemporary urban landscape, ensuring adaptability and resilience. Beyond these potentials, the approach used in this research can be extended to other typologies and applied in different geographical areas with the collection of relevant data related to the specific context.
Nevertheless, the application of the MDPA to real-world scenarios comes with its set of challenges and potential limitations. The principal obstacle arises from the inability to incorporate unforeseen social and economic parameters as input variables. These factors have the potential to significantly impact decisions concerning the selection of shopping center locations. It is essential to acknowledge that these challenges are inherent in any research carried out within a real context, particularly one influenced by complex social relations.
5. Conclusions
The primary objective of this study was to examine the optimization process of selecting locations and distributing programs within shopping centers by presenting the Methodology for Determining Architectural Programs of Shopping Centers (MDPA). Applying this methodology to the case study of the city of Novi Sad in the Republic of Serbia, the results indicate the following conclusions:
- The use of the MDPA, which introduces new economic parameters as qualitative attributes and eliminates the need for an iterative process, led to consistent results, juxtaposed with the verification research involving the use of the basic Huff model.
- This approach has the potential to establish a substantial correlation between potential profit and initial expenses, offering investors a relevant feasibility study.
- Program optimization involves maximizing the potential utilization of existing retail spaces, thereby promoting the sustainability of the built environment and minimizing the occurrence of vacant retail spaces.
Limitations within the scope of this study involve unanticipated social, economic, and political factors influencing decisions related to shopping center locations. These complexities pose challenges in practical applications that rely on intricate social relationships. Consequently, future research endeavors should delve into the exploration of more varied parameters, moving beyond economic considerations alone, to foster a nuanced understanding of the coexistence of commercial and social dimensions.
Author Contributions
Conceptualization, S.M. and J.A.J.; methodology S.M. and J.A.J.; validation, M.R.; formal analysis, M.R.; investigation, S.M.; data curation, S.M., J.A.J. and M.R.; writing—S.M.; writing—review and editing, M.R. and J.A.J.; visualization, S.M.; supervision, J.A.J. and M.R. All authors have read and agreed to the published version of the manuscript.
Funding
This research was supported by the Ministry of Science, Technological Development and Innovation (Contract No. 451-03-65/2024-03/200156) and the Faculty of Technical Sciences, University of Novi Sad, through the project “Scientific and Artistic Research Work of Researchers in Teaching and Associate Positions at the Faculty of Technical Sciences, University of Novi Sad” (No. 01-3394/1).
Data Availability Statement
The data analyzed in this study are available in: [Broj stanovnika po mesnim zajednicama] at [https://www.nsinfo.co.rs/lat/broj-stanovnika-po-mesnim-zajednicama]. These data were derived from the following resources available in the public domain: [Population count by local communities in Novi Sad: https://www.nsinfo.co.rs/]; [Planovi detaljne regulacije] at [https://www.nsurbanizam.rs/?q=pdr], reference number [reference number]. These data were derived from the following resources available in the public domain: [Plans of detailed regulation: https://www.nsurbanizam.rs/pdr?field_identifikacioni_broj_value=1665; https://www.nsurbanizam.rs/pdr?field_identifikacioni_broj_value=1682; https://www.nsurbanizam.rs/pdr?field_identifikacioni_broj_value=1696; https://www.nsurbanizam.rs/pdr?field_identifikacioni_broj_value=1727; https://www.nsurbanizam.rs/pdr?field_identifikacioni_broj_value=1784; https://www.nsurbanizam.rs/pdr?field_identifikacioni_broj_value=1805; https://www.nsurbanizam.rs/pdr?field_identifikacioni_broj_value=2037; https://www.nsurbanizam.rs/pdr?field_identifikacioni_broj_value=2156]. All links accessed on 9 May 2019.
Conflicts of Interest
The authors declare no conflicts of interest.
References
- Alinizzi, M.; Haider, H.; Alresheedi, M. Assessing Traffic Congestion Hazard Period due to Commuters’ Home-to-Shopping Center Departures after COVID-19 Curfew Timings. Computation 2022, 10, 132. [Google Scholar] [CrossRef]
- Hawkins-Mofokeng, R.; Tlapana, T.; Kasirye Ssemugooma, D. Effects of Traffic Congestion on Shopping Location Choice in the Greater eThekwini Region. JBMA 2022, 3, 372–386. [Google Scholar] [CrossRef]
- Robertson, J.; Fennell, J. The economic effects of regional shopping centres. J. Retail. Leis. Prop. 2007, 6, 149–170. [Google Scholar] [CrossRef]
- Williams, C.C. The Contribution of Regional Shopping Centres to Local Economic Development: Threat or Opportunity? Area 1992, 24, 283–288. [Google Scholar]
- Stanilov, K. The restructuring of non-residential uses in the post-socialist metropolis. In The Post-Socialist City: Urban Form and Space Transformations in Central and Eastern Europe after Socialism; Stanilov, K., Ed.; Springer: Dordrecht, The Netherlands, 2007; pp. 73–99. [Google Scholar] [CrossRef]
- Maksić, M. Institutional obstacles in large-scale retail developments in the post-socialist period—A case study of Niš, Serbia. Cities 2016, 55, 113–121. [Google Scholar] [CrossRef]
- Ibrahim, M.F.; McGoldrick, P.J.B. Shopping Choices with Public Transport Options, 1st ed.; Routledge: London, UK, 2003. [Google Scholar] [CrossRef]
- Jakovčić, M.; Rebernik, D. Comparative Analysis of Development of Retail and Shopping Centres After 1990 in Ljubljana and Zagreb. Hrvat. Geogr. Glas. 2008, 70, 33–48. [Google Scholar] [CrossRef][Green Version]
- Guimarães, P. Tourism and Authenticity: Analyzing Retail Change in Lisbon City Center. Sustainability 2022, 14, 8111. [Google Scholar] [CrossRef]
- Barata-Salgueiro, T.; Guimarães, P. Public Policy for Sustainability and Retail Resilience in Lisbon City Center. Sustainability 2020, 12, 9433. [Google Scholar] [CrossRef]
- Dinic-Brankovic, M.; Djekic, J.; Mitkovic, M.; Mitkovic, P.; Markovic-Brankovic, J. Postsocialist Restructuring of City Subcenters and the Role of Shopping Centers in Nis, Serbia. J. Urban Plan. Dev. 2018, 144, 04018009. [Google Scholar] [CrossRef]
- Hirt, S. Whatever happened to the (post)socialist city? Cities 2013, 32, S29–S38. [Google Scholar] [CrossRef]
- Kreja, K. Spatial imprints of urban consumption: Large-scale retail development in Warsaw. In The Urban Mosaic of Post-Socialist Europe. Contributions to Economics; Tsenkova, S., Nedović-Budić, Z., Eds.; Physica: New York, NY, USA, 2006; pp. 253–272. [Google Scholar] [CrossRef]
- Pichler-Milanovič, N.; Gutry-Korycka, M.; Rink, D. Sprawl in the post-socialist city: The changing economic and institutional context of Central and Eastern European cities. In Urban Sprawl in Europe: Landscape, Land-Use Change and Policy; Couch, C., Leontidou, L., Petschel-Held, G., Eds.; Blackwell Publishing: Hoboken, NJ, USA, 2007; pp. 102–133. [Google Scholar] [CrossRef]
- Križan, F.; Kunc, J.; Bilková, K.; Novotná, M. Transformation and Sustainable Development of Shopping Centers: Case of Czech and Slovak Cities. Sustainability 2021, 14, 62. [Google Scholar] [CrossRef]
- Garb, Y.; Dybicz, T. The retail revolution in post-socialist Central Europe and its lessons. In The Urban Mosaic of Post-Socialist Europe. Contributions to Economics; Tsenkova, S., Nedović-Budić, Z., Eds.; Physica: New York, NY, USA, 2006; pp. 231–252. [Google Scholar] [CrossRef]
- Maksić, M. Toward Defining Policy Framework for Large-scale Retail Impact Addressing in Serbia. Facta Univ. Ser. Work. Living Environ. Prot. 2017, 14, 169–179. [Google Scholar] [CrossRef]
- Rajagopal, R. Coexistence and conflicts between shopping malls and street markets in growing cities: Analysis of shoppers’ behaviour. J. Retail. Leis. Prop. 2010, 9, 277–301. [Google Scholar] [CrossRef][Green Version]
- Passaro, P.; Salomone, S.; Petruzzellis, L. Retail Concentration: The Shopping Streets. Eur. Sci. J. 2016, 12, 122. [Google Scholar] [CrossRef]
- Teller, C.; Reuterrer, T. The evolving concept of retail attractiveness: What makes retail agglomerations attractive when customers shop at them? J. Retail. Consum. Serv. 2008, 15, 127–143. [Google Scholar] [CrossRef]
- Kunc, J.; Reichel, V.; Novotná, M. Modelling frequency of visits to the shopping centres as a part of consumer’s preferences: Case study from the Czech Republic. Int. J. Retail. Distrib. Manag. 2020, 48, 985–1002. [Google Scholar] [CrossRef]
- Cvetković, M.; Dinkić, N.; Djukić, A.; Joković, J. Post-Socialistic Shopping Malls as New Gathering Places: Case Study Belgrade. Period. Polytech. Archit. 2017, 48, 101–105. [Google Scholar] [CrossRef]
- Crawford, M. The World in a Shopping Mall. In Variations on a Theme Park: The New American City and the End of Public Space; Sorkin, M., Ed.; Hill and Wang: New York, NY, USA, 1992; pp. 3–30. [Google Scholar]
- Teller, C. Shopping streets versus shopping malls—Determinants of agglomeration format attractiveness from the consumers’ point of view. Int. Rev. Retail. Distrib. Consum. Res. 2008, 18, 381–403. [Google Scholar] [CrossRef]
- Chiodelli, F.; Moroni, S. Do malls contribute to the privatisation of public space and the erosion of the public sphere? Reconsidering the role of shopping centres. City Cult. Soc. 2015, 6, 35–42. [Google Scholar] [CrossRef]
- Low, S. The Erosion of Public Space and the Public Realm: Paranoia, Surveillance and Privatization in New York City. City Soc. 2008, 18, 43–49. [Google Scholar] [CrossRef]
- Kohn, M. Brave New Neighborhoods, 1st ed.; Routledge: New York, NY, USA, 2004; pp. 1–240. [Google Scholar] [CrossRef]
- Friske, W.; Choi, S. Antoher Look at Retail Gravitation Theory: History, Analysis, and Future Considerations. ABD J. 2013, 5, 1–18. [Google Scholar]
- Eppli, M.; Shilling, J.D. How Critical is a Good Location to a Regional Shopping Center? J. Real. Estate Res. 1996, 13, 459–468. [Google Scholar] [CrossRef]
- Epstein, B.J. Evaluation of an Established Planned Shopping Center. Econ. Geogr. 1961, 37, 12–21. [Google Scholar] [CrossRef]
- Sheth, J.N.; Gardner, D.M.; Garrett, D.E. Marketing Theory: Evolution and Evaluation; Wiley: New York, NY, USA, 1988; pp. 1–256. [Google Scholar]
- O’Kelly, M.E. Trade-area models and choice-based samples: Methods. Environ. Plan. A 1999, 31, 613–627. [Google Scholar] [CrossRef]
- Reilly, W.J. The Law of Retail Gravitation; Knickerbocker Press: New York, NY, USA, 1931; pp. 1–75. [Google Scholar]
- Reilly, W.J. Methods for the Study of Retail Relationships; The University of Texas: Austin, TX, USA, 1929; pp. 1–56. [Google Scholar]
- Anderson, S.J.; Volker, J.X.; Phillips, M.D. Converse’s breaking-point model revised. J. Manag. Mark. Res. 2010, 3, 1–10. [Google Scholar]
- Huff, D.L. Defining and estimating a Trading Area. J. Mark. 1964, 28, 34–38. [Google Scholar] [CrossRef]
- Huff, D.L. A Probabilistic Analysis of Consumer’s Spatial Behavior. In Emerging Concepts in Marketing, Proceedings of the Winter Conference of the American Marketing Association, Pittsburgh, PA, USA, 27–29 December 1962; American Marketing Association: Chicago, IL, USA, 1963. [Google Scholar]
- Wu, S.-S.; Kuang, H.; Lo, S.-M. Modeling Shopping Center Location Choice: Shopper Preference–Based Competitive Location Model. J. Urban Plan. Dev. 2018, 145, 04018047. [Google Scholar] [CrossRef]
- Birkin, M.; Clarke, G.; Clarke, M.; Culf, R. Using Spatial Models to Solve Difficult Retail Location Problems. In Applied GIS and Spatial Analysis, 1st ed.; Stillwell, J., Clarke, G., Eds.; John Wiley & Sons, Ltd.: Chichester, UK, 2006; Volume 3, pp. 35–54. [Google Scholar] [CrossRef]
- Lu, S.; Shaw, S.-L.; Fang, Z.; Zhang, X.; Yin, L. Exploring the Effects of Sampling Locations for Calibrating the Huff Model Using Mobile Phone Location Data. Sustainability 2017, 9, 159. [Google Scholar] [CrossRef]
- Suárez-Vega, R.; Santos-Peñate, D.R.; Dorta-González, P. Location models and GIS tools for retail site location. Appl. Geogr. 2012, 35, 12–22. [Google Scholar] [CrossRef]
- Kristoffersson, I.; Daly, A.; Algers, S. Modelling the attraction of travel to shopping destinations in large-scale modelling. Transp. Policy 2018, 68, 52–62. [Google Scholar] [CrossRef]
- Suárez-Vega, R.; Santos-Peñate, D.R.; Dorta-González, P.; Rodríguez-Díaz, M. A multi-criteria GIS based procedure to solve a network competitive location problem. Appl. Geogr. 2011, 31, 282–291. [Google Scholar] [CrossRef]
- Wang, Y.; Jiang, W.; Liu, S.; Ye, X.; Wang, T. Evaluating Trade Areas Using Social Media Data with a Calibrated Huff Model. Int. J. Geo-Inf. 2016, 5, 112. [Google Scholar] [CrossRef]
- Karamshuk, D.; Noulas, A.; Scellato, S.; Nicosia, V.; Mascolo, C. Geo-Spotting: Mining Online Location-based Services for Optimal Retail Store Placement. In Proceedings of the 19th ACM SIGKDD International Conference on the Knowledge Discovery and Data Mining—KDD’13, Chicago, IL, USA, 11–14 August 2013. [Google Scholar] [CrossRef]
- Ting, C.-Y.; Ho, C.C.; Yee, H.J.; Matsah, W.R. Geospatial Analytics in Retail Site Selection and Sales Prediction. Big Data 2018, 6, 42–52. [Google Scholar] [CrossRef] [PubMed]
- Jensen, P. Network-based predictions of retail store commercial categories and optimal locations. Phys. Rev. E 2006, 74, 035101. [Google Scholar] [CrossRef] [PubMed]
- Kubis, A.; Hartmann, M. Analysis of Location of Large-area Shopping Centres. A Probabilistic Gravity Model for the Halle–Leipzig Area. Jahrb. Fur Reg. 2007, 27, 43–57. [Google Scholar] [CrossRef]
- Github. Available online: https://github.com/ryersongeo/qgis_location_analytics (accessed on 27 May 2019).
- Informatika JKP Novi Sad. Available online: https://www.nsinfo.co.rs/lat/broj-stanovnika-po-mesnim-zajednicama (accessed on 9 May 2019).
- Popis Stanovništva, Domaćinstava i Stanova—Popis 2022. Available online: https://publikacije.stat.gov.rs/G2022/HtmlL/G20221350.html (accessed on 6 March 2024).
- Cvetković, M.; Simić, I.; Grujičić, A. Transitioning the Public Space—The Case of Belgrade Shopping Mall. In Proceedings of the 7th International Academic Conference Places and Technologies PT2020, Belgrade, Serbia, 29–30 October 2020. [Google Scholar] [CrossRef]
- GeoSrbija. Available online: https://a3.geosrbija.rs/ (accessed on 15 May 2019).
- Promenada. Available online: https://promenadanovisad.rs/mapa/ (accessed on 7 June 2020).
- BIG. Available online: http://www.bigcenters.rs/mapa-objekta/#prizemlje (accessed on 7 June 2020).
- Mercator. Available online: https://www.mercator.si/prodajna-mesta/mercator-centar-novi-sad/ (accessed on 7 June 2020).
- Skupština Grada Novog Sada. Available online: https://skupstina.novisad.rs/mesne-zajednice/ (accessed on 9 May 2019).
- JP Urbanizam. Available online: http://www.nsurbanizam.rs/?q=pdr (accessed on 9 May 2019).
- Okabe, A.; Okunuki, K. A Computational Method for Estimating the Demand of Retail Stores on a Street Network and its Implementation in GIS. Trans. GIS 2001, 5, 209–220. [Google Scholar] [CrossRef]
- Geofabrik. Available online: https://www.geofabrik.de/ (accessed on 17 May 2019).
- OpenStreetMap. Available online: https://www.openstreetmap.org/#map=7/44.240/20.911 (accessed on 17 May 2019).
- Boyd, S.; Vandenberghe, L. (Eds.) Optimality conditions. In Convex Optimization; Cambridge University Press: New York, NY, USA, 2004; pp. 241–249. [Google Scholar]
- Boyd, S.; Vandenberghe, L. (Eds.) Convex optimization problems. In Convex Optimization; Cambridge University Press: New York, NY, USA, 2004; pp. 127–189. [Google Scholar]
- Službeni List Grada Novog Sada. Available online: https://skupstina.novisad.rs/wp-content/uploads/2016/12/sl-11-1.pdf (accessed on 20 May 2019).
- Liang, Y.; Gao, S.; Cai, Y.; Zhang Foutz, N.; Wu, L. Calibrating the dynamic Huff model for business analysis using location big data. Trans. GIS 2020, 24, 681–703. [Google Scholar] [CrossRef]
- De Beule, M.; Van den Poel, D.; Van de Weghe, N. An extended Huff-model for robustly benchmarking and predicting retail network performance. Appl. Geogr. 2014, 46, 80–89. [Google Scholar] [CrossRef]
- Suárez-Vega, R.; Gutiérrez-Acuña, J.L.; Rodríguez-Díaz, M. Locating a supermarket using a locally calibrated Huff model. Int. J. Geogr. Inf. Sci. 2014, 29, 217–233. [Google Scholar] [CrossRef]
- Han, H.; Sahito, N.; Van Thi Nygen, T.; Hwang, J.; Asif, M. Exploring the Features of Sustainable Urban Form and the Factors that Provoke Shoppers towards Shopping Malls. Sustainability 2019, 11, 4798. [Google Scholar] [CrossRef]
- Hangenbruch, N.; Othengrafen, F. Resilient Inner Cities: Conditions and Examples for the Transformation of Former Department Stores in Germany. Sustainability 2022, 14, 8303. [Google Scholar] [CrossRef]
- Qualizza, G.; de Luca, P. Small Retailers in Small Towns: An Explorative Study on Shopping Behaviour for Improving Social Sustainability in an Urban Centre. In Managing Sustainability; Luceri, B., Martinelli, E., Eds.; International Series in Advanced Management Studies; Springer: Cham, Switzerland, 2022; pp. 111–130. [Google Scholar] [CrossRef]
- Ebaid, M.A.M.; Mahmoud, A.H.A.; Shawket, I.M. Implementing technology in street amenities as a crucial factor of social sustainability and resilience in pedestrian oriented shopping streets (POSS). Int. J. Sustain. Build. Technol. Urban Dev. 2017, 8, 295–314. [Google Scholar] [CrossRef]
- Diao, J.; Shaoming, L. The Culture-Oriented Urban Regeneration: Place Narrative in the Case of the Inner City of Haiyan (Zhejiang, China). Sustainability 2022, 14, 7992. [Google Scholar] [CrossRef]
- Kunc, J.; Križan, F.; Novotná, M.; Bilková, K. Social Dimension of Shopping Centers Operation: Managerial Perspectives. Sustainability 2022, 14, 709. [Google Scholar] [CrossRef]
- Hagberg, J.; Styhre, A. The production of social space: Shopping malls as relational and transductive spaces. J. Eng. Des. Technol. 2013, 11, 354–374. [Google Scholar] [CrossRef]
- Blazy, R.; Labuz, R. Spatial Distribution and Land Development Parameters of Shopping Centers Based on GIS Analysis: A Case Study on Kraków, Poland. Sustainability 2022, 14, 7359. [Google Scholar] [CrossRef]
- Büyükşahin, S. Effects of COVID-19 pandemic on spatial preferences and usage habits of users in shopping malls and its relation with circulation layout. Ain Shams Eng. J. 2023, 14, 101838. [Google Scholar] [CrossRef]
- Hashem, T. Examining the Influence of COVID-19 Pandemic in Changing Customers’ Orientation towards E-Shopping. Mod. Appl. Sci. 2020, 14, 59–76. [Google Scholar] [CrossRef]
- Guimarães, P. Shopping centres in decline: Analysis of demalling in Lisbon. Cities 2019, 87, 21–29. [Google Scholar] [CrossRef]


Disclaimer/Publisher’s Note: The statements, opinions and data contained in all publications are solely those of the individual author(s) and contributor(s) and not of MDPI and/or the editor(s). MDPI and/or the editor(s) disclaim responsibility for any injury to people or property resulting from any ideas, methods, instructions or products referred to in the content. |
© 2024 by the authors. Licensee MDPI, Basel, Switzerland. This article is an open access article distributed under the terms and conditions of the Creative Commons Attribution (CC BY) license (https://creativecommons.org/licenses/by/4.0/).