Article

Contemporary Wildfires Not More Severe Than Historically: More Fire of All Severities Needed to Sustain and Adapt Western US Dry Forests as Climate Changes

Program in Ecology and Evolution, University of Wyoming, Laramie, WY 82071, USA
Sustainability 2024, 16(8), 3270; https://doi.org/10.3390/su16083270
Submission received: 6 March 2024 / Revised: 9 April 2024 / Accepted: 10 April 2024 / Published: 14 April 2024
(This article belongs to the Section Sustainable Forestry)

Abstract

:
Fire-adapted dry forests and nearby communities both need to be sustained as climate changes. Wildfires have increased in the ~25.5 million ha of dry forests in the western US, but are wildfires already more severe than historical (preindustrial) wildfires, warranting suppression, or is more fire needed? Recent research suggests that a higher percentage are more severe, but is this from more high-severity fire (≥70% mortality) or simply less lower-severity fire? To resolve this question, I compared government fire-severity data from 2000–2020 with corresponding government Landfire historical data, representing the last few centuries. The fire rotation (expected time to burn across an area of interest) for high-severity fire was 477 years recently versus 255 years historically, a deficit, not a surplus. High-severity fire would need to increase 1.9 times to equal historical rates. Thus, reducing high-severity fire through fuel reductions is fire suppression, which has significant well-known adverse ecological impacts. These include reductions in (1) natural burn patches, snags, and non-forest openings, that favor diverse fire-adapted species, and (2) landscape heterogeneity that can limit future disturbances and enhance landscape ecological processes. Even larger deficits were in moderate (4.4 times) and low (5.8 times) fire severities. However, if only these lower severities were restored, the high-severity percentage would correspondingly be reduced to low levels. All fire severities are needed to provide a variety of post-fire settings that favor a broad suite of selection pressures and adaptations to emerging climate. This paper shows that to sustain and adapt dry forests and nearby communities to fire and climate change, the billions spent on fuel reductions to reduce high-severity fire can be redirected to protecting the built environment, fostering both safe and sustainable dry forests and human communities.

1. Introduction

Wildfires have been increasing in the western USA since the mid-1980s, when systematic government fire-severity data first became available (e.g., [1]), and are likely to continue to increase as climate changes [2], but are wildfires in dry forests already more severe than historical (preindustrial) wildfires? Dry forests are lower elevation forests dominated by ponderosa pine (
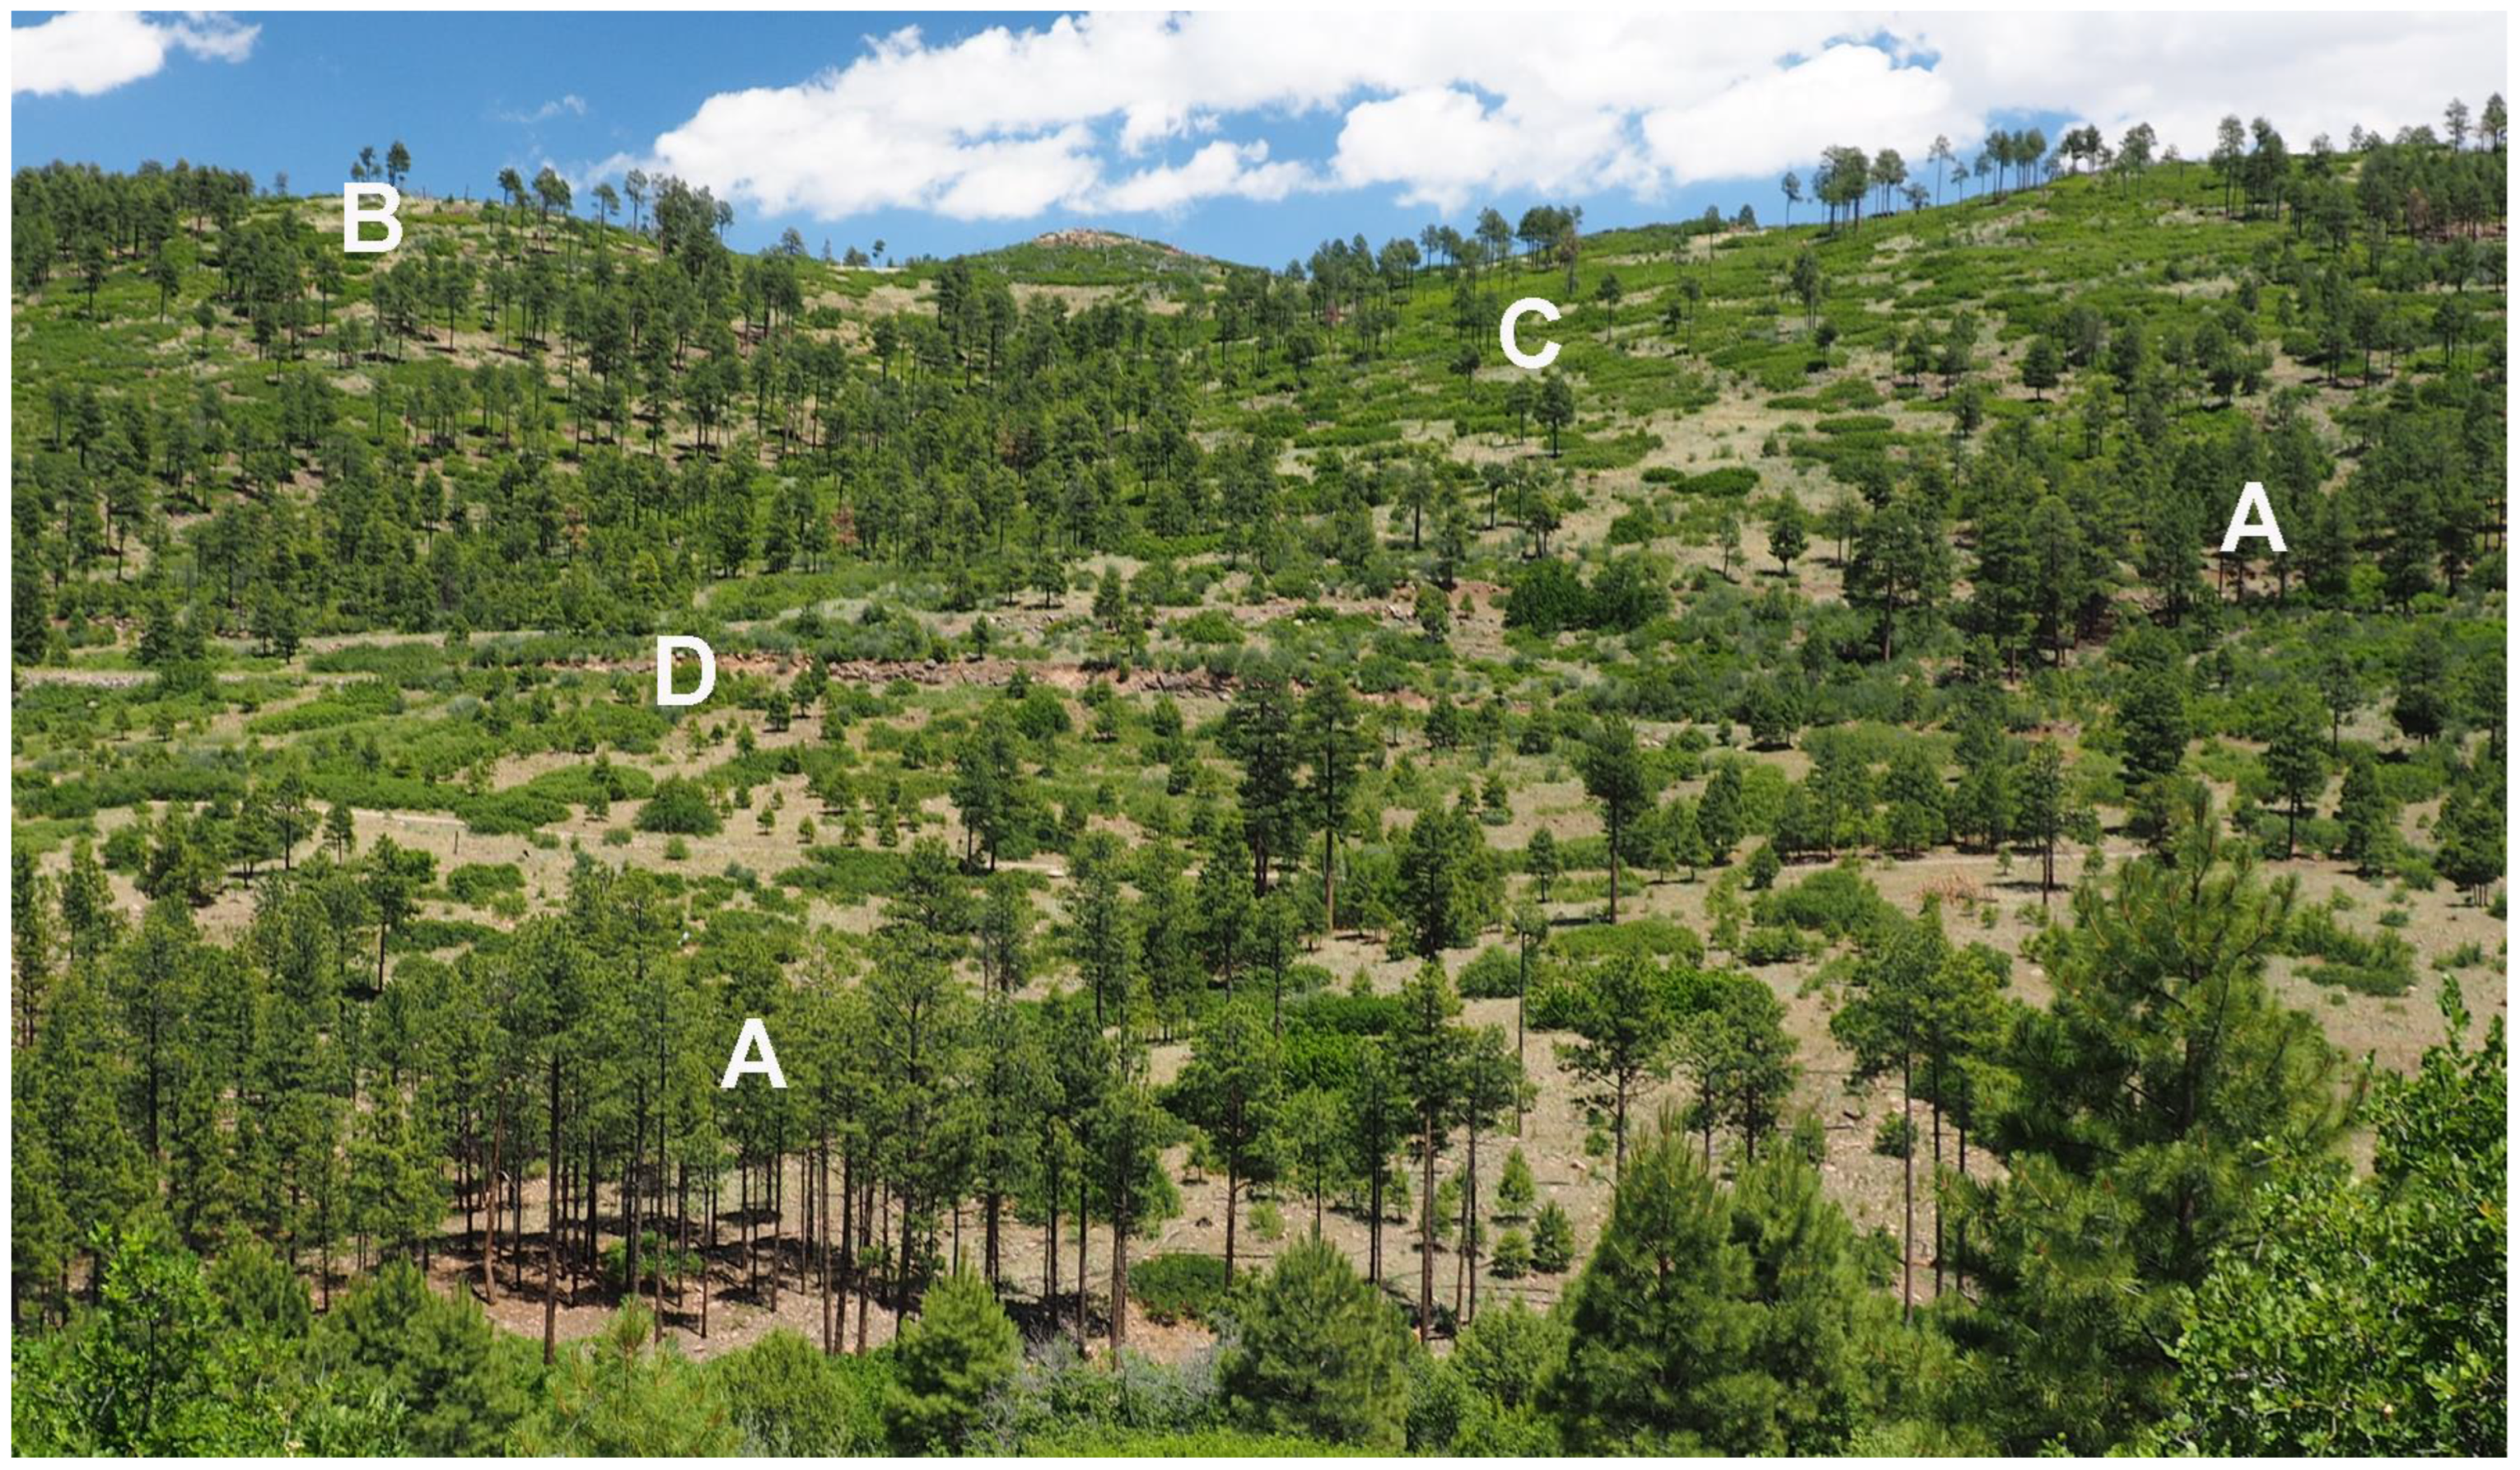
Pinus ponderosa) or similar pines and dry mixed-conifer forests with pines dominant but other trees common. Trends in fire severity since the mid-1980s suggest that the high-severity part of wildfires (Figure 1, C), where ˃70% of tree basal area is killed, is increasing [1]. Low-severity fire is <20% basal area mortality, and moderate-severity fire is 20–70%. Earlier, high-severity fire from 1984–2012 was found to still be burning within the range of historical rates or was too low across 42 of 43 analysis regions, except California, in the 25.5 million ha of dry forests in the western USA [3].
However, new analysis, based on data from the U.S. government’s Landfire program (www.landfire.gov, accessed on 4 November 2023), showed that recent fires in dry forests now have a higher percentage of high-severity fire than historically [4]. The percentage of fire of a particular severity is calculated from the percentage of total burned area that burned at a particular severity. Could part of the higher percentage of high-severity fire be from this study’s focus on using remote-sensing data calibrated with ground-plot estimates of fire severity, as opposed to canopy estimates? Most important, percent high-severity fire is an ambiguous measure. Are recent fires burning more land area per year at high severity than they did historically, or are recent fires just burning less land area per year at low to moderate severity? Either of these possibilities could produce a higher percentage of high-severity fire in the recent period than historically. These two possibilities have different meanings and implications for both fire management and people living with wildfires, which shape landscape sustainability, so it is important to determine which is the case, a focus here.
If more area of dry forests is burning at high severity recently than historically, then reducing high-severity fire is logical for sustainability, as concluded in Parks et al. [4] and recent policy papers [5,6] based on a review by Hagmann et al. [7]. Under the historical low-severity fire model used by these studies, changes in historical dry forests from logging, livestock grazing, and fire suppression allowed fuel buildup, leading to uncharacteristic high-severity fire [4,5,6,7]. These studies recommend active management, such as mechanical thinning and other forms of fuel reduction, to reduce these high-severity fires.
Alternatively, if there is recently just less low- to moderate-severity burned area, than historically, without more area burned at high severity, then restoring more low- to moderate-severity fire is all that is ecologically needed, as is supported by a large body of evidence. Several previous comparisons of recent and historical high-severity fire rates showed that area burned at high severity in dry forests is still lower recently than occurred historically [8,9,10]. Baker [3] showed this for nearly all dry forests, except for parts of California. Also, the low-severity fire model for historical dry forests was rejected by Baker et al. [11] after correcting extensive false and omitted evidence in Hagmann et al. [7], and an alternative mixed-severity fire model was accepted. Under this supported alternative mixed-severity fire model, primarily low- to moderate-severity fire was excluded in the modern era, and high-severity fires are not burning recently at exceptional rates [11,12]. Under the mixed-severity fire model, the primary ecological fire need is to just restore the low- to moderate-severity fires that were excluded; reducing high-severity fire under this mixed-severity model is fire suppression, well known to be ecologically damaging [13].
However, Parks et al. [4] recently added new evidence from government Landfire data (www.landfire.gov, accessed on 4 November 2023), although based on the rejected low-severity fire model, showing that percent high-severity fire has increased. Landfire data, which include historical fire rates (e.g., fire rotation or mean fire interval) by fire severity (low, moderate, high) are reported to be based on expert opinions, informed by evidence, rather than based on primary scientific evidence itself [14]. Landfire Biophysical Setting (BPS) Models (Table S1), that characterize the diversity of ecological settings, each have a list of sources of evidence that informed the expert opinion about historical fire rates and severities. However, a significant known limitation is that expert-opinion estimates of fire rates in each Landfire BPS Model are not linked to specific sources, so users cannot verify estimates or update them with new evidence [14]. As a result, Landfire BPS Models are not clearly reproducible science, since primary sources are not linked to Model estimates, and it is not clear that their review process would lead a new group of experts to arrive at similar estimates. Primary scientific sources, not Landfire, thus have to be considered best available science.
Another significant problem with historical fire estimates in Landfire BPS Models is the use of incorrect and outdated measures of reported fire rates, which have been shown to require correction before use [15], and are not likely corrected in the BPS Models. Fire rotation (FR), the expected time to burn across an area of interest, has long been shown to be the correct rate measure for fire, as it is based on area burned, essential for a phenomenon that varies in area over several orders of magnitude [15]. Early fire-count methods in small plots estimated fire rates as mean fire return intervals (MFRIs) or just mean fire intervals (MFIs), based on a composite list of fire-scar dates (so, also commonly called CFIs; composite fire intervals) found within a small plot. These CFI count estimates have been shown to be incorrect and substantially too short [15], because they do not measure the areas of fires, but just count fires equally and measure intervals between them in lists, although most are small. Newer landscape-scale methods are available that explicitly measure fire areas and avoid this and the many other limitations of these older small-plot CFI or MFRI estimates [11]. Accurate regression methods are also now available [15] to correct old CFI estimates to FRs, as is done here with the uncorrected Landfire estimates. Incorrect CFI estimates are still listed and used without correction in Landfire Models, including the estimates of percent severities used by Parks et al. [4]. It is the low to moderate-severity rates in Landfire that are adversely affected by uncorrected CFI estimates, since those rates are typically from small plots.
Another question is whether Landfire BPS Models support the low-severity fire model that was rejected in dry forests by the large body of evidence in [11]. This model was the basis for Hagmann et al. [7] and Parks et al. [4]. These particular studies did not define this model, but it was defined by Hessburg et al. ([16], p. 118):
“When we refer to low-severity fires, we are describing fires that occurred frequently, usually every 1–25 years, and where less than 20% of the basal area was killed (Agee, 1990, 1993). When we refer to mixed-severity fires, we refer to fires that occurred with moderate frequency, usually every 25–100 years, and where 20–70% of the basal area may have been fire-killed”.
This combination is the predominantly low-severity fire model, that Hagmann et al. [7] and Parks et al. [4] used. The distinguishing feature of a mixed-severity fire model (e.g., Figure 1) is that a significant percentage of historical fire also was high severity [11].
Finally, the stand-replacing fire measure used in Parks et al. [4] and in Landfire BPS Models [14] is also misnamed. Established methods have long considered >70% mortality to be just “high-severity” fire [17], not “stand-replacing” fire (Figure 1), which kills nearly all trees, typically characterized as 90–100% mortality [18]. These are significant ecological differences, since typically many trees remain after high-severity fires, that can provide seed for nearby tree regeneration, whereas stand-replacing fires leave few to no seed trees, hampering post-fire tree regeneration [18]. Landfire high-severity fire rates are not known to need correction, since they are largely FRs estimated from stand-origin dating or other methods not based on the problematic composite lists of fires in small plots [11,15].
This study’s aim is to use government data to answer the question: are wildfires in dry forests already more severe than historical (preindustrial) wildfires? I used corrected Landfire data to test four hypotheses about fire in dry forests: (1) percent high-severity fire is higher recently than historically, (2) recent fires are more severe than historically from more area burned at high severity, (3) after restoring low- and moderate-severity fire to historical levels, recent percent high-severity fire is still greater than historical percent high-severity fire, and (4) historical Landfire data support the low-severity fire model. These hypotheses are derived to test and refine conclusions of Parks et al. [4], Hagmann et al. [7], and others [5,6,16] that wildfires in dry forests are more severe than historically.

2. Materials and Methods

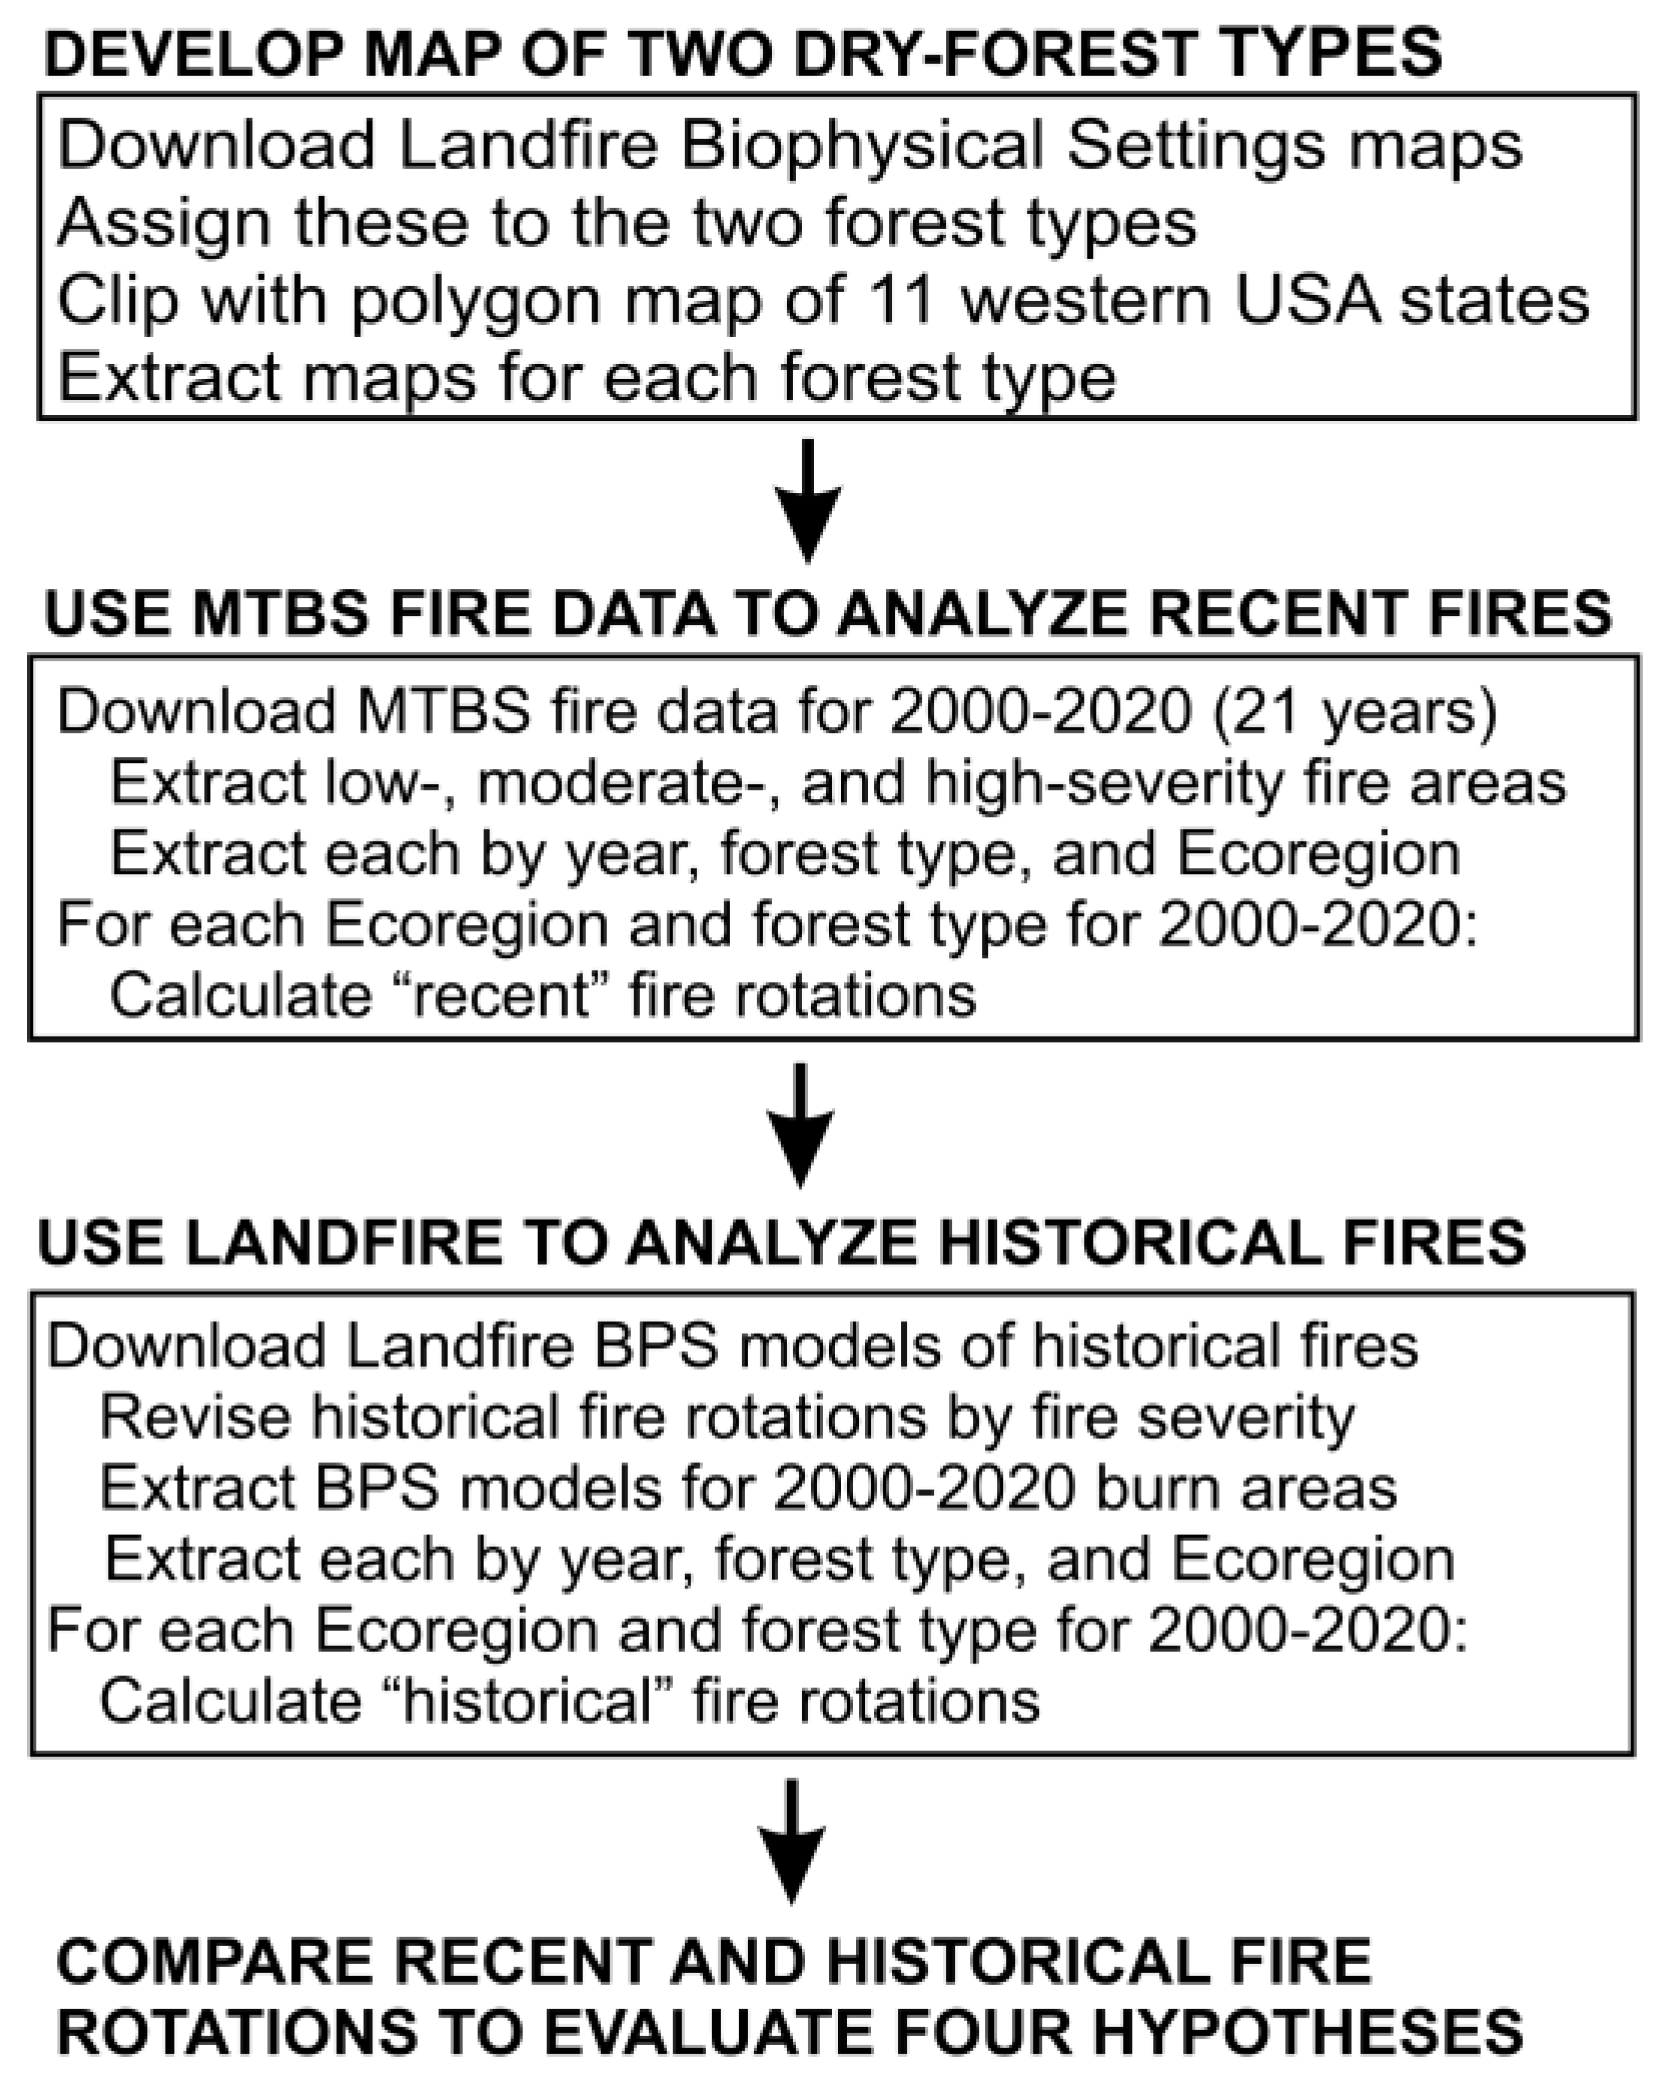
First, an overview of the methods and the workflow of this study (Figure 2). US government fire-severity data were used to test the hypothesis that modern fires are more severe than historically overall and in five ecoregions covering most dry forests of the western USA (Figure 3). Earlier tests of this hypothesis used the total area burned at high severity as the criterion, but often only one region was studied (e.g., [8]) and data through 2020, a large fire year, were not yet available (e.g., [3]). Parks et al. [4] covered most dry-forest area up to 2020, but instead tested whether a larger percentage of total area burned was high severity recently than historically. This could mean two very different actual fire situations with different implications for management, as explained in the Introduction.
First, I tested whether percent high severity has increased, which was a new finding of the Parks et al. [4] study. Second, I tested whether land area burned at high-severity has increased relative to historical area burned, so that the high-severity FR is shorter recently than historically. Recent low- and moderate-severity fire percentages were then replaced with Landfire historical percentages. Recent percent high-severity fire was then recalculated to see whether just restoring low- to moderate-severity fire also restores recent percent high-severity fire. Finally, to test whether the low-severity fire model is supported by Landfire data, the percentages of high-severity fire expected under the low-severity fire model were compared with percentages reported by Landfire for historical high-severity fire in their BPS Models. Analyses were done in a geographical information system (GIS), ArcGIS Pro 3.1 (ESRI, Redlands, CA, USA) with the NAD 83 Albers Equal Area Conic projection and in Minitab 21.4.1 statistical software (Minitab, Inc., State College, PA, USA).
Calculation of percent high severity or another severity is straightforward, but an example is useful. Percent low-, moderate-, and high-severity fire can be calculated from percentages of total area burned, that burned at a particular severity, over a particular period (e.g., 100 × low-severity area burned in ten years/total area burned in ten years). FRs for total fire and fire of a particular severity also can be converted to annual area burned fractions by taking the inverse. If FRs are 250 years for high, 100 years for moderate, and 30 years for low severity, then the corresponding annual area-burned fractions are 0.004, 0.010, and 0.033, which total 0.047, so high-severity fire is 8.5% (100 × (0.004/0.047)), moderate-severity fire is 21.3%, and low-severity fire is 70.2% of total fire.
For 2000–2020 fire data, US government fire-severity data from Monitoring Trends in Burn Severity (MTBS) (Table 1), which use Landsat remote-sensing data, were used. The source was MTBS annual burn-severity mosaics showing classified fire severity: 2 = low, 3 = moderate, and 4 = high severity. Some low-severity fire also likely occurred in 1 = unburned to low, leading to some underestimation of low-severity fire, but this category also includes substantial unburned area, so including it would overestimate low-severity fire. Prescribed fires were not excluded from this analysis, as any large fire could contribute to restoration of fire, since there is a known fire deficiency. MTBS classified fire severity has some limitations, including both interpreted and fixed severity limits, not just fixed limits, and imperfect capture of ground-plot estimates [19]. However, replacements are not official government data, and do only a little better than ground-plot estimates [20]. Most important, methods based only on ground-plots substantially overestimate canopy mortality in dry forests [21], a good reason to use MTBS data. This significant limitation is later discussed to explain why percent high-severity estimates in Parks et al. [4] are high.
Recent MTBS data only for the period from 2000–2020 (21 years) are used, which represents the most recent period with increased fire, but no trend. Complete data for 2021–2023 were not available yet from MTBS when this study began, as an image from the following year and processing time for numerous fires are needed. In another study [12], statistical change-points in area burned across all dry forests from 1984–2020 were analyzed. It was found that there was a significant increase in area burned in dry forests in the 11 western states up to 2000. Between 2000–2020, however, there was no statistical trend in area burned. Thus, this 21-year period was also used here as the most recent and longest period with elevated area burned, relative to 1984–1999, and without trend.
Recent fire in dry forests, defined by the 2020 Landfire BPS map (Table 1) showing estimated historical locations of forest types, was also analyzed based on the BPS models. Dry forests are not defined by Landfire, so previous [3] definitions of dry forests that place Landfire BPS Models into categories of pine forests and dry mixed-conifer forests (Table S1) were used. These definitions are similar to those of Parks et al. (Appendix S1 in [4]), but include a few more BPS Models, expanding dry forests to include more southwestern forests and a few others (Table S2). Parks et al. did not divide dry forests into ponderosa pine and dry mixed-conifer forests, so I used previous definitions to do this. Since Parks et al.’s definitions lead to estimates of fire rates that are quite similar to these previous definitions (Table S2), the analysis was done using only my broader definitions of dry forests and also division of dry forests into pine and dry mixed conifer.
The same four ecoregions were used, as in Parks et al. [4], which were developed by The Nature Conservancy (Table 1). However, the ecoregion map was obtained directly from Sean Parks (Personal Communication, 14 July 2023) to be sure that the same regions were used. Nonetheless, an additional ecoregion was added in the northeastern part of the 11 western states where there also are some dry forests (
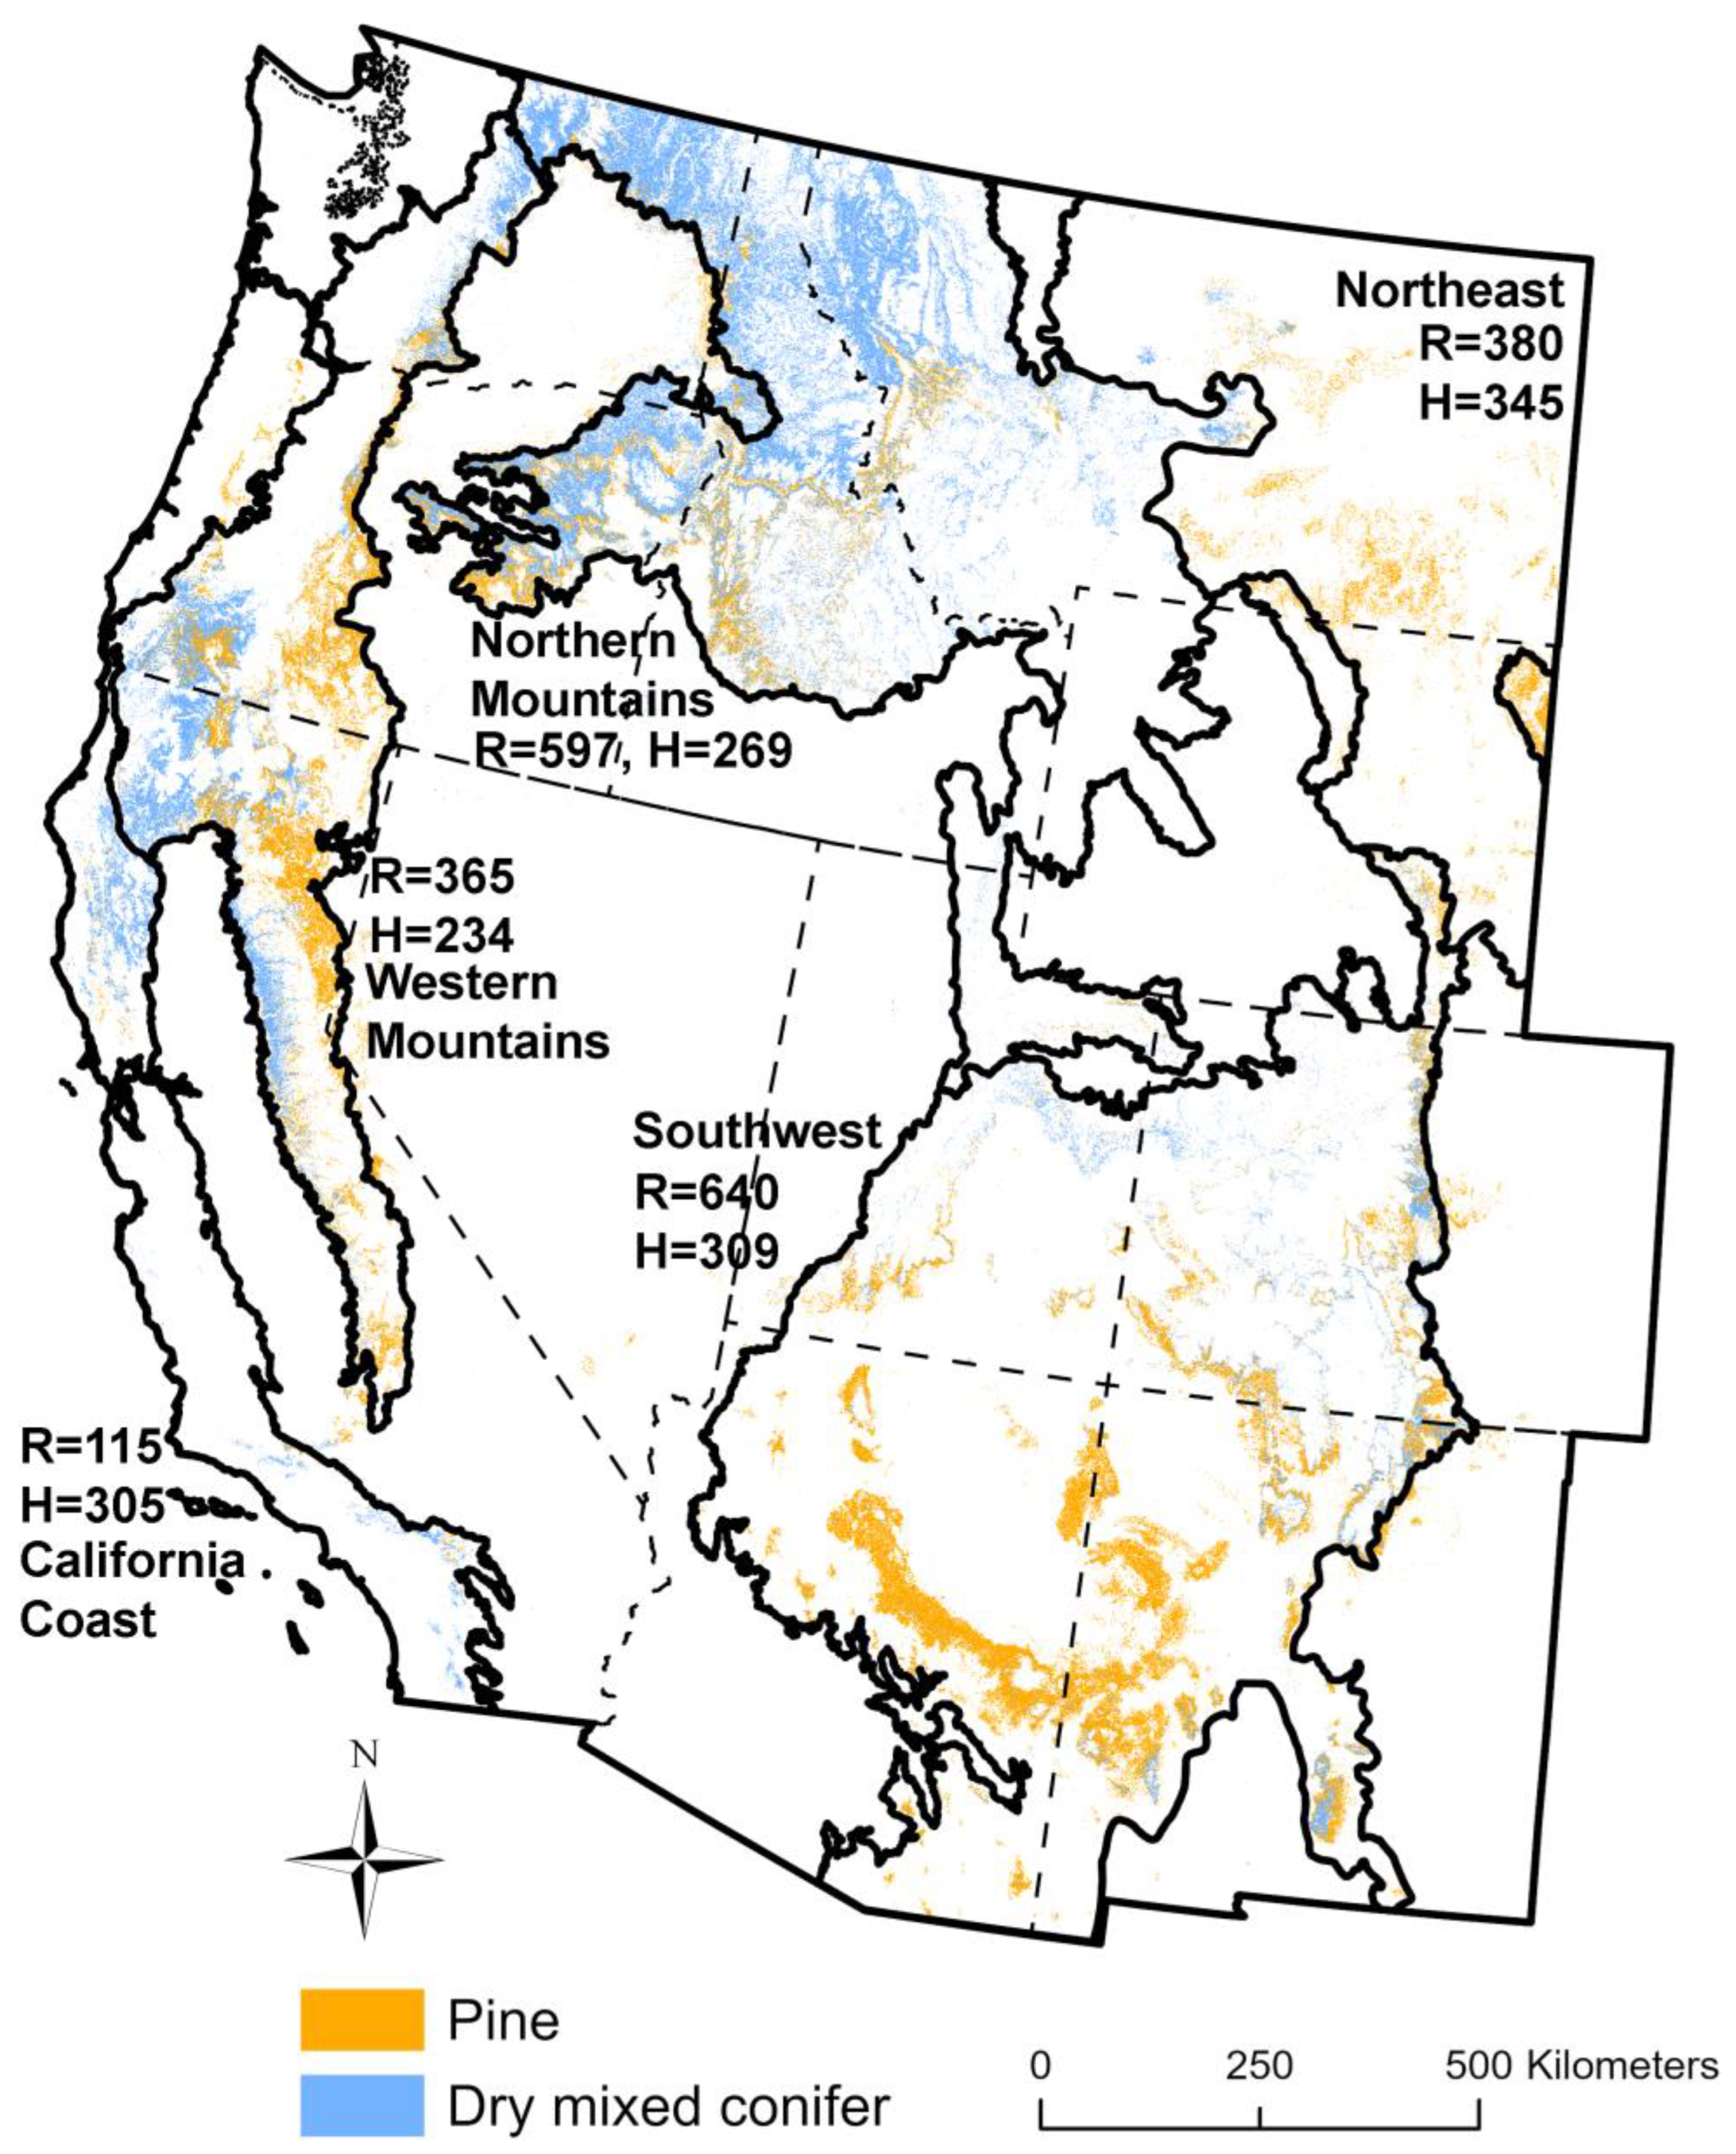
Figure 3). Dry mixed conifer there was not included, as it covered a small area and had atypical forests. A total of 14 combinations of ecoregions and forest types was used, five for dry forests, five for pine, and four for dry mixed-conifer forests.
The ecoregions differ in physical geography. The California Coast ecoregion has the smallest area of dry forests, which are concentrated in the Klamath Mountains in the northern part of the ecoregion, with only scattered occurrences on higher peaks to the south (Figure 3). These include both metamorphic and volcanic mountains at higher elevations in a Mediterranean climate subject to wet winters and dry summers. These are mountains with a relatively high density of human populations and a dominance of ignitions by people. The Western Mountains ecoregion contains both eastern and western sides of the Sierra and Cascade Mountains, which are primarily volcanic mountains. Here too, there is a wet-winter and dry-summer climate, but less pronounced, and ignitions by people are still substantial but fewer. The Northern Mountains ecoregion, which has the largest area of dry forests, is dominated by dry mixed-conifer forests, mostly in Montana, Idaho, and northeastern Oregon. There is a reduced wet-winter and dry-summer contrast, a lower density of human-ignited fires, and more remote, wild country. The Southwest ecoregion, which has the most pine forests, is the warmest and driest ecoregion, which has modestly snowy winters, but has a summer monsoon that helps pines to persist this far south on higher mountains and uplifted plateaus. This ecoregion is particularly subject to episodic droughts and has the most frequent lightning. The Northeast region is generally on the eastern side of the northern Rocky Mountains and intermingles out onto the adjoining Great Plains. This is a small, but distinct area of dry forests.
To estimate FRs, using recent MTBS fire data, the ArcGIS “Con” function was used to separately extract MTBS data by year that are within pine and dry mixed-conifer forest types (Table S1). Then, the ArcGIS “Clip raster” function was used to extract MTBS data by region for each of the 5 ecoregions (Figure 3) and 21 years. Next, counts of pixels in MTBS fire-severity categories 2–4 were recorded separately by fire-severity category, forest type, year, and region in spreadsheets. Pixel counts were converted to area in hectares by multiplying by 0.09 (30 m squared divided by 10,000 m2/ha), then area burned was summed over the 21 years. Because MTBS data are generally available only for fires > 405 ha, which the MTBS website says are ∼95% of total burned area, initial area-burned estimates were divided by 0.95 to estimate total burned area. FRs were then calculated as 21 years/fraction of the area of a forest type in an ecoregion burned by each fire severity over the 21 years. Fire rotation (FR) is the expected period to burn once across a land area equal to a land area of interest, although some reburns occur; it is also the expected mean fire interval at any point in the land area [15].
Historical fire data, representing the last few centuries, were from Landfire, but required some revision. As in Parks et al. [4], Landfire BPS Models were used to provide estimates of FR for historical high-severity fire, assuming that the Landfire attribute “FRI_REPLAC” represents the historical high-severity FR. As explained earlier, Landfire’s estimates are CFI estimates that substantially underestimate the length of low- and moderate-severity FRs, but Baker [15] provided regression models that accurately predict these FRs from CFI estimates. Landfire does not identify which variety of CFI measure was used, as estimates are just labeled “FRI_MIXED” and “FRI_LOW”. So, here the most conservative correction multiplier was used, which is the mean CFI for fires that scarred at least 25% of sampled trees, to estimate FR [15]. This estimator has an R2adj of 0.923 in predicting FRs, indicating high accuracy as a linear function of mean CFI-25% scarred [15], using a ß coefficient (multiplier) of 1.715. So, to estimate FRs for low- and moderate-severity fire from Landfire estimates, which are in years, each Landfire estimate was multiplied by 1.715.
Next, binary “recently burned” raster maps were created to limit the acquisition of historical Landfire data only to areas burned in fires from 2000 to 2020, as was similarly done by Parks et al. [4]. For extraction of historical Landfire BPS Model data for all pixels burned by any fire severity from 2000–2020, the Raster calculator Con function was used to reclassify all pixels as 1, if burned at least once by any fire severity in MTBS categories 2–4 in any year from 2000–2020, and 0 if not, separately for pine and dry mixed conifer. Each of these overall maps was clipped by each ecoregion. “Extract by Mask” was used to extract historical Landfire data only for all “recently burned” pixels separately within each ecoregion and overall, for pine, dry mixed conifer, and all dry forests. Then, area-weighted means of Landfire FRI_REPLAC and corrected FRI_MIXED and FRI_LOW FRs were calculated across Landfire BPS models within each area using Equation (1):
Area Weighted Mean FR = SUM (BPS Model FR × Area in ha)/SUM (Area in ha).
This was calculated separately for FRI_REPLAC, FRI_MIXED, and FRI_LOW. This area-weighted mean is equivalent to the measure and method used in Parks et al. [4]. Since FRI_REPLAC, FRI_MIXED, and FRI_LOW all are FRs, the annual area burned is estimated simply as the inverse or 1/FR. Then these three annual area-burned values are summed to calculate total annual area burned, and the percentage of high, moderate, and low severity is calculated as the percentage of this total annual area burned.
Using the resulting datasets, the four hypotheses about high-severity fire across dry forests and 14 areas were tested. These hypotheses were created to test and refine the conclusions of Hagmann et al. [7], Parks et al. [4], and others, so are not traditional null hypotheses. Ecoregions and their fires are effectively whole populations, since all of the fires are available, not a sample of them, so there is no need to use statistical inference. Acceptance or rejection of hypotheses is based on simply comparing the population values.
The four hypotheses are as follows. First, H0: Percent high-severity fire is higher recently than historically versus HA: Percent high-severity fire is lower recently than historically. Second, H0: Recent high-severity FRs are shorter than historical high-severity FRs versus HA: recent high-severity FRs are longer. Third, H0: after restoring low- and moderate-severity fire to their historical percentages, recent percent high-severity fire is equal to historical percent high-severity fire versus HA: recent percent high-severity fire is less than historical percent high-severity fire. For the restored case, the corrected estimates of Landfire’s historical low- and moderate-severity FRs in the 2000–2020 fire-rotation estimates were used as replacements for measured recent FRs, then recent percentages of fire were recalculated by severity, including percent high severity. Fourth, H0: The percentage of high-severity fire reported in Landfire BPS Models for dry forests was not greater than expected under the low-severity fire model versus HA: the percentage of high-severity fire reported in Landfire BPS Models for dry forests was greater than expected under the low-severity fire model, which means the alternative mixed-severity fire model is accepted.
The low-severity fire model has a wide range of FRs for low- and moderate-severity fire, but no high-severity fire at all, as explained in the Hessburg et al. [16] quote in the introduction. The alternative mixed-severity fire model has high-severity fire, but the percentage was not defined. Baker [3] reported that primary historical sources found FRs of 217–849 years for high-severity fires; if the long end at 849 years is combined with a typical 20-year FR for combined low- and moderate-severity fire, that would be ~2% high-severity fire. So, if high severity in a Landfire BPS Model is ≥2% of total fire, the Hessburg et al. [16] criterion of no high-severity fire is exceeded, the low-severity fire model is rejected, and the mixed-severity fire model is accepted.

3. Results

First, some general patterns of recent FRs were found. The recent (2000–2020) high-severity FR was 477 years across the 22.9 million ha of dry forests in the western USA, 639 years across 10.4 million ha of pine forests, and 394 years across 12.5 million ha of dry mixed-conifer forests (Table 2). Among ecoregions, recent high-severity FRs varied from 115 to 640 years across dry forests, from 251 to 753 years across pine forests, and from 107 to 600 years across dry mixed-conifer forests (Table 2). The California Coast ecoregion consistently had the shortest recent high-severity FRs and the Southwest and Northern Mountains had the longest (Table 2).
Second, some general patterns of percent high-severity fire were found. Recent percentages of high-severity fire (Table 2 Column A) averaged 23% across dry forests, that burned from 2000–2020, and varied from 17–37% across ecoregions, with Coastal California having the highest at 37%. Pine forests had lower percentages, averaging 17%, and dry mixed-conifer forests averaged 28% (Table 2). Historical percentages of high-severity fire (Table 2 Column D) averaged 10% across dry forests and varied from 5–15% across ecoregions, averaging 9% in pine forests and 13% in dry mixed-conifer forests. Restored percentages of high-severity fire (Table 2 Column G) were lower, averaging 5% and varying from 4–12% across ecoregions, again highest in the California Coast ecoregion at 12%. Percent deficits in restored recent percent high-severity and historical percent high-severity fire (Table 2 Column H), show that restoring recent percent high-severity fire to historical levels would require a 100% increase or a doubling of high-severity fire overall across dry forests, with variable deficits across ecoregions, except in the California Coast, where there is a surplus of high-severity fire relative to historical (Table 2). The ratio of recent and historical FRs by severity shows the magnitude of deficits. Across dry forests, these deficits are 1.9 times for high, 4.4 times for moderate, and 5.9 times for low severity. My estimates of recent percent high-severity fire, based on MTBS mapping of fire severity, were lower than those of Parks et al. (2023), which were 1.33 to 1.70 times my MTBS-based estimates across the four ecoregions used in the two studies (Table 3).
Regarding the specific hypotheses that were tested, the first hypothesis, that percent high severity in recent fires is higher than historically, was not rejected at the level of dry forests overall (23% vs. 10%; Table 2, Columns A and D). This first hypothesis also was not rejected in pine forests overall (17% vs. 9%) or in dry mixed-conifer forests overall (28% vs. 13%). And this first hypothesis was not rejected in any province overall, in pine forests, or in dry mixed-conifer forests.
The second hypothesis, that recent high-severity FRs across areas that burned from 2000–2020 are shorter than historical high-severity FRs, was rejected at the level of dry forests overall, and the alternative hypothesis was accepted, since the recent high-severity FR was much longer, at 477 years (Table 2, Column A), than the historical FR, at 255 years (Table 2, Column D). This second hypothesis was also rejected, referring again to the same columns in Table 2, at the level of pine forests and dry mixed-conifer forests, and the alternative, that recent high-severity FRs are longer recently than historically, was accepted (Table 2). The same was true at the level of the 14 areas, except in California Coast dry forests overall and their dry mixed-conifer forests, where this second hypothesis was still rejected, as the recent high-severity FR was shorter than historically (Table 2). Some of the comparisons were rejected narrowly, in Northeast dry forests overall and in their pine forests, and in dry mixed-conifer forests in Western Mountains (Table 2).
The third hypothesis, that after restoring low- and moderate-severity fire to historical percentages, recent percent high-severity fire is equal to historical percent high-severity fire, was also rejected and the alternative, that recent percent high-severity fire remains lower than historical percent high-severity fire, was accepted overall across dry forests and across pine and dry mixed-conifer forests. This can be seen by comparing the restored percentage of high-severity fire (Table 2, Column G) to the historical percentage (Table 2, Column D). The same was true in all the 14 areas, except in California Coast dry forests overall and their dry mixed-conifer forests (Table 2). A few were rejected narrowly, particularly Northeast dry forests overall and their pine forests, and in dry mixed-conifer forests of the Western Mountains (Table 2).
The fourth hypothesis, that the percentage of high-severity fire reported in Landfire BPS Models for dry forests was not greater than expected under the low-severity fire model, was rejected, and the alternative hypothesis, that the percentage of high-severity fire reported in Landfire BPS Models for dry forests was greater than expected under the low-severity fire model, was accepted. This is the conclusion, because the 48 Landfire BPS models included in this study were reported (Table S1) to have percent high severities from 4–66%, with an area-weighted mean of 12%, which all reject the low-severity fire model, as it can have only up to 2% high severity. Correcting low- and moderate-severity FRs to more accurate longer rotations increased percent high-severity somewhat, as expected. I did not correct high-severity FRs. Table S1 has the percent high-severity values that show that the low-severity fire model is rejected and the mixed-severity fire model is accepted by all BPS Models across all dry forests.

4. Discussion

4.1. Percent High-Severity Fire Higher Than Historically, but Less High-Severity Burned Area

Parks et al. [4] showed that percent high-severity fire has increased, as also shown here (hypothesis 1), but they did not conduct the tests carried out here that show that high-severity burned area is not higher recently relative to historically (hypothesis 2). It is just that low- to moderate-severity fires have declined more, so the percentage of high-severity fire is higher recently than historically. Here, I showed that high-severity fire is burning recently at FRs that average 477 years overall across dry forests, about 1.9 times longer than the mean historical FR of 255 years from Landfire BPS Models (Table 2). To restore the percentage of high-severity fire to historical levels requires FRs 1.9 times (477 years/255 years) shorter (Table 2) and also more restored lower-severity fire. Also, I showed (hypothesis 3) that if low- to moderate-severity FRs, which have deficits of 4.4 and 5.8 times, respectively, were restored, then recent percent high severity would be 5%, only half of the 10% historically. Recent FRs are deficient for all fire severities, not just high severity, relative to FRs for historical fire severities (Table 2, Columns A–F). Since the largest deficits are in the low-severity (4.4 times) and moderate-severity (5.8 times) components of historical fires, these are more important restoration needs. Since more low- to moderate-severity fire is likely to also have some added high-severity fire, all fire severities could likely be nearly restored by focusing on restoring low- to moderate-severity fires. Hypothesis 1 is supported by both Parks et al. [4] and this study, but results here from testing hypotheses 2 and 3 show that the interpretation and management recommendations of Parks et al. are rejected, as there is recently a deficit, not a surplus, of high-severity burned area across dry forests.
The California Coast ecoregion is an exception, as it is well known to be experiencing exceptional wildfires from both climate change and ignitions by people. This ecoregion was identified earlier [3], based on fire data from 1984–2012, to have fires burning in dry forests at an overall high-severity FR of 212 years, shorter than in other regions analyzed in that study. Now, from 2000–2020, the overall high-severity FR is just 115 years, much shorter than the Landfire historical FR of 305 years (Table 2). This is the only ecoregion where Landfire and other evidence [3] supports substantially reducing high-severity fires to historical levels, if it is even possible.

4.2. Percent High-Severity Fire from Ground-Plots Versus Aerial and Ground Sources

Why might the percent high-severity estimates of Parks et al. [4], which are based on estimates from field plots, be so high (1.33–1.70 times; Table 3) relative to my estimates using government MTBS data? MTBS estimates are based on remote-sensing data, where the canopy is most visible, and are also supplemented by plot data collected on the ground, whereas Parks et al. [4] is calibrated to just estimate the ground-plot data. Saberi et al. ([21] p. 120) provided the explanation. They found that ground-plot estimates of burn severity “…consistently overestimated canopy mortality, as surface burn severity could be greater without translating to severe effects on fire-resistant trees”. This was found to be particularly a problem in dry forests, where fire-resistant trees dominate these forests and where fires with low-severity effects on canopy trees had ground-plot estimates of high-severity effects. This shows that the Parks et al. [4] method of mapping fire severity based on field plots should not be used in dry forests, and likely explains why the findings of Parks et al. are far too high (Table 3).

4.3. Landfire BPS Models Reject the Low-Severity Fire Model across All Dry Forests

Another finding here (hypothesis 4) is that Landfire BPS Models reject the low-severity fire model used as the reference in Hagmann et al. [7], Parks et al. [4], and others, and instead support the mixed-severity fire model reviewed in Baker et al. [11]. Parks et al. explained ([4] p. 4) that “… LANDFIRE models show strong agreement that dry conifer forests were characterized by a predominantly low and mixed severity fire regime and that replacement severity fire was relatively rare historically”. This is an incorrect summary, as there is extensive evidence, often over large land areas [3,22], documenting high-severity fire in historical dry forests [11]. However, both Hagmann et al. [7] and Parks et al. [4] omitted all this evidence, from multiple sources, that documents the widespread occurrence of high-severity fires in historical dry forests, as we showed in detail for Hagmann et al. [7] in Baker et al. [11]. Moreover, Parks et al. [4] could also have seen that none of the 48 Landfire BPS Models used in this study or in Parks et al. [4] met the low-severity fire regime, defined in Hessburg et al. [16], in which dry forests historically had no high-severity fire. The 48 Landfire Models have 4–66% historical high-severity fire (Table S1), averaging 12%. Landfire BPS Models are now added to the large body of evidence that demonstrates that the historical low-severity fire model is not supported in dry forests. The study by Parks et al. [4] is added to the studies [11] that omitted the extensive published primary evidence and Landfire data that both reject the low-severity fire model.
Landfire BPS Models do reject the low-severity fire model (hypothesis 4), but are based first on expert opinions, not primary scientific sources, and are not up-to-date for dry forests. For example, Baker et al. [11] reported FRs and percent fire severities from General Land Office (GLO) land-survey reconstructions for 15 dry-forest landscapes covering >2.5 million ha (~10%) of the 25.5 million ha of dry forests [3]. Reconstructed historical percent high-severity fire in dry forests from GLO reconstructions ranged from 2.5% to 71.3%, with an area-weighted mean of 32.7%. This is similar to the range of 4% to 66% across Landfire BPS Models, but higher than its area-weighted mean of only 12%, suggesting that Landfire underestimates the percentage of historical high-severity fire. This is enough to show that Landfire BPS Models need to be updated and have each estimate linked to its source, so that evidence can be regularly added. Comprehensive analysis of all scientific sources relative to recent and historical fire is beyond the scope of this study, but is the responsibility of federal agencies, including Landfire, in meeting the National Environmental Policy Act. Nonetheless, Landfire BPS Model estimates agree with a large body of other evidence [11] that the low-severity fire model [16] used by Hagmann et al. [7] and Parks et al. [4] is rejected for all dry forests, and the mixed-severity fire model [11] is accepted by these sources for all dry forests.

4.4. Management Implications

What do these findings mean regarding the management recommendations of Hagmann et al. [7] and Parks et al. [4] for wildfires in dry forests? Both presented evidence that a primary management necessity is to reduce high-severity fires in dry forests. Parks et al. ([4] p. 9) said that “…the only viable solution for restoring dry conifer forests to conditions resistant to stand-replacing fire is by reducing fuels, tree density, and overall biomass across these landscapes”. Parks et al. also warned that increased high-severity fire means more forest “type-conversion” to non-forest, increased erosion, reduced stored carbon, altered wildlife habitat, and more threats to the built environment and human safety. However, these two studies are incorrect, as both omitted the large body of published scientific evidence (e.g., [11]) and Landfire BPS Models that show historical dry forests had substantial high-severity fire. Both studies also are based on the low-severity fire model, which the 48 Landfire BPS models also reject. This study showed that high-severity fires in dry forests are very deficient, based on the government’s own Landfire data, so none of the recommendations of Hagmann et al. [7] or Parks et al. [4] is valid.
Landfire data analyzed here show that every fuel reduction (e.g., thinning) that successfully reduces high-severity fire, is actually fire suppression, widely and long known to be ecologically damaging [13,23]. Negative ecological impacts include suppression of the creation of heterogeneous fire patches and non-forested openings, that provide habitat for a rich diversity of fire-adapted species that favor burned areas, snag patches, and non-forested openings (e.g., grasslands, shrublands). Landscape heterogeneity, which affects future disturbances, landscape processes, and landscape-scale habitat, is also reduced. These limit selection pressures for species to adapt to hotter emerging post-fire climates.
The Hagmann et al. [7] and Parks et al. [4] proposals to suppress high-severity fires are not new; they have long been implemented by federal agencies spending billions of dollars each year, which are shown here by their own federal Landfire data to be forms of fire suppression. The finding here that fires are less severe recently than historically refutes the theory that fire suppression is leading to more severe fires, that must be suppressed, in dry forests. This theory is the “wildfire paradox,” that the more effective fire suppression is, the more severe future fires will be [24]. However, fire suppression did not lead to more severe fires, but is instead likely simply why recent FRs are longer than historical FRs for all fire severities, including high-severity fires. Federal agencies following the recommendations of Parks et al. [4] and Hagmann et al. [7] are thus not reducing excessive high-severity fires, but are instead ecologically damaging public forests with ongoing fire suppression. This is also not restoring and adapting forests to fires or climate change. Restoration is not occurring because the historical landscape-scale process that creates burned habitat and landscape heterogeneity is being suppressed, not restored. Adaptation is being reduced because species that survive and flourish after fires are receiving insufficient selection from fires and hotter post-fire environments at this key time of climate change [25].
The analyses here show that very different management is warranted, if the management goal is to ecologically restore, sustain, and adapt dry forests to climate change. First, it is essential that Landfire be updated regularly to incorporate all available evidence about historical forests and fires, with each estimate linked to its specific source, so that Landfire, and management based on Landfire, incorporate the best available science. Second, if the goal is to restore, sustain, and adapt forests to climate change, then fuel reduction and suppression of all severities of fires need to be stopped as much and as soon as possible. If the management goal is to restore, sustain, and adapt dry forests using historical evidence as a guide, then the extensive evidence from primary sources [11] and Landfire expert opinions, used together here, strongly show that a mixture of fire-severities, including high-severity fires, shaped historical dry-forest landscapes, and warrant restoration.
The historical low-severity fire model is rejected and the mixed-severity fire model is accepted by extensive primary sources [11] and all of the Landfire BPS Models used here. These sources of evidence show that it is important to restore all fire severities. I suggest that this can best be achieved by focusing restoration on low- and moderate-severity fire, and welcoming, not suppressing, the high-severity fire that also occurs. Restoration of dry forests and their fires could be achieved in 30–40 years by using a comparatively low-cost nature-based approach, which is to enable wildfires and other natural disturbances to occur more widely [25]. To achieve this, it is essential that the billions of dollars of public funding being mis-spent each year on reducing high-severity fires in dry forests, which is shown here to be fire suppression, be redirected to where fuel reduction is needed to protect the built environment, which will also enable more use of wildfires nearby [25]. It is in and very near the built environment where the public must learn to live with fire nearby [26,27]. For example, in California where recent high-severity fire rates have exceeded historical rates (Table 2), reducing human-caused ignitions (e.g., falling powerlines) and the exposure of housing are among important methods for eliminating damaging fires [28] while enabling more natural wildfires nearby [25]. Of course, it is essential to monitor rates and patterns of fires as the climate changes and to adjust policies.
There is public interest globally in restoring, sustaining, and adapting native primary forests to climate change, given their value in storing carbon and providing many other ecosystem services [29]. A key finding here is that it is important to base modern management on the best available scientific evidence about historical (preindustrial) primary forests and fires [30,31]. Regarding fire, it is also important to avoid the use of percent high-severity historical fire, as was used in Parks et al. [4], which is shown here to be inherently ambiguous by itself. It is also important to use FR, the best measure of rates of fires [15], since FR measures the highly variable areas of fires and avoids earlier measures of rates of fire (e.g., mean fire-return intervals, composite fire intervals) that simply counted fires in small plots without measuring fire areas [15]. There is also considerable global concern about managing natural disturbances, particularly wildfires, in primary and native dry forests [32,33,34,35]. Disturbances are recognized as essential natural processes in forests. As shown here, dry forests historically experienced episodic high-severity fires and can recover from these fires [36,37], in many cases better than they can recover from high-severity logging [36]. Natural disturbances can nonetheless be potentially dangerous for people and the built environment. This built environment, not forests, is where wildland–urban interface fire problems can be solved [26,27,28]. Solving this problem would allow more fires with a mixture of severities, as occurred historically, to burn safely across dry forest landscapes, fostering both safe and sustainable dry forests and human communities [25,26,27].

5. Conclusions

Comparing recent fire-severity data and Landfire historical fire-severity data showed that there is a recent deficit of high-severity fire, not a surplus, and even larger deficits of low- and moderate-severity fire across dry forests. Landfire data show that dry forests were historically characterized by a mixture of fire severities, including substantial high-severity fire, not just low- and moderate-severity fires. From 2000–2020, there was a higher percentage of high-severity fire than historically, as found previously and here. However, area burned at high severity has not increased recently relative to area burned at high severity in historical dry forests. Instead, it is simply a greater recent deficit of low- and moderate-severity fire that has artificially elevated the recent percentage of high-severity fire. And it was found that simply restoring low- and moderate-severity fire to historical rates also restores the percentage of high-severity fire to below its historical rate. These findings mean that continuing or accelerating fuel reductions to reduce high-severity fire in dry forests is fire suppression. This is degrading, not restoring, sustaining, and adapting dry forests to future fire and climate change, which primarily need increased low- and moderate-severity fire, not less high-severity fire. Fires of all severities are needed to provide diverse selection pressures and post-fire settings to encourage diverse adaptations as climate changes. A nature-based solution, which harnesses fire and other natural disturbances of all severities, rather than suppressing them, would be consistent with Landfire historical fire data, and be faster and more effective at restoring and adapting dry forests to future fire and climate change. This would be feasible if government funding was redirected from ecologically damaging fire suppression in forests to more fully protecting the built environment.

Supplementary Materials

The following supporting information can be downloaded at: https://www.mdpi.com/article/10.3390/su16083270/s1, Table S1. Corrected Landfire BPS models used in this study; Table S2. Historical fire rotations (FR) of high-severity fires in dry forests defined by this paper and by Parks et al. [4].

Funding

This research received no external funding.

Institutional Review Board Statement

Not applicable.

Informed Consent Statement

Not applicable.

Data Availability Statement

All data used in the analysis are from public sources listed in Table 1.

Acknowledgments

I appreciate the comments of the three reviewers and the academic editor, which significantly improved this paper.

Conflicts of Interest

The author declares no conflicts of interest.

References

  1. Parks, S.A.; Abatzoglou, J.T. Warmer and drier fire seasons contribute to increases in area burned at high severity in western US forests From 1985 to 2017. Geophys. Res. Lett. 2020, 47, e2020GL089858. [Google Scholar] [CrossRef]
  2. Abatzoglou, J.T.; Battisti, D.S.; Williams, A.P.; Hansen, W.D.; Harvey, B.J.; Kolden, C.A. Projected increases in western US forest fire despite growing fuel constraints. Commun. Earth Environ. 2021, 2, 227. [Google Scholar] [CrossRef]
  3. Baker, W.L. Are high-severity fires burning at much higher rates recently than historically in dry-forest landscapes of the Western USA? PLoS ONE 2015, 10, e0136147. [Google Scholar]
  4. Parks, S.A.; Holsinger, L.M.; Blankenship, K.; Dillon, G.K.; Goeking, S.A.; Swaty, R. Contemporary wildfires are more severe compared to the historical reference period in western US dry forests. For. Ecol. Manag. 2023, 544, 121232. [Google Scholar] [CrossRef]
  5. Hessburg, P.F.; Prichard, S.J.; Hagmann, R.K.; Povak, N.A.; Lake, F.K. Wildfire and climate change adaptation of western North American forests: A case for intentional management. Ecol. Appl. 2021, 31, e02432. [Google Scholar] [CrossRef] [PubMed]
  6. Prichard, S.J.; Hessburg, P.F.; Hagmann, R.K.; Povak, N.A.; Dobrowski, S.Z.; Hurteau, M.D.; Kane, V.R.; Keane, R.E.; Kobziar, L.N.; Kolden, C.A.; et al. Adapting western North American forests to climate change and wildfires: 10 common questions. Ecol. Appl. 2021, 31, e02433. [Google Scholar] [CrossRef] [PubMed]
  7. Hagmann, R.K.; Hessburg, P.F.; Prichard, S.J.; Povak, N.A.; Brown, P.M.; Fulé, P.Z.; Keane, R.E.; Knapp, E.E.; Lydersen, J.M.; Metlen, K.L.; et al. Evidence for widespread changes in the structure, composition, and fire regimes of western North American forests. Ecol. Appl. 2021, 31, e02431. [Google Scholar] [CrossRef] [PubMed]
  8. Mallek, C.; Safford, H.; Viers, H.J.; Miller, J. Modern departures in fire severity and area vary by forest type, Sierra Nevada and southern Cascades, California, USA. Ecosphere 2013, 4, 1–28. [Google Scholar] [CrossRef]
  9. Reilly, M.J.; Dunn, C.J.; Meigs, G.W.; Spies, T.A.; Kennedy, R.E.; Bailey, J.D.; Briggs, K. Contemporary patterns of fire extent and severity in forests of the Pacific Northwest, USA (1985–2010). Ecosphere 2017, 8, e01695. [Google Scholar] [CrossRef]
  10. Haugo, R.D.; Kellogg, B.S.; Cansler, C.A.; Kolden, C.A.; Kemp, K.B.; Robertson, J.C.; Metlen, K.L.; Vaillant, N.M.; Restaino, C.M. The missing fire: Quantifying human exclusion of wildfire in Pacific Northwest forests, USA. Ecosphere 2019, 10, e02702. [Google Scholar] [CrossRef]
  11. Baker, W.L.; Hanson, C.T.; Williams, M.A.; DellaSala, D.A. Countering omitted evidence of variable historical forests and fire regime in western USA dry forests: The low-severity-fire model rejected. Fire 2023, 6, 146. [Google Scholar] [CrossRef]
  12. Baker, W.L. Tree-regeneration decline and type-conversion after high-severity fires will likely cause little western USA forest loss from climate change. Climate 2023, 11, 214. [Google Scholar] [CrossRef]
  13. Donovan, G.H.; Brown, T.C. Be careful what you wish for: The legacy of Smokey Bear. Front. Ecol. Environ. 2007, 5, 73–79. [Google Scholar] [CrossRef]
  14. Blankenship, K.; Swaty, R.; Hall, K.R.; Hagen, S.; Pohl, K.; Shlisky Hunt, A.; Patton, J.; Frid, L.; Smith, J. Vegetation dynamics models: A comprehensive set for natural resource assessment and planning in the United States. Ecosphere 2021, 12, e03484. [Google Scholar] [CrossRef]
  15. Baker, W.L. Restoring and managing low-severity fire in dry-forest landscapes of the western USA. PLoS ONE 2017, 12, e0172288. [Google Scholar] [CrossRef] [PubMed]
  16. Hessburg, P.F.; Agee, J.K.; Franklin, J.F. Dry forests and wildland fires of the inland Northwest USA: Contrasting the landscape ecology of the pre-settlement and modem eras. For. Ecol. Manag. 2005, 211, 117–139. [Google Scholar] [CrossRef]
  17. Agee, J.K. Fire Ecology of Pacific Northwest Forests; Island Press: Washington, DC, USA, 1993. [Google Scholar]
  18. Davis, K.T.; Higuera, P.E.; Dobrowski, S.Z.; Parks, S.A.; Abatzoglou, J.T.; Rother, M.T.; Veblen, T.T. Fire-catalyzed vegetation shifts in ponderosa pine and Douglas-fir forests of the western United States. Environ. Res. Lett. 2020, 15, 1040b8. [Google Scholar] [CrossRef]
  19. Kolden, C.A.; Smith, A.M.S.; Abatzoglou, J.T. Limitations and utilization of Monitoring Trends in Burn Severity products for assessing wildfire severity in the USA. Int. J. Wildland Fire 2015, 24, 1023–1028. [Google Scholar] [CrossRef]
  20. Parks, S.A.; Holsinger, L.M.; Voss, R.A.; Loehman, N.P.; Robinson, N.P. Mean composite fire severity metrics computed with Google Earth Engine offer improved accuracy and expanded mapping potential. Rem. Sens. 2018, 10, 879. [Google Scholar] [CrossRef]
  21. Saberi, S.J.; Agne, M.C.; Harvey, B.J. Do you CBI what I see? The relationship between the Composite Burn Index and quantitative field measures of burn severity varies across gradients of forest structure. Int. J. Wildland Fire 2022, 31, 112–123. [Google Scholar] [CrossRef]
  22. Hessburg, P.F.; Salter, R.B.; James, K.M. Re-examining fire severity relations in pre-management era mixed conifer forests: Inferences from landscape patterns of forest structure. Landsc. Ecol. 2007, 22, 5–24. [Google Scholar] [CrossRef]
  23. DellaSala, D.A.; Baker, B.C.; Hanson, C.T.; Ruediger, L.; Baker, W.L. Have western USA fire suppression and megafire active management approaches become a contemporary Sisyphus? Biol. Cons. 2022, 268, 109499. [Google Scholar] [CrossRef]
  24. Hai, J.; Zhang, L.; Gao, C.; Wang, H.; Wu, J. How does fire suppression alter the wildfire regime? A systematic review. Fire 2023, 6, 424. [Google Scholar] [CrossRef]
  25. Baker, W.L.; Hanson, C.T.; Williams, M.A.; DellaSala, D.A. Harnessing natural disturbances: A Nature-Based Solution for restoring and adapting dry forests in the western USA to climate change. Fire 2023, 6, 428. [Google Scholar] [CrossRef]
  26. Calkin, D.E.; Barrett, K.; Cohen, J.D.; Finney, M.A.; Pyne, S.J.; Quarles, S.L. Wildland-urban fire disasters aren’t actually a wildfire problem. Proc. Nat. Acad. Sci. USA 2023, 120, e2315797120. [Google Scholar] [CrossRef] [PubMed]
  27. Moritz, M.A.; Batllori, E.; Bradstock, R.A.; Gill, A.M.; Handmer, J.; Hessburg, P.F.; Leonard, J.; McCaffrey, S.; Odion, D.C.; Schoennagel, T.; et al. Learning to coexist with wildfire. Nature 2014, 515, 55–66. [Google Scholar] [CrossRef] [PubMed]
  28. Syphard, A.D.; Keeley, J.E.; Gough, M.; Lazarz, M.; Rogan, J. What makes wildfires destructive in California? Fire 2022, 5, 133. [Google Scholar] [CrossRef]
  29. Morales-Hidalgo, D.; Oswalt, S.N.; Samanathan, E. Status and trends in global primary forest, protected areas, and areas designated for conservation of biodiversity from the Global Forest Resources Assessment 2015. For. Ecol. Manag. 2015, 352, 68–77. [Google Scholar] [CrossRef]
  30. Pooley, S. Descent with modification: Critical use of historical evidence for conservation. Cons. Lett. 2018, 11, e12437. [Google Scholar] [CrossRef]
  31. Landres, P.B.; Morgan, P.; Swanson, F.J. Overview of the use of natural variability concepts in managing ecological systems. Ecol. Appl. 1999, 9, 1179–1188. [Google Scholar]
  32. Riva, M.J.; Liniger, H.; Valdecantos, A.; Schwilch, G. Impacts of land management on the resilience of Mediterranean dry forests to fire. Sustainability 2016, 8, 981. [Google Scholar] [CrossRef]
  33. Peinetti, H.R.; Bestelmeyer, B.T.; Chirino, C.C.; Vivalda, F.L.; Kin, A.G. Thresholds and alternative states in a Neotropical dry forest in response to fire severity. Ecol. Appl. 2024, 34, e2937. [Google Scholar] [CrossRef] [PubMed]
  34. Madrigal-González, J.; Herrero, A.; Ruiz-Benito, P.; Zavala, M.A. Resilience to drought in a dry forest: Insights from demographic rates. For. Ecol. Manag. 2017, 389, 167–175. [Google Scholar] [CrossRef]
  35. Trotsiuk, V.; Svoboda, M.; Janda, P.; Mikolas, M.; Bace, R.; Rejzek, J.; Samonil, P.; Chaskovskyy, O.; Korol, M.; Myklush, S. A mixed severity disturbance regime in the primary Picea abies (L.) Karst. Forests of the Ukrainian Carpathians. For. Ecol. Manag. 2014, 334, 144–153. [Google Scholar] [CrossRef]
  36. Albrich, K.; Thom, D.; Rammer, W.; Seidl, R. The long way back: Development of central European mountain forests toward old-growth conditions after cessation of management. J. Veg. Sci. 2021, 32, e13052. [Google Scholar] [CrossRef]
  37. Martin, M.; Grondin, P.; Lambert, M.-C.; Morin, H. Compared to wildfire, management practices reduced old-growth forest diversity and functionality in primary boreal landscapes of eastern Canada. Front. For. Glob. Chang. 2021, 4, 639397. [Google Scholar] [CrossRef]
Figure 1. The result of a mixed-severity fire in a dry forest in northern New Mexico, showing patches of A. low-severity, B. moderate-severity, C. high-severity, and D. stand-replacing fire. I roughly estimated tree mortality and severities from the photo. W.L. Baker photo.
Sustainability 16 03270 g001
Figure 2. The workflow of this research.
Sustainability 16 03270 g002
Figure 3. The study area in the 11 western states (dotted lines) and the 5 ecoregions (dark black), showing pine and dry mixed-conifer forests. High-severity FRs, in years, are given beside each ecoregion; R = recent and H = historical. The white areas contain many other types of vegetation.
Sustainability 16 03270 g003
Table 1. Sources of data used in analysis.
DatasetSourceAccessed
Recent fire severityhttps://www.mtbs.gov15 July 2023
Terrestrial ecoregionshttp://www.landscope.org/map_descriptions/ecosystems/tnc_ecoregional_boundaries/15602/14 July 2023
Historical fire severity and location of dry forestshttps://landfire.gov/version_download.php#20 July 2023
Table 2. Rates (FR = fire rotation) and percentages of fires by severity, which include pine forests and dry mixed-conifer forests, recently (2000–2020) and historically (pre-industrial). Data are only for pixels burned from 2000–2020. The Restore column shows G: generally lower recent percent high severity if just historical moderate and low-severity FRs were restored, and H: The percent increase in high-severity fire needed to fully restore percent high severity to historical levels.
Ecoregion (ER) 1Ecoregion Area (ha)Recent (MTBS) SeverityHistorical (Landfire) Severity2000–2021
Burned
Area (ha)
Restore
A. HighB. Mod 2C. Low 2D. HighE. Mod 2F. Low 2G. High
(%) 3
H. Incr.
(%)
FR%FR%FR%FR%FR%FR%
DRY FORESTS OVERALL
ERs except Northeast22,945,32847723368302374725510833041603,486,6985100
California Coast651,586115371373213931305559262269280,63612−58
Western Mountains5,494,97336527293332414023410114213469956,617743
Northern Mountains9,783,865597244563131445269151392868571,140,8597114
Southwest7,014,90464017405261845730971851329801,108,586475
Northeast902,416380222064021938345684232871176,458520
PINE FORESTS
ERs except Northeast10,439,37663917397282025529791821434771,465,4324125
California Coast73,488251402873539225172109118237214,034743
Western Mountains2,875,90653724379343004219615169184567351,6686150
Northern Mountains1,966,2835852038230228503329117244267229,178580
Southwest5,523,6997531341425166623376205112683870,5523100
Northeast902,416380222064021938345684232871176,458520
DRY MIXED-CONIFER FORESTS
All ERs12,505,952394283483227740218131072748602,021,266863
California Coast578,098107381283213430306559262269266,60213−62
Western Mountains2,619,067270282343319839257781242869604,94970
Northern Mountains7,817,58260025480313474421421158299150911,6819133
Southwest1,491,20541129375322993920712113233965238,034771
1 “ERs” sum up just the four ecoregions that were used in [4], omitting the Northeast. 2 Moderate- and low-severity historical FRs from Landfire BPS Models were corrected here. See text for details. 3 Column G (Restore) recalculates Column A (Recent High Severity %) after replacing FRs in Columns B and C with FRs in E and F to simulate restoring low and moderate severity to historical levels.
Table 3. Recent percent high-severity fire found in this study and Parks et al. [4].
EcoregionParks et al. [4] %This Study %Ratio
California Coast56371.51
Western Mountains46271.70
Northern Mountains32241.33
Southwest25171.47
Disclaimer/Publisher’s Note: The statements, opinions and data contained in all publications are solely those of the individual author(s) and contributor(s) and not of MDPI and/or the editor(s). MDPI and/or the editor(s) disclaim responsibility for any injury to people or property resulting from any ideas, methods, instructions or products referred to in the content.

