1. Introduction
Environmental behavior is influenced by a multitude of factors, among which are the design and management of urban spaces. Gaining an understanding of how dynamic indicators linked to urban spaces affect residents’ pro-environmental behavior is essential for fostering sustainability [
1,
2,
3]. A hybrid approach incorporating geographical mapping and field observations has been employed to explore the relationship between these indicators and environmental behaviors [
4,
5,
6]. With urbanization posing significant environmental challenges, investigating the connection between urban spaces and environmental behavior is vital [
1,
2,
3]. This introduction focuses on dynamic indicators in urban spaces and their potential to inform sustainable urban design, particularly in Shanghai—a rapidly evolving metropolis that is facing environmental issues [
4,
5,
6,
7]. Creating urban environments that encourage sustainable practices can mitigate the negative effects of urbanization and enhance the wellbeing of residents [
8,
9,
10,
11]. These indicators provide valuable insights that can inform urban planning and design interventions. By understanding how dynamic factors associated with urban spaces influence residents’ environmental behavior, urban planners and designers can incorporate this knowledge into their decision-making processes. This includes considerations such as optimizing green spaces, improving accessibility to sustainable transportation options, implementing effective waste management systems and designing buildings with energy efficiency in mind [
12,
13,
14]. Shanghai’s local government recognizes the importance of addressing environmental challenges and aims to establish an “eco-city” that fosters sustainable practices. However, progress has been slow, necessitating increased public awareness and engagement [
15,
16,
17]. To address these issues, a mixed-methods study is necessary to comprehensively understand the complex interactions between the built environment, individual behaviors, and environmental outcomes [
18,
19,
20,
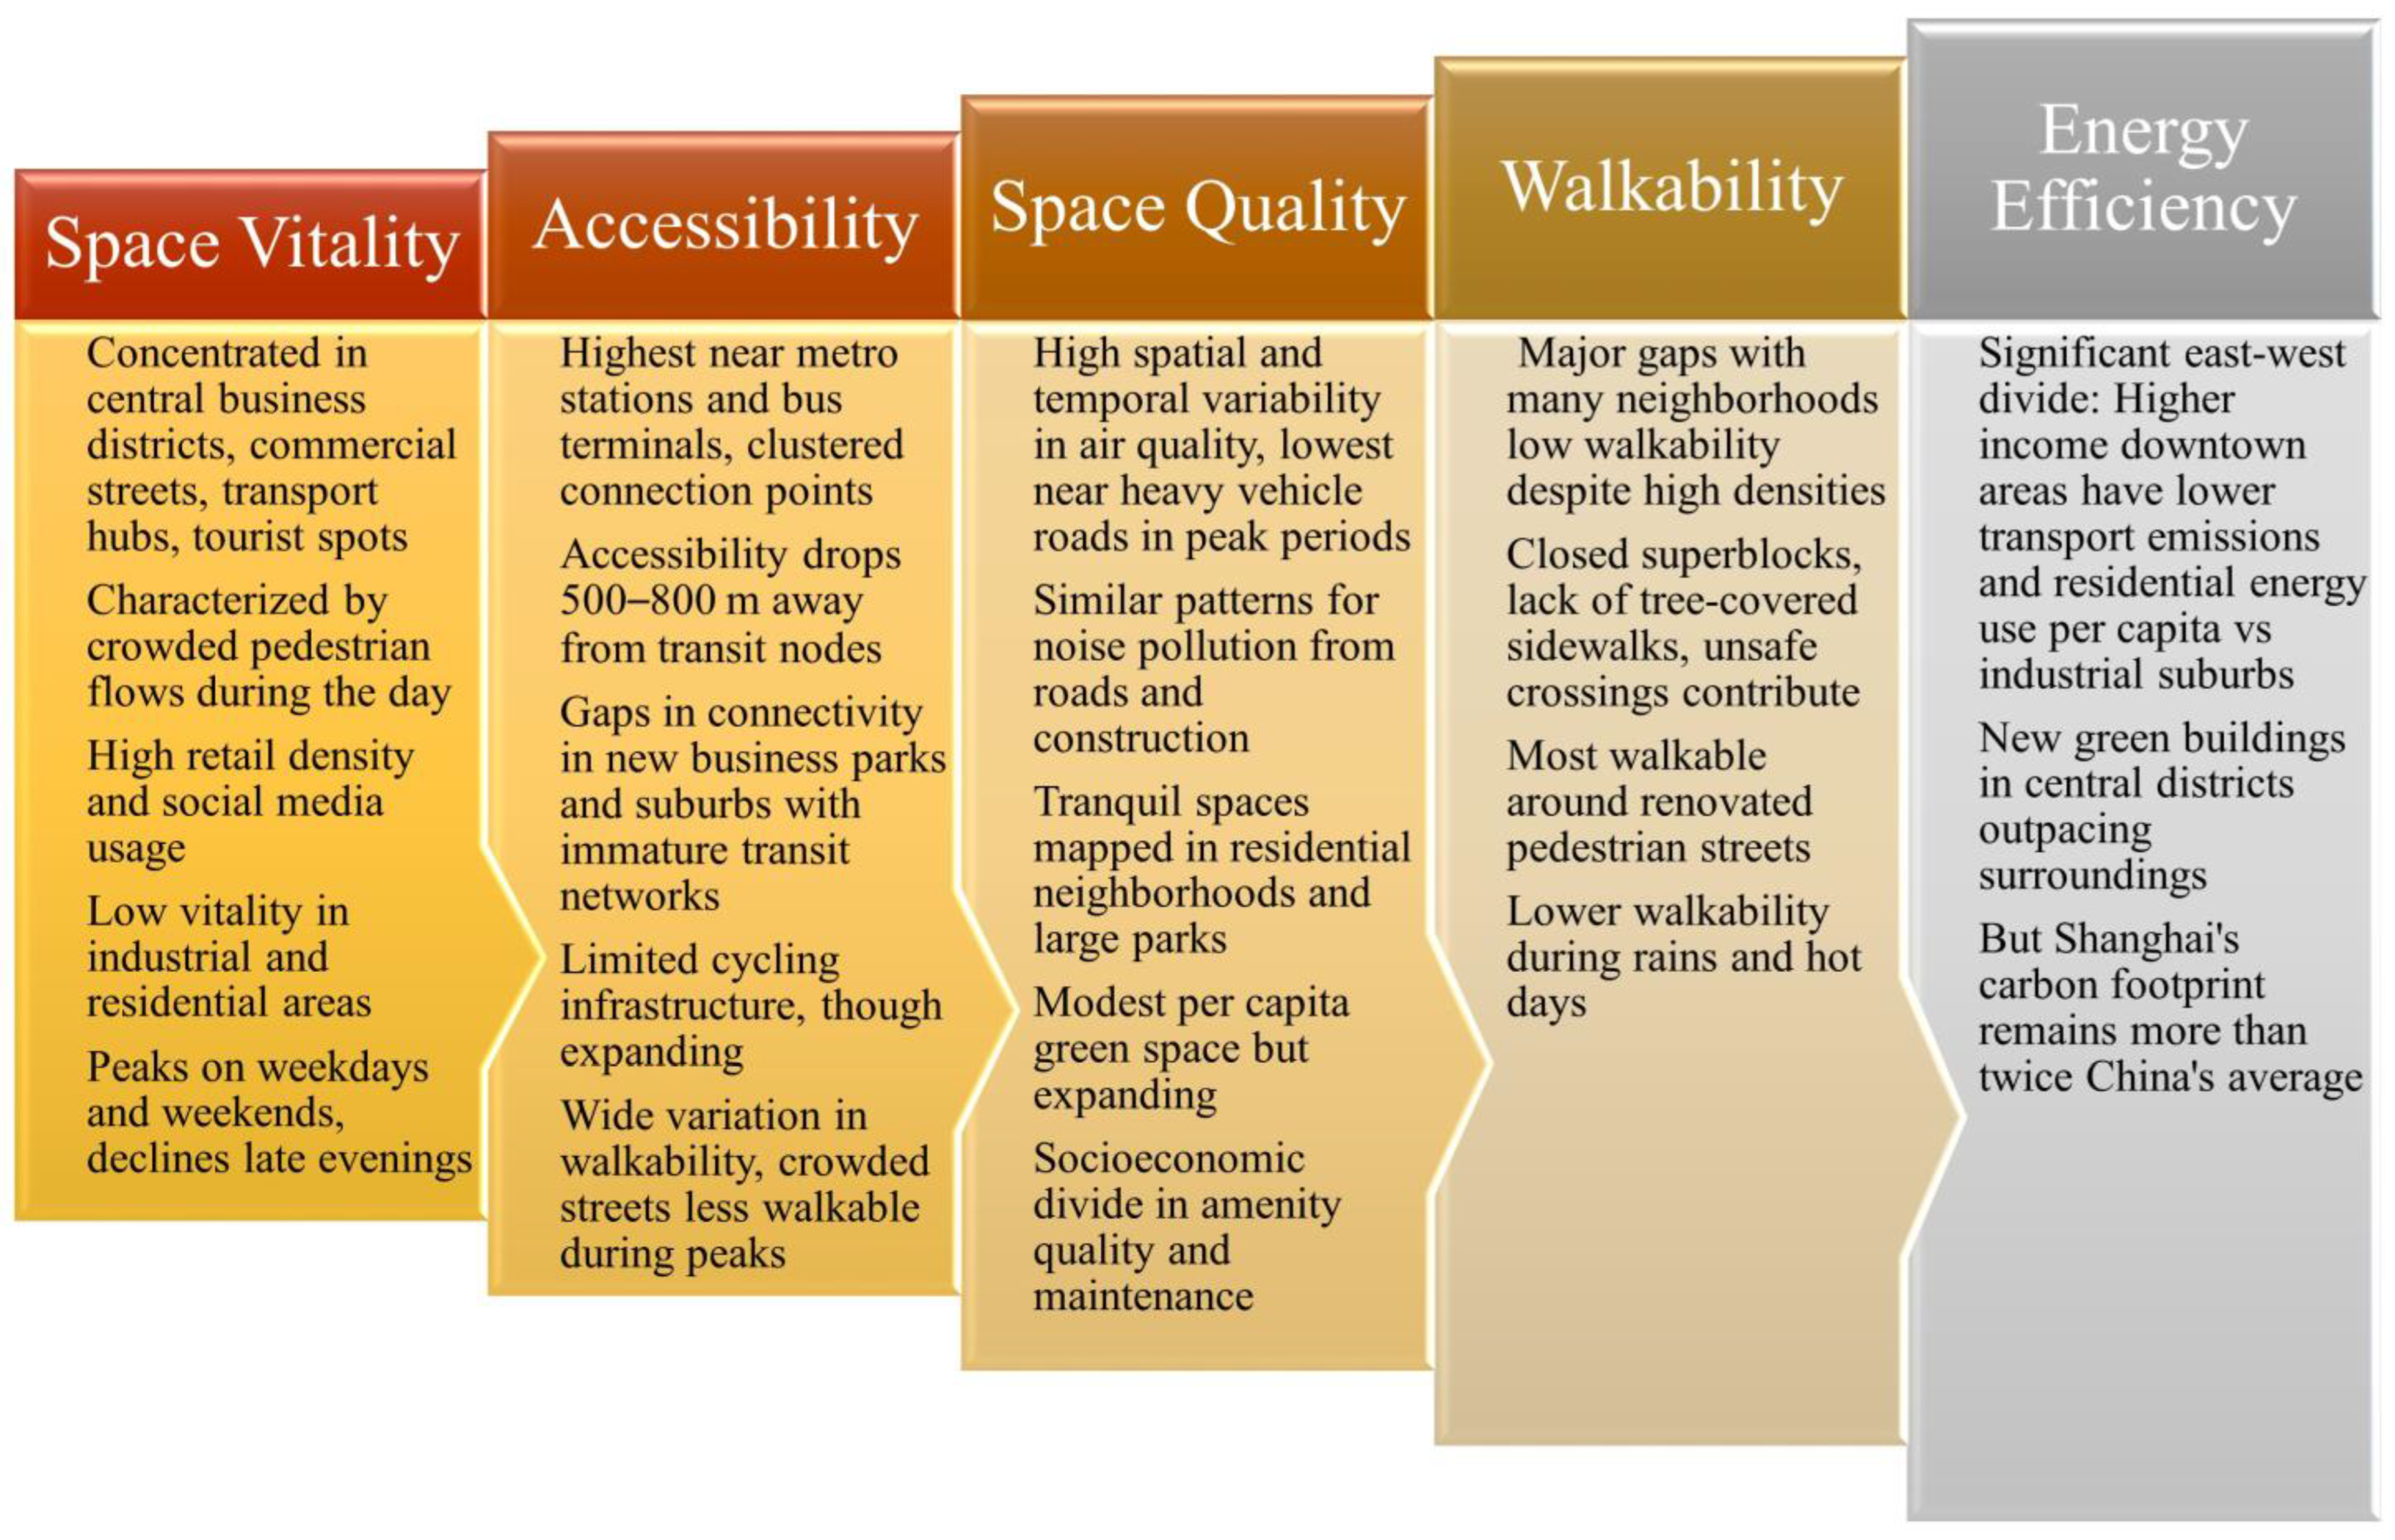
21]. Numerous studies have demonstrated spatial variations in the levels of air and noise pollution, with higher concentrations observed near heavy vehicle roads and construction sites. Residential neighborhoods and parks have been recognized as relatively tranquil spaces. Evaluations of walkability indicate a general lack of pedestrian-friendly infrastructure, mainly attributed to closed superblocks and unsafe road crossings. Nevertheless, the revitalization of pedestrian shopping streets has yielded positive outcomes, enhancing walkability conditions. Energy efficiency patterns demonstrate an east–west divide, with downtown areas displaying lower transportation emissions and residential electricity consumption in comparison to industrial suburbs. Despite these efforts, Shanghai’s per capita carbon footprint remains significantly higher than the national average [
22,
23,
24,
25]. The findings contribute to Shanghai’s environmental sustainability goals by providing insights into how everyday spaces can be transformed to promote eco-friendly lifestyles. Given Shanghai’s status as one of the largest and fastest-changing cities globally, lessons learned from this case study can shape sustainable urban development efforts in Asia and Europe. The research supports policymakers and urban planners in making informed decisions regarding the design and management of urban spaces by identifying specific dynamic indicators that influence residents’ environmental behaviors [
26,
27,
28,
29]. The ultimate objective is to create more sustainable and environmentally conscious urban environments and to address the escalating environmental challenges faced by cities worldwide, such as rapid urbanization, waste management, pollution control, and climate change mitigation. The primary innovation of this study lies in its adoption of a mixed-method approach that integrates predictive algorithms and models, reduces costs and incorporates primary and secondary variables in urban planning and environmental sciences. By employing an artificial neural network (ANN) with a hidden layer, the study develops a predictive model with which to assess the quality and walkability of an area and environmental behaviors based on the input variables of vitality and accessibility. The network’s performance is evaluated using linear regression analysis to assess its error, and the study presents and evaluates the predicted outcomes obtained from the ANN. Notably, the article’s primary scientific contribution lies in its examination of the reciprocal relationship between dynamic indicators in urban spaces and residents’ environmental behaviors, with a particular focus on Shanghai. Through the integration of mixed methods and ANN, this study provides valuable insights into how these dynamic indicators influence individuals’ pro-environmental attitudes and behaviors.
3. Research Methodology
3.1. Study Area
Shanghai spans an expansive area of over 6300 km2 and encompasses a densely populated urban core surrounded by suburban districts and satellite towns. The focus of this study is specifically on Shanghai’s inner ring, which consists of the nine central districts. Renowned for its historical significance and current stature as a financial center, this region has witnessed substantial redevelopment in recent years, resulting in a distinct cityscape characterized by towering office buildings, residential high-rises, vibrant commercial streets, civic plazas, and repurposed industrial zones. The inner ring encompasses a diverse array of neighborhoods with varying socio-economic backgrounds and demographic profiles. By deliberately selecting a concentrated study area, this research offers the opportunity for in-depth analyses of multiple urban spaces. This study focuses specifically on the inner ring of Shanghai, comprising nine central districts within the inner-city area. As of 2020, the population residing in these inner-city districts amounted to approximately 12.5 million, while the total population of Shanghai municipality was around 26.3 million. Consequently, the population living in the inner ring districts represents approximately 47% of the municipality’s total population. These inner ring districts form the densely populated and highly urbanized core of Shanghai, with notable districts such as Huangpu and Xuhui boasting populations exceeding 1 million each. In summary, while the sizes and populations of individual districts may vary, the inner ring districts studied here constitute the largest contiguous urban/metro area of Shanghai, accommodating a significant proportion (approximately half) of the city’s residents at remarkably high population densities.
3.2. Data Collection
This research adopts a mixed-methods methodology that combines spatial mapping and field observations. A diverse range of data sources was utilized to calculate the five categories of dynamic indicators and establish connections with observed environmental behaviors. Government Geographic Information System (GIS) databases and map services are the sources for spatial data, including land use, transportation networks, building morphology, and population distribution. Location-based social network data provide spatiotemporal insights into human activity and mobility patterns throughout the city [
47,
48,
49]. Additionally, field observations were conducted in a selected sample of public spaces to document varying levels of usage, modes of travel, waste generation behaviors, and other pertinent environmental indicators at different times of the day [
50,
51,
52]. The study objectives were achieved through the utilization of dynamic indicators, specifically two input variables (vitality and accessibility) and three output variables (quality, walkability, and environmental behaviors), identified based on an extensive literature review. Data collection involved field surveys and measurements to obtain vitality and accessibility data, as well as observations, surveys, and documented records for the output variables [
26,
27,
28,
29,
30,
31,
32,
33,
34,
35,
36,
37,
38,
39,
40,
41,
42,
43,
44,
45,
46,
47,
48,
49,
50,
51]. An ANN modeling technique was employed, using the collected data as the training dataset, to predict and optimize the best conditions for the selected topic. The ANN model’s accuracy and performance were assessed by comparing predicted values with observed values. Additionally, a mixed-methods approach was implemented, incorporating qualitative data collection through interviews, focus groups, and expert consultations. Thematic analysis techniques were applied to the qualitative data to gain deeper insights into the factors influencing environmental behavior in urban spaces and enhance the interpretation of the quantitative findings.
3.3. Geospatial Mapping and Analysis
In this study, we utilized geographic information systems (GIS) to accurately map and analyze the spatial patterns and variations of five dynamic indicators in the city of Shanghai. The GIS incorporated multiple data layers that encompassed different aspects of the indicators. These layers included spatial vitality indicators, such as pedestrian flows, points of interest (POIs) related to commercial and service activities, and social media survey data. Access indicators were represented through transportation networks, bicycle lanes, and pedestrian infrastructure available in various municipal regions. Space quality indicators encompassed measurements of green spaces, air quality, and noise levels. Walkability indicators were assessed by evaluating sidewalk coverage, intersection density, and pedestrian infrastructure. Furthermore, energy efficiency indicators were derived from estimates of building energy consumption and transportation emissions. Additionally, the data collected from respondents, including their home and work locations, were geocoded for spatial analysis and are summarized in
Table 1,
Table 2 and
Table 3. Various spatial analysis techniques, such as hotspot mapping, spatial clustering, and network analysis, were employed to identify relationships between the dynamic indicators across the study area and the environmental behaviors reported in the surveys. These techniques provided a comprehensive understanding of the connections and interactions between the dynamic indicators and environmental behaviors, enabling the identification of spatial patterns and trends.
To analyze the spatial patterns and variations of the five dynamic indicators, GISs were utilized, incorporating specific data layers. These included pedestrian flow data obtained from automatic people counters installed at major commercial streets in Shanghai, capturing space vitality. POI data related to commercial and service activities were acquired from Amap, a leading digital map provider in China. Social media check-in data from Sina Weibo, covering the period of 2010–2020, were obtained through an approved academic data request. Transit networks, including subway and bus route network layers, were downloaded from the Shanghai Municipal Data Exchange platform. Shanghai’s open dataset on protected bike lanes was used to analyze bike lane infrastructure. Walkability indices were established through field observations and an established formula applied to sidewalk and intersection data. Environmental data, such as air quality and noise pollution readings, were acquired from the Shanghai Environmental Monitoring Center. Spatial joins, proximity analyses, and heat mapping techniques were conducted in ArcGIS Pro to identify associations between the indicators and understand their spatial relationships.
The process encompasses several essential stages, commencing with the collection of data from diverse sources such as satellite imagery, aerial photographs, and existing GIS databases. Subsequently, the collected data undergo preprocessing to ensure precision and compatibility, encompassing tasks such as error elimination, alignment of coordinate systems, and standardization of data formats. Following this, the GIS data and POIs are integrated into a unified spatial database or GIS software 10.8, facilitating efficient management and analysis. Spatial analysis techniques, such as proximity analysis, spatial clustering, interpolation, and overlay analysis, are then applied to extract meaningful insights from the data. Attribute calculations play a crucial role in determining pertinent indicators or attributes, including walkability indices based on factors such as sidewalk coverage, intersection density, and pedestrian infrastructure, as well as energy efficiency indicators derived from building energy consumption and transportation emissions. Finally, the calculated GIS data and POIs are visually represented through maps, charts, or graphs, enhancing the interpretability and effective communication of the findings. It is important to acknowledge that the specific methods employed for measurement and calculation may vary depending on the software, tools, and on the characteristics of the GIS data and POIs under investigation.
3.4. Environmental Behavior Observations
At the street level, this study seeks to conduct field observations in order to capture the interactions and utilization of urban public spaces by individuals. These observations encompass various aspects, including transport preferences, waste disposal practices, and receptiveness to environmental design elements. The selection of observation sites is deliberate, aiming to encompass a range of built environments and socioeconomic contexts within the study area. To quantify behaviors, travel modes, and activities, a systematic coding approach is employed during different time periods. The observational data serves as a means by which to verify and validate the spatial mapping and survey results, providing a ground-truthing mechanism for the study’s findings. In this research, we utilize a shallow progressive ANN to predict the decline in quality, walkability, and environmental behaviors based on four samples.
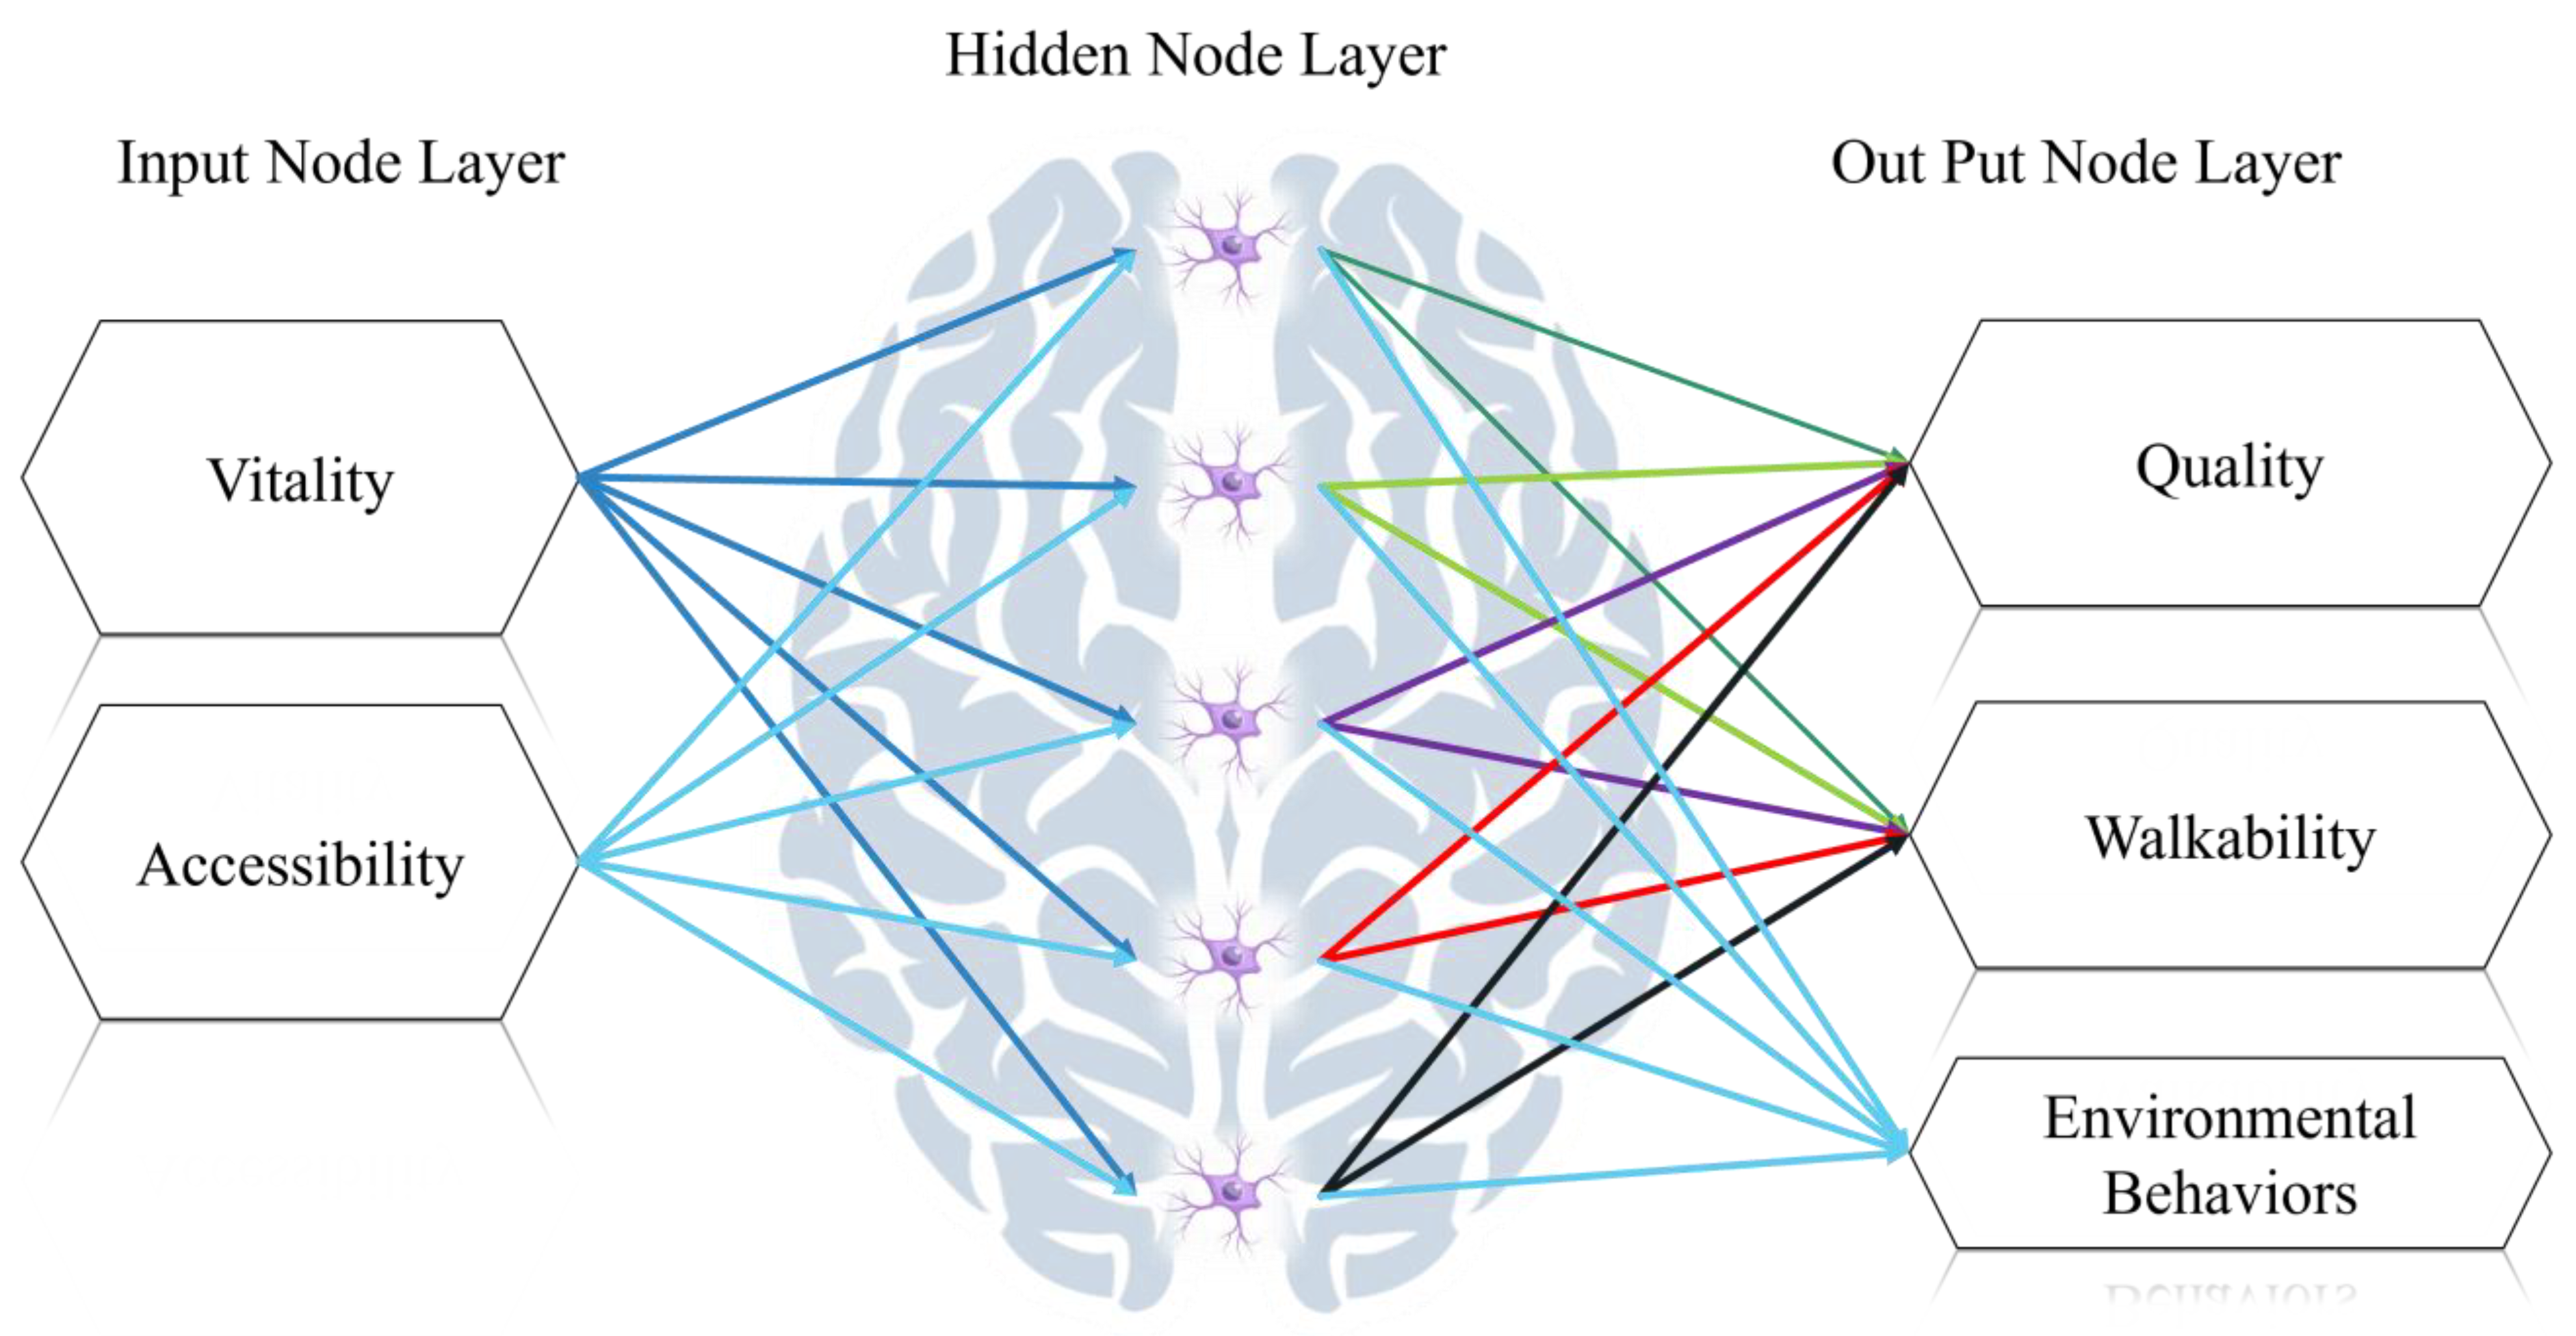
In this study, a shallow progressive ANN model was employed to predict specific outcomes. The shallow progressive ANN architecture, characterized by a limited number of layers, including an input layer, one or more hidden layers, and an output layer, enabled efficient training and prediction while maintaining simplicity and interpretability. The progressive learning process of the ANN involved incremental training, gradually adding new layers or nodes to the network, in order to explore complex relationships and patterns in the data and improve predictive performance. By utilizing the shallow progressive ANN, the researchers aimed to predict outcomes such as environmental behaviors, energy consumption patterns, or other relevant variables, capturing underlying patterns and dynamics in the data. The advantage of this approach lies in its ability to balance model complexity and interpretability, facilitating a better understanding of the model’s inner workings and influential features or variables, and thereby supporting the formulation of effective strategies and interventions based on the model’s predictions. The neural network consists of inputs for vitality and accessibility, a hidden layer with five neurons for improved convergence, and outputs for quality, walkability, and environmental behaviors. Two tables are presented in this study.
Table 1 shows dynamic physical indicators, including vitality, accessibility, quality, and walkability, providing insight into factors analyzed in the research.
Table 2 shows environmental behavior survey results, capturing residents’ behaviors related to sustainability, such as waste management and transportation choices. The activation function employed is the nonlinear sigmoid function, enhancing prediction accuracy and convergence speed. Training the network involves using the gradient descent algorithm to optimize the error function. To further improve accuracy and convergence, input data from
Table 3 is normalized and then denormalized after estimating the final results. The accuracy of the ANN’s predictions is assessed through linear regression analysis, comparing the fitted graph with the ideal y = x line to determine the network’s error. The subsequent sections of this research will focus on presenting and analyzing the results obtained from the ANN.
5. Discussion
The study examines five categories of dynamic indicators in Shanghai: accessibility, vitality, quality, efficiency, and sustainability. These indicators are mapped across the city and related to observed behaviors and survey data, providing insights into how environmental conditions relate to individual actions. The study finds that public space accessibility, vitality, quality, and efficiency are all important factors in promoting sustainable behaviors. Neighborhoods with more green spaces and active public spaces tend to have higher levels of physical activity and lower levels of car use. The study also highlights the importance of citizen-centered design and smart technology integration in promoting sustainable urban development [
39,
40,
41,
42,
43]. By engaging citizens in the co-creation of sustainable cities, planners and designers can ensure that sustainability strategies are tailored to the needs and priorities of local communities. However, the study also identifies several limitations, including the use of self-reported survey measures and observational samples, as well as the need for periodic restudying to track spatiotemporal changes. The study suggests that emerging big data sources offer a powerful tool with which to diagnose issues, track impacts, and engage citizens in co-creating sustainable cities. This study marks an important step toward a more nuanced and holistic paradigm for urban sustainability focused on the experiential dynamics of everyday spaces [
41,
42,
43,
44,
45]. As urbanization intensifies globally in the coming decades alongside climate change, mapping the rhythms of city life will only grow in importance. Building dense yet livable and vibrant yet sustainable megacities requires tapping into the pulse of urban dynamics. Sustainability has become an increasingly important issue for cities around the world as they seek to reduce their environmental impact and enhance the quality of life for residents [
25,
26,
27,
28,
29]. However, achieving sustainability requires more than just the implementation of environmental policies and infrastructure. It also requires a deep understanding of the complex interactions between the built environment and human behavior. One of the key challenges in promoting sustainable development is ensuring that sustainability strategies are tailored to the needs and priorities of local communities. To address this challenge, cities can employ a range of strategies to engage with local communities and co-create sustainability solutions. Participatory planning processes can involve local residents in the design and implementation of sustainability strategies, ensuring that their voices and needs are heard. Community surveys can provide valuable insights into attitudes and behaviors around sustainability, while community-based data collection can help identify specific environmental issues that are important to local communities [
37,
38,
39,
40,
41,
42]. Collaborating with local organizations, such as neighborhood associations and non-profit groups, can also help ensure that sustainability strategies are aligned with local needs and priorities. Culturally appropriate messaging and communication strategies can help engage diverse communities and build support for sustainability initiatives. Finally, it is important to consider the equity implications of sustainability strategies and prioritize the needs of disadvantaged and vulnerable populations. By employing these strategies, cities can ensure that their sustainability strategies are tailored to the needs and priorities of local communities, leading to more effective and equitable solutions.
Developing more livable, resilient, and sustainable cities can benefit all residents. As cities worldwide strive to reduce their environmental impact and promote the wellbeing of their inhabitants, sustainability has become a vital concern. However, achieving sustainability involves more than simply implementing policies and infrastructure. It also necessitates a dedication to social equity and justice. Communities that are disadvantaged and vulnerable, such as low-income neighborhoods and communities of color, are frequently disproportionately affected by environmental risks such as air pollution, heat waves, and flooding [
37]. These communities may also have less access to resources such as green spaces, public transit, and renewable energy, which can limit their ability to adopt sustainable practices. To address these challenges, cities can prioritize equity and justice in their sustainability strategies. This can include the conducting of equity assessments in order to identify which communities are the most vulnerable to environmental risks, and partnering with community-based organizations to ensure that their needs are prioritized in sustainability planning and implementation. Cities can also prioritize access to resources for disadvantaged and vulnerable communities. They can prioritize the development of green spaces and public transit in underserved areas and ensure that these resources are accessible to all residents. Cities can also provide targeted outreach and education to these communities in order to build awareness and support for sustainability initiatives [
37,
38,
39].
Ensuring affordability and accessibility is also critical. Cities can offer financial assistance and subsidies for low-income residents to access renewable energy and energy-efficient appliances, and provide incentives for sustainable practices such as composting and recycling. Finally, cities can prioritize social equity and justice in their decision-making processes [
30,
31,
32,
33,
34]. Over the years, many cities have made great strides in this direction, implementing policies and programs that promote social equity and justice while also reducing environmental impact. One example of a city that has successfully prioritized equity and justice in its sustainability strategies is Stockholm, Sweden. Stockholm has been recognized as one of the most sustainable cities in the world, and it has achieved this while also prioritizing equity and justice. Stockholm has adopted a comprehensive sustainability plan, the Stockholm Environmental Program, which includes specific strategies by which to address social equity and justice. The plan includes initiatives to promote affordable housing, public transit, and green spaces, particularly in low-income neighborhoods. The city has also implemented a participatory budgeting process in order to engage residents in decision-making and ensure that sustainability initiatives are tailored to local needs and priorities [
39,
40,
41,
42,
43]. One of the key initiatives that Stockholm has implemented to promote equity and justice is the Million Homes Program. This program was launched in the 1960s to address a shortage of affordable housing in the city, and it has since been expanded to include sustainability initiatives. Under the program, the city has built one million energy-efficient homes, with a focus on providing affordable housing to low-income residents. The program has also included initiatives to promote social equity, such as building homes in neighborhoods with good access to public transit and green spaces. Another initiative that Stockholm has implemented to promote equity and justice is the Stockholm Green Fund.
This fund provides financial support to community-led sustainability projects that focus on social equity and justice. The fund has supported a range of projects, including initiatives to promote renewable energy, improve air quality, and provide access to green spaces in underserved communities. Stockholm’s success in prioritizing equity and justice in its sustainability strategies shows that it is possible to create more sustainable and equitable cities [
36,
37,
38,
39,
40,
41,
42]. The idea of the circular economy is gaining significant attention as companies and governments seek to reduce waste and promote sustainable practices. However, transitioning to this model can be challenging for companies and governments as it requires a mindset shift from a linear “take-make-dispose” model to a circular model prioritizing resource efficiency and waste reduction. To overcome these challenges, companies and governments can implement strategies like designing products for circularity, implementing closed-loop systems, promoting product-as-a-service models, encouraging collaboration between stakeholders, and implementing policies and regulations that incentivize resource efficiency and waste reduction [
38,
39,
40,
41,
42,
43]. By adopting these strategies, companies and governments can promote the circular economy and sustainability and reduce waste in order to create a more sustainable future for all. Governments face several challenges when implementing policies that promote the circular economy. These challenges include the lack of awareness and understanding of the concept, regulatory barriers that hinder the transition, limited funding for necessary investments, inadequate stakeholder engagement, the absence of data and metrics to measure progress, and the complexity of global supply chains. Overcoming these challenges requires education and awareness campaigns, revising regulations to align with circular economy principles, securing funding for infrastructure and technology, actively involving stakeholders in decision-making processes, developing robust data collection systems, and fostering international cooperation in order to address supply chain complexities. By addressing these challenges, governments can effectively promote and transition towards a circular economy, maximizing resource efficiency and sustainability [
36,
37,
38,
39,
40,
41].
By addressing these challenges, governments can better implement policies to promote the circular economy and advance sustainability goals. This can include investing in public education and awareness campaigns, updating regulations and policies to support the circular economy, providing funding and incentives for circular economy initiatives, engaging stakeholders in decision-making processes, improving data collection and metrics, and promoting supply chain transparency and traceability. Effective stakeholder engagement is a critical component of circular economy decision-making processes. Stakeholder engagement is important because it ensures that a diverse range of perspectives are considered in decision-making processes, and that decisions reflect local needs and priorities. It also helps to build trust and relationships between decision-makers and stakeholders, which is essential for the success of circular economy initiatives [
41,
42,
43,
44].
To effectively engage stakeholders in circular economy initiatives and foster successful outcomes, several key strategies can be employed. First, involving stakeholders from the early stages of decision-making is crucial, allowing for their perspectives to be incorporated and ensuring a sense of ownership. Second, using diverse engagement methods, such as public meetings, surveys, and online forums, accommodates different communication preferences and promotes inclusivity. Third, providing clear and accessible information about the circular economy and decision-making processes enables stakeholders to understand the issues and contribute informed feedback. Fourth, fostering two-way communication by listening to stakeholder feedback and incorporating it into decision-making processes enhances engagement effectiveness [
22,
23,
24,
25,
26,
27,
28]. Fifth, building trust and relationships through stakeholder interaction, transparency, and accountability cultivates a sense of value and ensures decision-makers act in stakeholders’ best interests. Lastly, providing incentives such as compensation, training opportunities, and recognition motivates stakeholders to participate and acknowledges their contributions. Employing these strategies establishes trust, enhances relationships, and promotes the success of circular economy initiatives. To ensure effective engagement in circular economy initiatives, building trust and relationships with stakeholders is crucial. This can be achieved through open and transparent communication, involving stakeholders in decision-making, active engagement, addressing their needs, maintaining consistency and reliability, fostering long-term relationships, and recognizing their contributions. By implementing these strategies, trust can be established, fostering successful engagement in circular economy initiatives.
Effective stakeholder engagement is essential for the success of circular economy initiatives. By involving stakeholders from the outset, using a variety of engagement methods, providing clear and accessible information, fostering two-way communication, building trust and relationships, and providing incentives, decision-makers can ensure that their decisions reflect local needs and priorities, and that they are more likely to be successful in achieving sustainability goals. However, there are also challenges associated with stakeholder engagement in circular economy decision-making processes [
27,
28,
29,
30,
31]. Some of the key challenges include limited stakeholder representation, as engaging a diverse range of stakeholders can be challenging, particularly in communities where certain groups may be underrepresented or marginalized, making it difficult to ensure that all perspectives are considered in decision-making processes. Limited resources can be a challenge, as engaging stakeholders can be costly and time-consuming, particularly when multiple engagement methods are used, which can be challenging for smaller organizations or those with limited budgets. Resistance to change is another challenge, as some stakeholders may be resistant to change, particularly if they perceive that their interests or livelihoods are threatened by circular economy initiatives, making it difficult to build consensus and support for these initiatives.
Figure 3 shows the essential steps for effective stakeholder engagement in the circular economy. It emphasizes the importance of early involvement (Step 1) to incorporate stakeholder perspectives and expertise. Diverse engagement methods (Step 2) are recommended to maximize participation. Clear and accessible information (Step 3) enables informed decision-making. Two-way communication (Step 4) fosters dialogue and feedback exchange. Building trust and relationships (Step 5) creates a collaborative environment. Incentives (Step 6) encourage stakeholder participation and commitment. These steps collectively establish a robust and inclusive stakeholder engagement process, vital for the success of the circular economy. Limited capacity is also a challenge, as some stakeholders may not have the technical or financial capacity to participate fully in decision-making processes, which can be particularly challenging for small businesses or community organizations. Finally, lack of trust is an issue, as building trust between decision-makers and stakeholders can be challenging, particularly in communities where there is a history of conflict or mistrust, making it difficult to create an environment in which stakeholders feel comfortable providing feedback and engaging in the decision-making process [
32,
33,
34,
35,
36,
37,
38]. By addressing these challenges, decision-makers can ensure that their stakeholder engagement processes are successful in achieving sustainability goals. This can include working to ensure that all stakeholders are represented in the engagement process, providing resources to support engagement, engaging in effective communication and outreach efforts, building trust and relationships with stakeholders, and providing capacity-building opportunities to support stakeholder engagement. An effective stakeholder engagement is critical for the success of circular economy initiatives. By involving stakeholders from the outset, using a variety of engagement methods, providing clear and accessible information, fostering two-way communication, building trust and relationships, and providing incentives, decision-makers can ensure that their decisions reflect local needs and priorities, and are more likely to be successful in achieving sustainability goals.
The illustration presented in
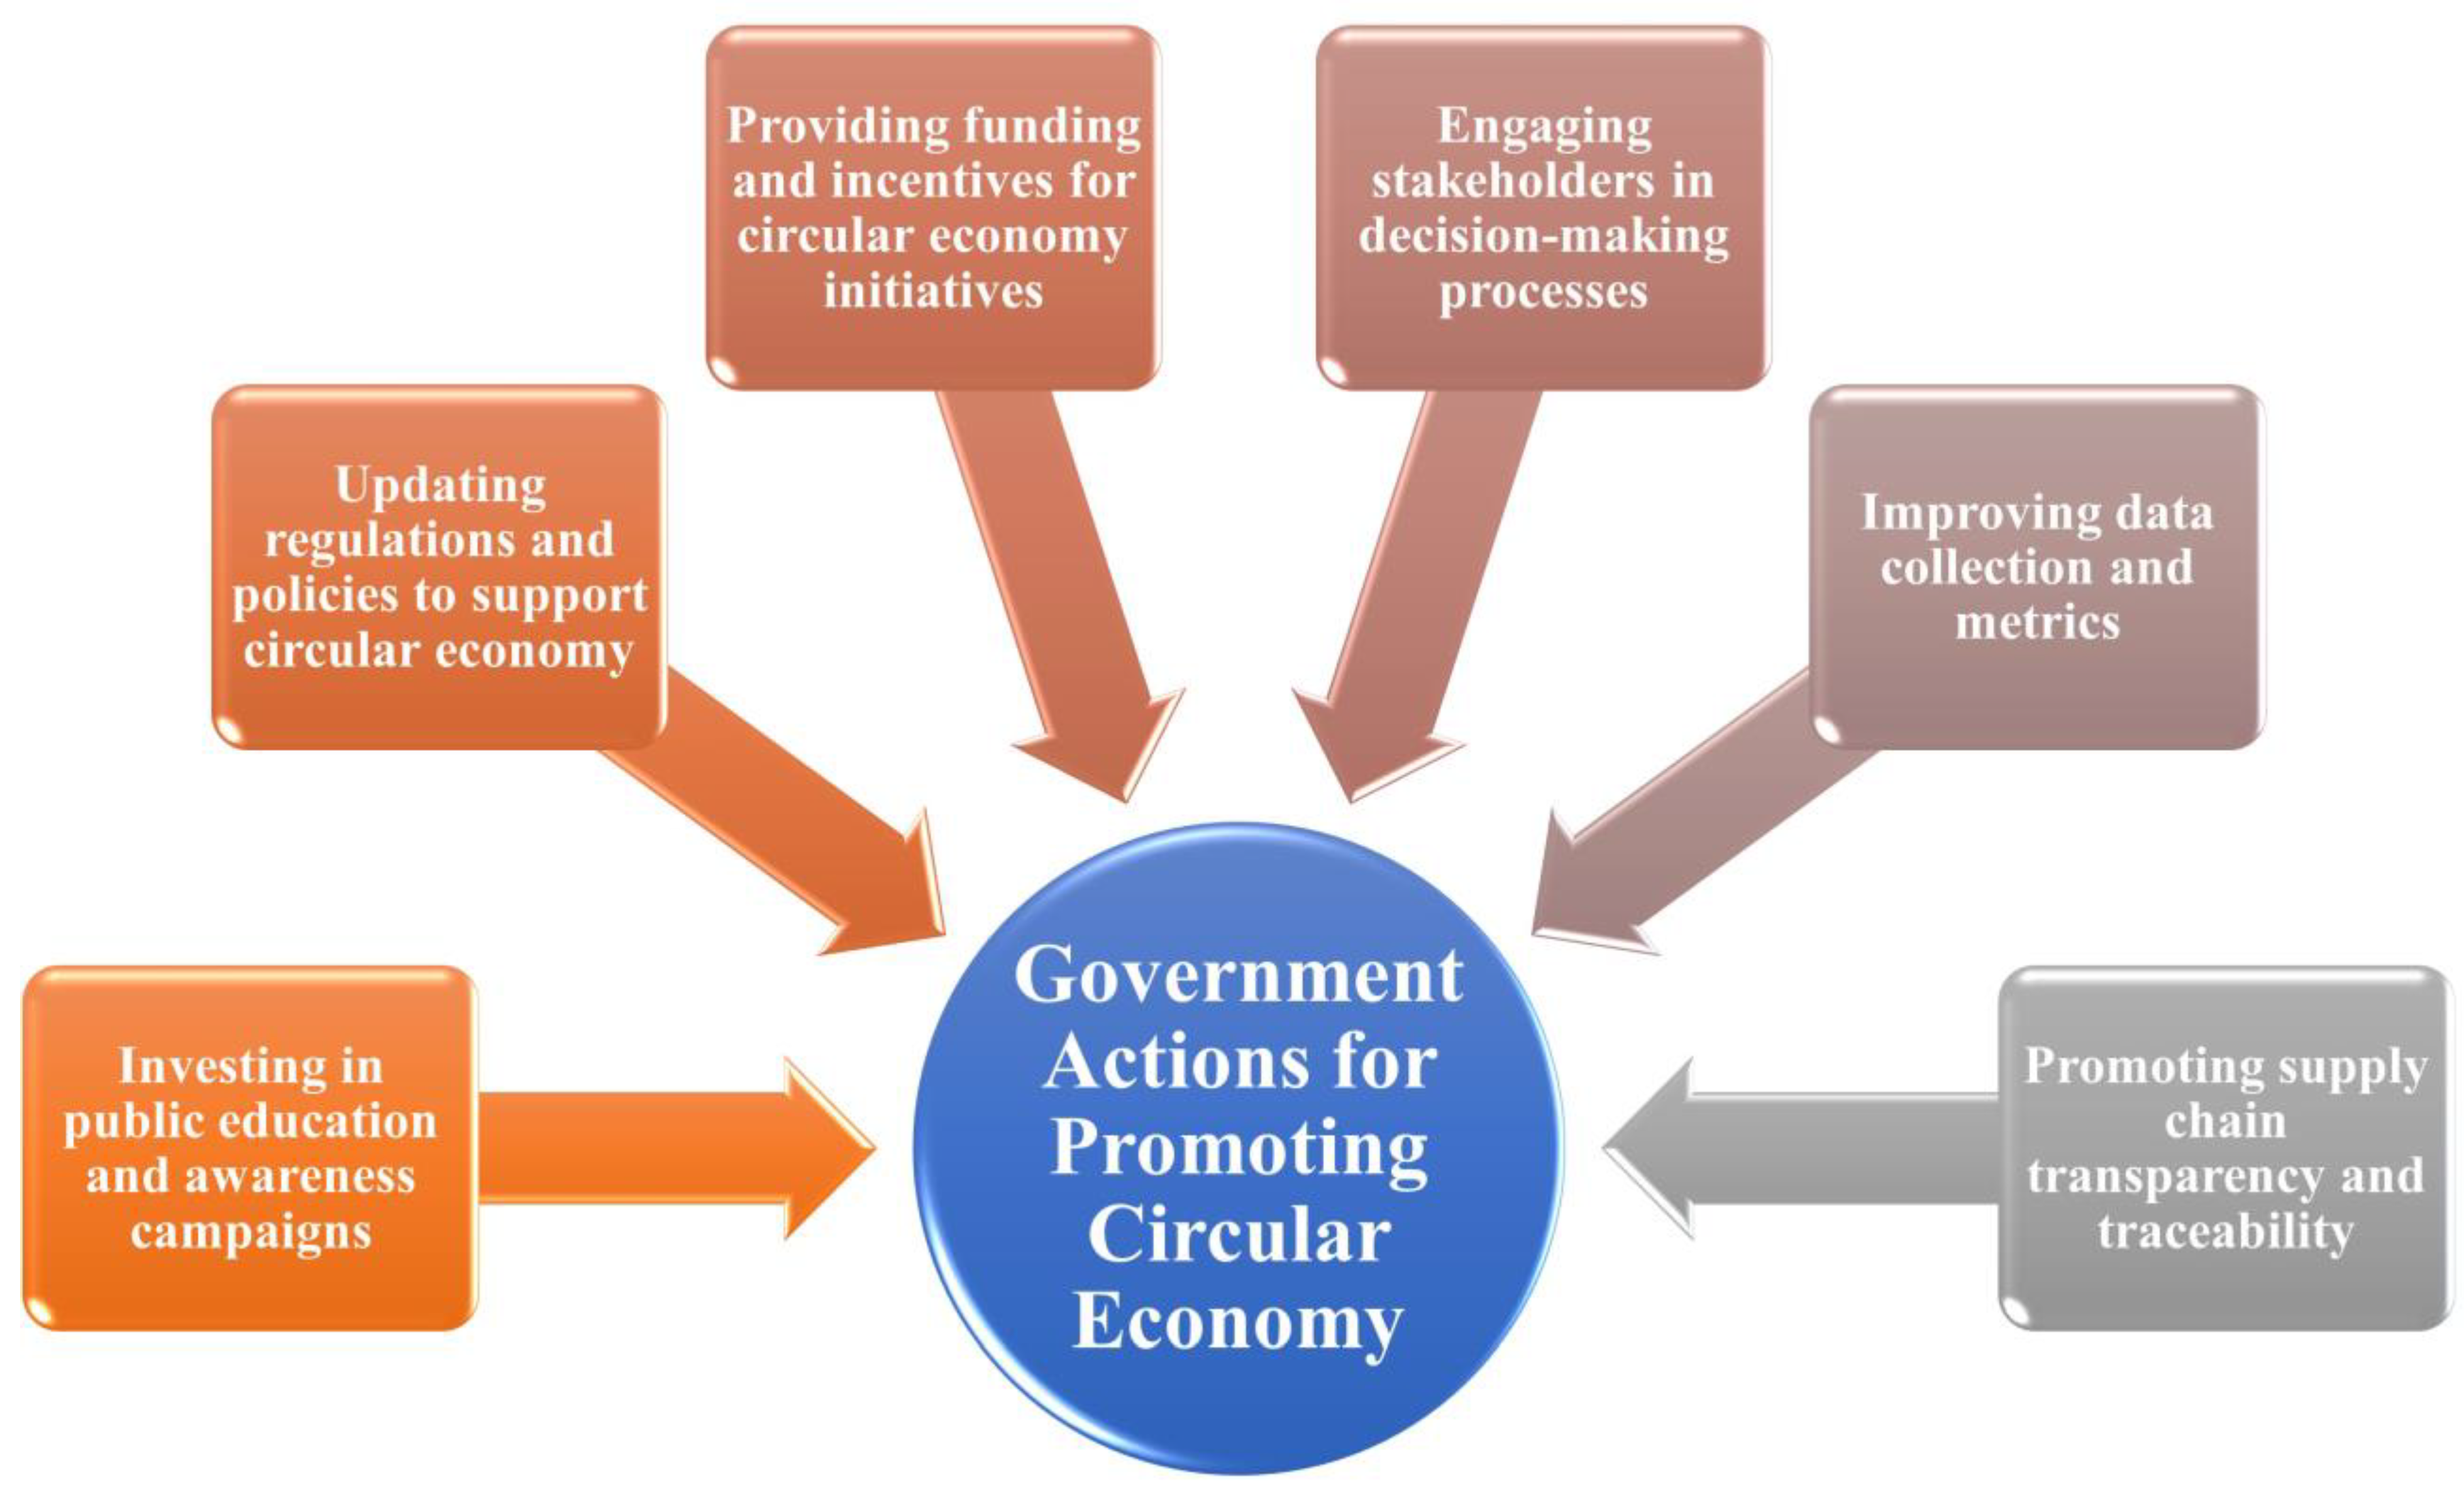
Figure 4 shows the various actions undertaken by governments to advance the implementation of circular economy principles through the resolution of challenges and the formulation of policies. Governments invest in public education and awareness campaigns in order to enhance comprehension and garner support for circular economy concepts. Moreover, they update regulations and policies to establish a conducive environment that facilitates circular practices. In addition, governments provide financial resources and incentives with which to stimulate circular economy initiatives and engage stakeholders in decision-making processes in order to ensure the inclusion of diverse perspectives. The enhancement of data collection and metrics holds significant importance in monitoring progress and assessing the impact of circular economy endeavors. Governments also assume the responsibility of promoting supply chain transparency and traceability, thereby facilitating the identification of circular opportunities and ensuring accountability throughout the value chain. By undertaking these multifaceted actions, governments can effectively facilitate the transition toward a more sustainable and circular economic model.
5.1. Key Relationships between Spatial Indicators and Environmental Behaviors
This study reveals a number of significant interactions between the built environment and environmental behaviors in Shanghai. Accessibility to public and active transport strongly predicts mobility patterns. Public transit promotion should focus on fostering vibrant, mixed-use hubs rather than simple proximity. Walkable streetscapes with diverse amenities and green elements encourage localized non-motorized mobility. High quality parks and waterfronts see enthusiastic public usage, whereas many pocket parks lie underused, highlighting the value of landscape amenities. Waste management relies on the convenience and visibility of recycling options in combination with civic campaigns. Additionally, the research identifies temporal nuances in behaviors related to microclimate, cultural events and mobile technology use [
35,
36,
37,
38,
39,
40,
41,
42]. While physical factors shape behaviors, the findings also reveal gaps between urban sustainability infrastructure and actual adoption by residents. Ingrained social habits and attitudes play a key role. Tapping into community assets and increasing public participation in greening initiatives can build engagement. Effective policies should consider both dynamic spatial factors as well as cultural contexts. The schematic in
Figure 5 depicts the knowledge management model (KMM) for smart campuses and smart cities in Asia, which aims to promote the integration of knowledge management principles and practices in the development of smart cities. The model comprises various interconnected components that work together to support the creation and sharing of knowledge and which can contribute to the development of smarter and more sustainable urban environments. The first component of the model involves the generation of new knowledge through research, development, and innovation activities. The second component focuses on the collection and assimilation of existing knowledge from different sources, including academic research, industry reports, and case studies. The third component emphasizes the classification, organization, and storage of knowledge in a structured and easily accessible manner. The fourth component highlights the importance of sharing knowledge through various channels, such as academic publications, conferences, workshops, and online platforms.
The fifth component involves the application of knowledge to inform decision-making and support the development of smart cities. Lastly, the knowledge evaluation process assesses the effectiveness of knowledge management practices in achieving desired outcomes. By prioritizing the creation, acquisition, organization, dissemination, application, and evaluation of knowledge, the KMM for smart campuses and smart cities in Asia provides a comprehensive framework for promoting the integration of knowledge management principles and practices in the development of smart cities. This can facilitate the creation of more innovative, sustainable, and livable urban environments in Asia and beyond.
As mentioned in previous sections, a progressive ANN is utilized to predict the decline in quality, walkability, and environmental behaviors based on vitality and accessibility, as shown in
Table 3. The performance measures of quality, walkability, and environmental behaviors are predicted and examined respective accuracies of up to 80 and 90%.
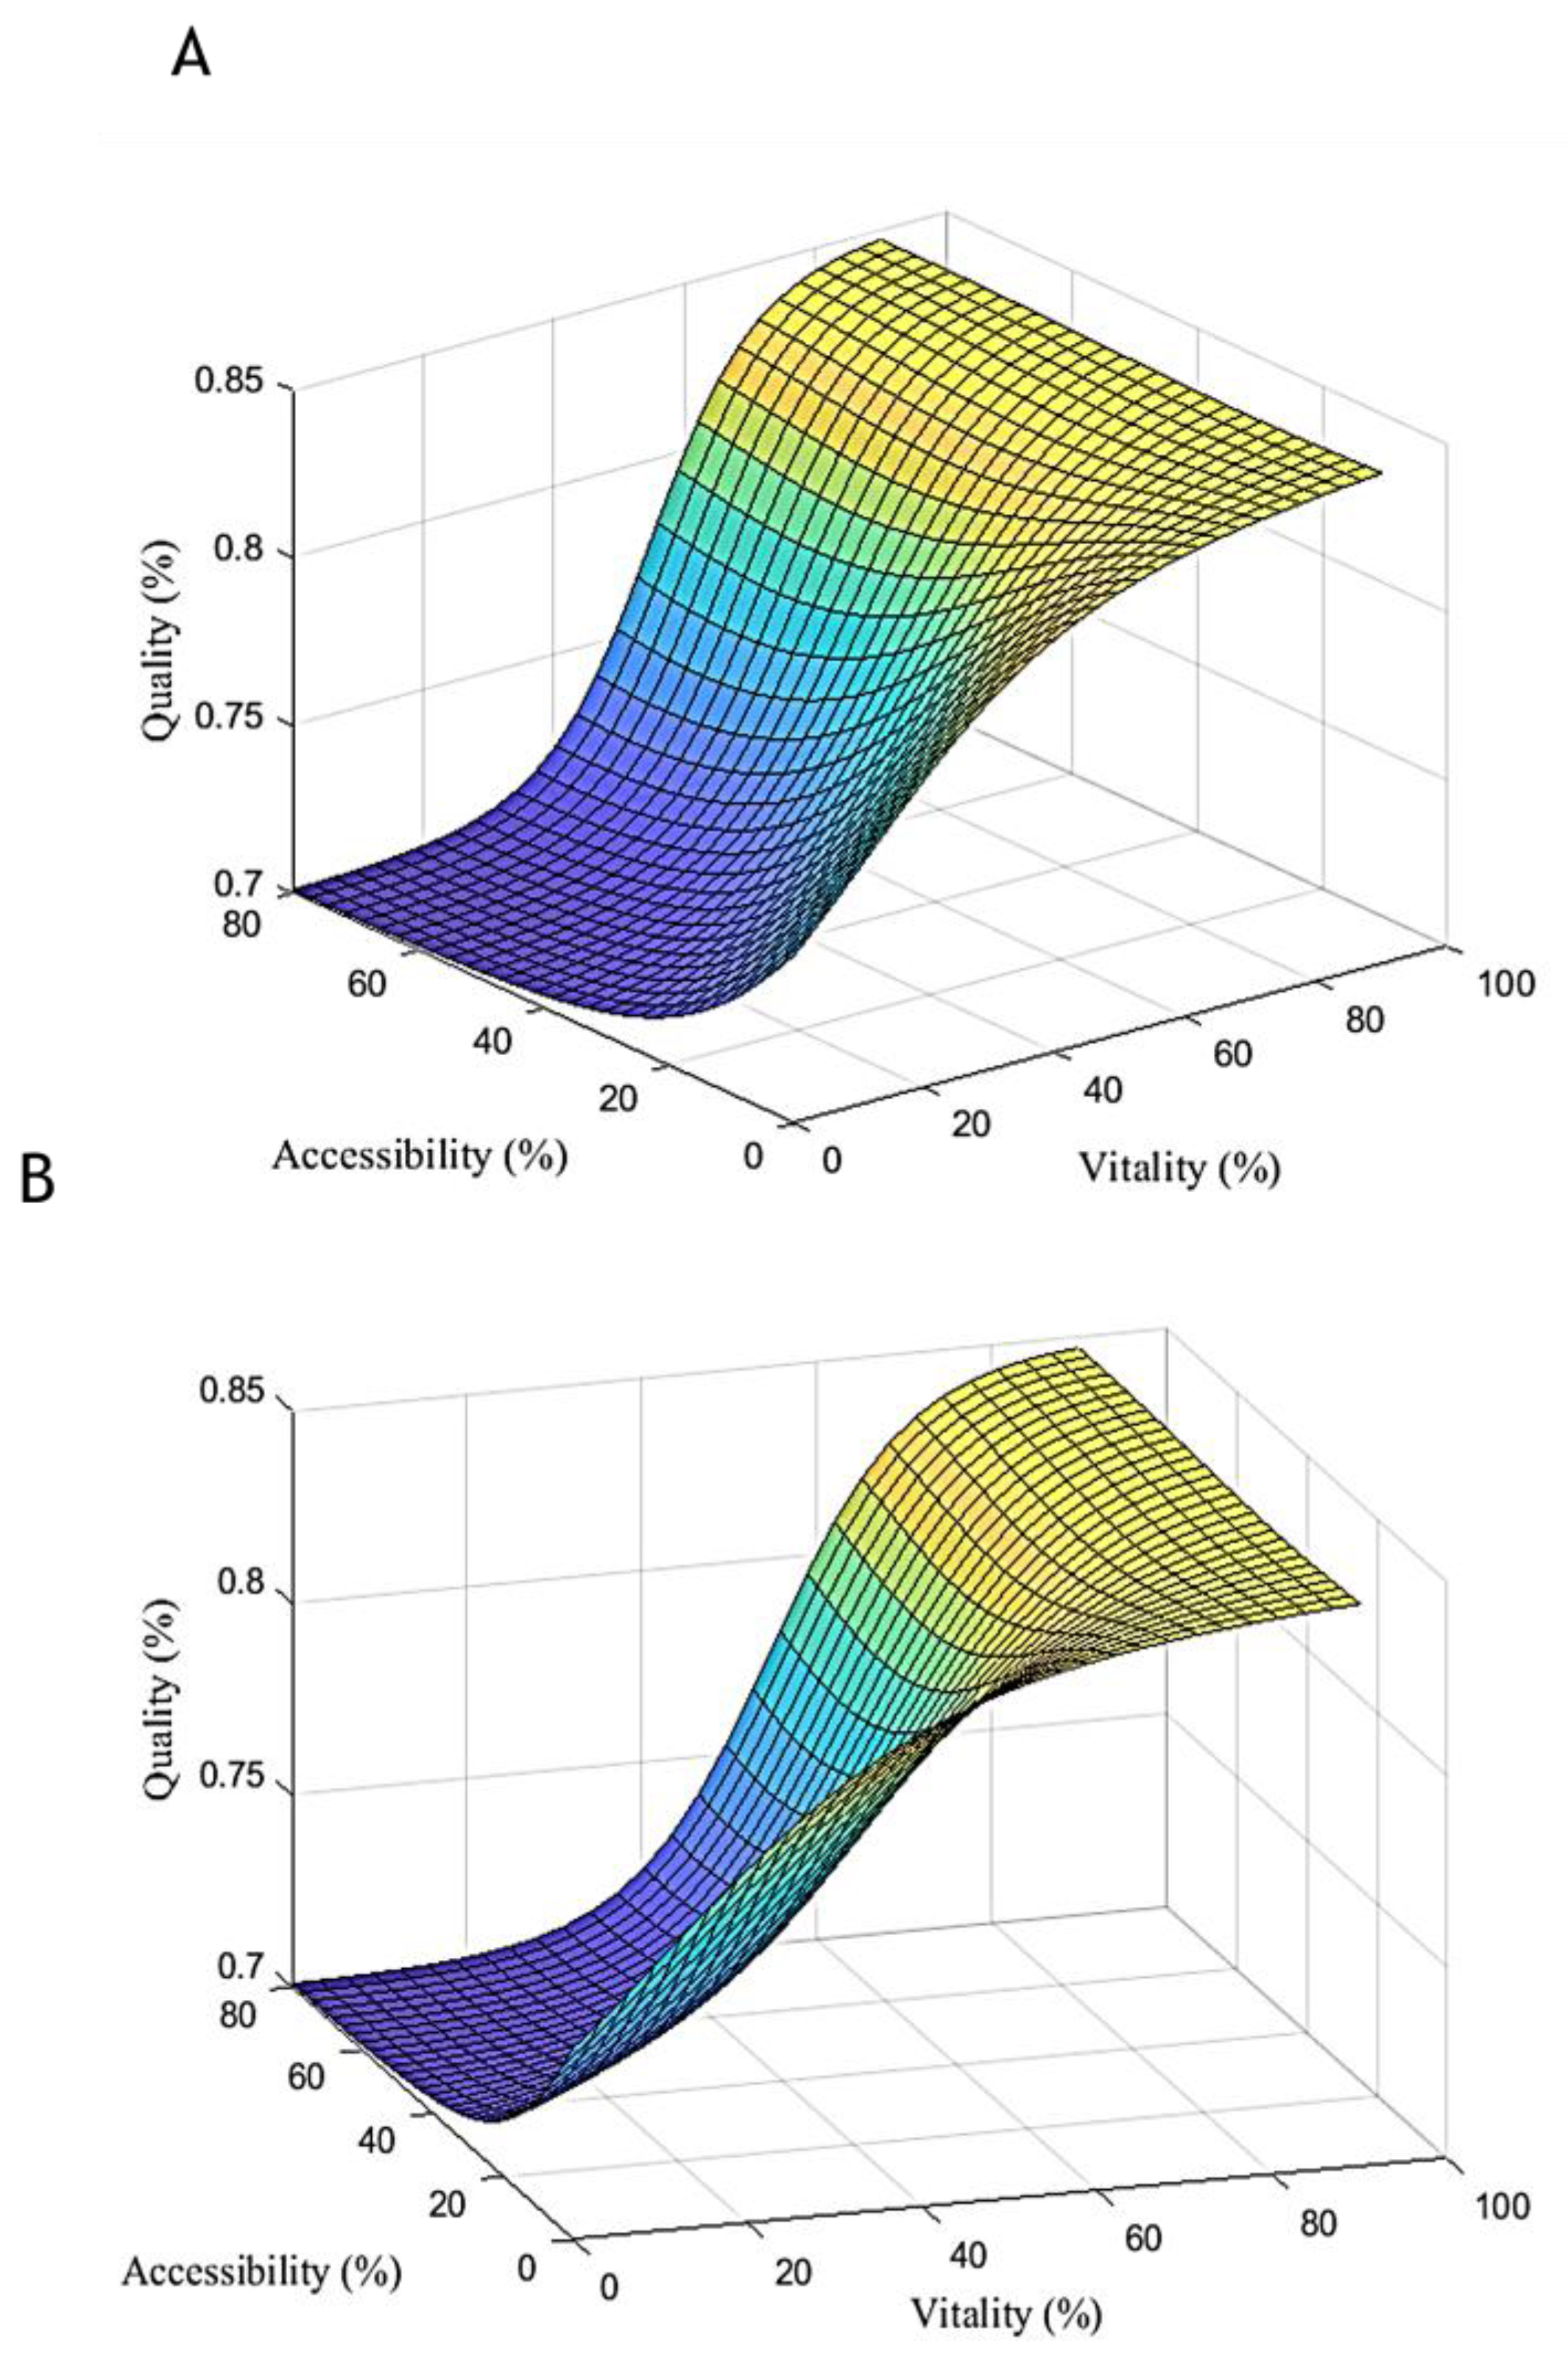
Figure 6 illustrates the predicted results for quality by the neural network. It is evident from
Figure 6 that quality improves with increasing vitality, while accessibility has minimal impact on quality.
Figure 6A,B analyze four cases, showing the impact of dynamic indicators on environmental behaviors in Shanghai’s urban environments. Case 1 indicates a positive correlation between vitality, accessibility, quality, and environmentally friendly behaviors. Case 2 shows a trade-off between accessibility and environmental quality. Case 3 represents an urban environment excelling in all aspects and likely to exhibit positive environmental behaviors. In contrast, Case 4 suggests challenges in the promotion of positive behaviors in areas with lower vitality, accessibility, and quality. The insights from
Table 3 can assist policymakers and urban planners in identifying areas for targeted interventions in order to enhance environmental behaviors and sustainability in Shanghai.
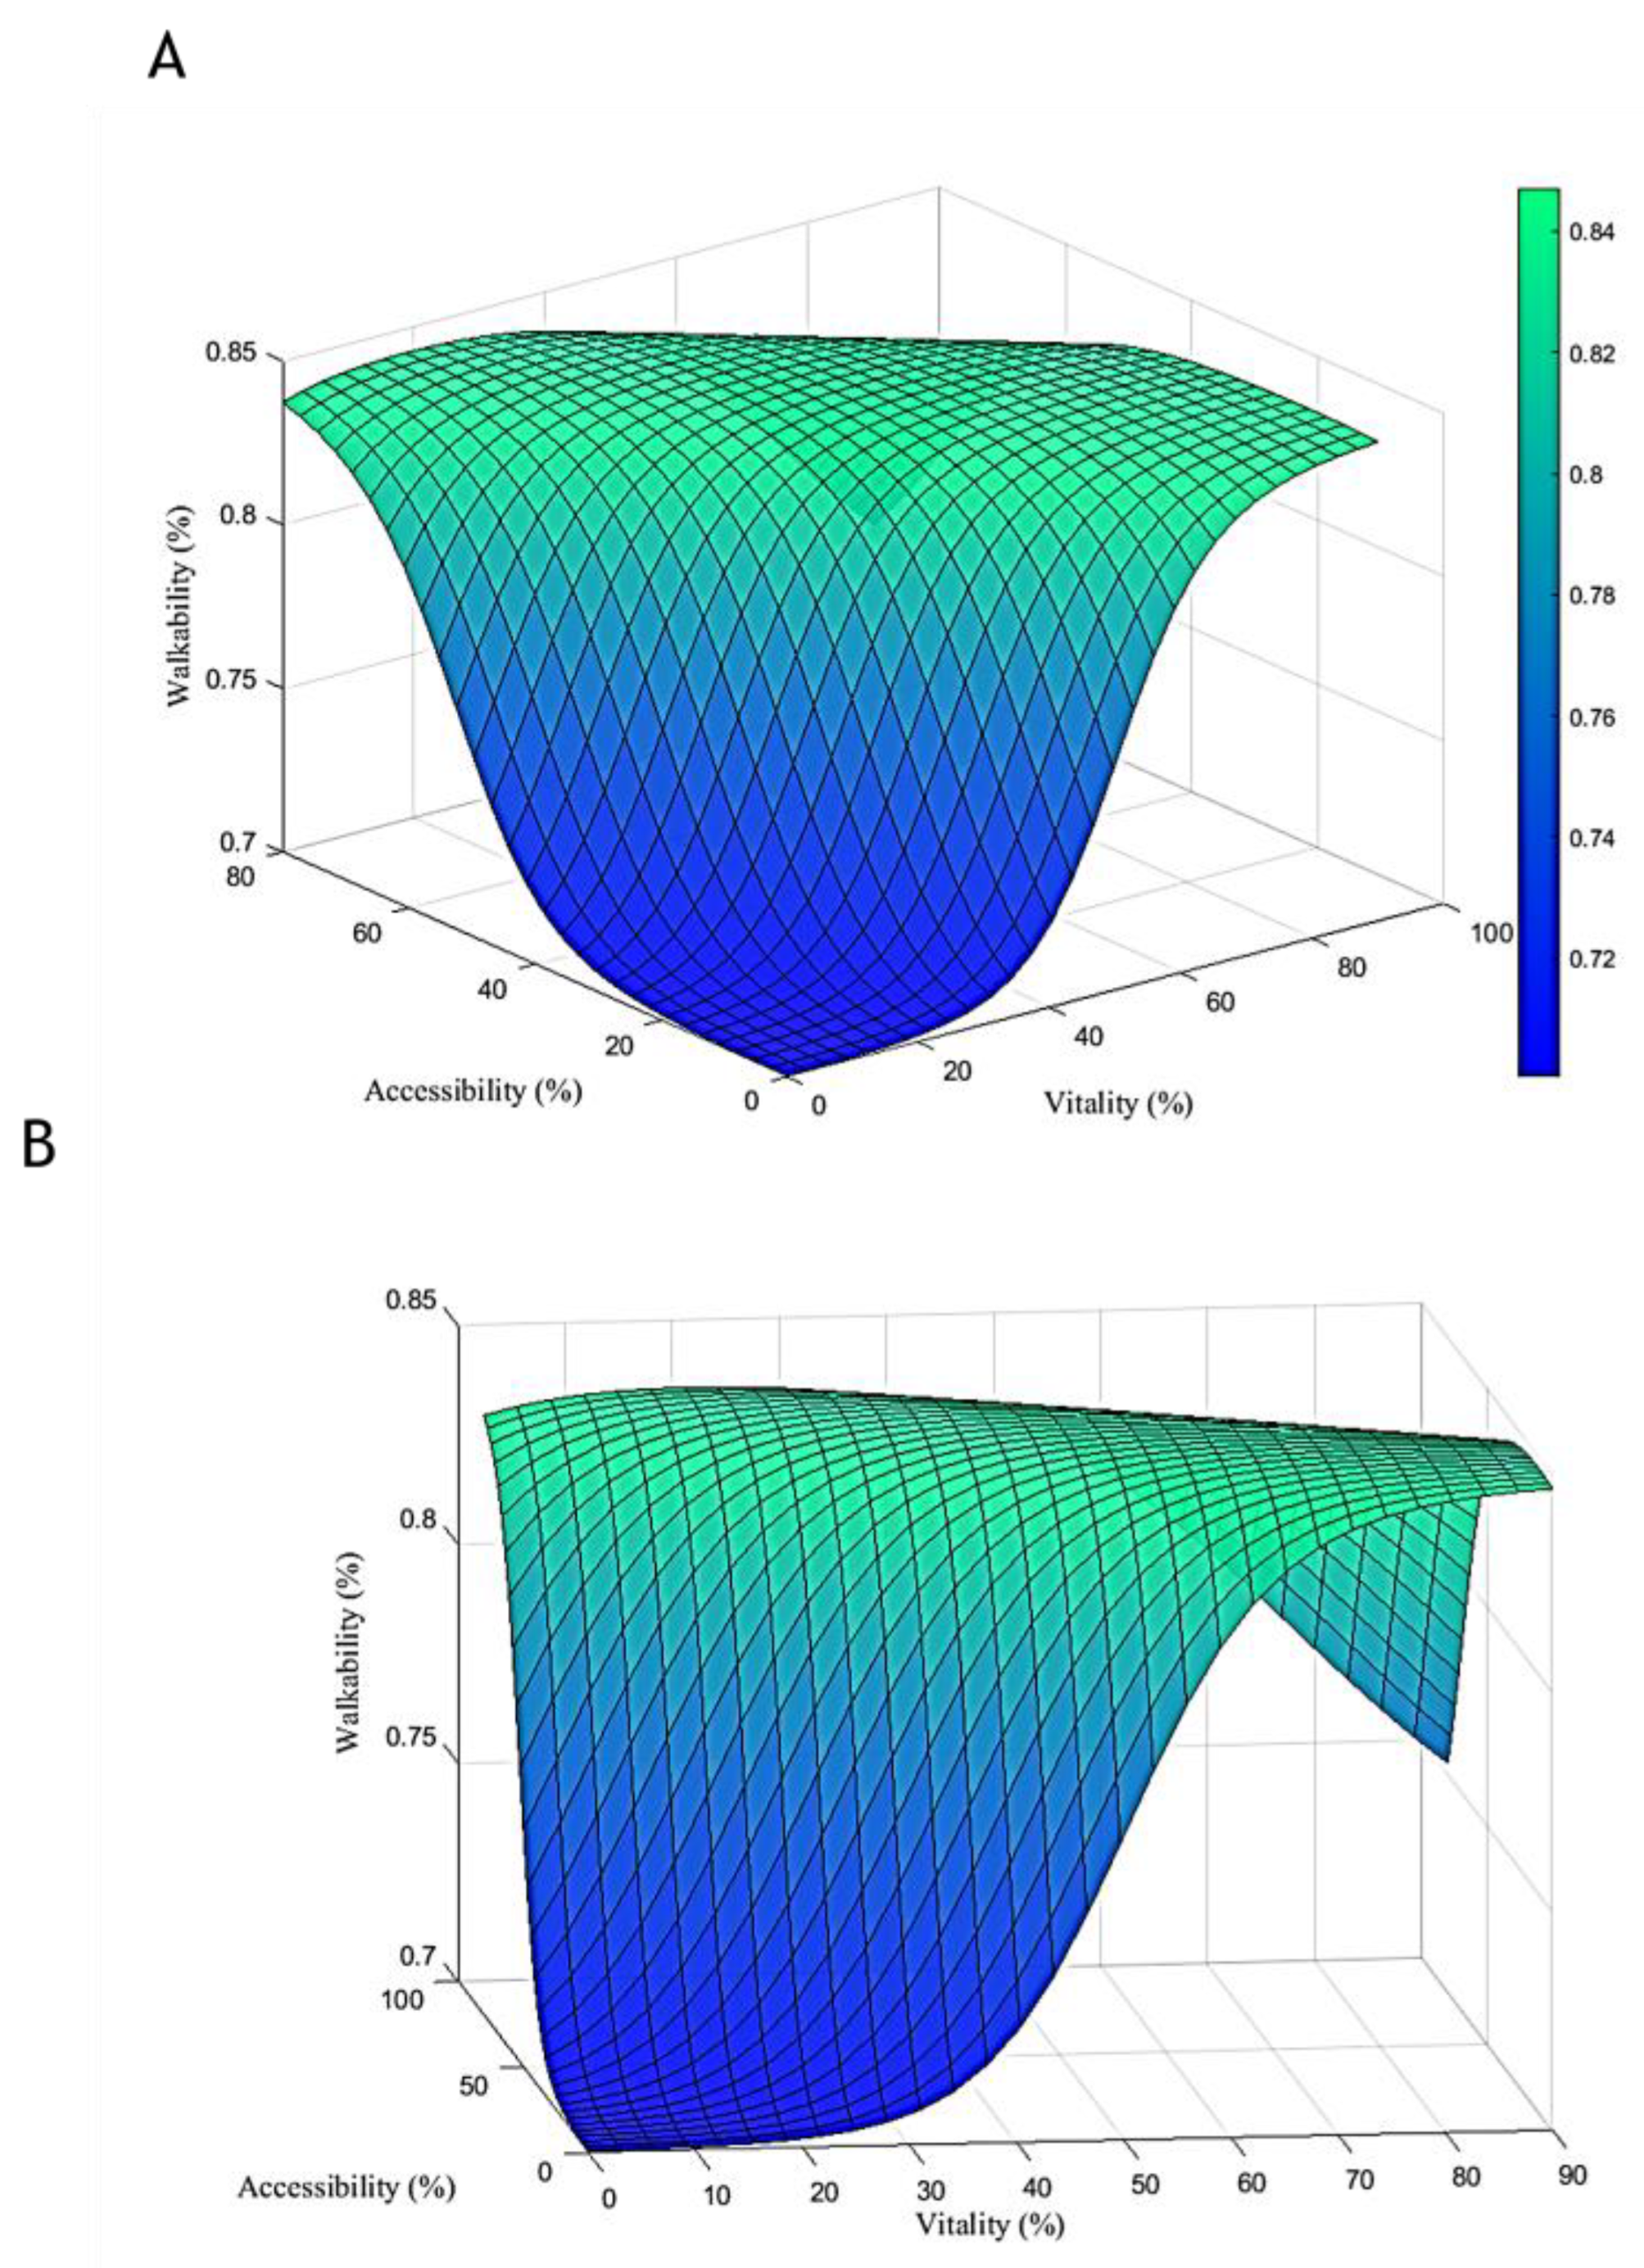
Figure 7 shows the estimated results for walkability by the neural network. The trend of the predicted results indicates that vitality, along with accessibility, significantly enhances walkability, but that, if the trend continues, walkability starts to decline, raising questions about potential outliers or anomalous data.
Figure 7 illustrates the impact of dynamic indicators on walkability and environmental behaviors in Shanghai’s urban environments. The four case studies indicate varying levels of walkability, vitality, and accessibility. Case 1 shows high walkability (85%) and vitality (80%), while Case 2 shows slightly lower values. Case 3 exhibits the highest walkability (90%) and vitality (90%), and Case 4 showcases moderate levels. The results show the relationship between walkability, vitality, accessibility, and environmental behaviors in Shanghai’s urban environments.
5.2. Applications for Urban Planning and Design
Dynamic indicators provide valuable diagnostics with which to inform planning and design for sustainability. The study’s indicator profiling of neighborhoods identifies district-specific assets, such as walkable streets, and deficiencies, like poor connectivity, that can guide targeted interventions. The time-lapse mapping highlights usage peaks when designing facilities and public space management. Correlating indicators with observed behaviors informs evidence-based planning standards. The research indicates ideal distances between transit hubs and residential areas to maximize ridership [
32,
33,
34,
35]. It shows thresholds for public space quality and amenities needed to attract visitors. The findings will directly inform Shanghai’s ongoing revision of codes for sustainable buildings, neighborhood design, streetscapes and open space. The study also shows the value of dynamic mapping with new data sources to better understand human interactions with the built environment [
36,
37,
38]. Combining real-time location-based data with static GIS layers provides a more accurate model of urban dynamics for simulations and forecasting to support decision making. As urban environmental challenges grow worldwide, dynamic mapping offers a powerful tool with which to diagnose problem areas and track sustainability progress. Increasing vitality and accessibility contribute to quality, walkability, and environmental behaviors. Higher vitality leads to growth in the quality of walkability and environmental behaviors [
39,
40,
41]. While vitality has a significant impact on quality, accessibility has a minimal effect. The predicted results for walkability indicate that vitality, in conjunction with accessibility, can greatly enhance walkability, and that these grow together. Similarly, vitality, along with accessibility, can greatly increase environmental behaviors, and they grow together until reaching a plateau [
42,
43,
44,
45,
46]. Further growth in environmental behaviors would require additional interventions. One research paper,
How Social-Spatial Aspects of Urban Space Affect Social Sustainability: A Case Study, examines the relationship between the social-spatial characteristics of urban space and social sustainability. It utilizes spatial analysis, and statistical analyses to compare two study areas in Izmir, Turkey. The results demonstrate that social sustainability is strongly influenced by social justice and environmental factors, which should be considered in urban planning and development.
Another article, An Ecological Dynamics Perspective in Designing Urban Natural Environments for Wellbeing and Physical Activity Promotion, proposes an ecological dynamics framework to understand the benefits of urban natural environments for health and wellbeing. It reviews the literature on the preferred and beneficial aspects of urban natural environments for users and provides recommendations on how to design them to promote physical activity behavior.
A further paper, Space Syntax Analysis using Space Syntax and Spatial Cognition, employs an agent-based model to analyze urban spatial environments in two cities in Italy and China. It compares a formal and quantitative approach, such as space syntax, with a qualitative exploration based on spatial cognition. The conclusion suggests that an agent-based model can provide a comprehensive understanding of spatial intelligence and environmental behaviors of users.
Spatio-Temporal Changes of Green Spaces and their Impact on Urban Environmental Parameters: A Case Study of Mumbai Metropolitan Area examines the patterns of green space changes in the Mumbai metropolitan area from 1988 to 2018 and their impact on key environmental parameters such as land surface temperature, normalized difference vegetation index, and leaf area index. It utilizes remote sensing techniques and GIS for the analysis of spatio-temporal changes and proposes strategies for increasing green spaces in the city.
Figure 8 exhibits the predicted results for environmental behaviors by the neural network. As depicted in
Figure 8, vitality, in conjunction with accessibility, can greatly increase environmental behaviors, and they exhibit growth together until reaching a plateau. Further growth in environmental behaviors would require additional interventions.
Figure 8 shows the impact of dynamic indicators on environmental behaviors in urban environments in Shanghai.
Figure 8 shows the vitality and accessibility levels for each case study, along with their corresponding environmental behaviors. In Case 1, vitality is rated at 80%, accessibility at 70%, and environmental behaviors at 90%. Case 2 depicts vitality at 75%, accessibility at 60%, and environmental behaviors at 80%. Case 3 demonstrates the highest values, with vitality at 90%, accessibility at 80%, and environmental behaviors at 95%. Lastly, Case 4 displays vitality at 70%, accessibility at 75%, and environmental behaviors at 85%. These results indicate the relationship between vitality, accessibility, and environmental behaviors within urban environments in Shanghai.
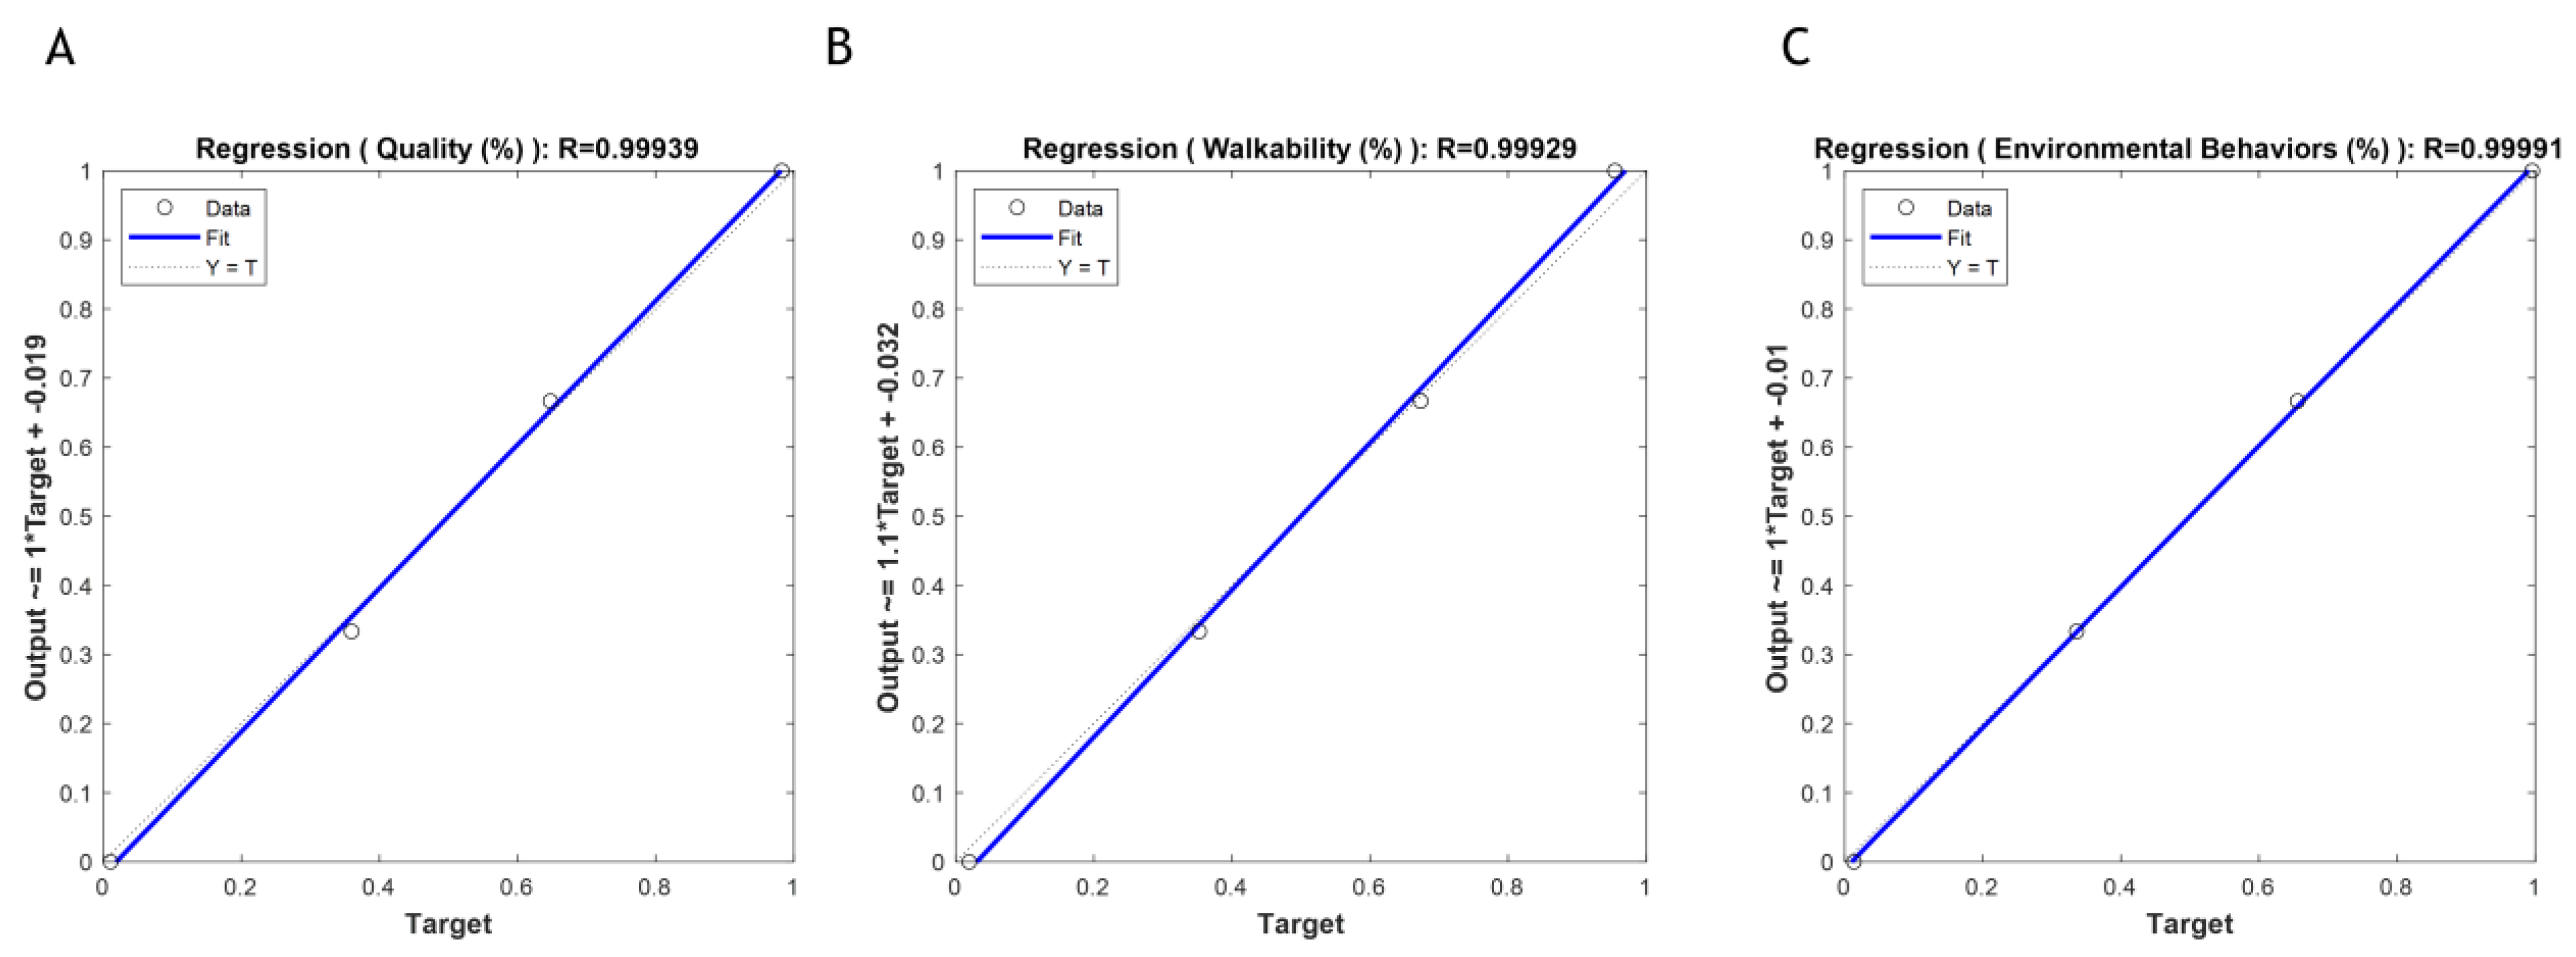
The results obtained from linear regression analysis, as shown in
Figure 9, indicate that the ANN has achieved high accuracy with an error of less than 1% compared with the target values in
Table 3 for quality, walkability, and environmental behaviors.
Figure 9A–C show linear regression charts evaluating the accuracy of the ANN developed in this study. The charts focus on quality, walkability, and environmental behaviors. The coefficient of determination (R-squared) is utilized to assess the goodness of fit. The regression chart in
Figure 9A shows a strong relationship between predicted and observed quality (R = 0.99939).
Figure 9B shows a robust fit for walkability (R = 0.99929).
Figure 9C reveals an almost perfect match for environmental behaviors (R = 0.99991). These results affirm the high accuracy of the ANN model when predicting the relationships among the variables.
Figure 10 illustrates a schematic representation of an ANN that has been constructed to analyze the relationship between vitality, access, and various outcomes such as quality, walkability, and environmental behaviors. The ANN consists of a hidden layer comprising five neurons and two inputs, which are used to generate predictions for the aforementioned variables based on the available data from four samples.
5.3. Limitations and Future Research
While the investigations conducted in this research provide valuable spatial and behavioral insights with the assistance of artificial neural networks, it is important to acknowledge the presence of certain limitations. Cross-sectional research, although capable of identifying correlations, falls short in confirming causality between the built environment and behaviors. Real urban contexts, in comparison with controlled experiments, introduce a multitude of confounding variables that can complicate the interpretation of results. Additionally, while the survey samples utilized in this study encompass diverse demographics, they may underrepresent immigrant and elderly groups, thereby limiting the generalizability of the findings. Given the rapid evolution of indicators and lifestyles in Shanghai, conducting periodic restudies would be advantageous in the capture of temporal changes over time.
Future research can build upon the exploratory nature of this study and explore various directions to further enrich the field. Promising areas of investigation include the examination of additional behavioral outcomes such as energy and water consumption, mental health, social capital, and place attachment. The implementation of dynamic mapping techniques can enable the assessment of the long-term impact of new infrastructure initiatives, such as bike highway pilot projects and the establishment of platforms. Furthermore, dynamic mapping can track the spatial spread of behaviors across neighborhoods, providing valuable insights into their spatial dynamics. It is equally important to consider indoor spaces, such as schools and workplaces, as significant domains for sustainability considerations. As urban China undergoes ongoing transformations, conducting comparative studies between Shanghai and other emerging megacities can shed light on contextual similarities and differences, contributing to a comprehensive understanding of urban sustainability. In conclusion, while this research offers valuable contributions, it is essential to acknowledge its limitations and to identify potential avenues for further exploration in order to advance the field. By addressing these limitations and pursuing promising areas of investigation, future research can continue to expand our knowledge and understanding of the complex relationship between dynamic indicators, urban spaces, and residents’ environmental behaviors.
5.4. Integration with Smart City Technology
Shanghai aims to position itself as a global leader in smart and eco-city technology, making significant investments in sensors, big data platforms, and automated systems. The dynamic mapping and behavior analysis conducted in this study offer a crucial evidence base to inform the integration of technology for sustainability purposes. The widespread deployment of ubiquitous sensors can enhance the measurement capabilities of various indicators. By harnessing crowdsourced air quality data from citizens’ mobile devices, highly localized pollution maps can be generated, while smart energy meters provide data on the carbon footprints of individual buildings. It is also important to focus on the dynamic analysis of smart technology usage itself. Research can explore spatiotemporal patterns in electric vehicle charging behavior and bike-share ridership, providing insights into the adoption and utilization of these technologies. Top-down technology solutions often fail due to lack of citizen buy-in and uneven access across neighborhoods. The behavioral research has highlighted the diverse priorities and needs throughout the city. Effective smart city design must start from human-centric perspectives. Citizen science platforms that empower residents to monitor their surroundings can build environmental awareness. Geosocial apps connecting neighbors to collectively map local issues like noise or litter can motivate community action. Interactive platforms that allow citizens to model development scenarios and track sustainability impacts can increase public participation in planning. Transparent data visualization using dynamic maps, real-time indicator displays in public spaces, and augmented reality have powerful potential to influence behaviors and perceptions. Integrating the study’s behavioral insights with Shanghai’s smart city drive can unlock synergies between technology innovation and grassroots engagement around sustainability. Sustainable urban design in urban spaces presents complex challenges due to the interplay of human environmental behavior with dynamic physical and social indicators. To design more livable urban spaces, a mixed-methods approach that incorporates both qualitative and quantitative data can be employed as cities continue to evolve. The quality and livability of urban spaces are dynamic indicators that encompass physical conditions, aesthetics, comfort, and safety. Human environmental behavior, on the other hand, involves citizens’ perceptions of the environment and their actions regarding the use of urban spaces [
6,
7]. Despite the proliferation of new urban spaces in Shanghai, there is a lack of behavioral research that evaluates their effectiveness. To address this gap, a mixed-methods study that combines dynamic indicators and environmental behavior metrics could provide actionable insights.
Table 1 offers an example of physical indicators that could be measured using established metrics.
Evaluating Shanghai’s dynamic urban spaces through a mixed-methods approach incorporating both quantitative dynamic indicators and qualitative environmental behavior surveys could identify opportunities for sustainable urban design improvements. Correlating physical conditions and human perceptions can reveal which indicators most influence citizen experiences and behavior, guiding targeted interventions. More research applying this approach across diverse Shanghai neighborhoods is warranted in order to develop an evidence base for actionable urban design strategies.
The analysis of
Table 3 shows the correlation between dynamic indicators of urban spaces and residents’ environmental behaviors in Shanghai’s urban environments. The case studies indicate that higher scores in vitality, accessibility, quality, and walkability correspond with more favorable environmental behaviors. Notably, Case 3 distinguishes itself with elevated scores in vitality, accessibility, quality, and walkability, indicating a lively, easily reachable, well-maintained, and pedestrian-friendly urban area. This case study also demonstrates the highest recorded environmental behaviors score. These findings underscore the significance of incorporating sustainability principles in the design and management of urban environments, as they have the potential to cultivate pro-environmental attitudes and behaviors among residents. By focusing on dynamic indicators and considering factors like vitality, accessibility, quality, and walkability, cities such as Shanghai can make strides towards the achievement of their environmental sustainability objectives while imparting valuable insights that can be applied to sustainable urban development worldwide.
5.5. Study Limitations
While the mixed-methods approach provides rich insights, certain limitations exist. Self-reported survey measures of attitudes and behaviors may contain biases. The observational samples are smaller in scale compared with the citywide spatial data. As a cross-sectional study, it represents a snapshot rather than longitudinal trends. The focus on only the inner core districts omits the fast-changing outer areas. There are also inherent uncertainties in modelling complex urban systems using proxy indicators. In terms of methodology, the GIS mapping could incorporate more real-time tracking data and three-dimensional modelling to capture greater dynamism. The behavior observations were conducted during daytime, omitting nighttime spaces. The surveys under-represent migrant populations who may interact with public spaces differently. There are additional behavior outcomes like energy consumption that were not measured. As Shanghai is undergoing rapid transformation, periodic restudying is needed to track spatiotemporal changes. As dynamic indicators and citizen technologies evolve, the mapping techniques can be updated with new data sources and analytics. Expanded sampling and observation periods will increase research rigor over time. Comparative studies with other Chinese and global cities are required to validate wider generalizability of the findings. Observational data collection adhered to unobtrusive public space protocols without intruding on privacy. Geographic data were appropriately aggregated and anonymized in order to remove identifiers. All collected information is securely stored and is not shared externally without permission. Relationships with government agencies were maintained with full transparency and independence. Several works [
46,
47,
48,
49,
50,
51,
52] have shown a variety of topics related to sustainable urban development and smart cities. They provide insights into strategies for building resilient and livable cities, assessing urban mobility policies, utilizing machine learning for spatial analysis, integrating the environmental dimension for urban sustainability, and promoting the economic sustainability of residential buildings. These studies also offer critical reviews of district-scale energy performance analysis and positive energy district approaches, highlighting their potential for decarbonization, their contribution to the ongoing conversation about sustainable urban development and their provision of valuable perspectives and approaches from which to achieving more resilient and livable cities. Numerous studies conducted by different researchers have explored a wide range of topics, encompassing the integration of building information modeling and life cycle assessment for sustainable construction, the role of natural resources and green innovations in the Chinese economy, and the influence of institutional investor ESG activism on corporate green innovation [
53,
54,
55,
56,
57]. Furthermore, investigations have been conducted on various subjects, including credit rating algorithms, rural rooftop photovoltaics, urban heat prediction, and material stock analysis of urban roads [
58,
59,
60,
61,
62]. Additionally, research has focused on examining decoupling strategies by which to mitigate the urban carbon footprint, enhance spatial accessibility of healthcare services, and optimize energy-efficient transportation scheduling [
63,
64,
65,
66,
67]. Other areas of study involve low-carbon patent applications, the analysis of the spatial network structure of ethnic regions, and the assessment of urban heat islands’ impacts on thermal comfort [
68,
69,
70,
71,
72]. Moreover, studies have been conducted to identify and implement strategies for mitigating urban heat islands and improving thermal comfort. These strategies entail urban greening initiatives, such as expanding the number of parks and green spaces, adopting cool roof technologies, and prioritizing shading and natural ventilation in urban planning practices. By addressing the underlying causes of urban heat islands and employing effective mitigation measures, cities can establish more pleasant and habitable environments for their residents, thereby mitigating the adverse effects of elevated temperatures on human health and wellbeing. The research conducted on urban heat islands and thermal comfort in the United States offers valuable insights and guidance to urban planners and policymakers in formulating strategies aimed at creating sustainable, resilient, and thermally comfortable cities [
73].
6. Conclusions
This study introduces an innovative framework with which to analyze the intricate relationship between dynamic indicators of the built environment and pro-environmental behaviors, utilizing hybrid methods and geospatial analysis. By examining the correlations between mapped patterns, observed behaviors, and survey data, it offers compelling evidence of the connections between public space accessibility, vitality, quality, and efficiency, and various outcomes such as transportation choices, green space utilization, civic engagement, and more. However, the strength of these relationships is highly dependent on the specific cultural and social context, where attitudes and social norms play pivotal roles as bridges between environmental conditions and individual actions. A key finding highlights that, while advanced sustainability infrastructure is crucial, it alone cannot drive significant changes in deeply ingrained habits without broader awareness and active participation. The study emphasizes the potential to leverage neighborhood assets through grassroots engagement and social marketing strategies. By activating these approaches, communities can encourage sustainable lifestyles and behaviors among residents. These findings provide valuable insights and guidance for planners and designers in configuring and activating public spaces to foster sustainable lifestyles. By incorporating the principles highlighted in this study, urban planners and designers can create environments that encourage pro-environmental choices, facilitate community engagement, and promote sustainable living. The present study investigates the correlation between dynamic indicators and environmental behaviors in urban environments in Shanghai. The analysis includes four distinct cases, each characterized by varying levels of vitality, access, quality, walking, and their corresponding impact on environmental behaviors. Case 1, which consistently receives high scores across all indicators, demonstrates a substantial positive effect on environmental behaviors (90%). Case 2, with slightly lower scores for vitality, accessibility, and walking, exhibits a decrease in environmental behaviors (80%). In contrast, Case 3, featuring high scores across all indicators, reveals an increase in environmental behaviors (95%). Case 4 shows moderate scores, resulting in an environmental behavior rating of 85%. These findings highlight the significance of dynamic indicators in shaping residents’ environmental behaviors, with higher scores indicating a more pronounced positive impact. Dynamic mapping utilizing emerging big data sources emerges as a powerful tool for identifying issues, tracking impacts, and involving citizens in the co-creation of sustainable cities. As urbanization intensifies globally, the framework developed in this Shanghai case study can inform similar behavioral research in diverse urban contexts. This research advances an interdisciplinary approach that integrates spatial science, environmental psychology, data analysis, and planning theory, enriching our understanding of cities as intricate human–environment systems. This represents an initial stride toward a more precise and comprehensive paradigm for urban sustainability, emphasizing the experiential dynamics of everyday spaces. This lays the foundation for the longitudinal analysis of behavioral trends, comparative research across cities, and the testing of planning interventions. As urbanization continues to accelerate worldwide, coupled with the challenges posed by climate change, comprehending the rhythms of urban life becomes increasingly vital. Constructing dense yet livable and vibrant yet sustainable metropolises necessitates a harnessing of the pulse of urban dynamism. In recent years, sustainability has emerged as a significant concern for cities globally, given the rapid pace of urbanization. Consequently, it is imperative for cities to adopt sustainable development strategies that reduce their environmental impact and enhance community resilience. A key challenge in promoting sustainable development lies in understanding the intricate interactions between the built environment and human behavior. While cities can implement various environmental policies and infrastructure, their efficacy ultimately hinges on the actions and decisions of individuals. A city may construct a network of bike lanes to encourage sustainable transportation through cycling; however, if people continue to predominantly rely on cars, the infrastructure will fail to achieve the desired effect.


