Abstract
This research tested whether mycorrhizae can rejuvenate the water quality and pollinator functions of degraded riparian forested buffers (RFBs) in agricultural landscapes while facilitating indigenous Abenaki access to ancestral lands. Two plots within a degraded RFB were restored with a multi-functional plant community, one plot inoculated with commercial mycorrhizae and the other without. A control plot remained in a degraded state dominated by the invasive shrub Rhamnus cathartica. The restoration palette of 32 plants included 28 species useful to the Abenaki, representing opportunities for phosphorus removal through harvesting. Monitoring data from 2020 to 2023 indicated consistently greater plant diversity in the restored plots, with 58 newcomers appearing. Although the total phosphorus (P) decreased over time in all the treatments, the greatest decrease was in the uninoculated plot, likely due to pathogenicity from the commercial inoculant or the spatial variability of soil and light. The biomass P of five plant species differed among the species but not among the treatment plots. Nonetheless, Abenaki harvesting removed P and can be an effective form of phytoremediation, phytoextraction. However, this research revealed trade-offs between P mitigation, indigenous use, and pollinator functions of the RFB. Fostering higher biodiversity, Indigenous land access, and P mitigation are important solution-oriented aims to balance when restoring degraded RFBs.
1. Introduction
During the United Nations Decade of Ecosystem Restoration, creative approaches to mitigate planetary crises—biodiversity, climate change and natural resource degradation—are essential to foster the sustainability of ecosystem services. The current extinction of insects and specifically pollinator species exemplifies the threat to biodiversity [1,2,3]. At the same time, water quality is threatened worldwide [4] by the diversion of water to human uses [5] and excessive phosphorus (P) loading [6,7,8]. Eutrophication by P stimulates algae growth and sometimes toxic cyanobacterial blooms [9,10,11], threatening animal and human health [12]. Ecological engineering and restoration of upland agroecosystems can help recover and upcycle P before it causes eutrophication, while strengthening food and medicine security [13]. Restoration is thus an integral element of managing agriculture more sustainably.
Efforts to improve and protect the water quality of Lake Champlain, known as Pitawbagok to the Original People, received low marks for removing P pollution with agricultural best practices [14]. This lake serves as an important water resource for neighboring jurisdictions in Vermont, New York, and Quebec. Agriculture, a pivotal part of their economy, is also the largest contributor of nonpoint source pollution (NPS) [15] and accounts for an estimated 41% of P loading for the Vermont portion of the Lake [16]. Most P enters water bodies as NPS through overland flow, stream bank erosion of legacy P [17], and to a lesser extent, through leaching from manure amendments when soils become saturated with P [18]. The inherent lag time between the implementation of P mitigation efforts and the tangible improvement of water quality makes it difficult to evaluate the effectiveness of BMPs and requires long-term monitoring [19,20,21].
Best management practices (BMPs) such as riparian forest buffers (RFBs) can reduce P loading by intercepting and retaining sediments eroded from agricultural lands. Well-managed RFBs are regarded as green infrastructure strategies and effective means of mitigating nutrients in Northeast America’s increasing stormwater runoff [22]. RFBs provide other ecosystems services such as protecting aquatic and terrestrial habitats, maintaining lakeshore and floodplain stability, preserving wetland functions [23,24,25], and providing biodiversity and pollinator habitat [26,27,28,29].
Although RFBs provide a broad suite of ecosystem services, many are degraded by the lack of regenerative design and management, which increases susceptibility to agricultural runoff and exotic plant invasions. Restoration of the multi-functional ecosystem services of degraded RFBs requires native polyculture plant palette design [30,31,32,33] and management strategies such as biomass removal via coppicing. RFB guides recommend harvest strategies to remove nutrients and prevent re-release upon senescence [34]. However, the guidelines do not consider a key set of ecological and social justice principles and opportunities. First, the well-established relationship between plant–mycorrhizae symbiosis and P uptake is not leveraged in green infrastructure and restoration work [35,36]; the same symbiosis can also improve several ecosystem services, such as nutrient retention and floral diversity [37,38,39,40]; parameters for phytoextraction, such as timing and amount of harvest, are not well defined; the knowledge of Indigenous people in tending these ecosystems is ignored and the injustice inherent in the loss of their lands during colonization is not often acknowledged or remedied. Our overarching objective was to test the utility of mycorrhizae in restoration efforts with a multi-functional plant palette. Specifically, our research aims were to investigate if restoring degraded RFBs with native polycultures and mycorrhizae would mitigate legacy P and improve pollinator habitats by promoting multi-synusial, flowering landscapes. A third aim was to apply ancestral, Indigenous knowledge of sustainable harvest and facilitate rematriation (returning land to its original stewards and inhabitants) [41,42] by strengthening partnerships between Indigenous Abenaki stakeholders and researchers.
Our restoration experiment involved comparing the effectiveness of biodiverse restoration plantings with and without mycorrhizal inoculation within a degraded RFB dominated by R. cathartica. We hypothesized that the mycorrhizally inoculated restoration plot (Table 1) would be more diverse and effective in P mitigation than the uninoculated restoration plot. We report on four years of data on soil and plant uptake of P and biodiversity from this myco-phytoremediation riparian restoration experiment. Although four years of monitoring is too short to determine the long-term success of the restoration, the experiment revealed tradeoffs among the ecological (P mitigation and biodiversity) and social objectives (rematriation via establishing indigenous harvest ways).

Table 1.
Plant palette. Designed and installed for the two restored plots, indicating the number, flowering time, pollinator species hosted, type of mycorrhizal symbiont, and Abenaki use of the plants: m, medicinal; e, edible; a, artisanal; c, ceremonial; and u, utilitarian. Two species listed as flowering in February have catkin or fruits available for pollinators. All the species are native to VT, except naturalized Panicum virgatum [43,44,45,46,47,48,49,50,51,52,53,54,55,56,57,58,59].
2. Materials and Methods
2.1. Study Site
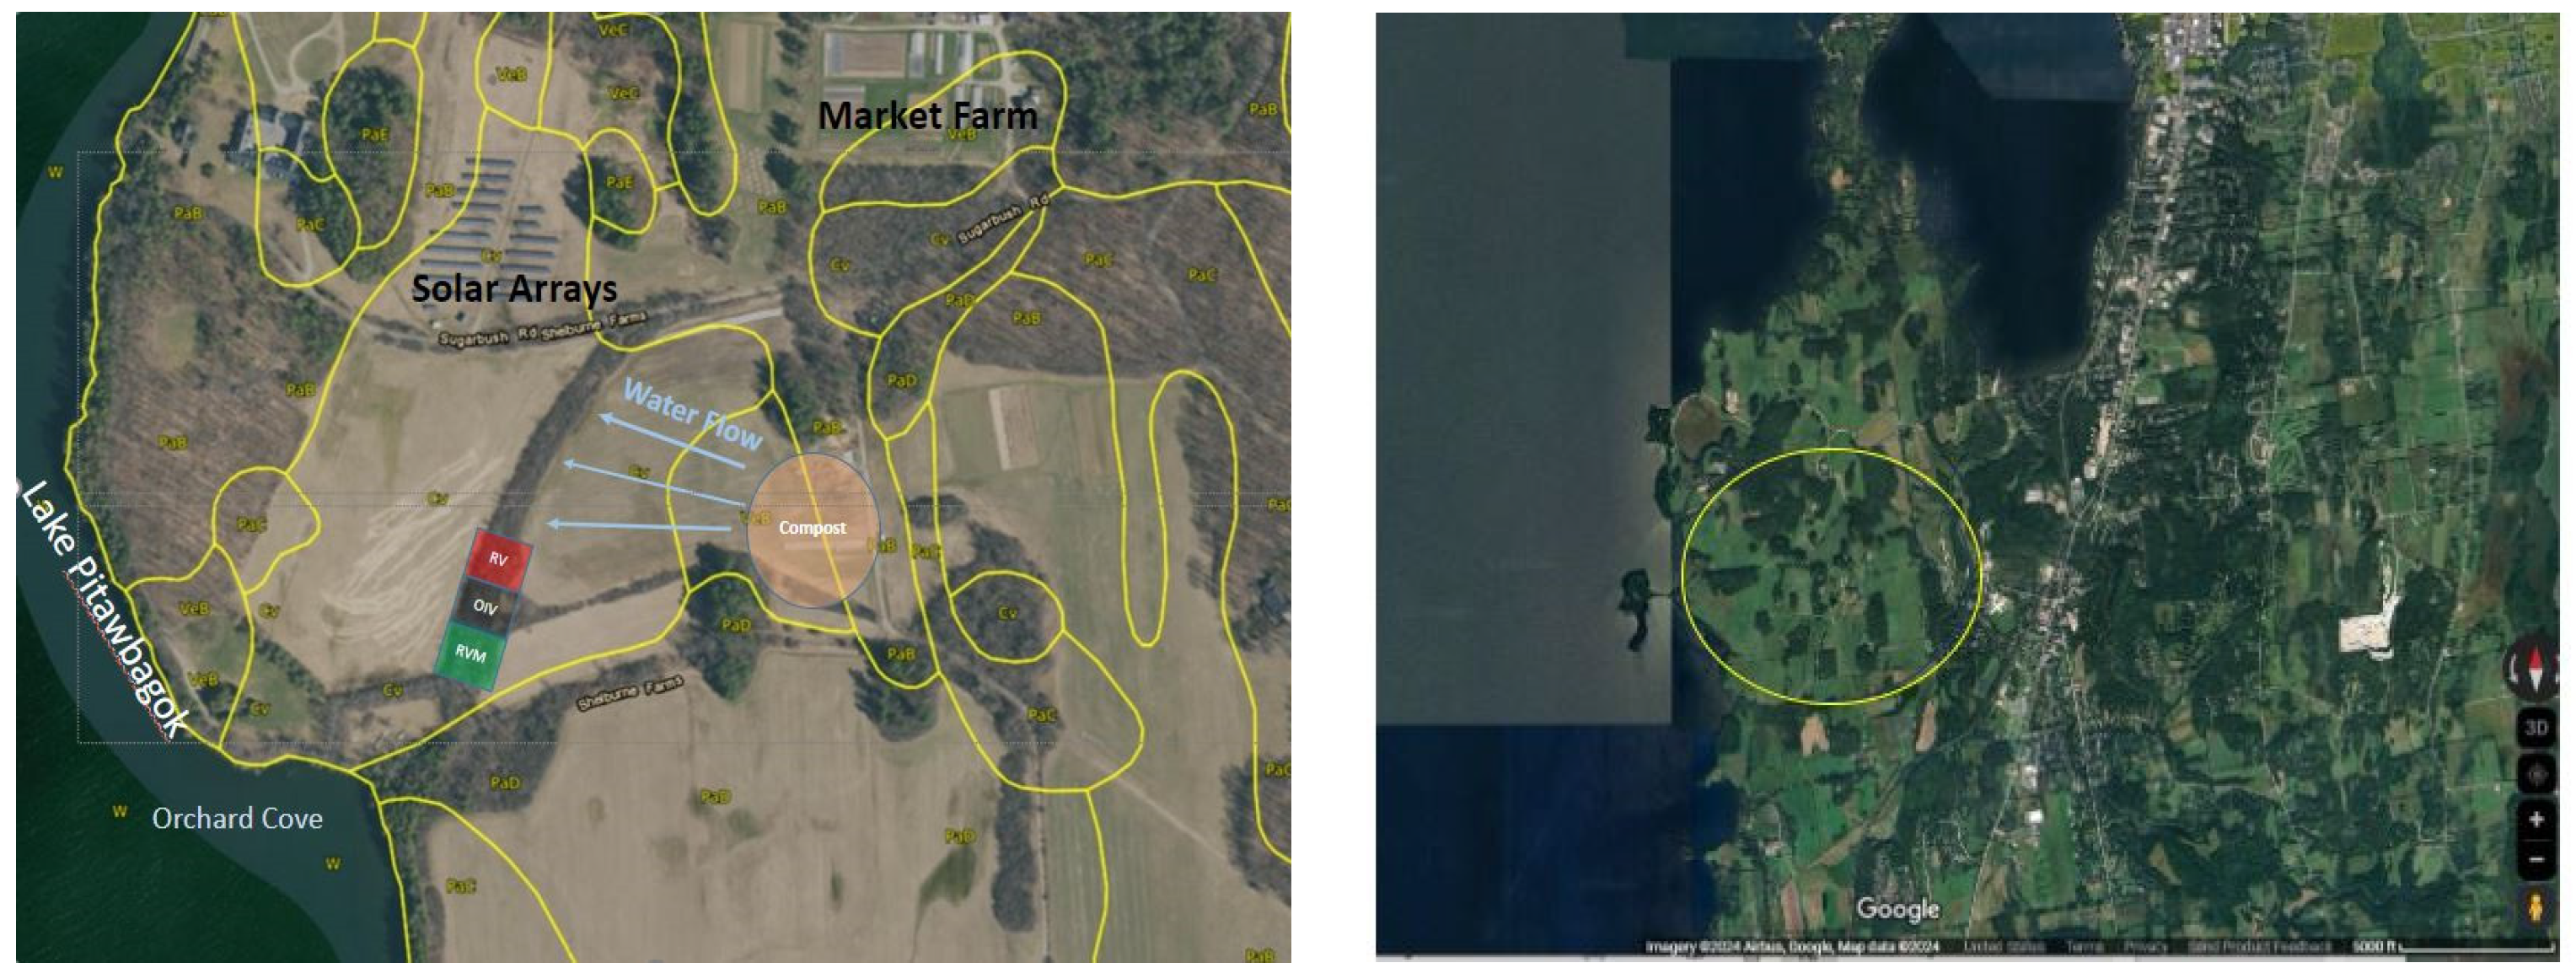
The study site is located at Shelburne Farms (44.390708, −73.272614 to 44.389190, −73.274084) within the bioregion called N’dakinna by the Indigenous Abenaki. This includes Maine, New Hampshire, Vermont, parts of Massachusetts and southern Canada up into the Maritimes [60]. The soils at the site are poorly drained, highly erodible, but important agricultural soils (glaciolacustrine Covington silty clay loam and very-fine mixed active mesic Mollic Endoaqualfs [61,62]). This soil is in hydrologic group D [63] and an old tile drain system—whose position is not well established anymore. The site is further drained by two channels discharging into Lake Champlain called Orchard Cove (Figure 1). These soils are highly erodible yet considered farmland of state-wide importance when drained [61].
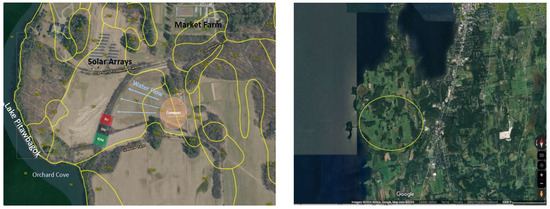
Figure 1.
Study site at Shelburne Farms and Orchard Cove. Image on the right shows an overview of the surrounding area in Shelburne, VT, with the yellow circle highlighting the farm and outflow into Orchard Cove. Image on left shows a detailed image of the farm features and study site on the drainage way amidst the riparian forested buffer (Google Maps, aerial view, accessed 8 March 2024).
The RFB at the site is still impacted by P loading from an active 50-cubic-yard compost facility located upslope and legacy P that accumulated during more than two centuries of colonial agriculture [36]. Consequently, the soluble reactive phosphorus (SRP) entering the lake from the drainage way in the spring of 2021 exceeded Lake Champlain’s water quality standard 18-fold [64]. Before restoration in May 2020, the mean total soil phosphorus (TP) concentration was 875.87 mgP/kg and the mean pH was 5.29. The canopy at the riparian area at the site was dominated by a dense stand of Rhamnus cathartica, with native Acer spp. (maple) and Fraxinus spp. (ash) interspersed.
2.2. Restoration Design
A diverse plant community was designed to match the native vegetation, and its ecosystem functions, likely to have been in N’dakinna prior to European settlement [36]. The choice of plants was made from observations of intact riparian areas in Vermont. The final palette comprised 32 native, riparian plants. The flora included 17 herbaceous, 10 tree, and 5 shrub species (Table 1) to meet the following functional criteria: water quality function from fast growing, harvestable species with mycorrhizal mutualisms, and flower constancy for pollinator habitats (March–November). Abenaki elders (C. McGranaghan, C. Megeso, H. LaFrance) identified 88% of the plant species to have ceremonial, edible, medicinal, artisanal, or other uses. This was important because the more the Abenaki could utilize these resources, the better two purposes could be met: phytoextraction of P and ancestral land access facilitation.
2.3. Implementation of Restoration
We installed three research plots in June 2020 [36]. Each of the 6.4 m wide plots was divided by the drainage channel. To the west, there was a small 1.2 m wide area (called BW from here on) and the plot area to the east of the channel was 5.2 m wide (called BE). One plot remained unaltered, with R. cathartica as the dominant species (OIV). The other two were restored with vegetation without (RV) and with mycorrhizae (RVM). To prepare the restoration plots, R. cathartica was cut in winter 2020 at belt height (0.91 m), and all the stumps more than 1.20 m from the drainage way were removed manually. All the native vegetation on the site were left in the plots. Prior to planting, bare root trees, shrubs, and plants were potted in low, 0.16% P pasteurized compost (Vermont Compost, Montpelier, VT, USA) and left to equilibrate for 6 weeks before planting. The plants and wetland herbaceous seeds for the RVM were inoculated with a commercial mycorrhizal mix (Table 2) (Mycorrhizal Applications, MycoApply EndoEcto Mix, Grants Pass, OR, USA), whose arbuscular and ectomycorrhizal (AMF/ECM) constituents purportedly made associations with plant species in the palette (Table 1) [43,65,66,67].
Table 2.
List of AMF and ECM species in the Mycorrhizal Applications Mix applied to the seeds and species planted in the RVM. It was discovered after installation that some of these * do not associate with plants in the palette [36].
The dry summer after the installation required weekly irrigation. In year 2, the plots were irrigated twice, and in year 3, no watering was required due to the ample rainfall. Hand removal of opportunist species was required annually, including cutting regrowth from R. cathartica stumps left near the drainage three times in two seasons. This efficient non-chemical method caused a 90% death rate (J. Rubin, 2 observation seasons 2022, M. Bald 2020, personal correspondence). In early spring 2, 3, and 4, scything wild grasses maximized the shrub and tree growth.
2.4. Sampling and Analysis
2.4.1. Soil, Water, and Plant Phosphorus Sampling
On each sampling date, as detailed in Table 3 for all the sampling types, soil was collected from the top 10 cm at 5 randomly selected locations in the BE section of each plot, combined in a clean bucket, mixed thoroughly, covered, and processed soon after. From each bucket, soil aliquots were taken for determining the TP, Mehlich-3-extractable P, water-extractable soluble reactive phosphorus (WEP-SRP, years 2 to 3) and mycorrhizal indicators. The first year, we used 6 lysimeters installed to a depth of 30 cm in each plot to collect soil water. However, few of the lysimeters yielded water. For this reason, we switched to a soil-based measure of SRP in which water was used as the extractant of P (water-extractable phosphorus-soluble reactive phosphorus (WEP-SRP)).
Table 3.
Data sampling parameters, dates, and replicates * due to the limited number of vigorous plants. ** Data can be found in Figures S1 and S2.
In the first year, no plant harvest occurred to allow the plantings to acclimatize with limited disturbance. In the study’s second and third years, we sampled Salix petiolaris (meadow willow) (from RVM and RV) and R. cathartica (from OIV). The plants were coppiced according to Abenaki practices, removing only 1/4 of the population. In the third year, the species harvest was expanded to include shoots of Cornus sericea (Red Osier Dogwood), Viburnum dentatum (Arrowwood), and fruit of Sambucus canadensis (Elderberry). In the fourth year, Rubus leucodermis (Black-Capped Raspberry) fruit appearing in the treatment plots was harvested for preliminary data assessment of the P uptake. While horticultural recommendations suggest late winter for coppicing, we harvested in mid-August before senescence to remove the biomass P prior to P translocation into roots. This ensured maximum P removal [36].
2.4.2. WEP-SRP Analysis
A total of 25 g of fresh soil was air dried. Then, 2 g of air-dry soil was sieved (2 mm mesh), put in a 40 mL centrifuge tube with 20 mL of distilled water, shaken at 25 rpm for one hour on a reciprocal shaker (New Brunswick Scientific, Excella E1 Platform Shaker, Edison, NJ, USA), centrifuged at 5000 rpm on a Sorvall ST 16 centrifuge (Thermo Scientific, Waltham, MA, USA) for 10 min and filtered through a 0.45 μm nylon, 33 mm syringe membrane filter (Fisher brand, Suwanee, GA, USA) into labeled centrifuge tubes. The extracted sample was submitted to UVM’s Agriculture Environment Testing Lab (AETL), where the WEP-SRP concentration was determined colorimetrically on a Lachat Quick Chem Series 2 (Hach, Loveland, CO, USA) (US EPA, 2015 [68]) at a wavelength of 880 nm.
2.4.3. Total Phosphorus (TP) Analysis
A total of 1.50 g of sieved soil was added to a labeled scintillation vial and submitted to AETL. There, it was extracted using microwave-assisted digestion utilizing nitric acid and subsequently analyzed by ICP-AES (Avio 200, Perkin-Elmer Corp., Shelton, CT, USA).
2.4.4. Mehlich-3-Extractable P Analysis
A total of 50 g of the composited soil from each plot was placed in labeled clean plastic bags and analyzed at the University of Maine’s Soil Testing lab for Mehlich-3-extractable nutrient analysis (Wolf, A., Beegle, D., 2009 [69]).
2.4.5. Plant P Analysis
Plant biomass was prepared by drying at 49 °C for 7 days. The dried samples were ground into a fine powder, which was extracted by microwave-assisted acid digestion in nitric acid [68]. The biomass P was then determined as the product of the P concentration and the dry weight of the harvest plants.
2.4.6. Plant Diversity Determination
The 2020–2023 plant richness was determined by sampling vegetation in four randomly placed transects in the larger portion (BE) of each treatment plot running parallel to the waterway. All the plant species occurring in each transect were noted and the richness of each plot was determined as the total number of species in the four transects. In 2023, to determine the plant community after four years, we surveyed the entire plots for any plants that may not have been found along the transects in the BE or omitted because they grew in BW.
2.4.7. Mycorrhizal Root Colonization Determination
To determine whether there was a difference in mycorrhizal colonization among the plots, we determined the root colonization for S. petiolaris and R. cathartica in year 3. In year 4, this was expanded to include S. canadensis roots. Root colonization was determined through a modified protocol first developed by [70]. Carefully gathered roots from each species with diameter of 0.5–1 mm were washed and placed in 10% KOH solution, autoclaved (Consolidated Stilts and Sterilizers, Boston, MA, USA), rinsed, acidified with 1% HCl and stained with Acid Fuchsin. After being destained in water, they were stored at 4° C in water for 7 days before being examined under a compound microscope (Olympus CX41, Olympus Corporation NY, New York, NY, USA). For each species and plot, the roots were mounted with Polyvinyl-Lacto-Glycerol on a labeled slide. Each slide received four root segments. Ten randomized fields within each slide were selected to examine for the presence of AMF structures (arbuscules, vesicles or spores). The percent of colonization, C%, was calculated as
where F is the number of fields that showed colonized roots. The mean colonization for each species in each plot was calculated as the average colonization of the three slides.
2.5. Statistical Analysis
The soil TP, Mehlich-3-extractable P, WEP-SRP, plant P uptake, and mycorrhizal colonization were analyzed via a General Linear Model (GLM) with the treatment and, in some cases, date as predictors for the P concentrations or mycorrhizal counts, respectively (Table 3). Because of the pseudo replication, p values only reflect the comparison of the plot means based on in-plot variability. If Levine test’s model assumptions were not met, the data were log transformed prior to non-parametric analysis. Summary statistics (using Graph Pad Prism 9.2.0, San Diego, CA, USA) are shown in the graphs to allow comparisons with the literature values. However, the GLM was used for inference. Where the model was statistically significant (p < 0.05) for one predictor with more than two treatments, Tukey post hoc tests were used to discern individual comparisons. The analyses were conducted via SPSS28.0.0. (IBM Corp, Armonk, NY, USA). Plant species richness was calculated through summing the total number of distinct species observed across all four transects/plots and in the BW.
3. Results
3.1. Phosphorus
The success of phosphorus mitigation can be analyzed in different ways. First, a comparison of the total soil P over time provides a measure of the net mitigation, i.e., the balance between P entering the buffer and how much P is removed by processes such as plant uptake or erosion off site. Secondly, the amount of P taken up via plants, which theoretically can be removed from the ecosystem through timely harvest.
Measures like the WEP-SRP and Mehlich-3-extractable P vary strongly during the growing season. Due to this variability, no statistically significant differences were detected in the WEP-SRP or Mehlich-3-extractable P (Figures S1 and S2).
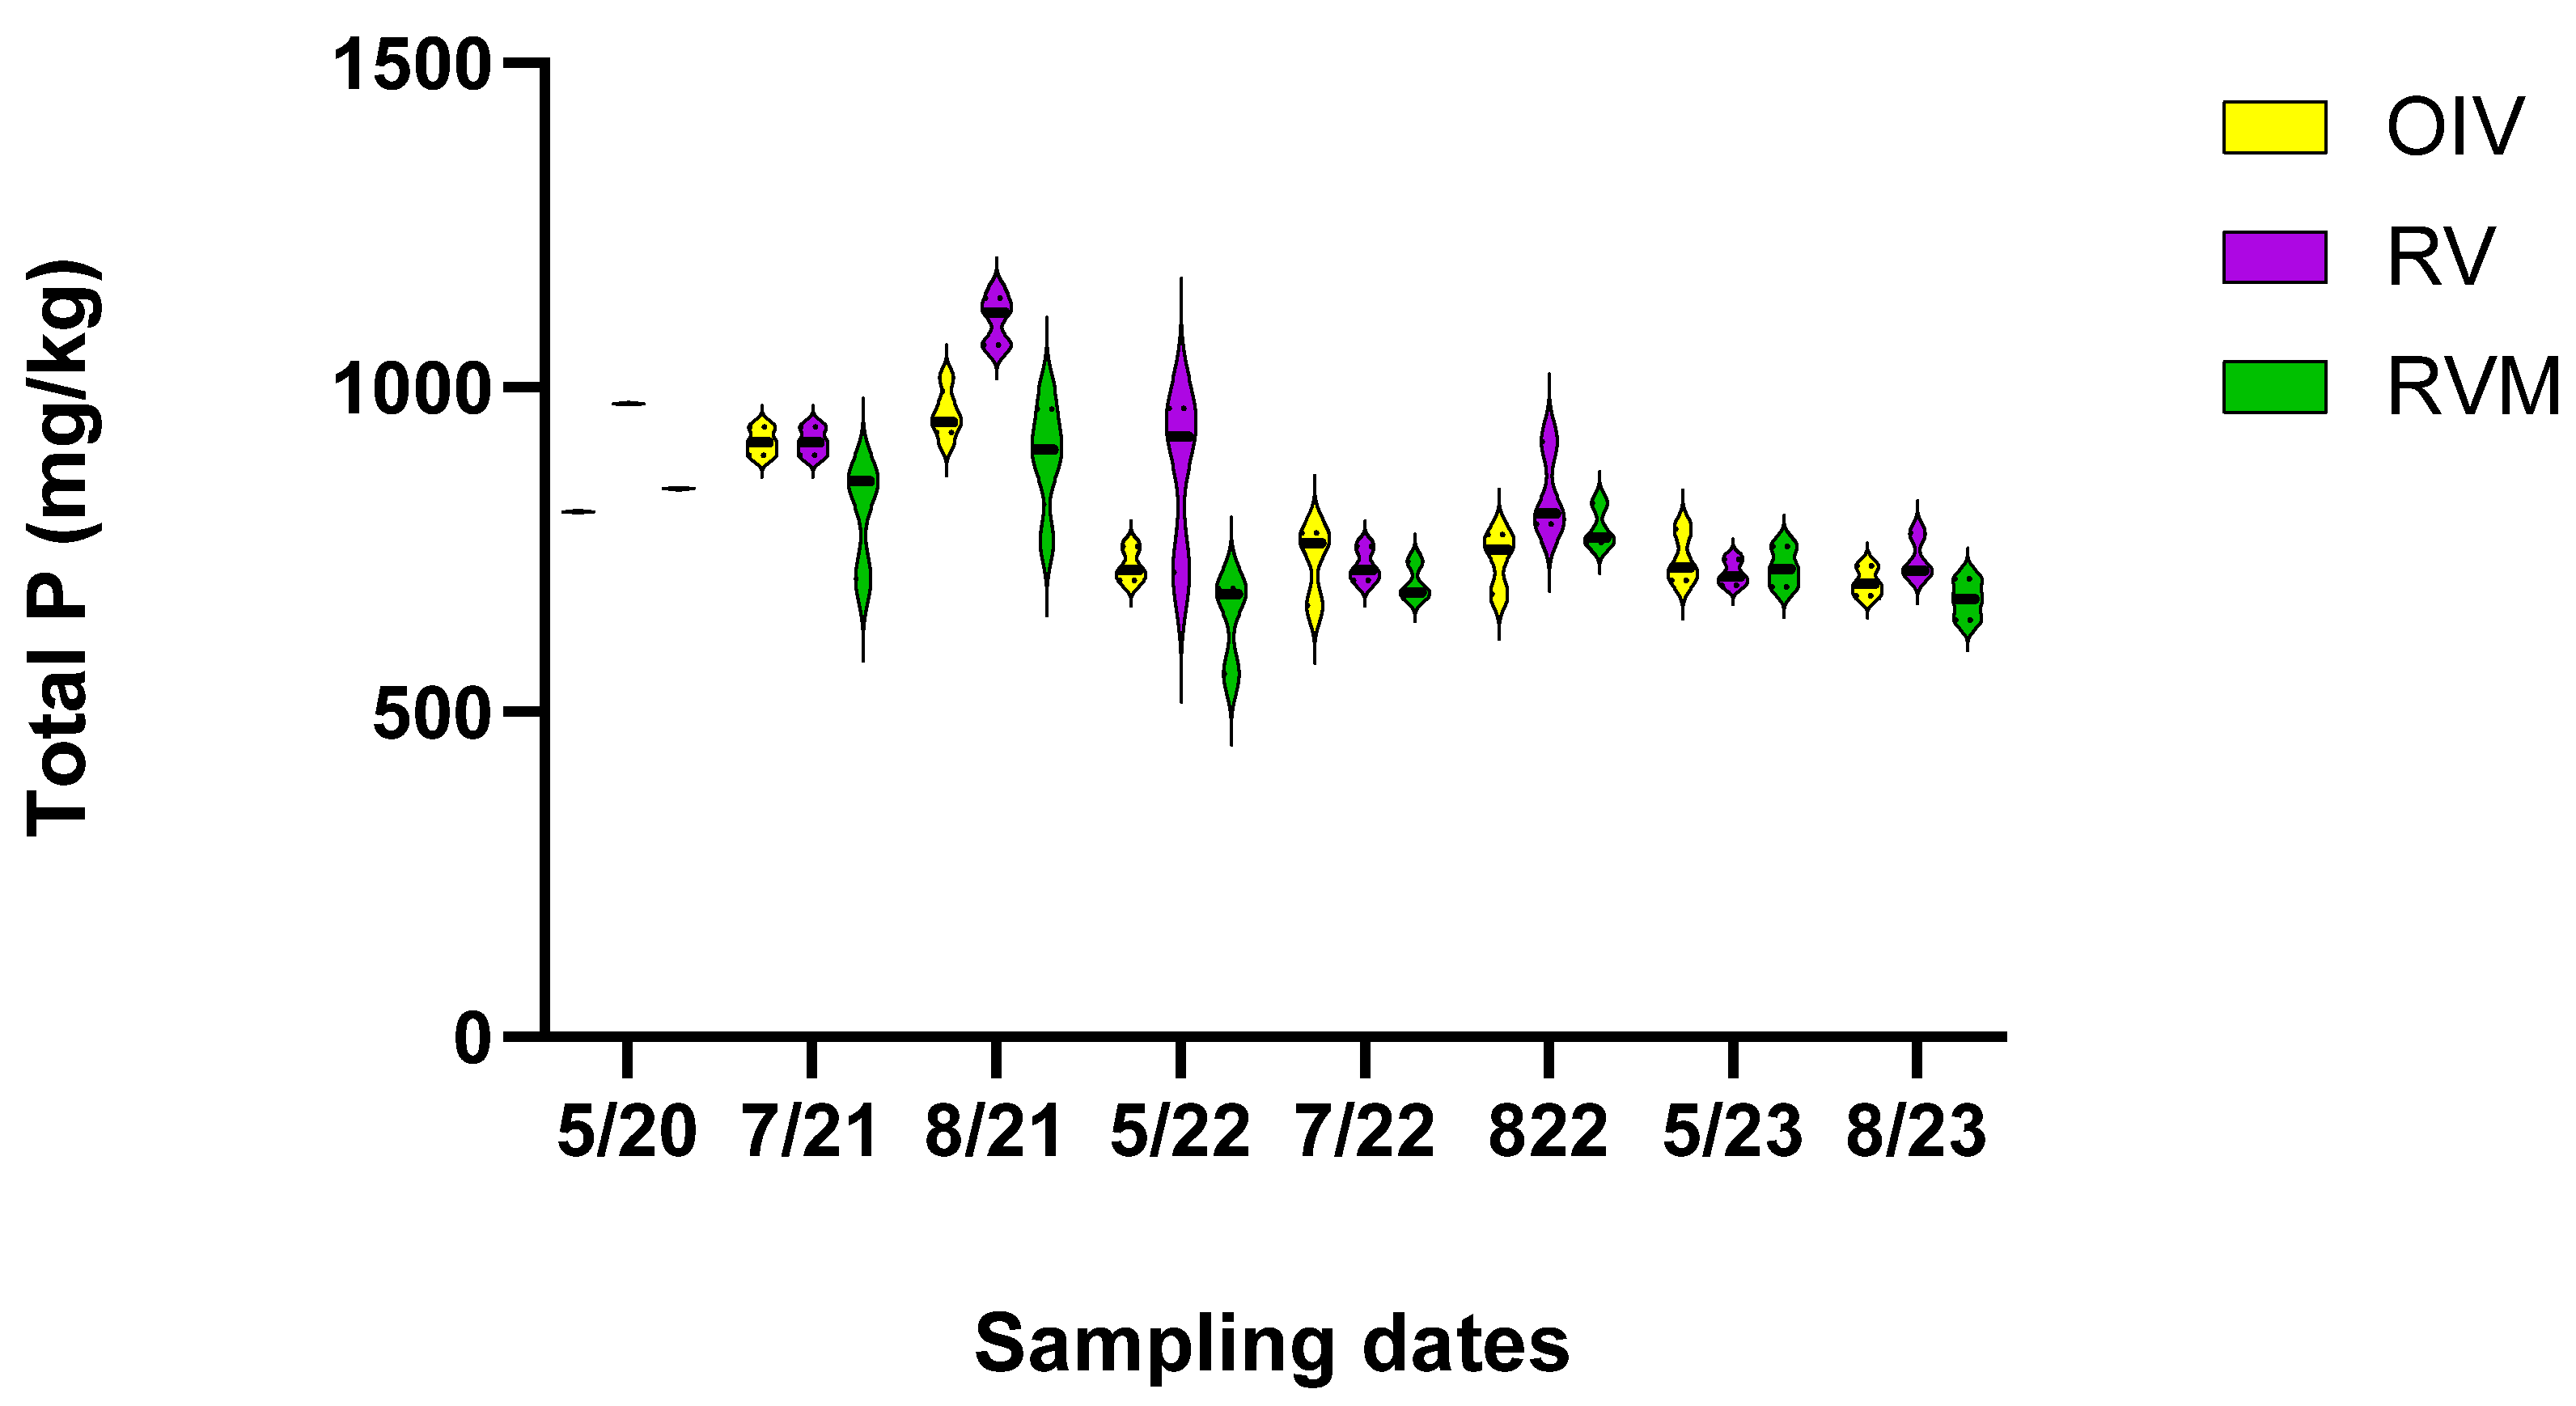
3.2. P Mitigation Indicated through TP
The GLM indicated differences among treatments and times (p < 0.001). Post hoc Tukey analysis revealed lower TP in the fourth year than in the first year of the study (p < 0.01) (Figure 2). The mean TP concentration in the soil diminished from 876 mg/kg in 5/2020 to 724 mg/kg in 5/2023, which is a 17.5% decrease when looking at the combined means of the restored plots. There were also differences among the treatment plots. The TP concentrations followed this order: RVM < OIV < RV. This may indicate that mycorrhizae were helping to mitigate P. However, the decrease over time was not uniform across the plots. The greatest change was between May 2020 and May 2023 in RV, which decreased by 36.58%, whereas RVM and OIV only decreased by 16.70%, and 9.88%, respectively. Our hypothesis that RVM would have the largest decrease in TP was not proven true for the four years that we monitored the plots since the restoration.
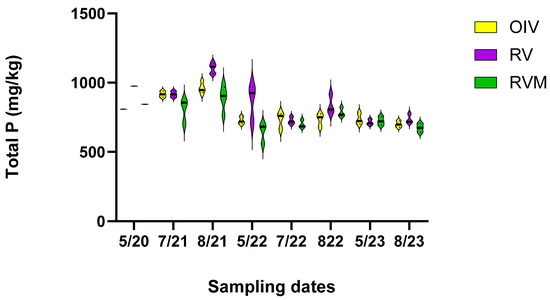
Figure 2.
Total soil P concentration across the sampling dates over four years for the three treatment plots.
3.3. Plant P Concentrations
The P concentrations varied between the plants and between the plant parts. The berries of S. Canadensis and R. leucodermis had greater P concentrations than the woody tissues of other species. The order of P concentrations from berry to woody shrubs from highest to lowest P concentration was S. canadensis > S. petiolaris > C. sericea > R. cathartica > V. dentatum.
The mean P concentrations across all the species between the treatments were 1967.41 (mg/kg) for OIV, 1813.71 (mg/kg) for RV, and 1827.14 (mg/kg) for RVM. There was no statistically significant difference in the P concentrations between the treatments (p = 0.951), but for the species, there was (p < 0.001), largely driven by the difference between berry and wood tissue. The only difference between the woody stems was for V. dentatum and S. petiolaris (p = 0.034). No other significant differences between alike plant parts were detected.
3.4. Biomass—P
There was no statistically significant difference in biomass P between the treatments (p = 0.951), but there was among the species (p < 0.001) (Table 4). Post hoc analysis revealed differences between the fruits and woody biomass, as one would expect. The woody biomass-P was lower in V. dentatum than in S. petiolaris (p = 0.034) and C. sericea (p = 0.054). The amount of P removed by elderberries (S. canadensis) was similar to the amount removed by S. petiolaris, even though the elderberries had almost double the P concentration, suggesting that fruit harvest is also an effective way to remove nutrients.
Table 4.
Plant P concentrations and biomass P pooled across treatments in 2023 for R. cathartica, S. petiolaris, S. canadensis, V. dentatum, C. sericea, and R. leucodermis. Percentage differences compare RV with RVM. Positive values indicate P values greater for RVM, negative values indicate the reverse.
3.5. Plant Biodiversity
Plant richness (Figure 3) is a measure of how many species are in a given area. When monitored over time, it indicates the net immigration into the restored plots.
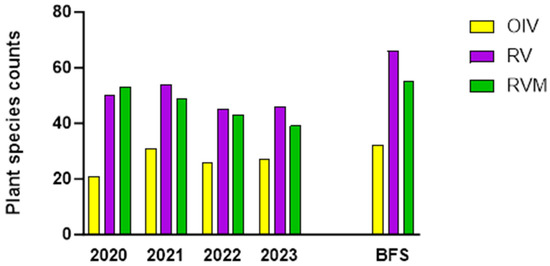
Figure 3.
Plant species counts (richness) from monthly transect monitoring from 2020 to 2023 in BE and for the entire plots (BFS = BE + BW) at the end of the fourth year.
Thirty-two plant species were planted in RV (uninoculated) and RVM (inoculated) in early spring of 2020. Figure 2 highlights the increase in species from late spring 2020 to late summer 2023. A considerable number of newcomers were detected by the transect surveys even within the first year. Overall, there were 32 new species in RVM and 33 in RV after one year. After four years, 58 new species (Table S1) were found when the species counts were combined for both restored plots, a 70% increase over the restoration species planted.
Of the 32 species, only 28 could be identified after a year because 4 grass species lacked visible seeds, which is essential for the identification of grasses. This lack of grass seeds may be due to site maintenance strategies of scything grasses in early spring to ensure maximum sunlight to trees and shrubs. Of the 28 identifiable species, 22 species survived. A total of 3 of the 28 planted species (Onoclea sensibilis, Juncus effusus, Verbena hastata) did not appear in either restored plot, likely due to their hydric soil requirements and the first summer’s drought conditions. The plant communities differed between the two restored plots in terms of abundance and robustness (plant vigor). The planted species in RV were more vigorous (visually taller and denser vegetation) than in RVM.
In addition, there was a greater number of newcomers in RV than in RVM. In the first year, the numbers of plant species almost doubled in both restored plots: 31 new species appeared in RV and 30 appeared in RVM. By the fourth year, there were 58 new species in the entire plots (BE + BW) when combining the newcomer counts for RV and RVM (Figure 3). However, RV had 42 new species and RVM only 29. Out of the 58 plants that migrated, 51 are culturally relevant to the Abenaki (though interestingly, many were naturalized European species that Abenaki incorporated into their practices) and 51 host pollinators (S. Table 1).
Plant biodiversity is not the only biotic change that occurred during this restoration. The changes in above-ground biodiversity in the restored plots also included the appearance of several saprophytic fungi (Table S1): Trametes versicolor, T. pubescens, Cerrena unicolor, Daedaleopsis confragosa, Merulius tremellosus, Mycena galericulata, Cerioporus squamosus.
3.6. Mycorrhizal Colonization
Figure 4 shows the mycorrhizal colonization of the roots in three species. In all three plots, roots were colonized. From our limited exploration of the roots, S. canadensis had higher inoculation than S. petiolaris. There was more mycorrhizal colonization of S. canadensis in the RVM plot. Mycorrhizal inoculation was not different in S. petiolaris across both restoration treatments. R. cathartica roots were also colonized by mycorrhizae.
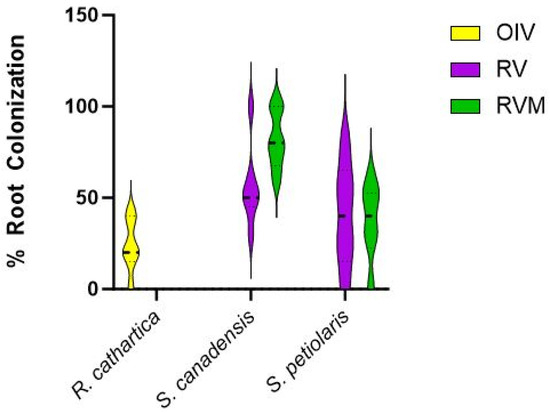
Figure 4.
Root colonization (percent of root) for R. cathartica, S. canadensis, and S. petiolaris in the three treatment plots in 2023.
4. Discussion
4.1. Phosphorus Mitigation
After four years, we found that only one soil indicator suggested an effect on P mitigation: a reduction in the total soil P concentration was observed. The rate of reduction in the soil TP was, however, most pronounced in the RV plot, which was not treated with mycorrhizae. This is not what we had expected. Our hypothesis was that mycorrhizae helped with P mitigation. We were unable to correlate this with increased plant uptake since there was no significant difference in the harvested biomass P among the treatments (Table 4). However, we did not evaluate the biomass P for all the species in the plots. Other species, i.e., herbaceous plants, may have provided considerable temporary storage up to the date when woody vegetation was sampled in August. For example, hay harvest removes large amounts of P from agroecosystems [71] and this may also be true for herbaceous species such as Hierochloe odorata (sweetgrass), which thrive when harvested every year and are sacred to the Abenaki [72].
There may be several reasons why our experiment did not show the hypothesized effect of mycorrhizae. First, the plant community in the plot restored with mycorrhizae (RVM) showed lower plant vigor. We did not assess the plant biomass production, but the plants were, according to the visual inspection, smaller and the density of the vegetation was lower than in the uninoculated plot (RV). Less P sequestered means less P taken from the soil. The lower vigor was likely due in part to a couple of large ash trees that shaded the RVM plot in the mornings, thus limiting photosynthesis for part of the day. Secondly, the mycorrhizae that we inoculated with were commercially produced and may have hindered rather than promoted biomass production and P uptake.
The commercial mycorrhizae we used were grown in the northwestern USA, and even though they were ECM/AMF matching with ECM/AMF plants, they and their microbial symbionts were not specific to the endemic plants in Vermont. Thus, these mycorrhizae might be acting more like parasites than mutualists, according to the symbiosis continuum theory [73,74]. This theory suggests that mycorrhizae not matched well with their hosts do not exchange P for the carbon (C) resources offered up by the plant. Even if the mycorrhizae species were the same, the strains in the commercial blend may not have been effective symbionts, causing negative feedback on plant productivity [75]. The mycorrhizae mix we used included the genera Rhizopogan, Pisolithus, and Suillus, which do not directly correspond to our palette’s angiosperms or the resident microbial community, thereby likely confounding nutrient cycling and plant growth (Tom Horton 2022, personal correspondence). Additionally, plant growth can be further decreased by nitrogen (N) enrichment, which fuels accelerated fungal demand for C [76].
Another mechanism that may have disrupted a mutualistic relationship between plants and mycorrhizae is associated with the agricultural land use history of the site. Frequent P additions in past agriculture and continuous monocultures may have favored AMF populations parasitic to endemic plants [77]. This hypothesis is not far-fetched, given this site’s agricultural history, which would have seen host plants typically found in riparian forests removed, which would have deprived the endemic mycorrhizae of hosts for the production of propagules. Furthermore, the substantial P amendments likely to have occurred on this land could have created unfavorable conditions for AMF establishment [36]. Plants growing in high P soils can obtain P directly from the soil [78], bypassing the fungal symbiont. One can argue that the agricultural land use history is the same for all three plots. However, some AMFs might have survived in the degraded buffer when R. cathartica dominated the vegetation. Our vegetation surveys showed that even under the R. cathartica canopy, endemic plant hosts were present, likely accounting for the root colonization in the OIV and RV plots. Those mycorrhizae would have been endemic and likely better-matched symbionts than those used to inoculate plants in the RVM plot.
4.2. Succession, Pollinator Habitat, and Utility of the Plant Community to the Abenaki
The plant richness was greater in the restored than the control plots, as one would expect. However, far from being a monoculture of R. cathartica, OIV originally hosted 19 other species, albeit at low abundance, at the beginning of the study. Sixteen additional species appeared in the control plot (OIV) by the fourth year, maybe due to opportunities created by plot edges caused by the restoration. Of these 16 newcomers, Acer spp. and Quercus spp. could only have migrated from the restored plots. However, the other 14 species could have originated from adjacent wildlands or from the restored plots where they also occurred (Rubus spp. Viburnum opulus, Circaea canadensis, Epilobium ciliatum, Solidago spp., Arctium sp., Impatiens capensis, Viola sp., Parthenocissus quinquefolia, Oxalis stricta, Elymus virginicus, Eurybia divaricate). R. cathartica is reported to host bees and flies, although we did not observe pollinator visitation on the flowers in all four years. Even so, there are several reasons why R. cathartica should be removed: its berries are known to be a laxative for birds, it uptakes little P and it has allelopathic effect on surrounding understory plant communities [79].
The large increases in new plant species in the restored plots could potentially serve a wide range of pollinator species (Table S1). However, our four-year study is at a stage just before pollinator habitation and new plant community persistence can be meaningfully evaluated. It is not yet clearly known for how long pollinator habitats can maintain themselves in these emerging “novel ecosystems” [80], often lacking responses in bee communities for five or more years [81]. High—diversity seed mixes may result in diverse floral communities like ours, but their effect on species richness may only last three to four years [82], showing most success when located near natural reserves [83]. In our study, the restored communities appear stable, with the high survival of planted pollinator species but recruitment of additional species adding some uncertainty to the outcome of succession.
4.3. Trade-Offs to Consider in Multi-Functional RFBs
The three functions of RFBs we were interested in evaluating were P mitigation, pollinator habitat, and Indigenous utility of the plantings, with rematriation of land though Abenaki harvesting as part of the mitigation strategy. Harvesting means removal of biomass and thus nutrients.
Clearly, the increased number of pollinator plants also increased the number of species relevant to the Abenaki. Both restored plots included more culturally relevant species than the intact control. Replacing R. cathartica with plants culturally relevant to the Abenaki, which also accumulate P, would ensure continued P removal. Cyclical harvesting, prior to senescence in late summer, of berry and coppicing of woody species by the Abenaki can support the early phases of rematriation and contribute to P reductions in the landscape, offering a model to overcome inequities inherent in land ownership and facilitate community-based conservation strategies [84].
This appears like a win–win strategy. Yet, there are trade-offs to be considered. When installing a restoration planting for a single reason, e.g., pollinator habitat, one may limit the value of the ecosystem service offered by the restoration planting. When estimating the amount of P that can be removed by ways Abenaki harvest from a biodiverse pollinator habitat, P removal is low. The Abenaki only harvest 1/4 of the biomass of any species to sustain the ecosystem. Utilizing data in Table 4, we estimate that the removal rates from the RFB would be between 0.1 and 0.5 kg/ha/year for RVM and RV, respectively. That is only accounting for the vegetation for which we measured the biomass P. This compares to 5–10 kg P/ha/year when harvesting a willow plantation on a three-year cyclical harvesting schedule [81,82]. If half of the buffer was planted with willow, up to 5 P kg/ha/year could be removed [85]. Yet a willow monoculture does not foster biodiverse pollinator habitats. Similarly, an elderberry orchard removes about 3.30 kg P/ha/year when harvesting all the berries, but its pollinator benefits are limited to the short flowering period.
On an annual basis, commercial willow plantations remove of the order of ten times more P than cyclically harvesting four species from these restoration plots. Thus, biodiversity and sustainable harvesting approaches reduce the P removal potential. This is to be weighed against the benefits of cyclical and selective harvests in biodiverse systems for species persistence [86].
The estimate of 0.1–0.5 kg/ha/year for the Abenaki harvest system may underestimate the potentially harvestable biomass P. First, the woody plants were still young upon harvest. When harvesting every three years, plants can regenerate and more woody biomass (thereby P) can be removed. Second, there are other plant species in the plots that can be harvested by the Abenaki, and these will likely remove additional P.
Solutions that can balance the three competing functions could involve agroforestry and permaculture practices. For example, the underlying spatial principles of forest gardening define micro-zones [87], which impose spatial structure that could partition the RFB into areas suited to different competing functions. Some areas may be set aside for hyper-accumulating plants and others for a diverse vegetation that satisfies insect needs and Indigenous use. In zonal designs that correspond to hydrological conditions, specialist species to host pollinators and insects can be planted at higher densities [88]. Co-creating plant palettes with the Abenaki that prioritize fast-growing, P-accumulating plant species tolerant of coppicing, which are also resilient to various environmental disturbances [89], might also resolve some of the trade-offs. Ideally, improved agricultural management in the uplands would reduce P loads without having to rely on interception by and retention in RFBs.
A challenge of integrating traditional knowledge into federal or state-driven restoration programs is that policy formulation is performed mostly by scientifically trained people who are not all aware of the available, relevant traditional knowledge [89]. A shift is occurring though, as indicated by COP15 in Montreal 2022′s core session on Science and Traditional Knowledge hosted by UNESCO, which crafted a Local Communities and Indigenous Peoples Platform under the United Nations Framework Convention on Climate Change (UNFCCC) [90,91]. Further evaluations are needed to explore how Indigenous wisdom can help resolve the natural resource problems caused by agriculture.
Even though the term “restoration” is used throughout the paper [92], we understand the process to be a form of Ecological Reconciliation, which aims to restore ecological functions in bioregional contexts [93] while also attempting to reconcile settler relationships with the landscape and its Original Peoples.
4.4. Potential Solutions, Importance for Long Term Research, and Future Directions for This Study
Research capital should be spent on efficient designs that balance the three objectives. Our recommendations for future research are to avoid any negative effects that commercial mycorrhizae may have on plant growth [94,95,96,97] and to maximize the P mitigation potential through endemic mycorrhizae. These can be cultured easily [98] and applied with minimal effort.
The restored plant community can be further evaluated by observing pollinator and insect visitation. Soil microbial assays and analyses of all the essential nutrients can provide a better understanding of the restoration trajectory. DNA sequencing of mycorrhizae may help clarify the specific mycorrhizal species involved in P mitigation. In addition, the period during which the plant community is monitored should be much longer than four years as, in ecological time, this is too short to assess the trajectory of the succession.
Spatial statistical models could be used to simulate P uptake in such systems to optimize the spatial patterning of restoration plantings. Furthermore, N analysis and more randomly distributed replicates of each treatment could augment future data collection. Going forward, it would be informative to document how much P can be removed through Abenaki harvesting of useful materials for ceremony, medicine, food, and crafts.
Over time, studies like this could inform BMPs and thereby slow or even reverse the current trend of water quality and insect population degradation. Proactive maintenance and monitoring are critical to determining restoration success [99]. This involves more than physical, biochemical processes. It involves human relationships with the land and all inhabitants. Changing design, land access, and tending approaches can facilitate recovery of degraded systems once determined by historical patterns of ecological and social trauma, In this way, rematriation can be integrated into ecological restoration to facilitate socio-ecological resurgence [100].
5. Conclusions
This study demonstrates that, four years after restoration, the restoration plots have increased in biodiversity. However, the effect of mycorrhizae on the trajectories of biodiversity and P mitigation is opposite to what we expected. The use of commercial mycorrhizae, high P concentrations and shading of one restoration plot likely confounded the effect of mycorrhizae on both P mitigation and biodiversity data. Reconciling the three RFB functions that we studied (P mitigation, biodiversity and social justice) is a worthy challenge, as increased biodiversity and plant utility to the Original Peoples appear to limit P mitigation potential. Deliberate design based on the spatial variability of ecosystem functions (pollinator habitat biodiversity, Abenaki land access and P mitigation) may resolve this conflict. Over time, better RFB design and recommendations for maintenance may inform BMPs. These can include co-designing and managing RFBs together with Indigenous People, incorporating endemic mycorrhizae, and employing cyclical harvesting of biomass to slow or even reverse the current trend of water quality degradation and insect habitat decline.
Supplementary Materials
The following supporting information can be downloaded at: https://www.mdpi.com/article/10.3390/su16083366/s1, Figure S1: Mehlich-3 extractable P concentrations; Figure S2: Water extractable soil phosphate concentrations; Table S1: Multi-functional view of planted and reemerging plant species in the restored plots of the myco-phytoremediation pilot at Shelburne Farms [101,102,103,104].
Author Contributions
J.R. and J.G. wrote grant applications to fund the research; J.R. and J.G. conceived and designed the research; J.R. and J.G. analyzed the data; C.M. provided Abenaki guidance; J.R. wrote the original manuscript; J.R., J.G., L.K. and C.M. edited the manuscript. All authors have read and agreed to the published version of the manuscript.
Funding
This research was funded by the UVM Extension Center for Sustainable Agriculture, UVM Gund Institute, UVM College of Agricultural and Life Science, James W. Marvin Award in Science and Conservation, Lintilhac Foundation, NE SARE (ONE19-335), Lake Champlain Basin Program and NEIWPCC LS-2022-039, and New England Grassroots Environmental Fund.
Institutional Review Board Statement
Not applicable.
Informed Consent Statement
Not applicable.
Data Availability Statement
Data are available upon request.
Acknowledgments
This study was conducted on unceded Abenaki land. We are grateful to our Abenaki community partners, especially Alnobaiwi, Abenaki clan mothers, and Abenaki leaders. Thanks to the many community members who volunteered their labor during the COVID-19 spring of 2020 to prepare the restoration plots. Thanks are due to UVM’s Maria Sckolnick, Dan Needham of the AETL, UVM Pringle Herbarium, UVM Horticulture Research and Education Center, UVM Greenhouse, Abid Al Agely, and Mike Bald of Got Weeds? Vermont Youth Conservation Corps, and MycoEvolve for their technical assistance. Thanks are also due to research assistant Luca Kolba for data collection, refining SOPs, and training intern Abby Meunier, who we also thank for contributing to the plant, mycorrhizal, and soil data collection. Thank you to Shelburne Farms for hosting the research and offering technical assistance in site preparation, maintenance, and educational outreach.
Conflicts of Interest
The authors declare no conflicts of interest.
References
- Memmott, J.; Craze, P.G.; Waser, N.M.; Price, M.V. Global Warming and the Disruption of Plant–Pollinator Interactions. Ecol. Lett. 2007, 10, 710–717. [Google Scholar] [CrossRef] [PubMed]
- Goulson, D. The Insect Apocalypse, and Why It Matters. Curr. Biol. 2019, 29, R967–R971. [Google Scholar] [CrossRef] [PubMed]
- Wagner, D.L. Insect Declines in the Anthropocene. Annu. Rev. Entomol. 2020, 65, 457–480. [Google Scholar] [CrossRef] [PubMed]
- van Vliet, M.T.H.; Jones, E.R.; Flörke, M.; Franssen, W.H.P.; Hanasaki, N.; Wada, Y.; Yearsley, J.R. Global Water Scarcity Including Surface Water Quality and Expansions of Clean Water Technologies. Environ. Res. Lett. 2021, 16, 024020. [Google Scholar] [CrossRef]
- Albert, J.S.; Destouni, G.; Duke-Sylvester, S.M.; Magurran, A.E.; Oberdorff, T.; Reis, R.E.; Winemiller, K.O.; Ripple, W.J. Scientists’ Warning to Humanity on the Freshwater Biodiversity Crisis. Ambio 2020, 50, 85–94. [Google Scholar] [CrossRef]
- Li, C.; Dong, Y.; Lei, Y.; Wu, D.; Xu, P. Removal of Low Concentration Nutrients in Hydroponic Wetlands Integrated with Zeolite and Calcium Silicate Hydrate Functional Substrates. Ecol. Eng. 2015, 82, 442–450. [Google Scholar] [CrossRef]
- Ojoawo, S.O.; Udayakumar, G.; Naik, P. Phytoremediation of Phosphorus and Nitrogen with Canna x Generalis Reeds in Domestic Wastewater through NMAMIT Constructed Wetland. Aquat. Procedia 2015, 4, 349–356. [Google Scholar] [CrossRef]
- Troy, A.; Wang, D.; Capen, D.; O’Neil-Dunne, J.; MacFaden, S. Updating the Lake Champlain Basin Land Use Data to Improve Prediction of Phosphorus Loading; Scientific Investigations Report; UVM: Burlington, VT, USA, 2017. [Google Scholar]
- Wang, H.; Wang, H. Mitigation of Lake Eutrophication: Loosen Nitrogen Control and Focus on Phosphorus Abatement. Prog. Nat. Sci. 2009, 19, 1445–1451. [Google Scholar] [CrossRef]
- Smith, D.R.; King, K.W.; Williams, M.R. What Is Causing the Harmful Algal Blooms in Lake Erie? J. Soil Water Conserv. 2015, 70, 27A–29A. [Google Scholar] [CrossRef]
- Cao, X.; Wang, Y.; He, J.; Luo, X.; Zheng, Z. Phosphorus Mobility among Sediments, Water and Cyanobacteria Enhanced by Cyanobacteria Blooms in Eutrophic Lake Dianchi. Environ. Pollut. 2016, 219, 580–587. [Google Scholar] [CrossRef]
- Hunter, P.D.; Tyler, A.N.; Gilvear, D.J.; Willby, N.J. Using Remote Sensing to Aid the Assessment of Human Health Risks from Blooms of Potentially Toxic Cyanobacteria. Environ. Sci. Technol. 2009, 43, 2627–2633. [Google Scholar] [CrossRef] [PubMed]
- Roy, E.D. Phosphorus Recovery and Recycling with Ecological Engineering: A Review. Ecol. Eng. 2017, 98, 213–227. [Google Scholar] [CrossRef]
- Weber, R. Lake Champlain Report Card: State Gets a D+ for Its Clean-Up Efforts; Conservation Law Foundation: Boston, MA, USA, 2018. [Google Scholar]
- Zaring, D. Agriculture, Nonpoint Source Pollution, and Regulatory Control: The Clean Water Act’s Bleak Present and Future. Harv. Environ. Law Rev. 1996, 20, 515. [Google Scholar]
- State of Vermont. Vermont Lake Champlain Phosphorus TMDL Phase 1 Implementation Plan; Vermont Department of Environmental Conservation: Montpelier, VT, USA, 2015; p. 152. [Google Scholar]
- Ishee, E.R.; Ross, D.S.; Garvey, K.M.; Bourgault, R.R.; Ford, C.R. Phosphorus Characterization and Contribution from Eroding Streambank Soils of Vermont’s Lake Champlain Basin. J. Environ. Qual. 2015, 44, 1745–1753. [Google Scholar] [CrossRef] [PubMed]
- Hesketh, N.; Brookes, P.C. Development of an Indicator for Risk of Phosphorus Leaching. J. Environ. Qual. 2000, 29, 105–110. [Google Scholar] [CrossRef]
- Meals, D.W.; Dressing, S.A.; Davenport, T.E. Lag Time in Water Quality Response to Best Management Practices: A Review. J. Environ. Qual. 2010, 39, 85–96. [Google Scholar] [CrossRef] [PubMed]
- Hamilton, S.K. Biogeochemical Time Lags May Delay Responses of Streams to Ecological Restoration. Freshw. Biol. 2012, 57, 43–57. [Google Scholar] [CrossRef]
- Kieta, K.A.; Owens, P.N.; Lobb, D.A.; Vanrobaeys, J.A.; Flaten, D.N. Phosphorus Dynamics in Vegetated Buffer Strips in Cold Climates: A Review. Environ. Rev. 2018, 26, 255–272. [Google Scholar] [CrossRef]
- Mason, R.E.; Merrill, S.C.; Görres, J.; Faulkner, J.; Niles, M.T. Agronomic and Environmental Performance of Dairy Farms in a Warmer, Wetter Climate. J. Soil Water Conserv. 2021, 76, 76–88. [Google Scholar] [CrossRef]
- Parkyn, S.M.; Davies-Colley, R.J.; Cooper, A.B.; Stroud, M.J. Predictions of Stream Nutrient and Sediment Yield Changes Following Restoration of Forested Riparian Buffers. Ecol. Eng. 2005, 24, 551–558. [Google Scholar] [CrossRef]
- VT Agency of Natural Resources. Guidance for Agency Act 250 and Section 248 Comments Regarding Riparian Buffers; VT Agency of Natural Resources: Montpelier, VT, USA, 2005; p. 30. [Google Scholar]
- MacFarland, K.; Straight, R.; Dosskey, M. Riparian Forest Buffers: An Agroforestry Practice. Agrofor. Notes 2017, 49, 8. [Google Scholar]
- Benayas, J.M.R.; Bullock, J.M.; Newton, A.C. Creating Woodland Islets to Reconcile Ecological Restoration, Conservation, and Agricultural Land Use. Front. Ecol. Environ. 2008, 6, 329–336. [Google Scholar] [CrossRef]
- Carrasco-Rueda, F.; Loiselle, B.A. Do Riparian Forest Strips in Modified Forest Landscapes Aid in Conserving Bat Diversity? Ecol. Evol. 2019, 9, 4192–4209. [Google Scholar] [CrossRef]
- Cole, L.J.; Stockan, J.; Helliwell, R. Managing Riparian Buffer Strips to Optimise Ecosystem Services: A Review. Agric. Ecosyst. Environ. 2020, 296, 106891. [Google Scholar] [CrossRef]
- Fonseca, A.; Zina, V.; Duarte, G.; Aguiar, F.C.; Rodríguez-González, P.M.; Ferreira, M.T.; Fernandes, M.R. Riparian Ecological Infrastructures: Potential for Biodiversity-Related Ecosystem Services in Mediterranean Human-Dominated Landscapes. Sustainability 2021, 13, 10508. [Google Scholar] [CrossRef]
- Broadmeadow, S.; Nisbet, T.R. The Effects of Riparian Forest Management on the Freshwater Environment: A Literature Review of Best Management Practice. Hydrol. Earth Syst. Sci. Discuss. 2004, 8, 286–305. [Google Scholar] [CrossRef]
- Richardson, D.M.; Holmes, P.M.; Esler, K.J.; Galatowitsch, S.M.; Stromberg, J.C.; Kirkman, S.P.; Pyšek, P.; Hobbs, R.J. Riparian Vegetation: Degradation, Alien Plant Invasions, and Restoration Prospects. Divers. Distrib. 2007, 13, 126–139. [Google Scholar] [CrossRef]
- Johnson, O.W.; Han, J.Y.-C.; Knight, A.-L.; Mortensen, S.; Aung, M.T.; Boyland, M.; Resurrección, B.P. Intersectionality and Energy Transitions: A Review of Gender, Social Equity and Low-Carbon Energy. Energy Res. Soc. Sci. 2020, 70, 101774. [Google Scholar] [CrossRef]
- Maher Hasselquist, E.; Kuglerová, L.; Sjögren, J.; Hjältén, J.; Ring, E.; Sponseller, R.A.; Andersson, E.; Lundström, J.; Mancheva, I.; Nordin, A.; et al. Moving towards Multi-Layered, Mixed-Species Forests in Riparian Buffers Will Enhance Their Long-Term Function in Boreal Landscapes. For. Ecol. Manag. 2021, 493, 119254. [Google Scholar] [CrossRef]
- Bentrup, G. Conservation Buffers Design Guidelines for Buffers, Corridors, and Greenways; USDA: Asheville, NC, USA, 2008; p. 110. [Google Scholar]
- Rubin, J.A.; Görres, J.H. Potential for Mycorrhizae-Assisted Phytoremediation of Phosphorus for Improved Water Quality. Int. J. Environ. Res. Public Health 2021, 18, 7. [Google Scholar] [CrossRef]
- Rubin, J.A.; Görres, J.H. The Effects of Mycorrhizae on Phosphorus Mitigation and Pollinator Habitat Restoration within Riparian Buffers on Unceded Land. Restor. Ecol. 2022, 31, e13671. [Google Scholar] [CrossRef]
- Cameron, D.D. Arbuscular Mycorrhizal Fungi as (Agro)Ecosystem Engineers. Plant Soil 2010, 333, 1–5. [Google Scholar] [CrossRef]
- Manaut, N.; Sanguin, H.; Ouahmane, L.; Bressan, M.; Thioulouse, J.; Baudoin, E.; Galiana, A.; Hafidi, M.; Prin, Y.; Duponnois, R. Potentialities of Ecological Engineering Strategy Based on Native Arbuscular Mycorrhizal Community for Improving Afforestation Programs with Carob Trees in Degraded Environments. Ecol. Eng. 2015, 79, 113–119. [Google Scholar] [CrossRef]
- Chatterjee, A.; Khan, S.R.; Vaseem, H. Exploring the Role of Mycorrhizae as Soil Ecosystem Engineer. In Mycorrhizosphere and Pedogenesis; Varma, A., Choudhary, D.K., Eds.; Springer: Singapore, 2019; pp. 73–93. ISBN 9789811364808. [Google Scholar]
- Rodrigues, K.M.; Rodrigues, B.F. Chapter 12—Arbuscular Mycorrhizae: Natural Ecological Engineers for Agro-Ecosystem Sustainability. In New and Future Developments in Microbial Biotechnology and Bioengineering; Singh, J.S., Singh, D.P., Eds.; Elsevier: Amsterdam, The Netherlands, 2019; pp. 165–175. ISBN 978-0-444-64191-5. [Google Scholar]
- Wires, K.N.; LaRose, J. Sogorea Te’ Land Trust and Indigenous Food Sovereignty in the San Francisco Bay Area. J. Agric. Food Syst. Community Dev. 2019, 9, 31–34. [Google Scholar] [CrossRef]
- Ferreira, C.; Gaudet, J.C.; Loukes, K.A. Indigenous Women’s Worldview in Food-Related Research: Rematriating Food, Bodies and Lands. Appl. Physiol. Nutr. Metab. 2022, 47, 210–213. [Google Scholar] [CrossRef]
- Bunyard, B.A. Dual-Mycorrhizal Plants or Dueling Mycorrhizal Fungi: How Common Are Dual-Mycorrhizal Associations ? Fungi 2020, 13, 9. [Google Scholar]
- Newman, E.I.; Reddell, P. The Distribution of Mycorrhizas Among Families of Vascular Plants. New Phytol. 1987, 106, 745–751. [Google Scholar] [CrossRef]
- Brundrett, M.C.; Kendrick, B. The mycorrhizal status, root anatomy, and phenology of plants in a sugar maple forest. Can. J. Bot. 1988, 66, 1153–1173. [Google Scholar] [CrossRef]
- Cooke, J.C.; Lefor, M.W. The Mycorrhizal Status of Selected Plant Species from Connecticut Wetlands and Transition Zones. Restor. Ecol. 1998, 6, 214–222. [Google Scholar] [CrossRef]
- Clark, R.B.; Zeto, S.K.; Zobel, R.W. Arbuscular Mycorrhizal Fungal Isolate Effectiveness on Growth and Root Colonization of Panicum Virgatum in Acidic Soil. Soil Biol. Biochem. 1999, 31, 1757–1763. [Google Scholar] [CrossRef]
- Oliveira, R.S.; Dodd, J.; Castro, P. The Mycorrhizal Status of Phragmites Australis in Several Polluted Soils and Sediments of an Industrialised Region of Northern Portugal. Mycorrhiza 2001, 10, 241–247. [Google Scholar] [CrossRef]
- Bauer, C.R.; Kellogg, C.H.; Bridgham, S.D.; Lamberti, G.A. Mycorrhizal Colonization across Hydrologic Gradients in Restored and Reference Freshwater Wetlands. Wetlands 2003, 23, 8. [Google Scholar] [CrossRef]
- Vandenkoornhuyse, P.; Ridgway, K.P.; Watson, I.J.; Fitter, A.H.; Young, J.P.W. Co-Existing Grass Species Have Distinctive Arbuscular Mycorrhizal Communities. Mol. Ecol. 2003, 12, 3085–3095. [Google Scholar] [CrossRef] [PubMed]
- Scagel, C.F. Enhanced Rooting of Kinnikinnick Cuttings Using Mycorrhizal Fungi in Rooting Substrate. HortTechnology 2004, 14, 355–363. [Google Scholar] [CrossRef]
- Wang, B.; Qiu, Y.-L. Phylogenetic Distribution and Evolution of Mycorrhizas in Land Plants. Mycorrhiza 2006, 16, 299–363. [Google Scholar] [CrossRef] [PubMed]
- Weishampel, P.A.; Bedford, B.L. Wetland Dicots and Monocots Differ in Colonization by Arbuscular Mycorrhizal Fungi and Dark Septate Endophytes. Mycorrhiza 2006, 16, 495–502. [Google Scholar] [CrossRef] [PubMed]
- Wolfe, B.E.; Weishampel, P.A.; Klironomos, J.N. Arbuscular Mycorrhizal Fungi and Water Table Affect Wetland Plant Community Composition. J. Ecol. 2006, 94, 905–914. [Google Scholar] [CrossRef]
- Brundrett, M.C. Mycorrhizal Associations and Other Means of Nutrition of Vascular Plants: Understanding the Global Diversity of Host Plants by Resolving Conflicting Information and Developing Reliable Means of Diagnosis. Plant Soil 2009, 320, 37–77. [Google Scholar] [CrossRef]
- Rudgers, J.A.; Swafford, A.L. Benefits of a Fungal Endophyte in Elymus Virginicus Decline under Drought Stress. Basic Appl. Ecol. 2009, 10, 43–51. [Google Scholar] [CrossRef]
- Comas, L.H.; Callahan, H.S.; Midford, P.E. Patterns in Root Traits of Woody Species Hosting Arbuscular and Ectomycorrhizas: Implications for the Evolution of Belowground Strategies. Ecol. Evol. 2014, 4, 2979–2990. [Google Scholar] [CrossRef]
- Lady Bird Johnson Wildlife Center. 2021. Available online: https://www.wildflower.org/ (accessed on 5 February 2024).
- National Wildlife Federation—Native Plant Finder. Available online: https://www.nwf.org/nativeplantfinder (accessed on 1 December 2021).
- Senier, S. “All This/Is Abenaki Country”: Cheryl Savageau’s Poetic Awikhiganak. Stud. Am. Indian Lit. 2010, 22, 1–25. [Google Scholar] [CrossRef]
- USDA Official Series Description—COVINGTON Series. Available online: https://soilseries.sc.egov.usda.gov/OSD_Docs/C/COVINGTON.html (accessed on 5 May 2020).
- Chapdelaine, C. Late Pleistocene Archaeology and Ecology in the Far Northeast; Texas A&M University Press: College Station, TX, USA, 2012; ISBN 978-1-60344-790-4. [Google Scholar]
- USDA NRCS. Hydrologic Soil Group; Web Soil Survey National Cooperative Soil Survey; USDA NRCS: Washington, DC, USA, 2015; pp. 1–7. [Google Scholar]
- VT ANR & DEC. Vermont Water Quality Standards Environmental Protection Rule; VT ANR & DEC: Montpelier, VT, USA, 2017; Chapter 29A; pp. 19–20. [Google Scholar]
- Brundrett, M. Mycorrhizal Associations: Methods for Examining Mycorrhizas. Available online: https://mycorrhizas.info/method.html (accessed on 24 December 2019).
- Mycorrhizal Applications. Mycorrhizal Status of Plant Families and Genera; Mycorrhizal Applications: Grants Pass, OR, USA, 2020. [Google Scholar]
- Soudzilovskaia, N.A.; Vaessen, S.; Barcelo, M.; He, J.; Rahimlou, S.; Abarenkov, K.; Brundrett, M.C.; Gomes, S.I.F.; Merckx, V.; Tedersoo, L. FungalRoot: Global Online Database of Plant Mycorrhizal Associations. New Phytol. 2020, 227, 955–966. [Google Scholar] [CrossRef] [PubMed]
- Jicha, T.M. EPA Standard Operating Procedures; U.S. Environmental Protection Agency: Washington, DC, USA, 2015. [Google Scholar]
- Wolf, A.; Beegle, D. Recommended Soil Tests for Macro and Micronutrients. In Recommended Soil Testing Procedures for the Northeastern United States; Cooperative Bulletin; Northeastern Regional Publication: Bangor, ME, UAS, 2009; p. 48. [Google Scholar]
- Deguchi, S.; Matsuda, Y.; Takenaka, C.; Sugiura, Y.; Ozawa, H.; Ogata, Y. Proposal of a New Estimation Method of Colonization Rate of Arbuscular Mycorrhizal Fungi in the Roots of Chengiopanax sciadophylloides. Mycobiology 2017, 45, 15–19. [Google Scholar] [CrossRef] [PubMed]
- Gaston, L.A.; Eilers, R.T.L.; Kovar, J.L.; Cooper, D.; Robinson, D.L. Greenhouse and Field Studies on Hay Harvest to Remediate High Phosphorus Soil. Commun. Soil Sci. Plant Anal. 2006, 34, 2085–2097. [Google Scholar] [CrossRef]
- Kimmerer, R. Braiding Sweetgrass: Indigenous Wisdom, Scientific Knowledge and the Teachings of Plants; Milkweed Editions: Minneapolis, MN, USA, 2013; ISBN 978-1-57131-871-8. [Google Scholar]
- Johnson, N.C.; Graham, J.H.; Smith, F.A. Functioning of Mycorrhizal Associations along the Mutualism–Parasitism Continuum. New Phytol. 1997, 135, 575–585. [Google Scholar] [CrossRef]
- Johnson, N.C.; Graham, J.H. The Continuum Concept Remains a Useful Framework for Studying Mycorrhizal Functioning. Plant Soil 2013, 363, 411–419. [Google Scholar] [CrossRef]
- Johnson, N.C. Resource Stoichiometry Elucidates the Structure and Function of Arbuscular Mycorrhizas across Scales. New Phytol. 2010, 185, 631–647. [Google Scholar] [CrossRef]
- Buil, P.A.; Jansa, J.; Blažková, A.; Holubík, O.; Duffková, R.; Rozmoš, M.; Püschel, D.; Kotianová, M.; Janoušková, M. Infectivity and Symbiotic Efficiency of Native Arbuscular Mycorrhizal Fungi from High-Input Arable Soils. Plant Soil 2022, 482, 627–645. [Google Scholar] [CrossRef]
- Ryan, M.H.; van Herwaarden, A.F.; Angus, J.F.; Kirkegaard, J.A. Reduced Growth of Autumn-Sown Wheat in a Low-P Soil Is Associated with High Colonisation by Arbuscular Mycorrhizal Fungi. Plant Soil 2005, 270, 275–286. [Google Scholar] [CrossRef]
- Volf, M.; Rosolem, C. Soil P Diffusion and Availability Modified by Controlled-Release P Fertilizers. J. Soil Sci. Plant Nutr. 2020, 21, 162–172. [Google Scholar] [CrossRef]
- Catling, P.M.; Mitrow, G. Major Invasive Alien Plats of Natural Habitats in Canada. CBA/ABC Bull. 2012, 45, 70–77. [Google Scholar]
- Tomlinson, S.; Webber, B.L.; Bradshaw, S.D.; Dixon, K.W.; Renton, M. Incorporating Biophysical Ecology into High-Resolution Restoration Targets: Insect Pollinator Habitat Suitability Models. Restor. Ecol. 2018, 26, 338–347. [Google Scholar] [CrossRef]
- Kremen, C.; M’Gonigle, L.K.; Ponisio, L.C. Pollinator Community Assembly Tracks Changes in Floral Resources as Restored Hedgerows Mature in Agricultural Landscapes. Front. Ecol. Evol. 2018, 6, 170. [Google Scholar] [CrossRef]
- Lybbert, A.H.; Cusser, S.J.; Hung, K.-L.J.; Goodell, K. Ten-Year Trends Reveal Declining Quality of Seeded Pollinator Habitat on Reclaimed Mines Regardless of Seed Mix Diversity. Ecol. Appl. 2022, 32, e02467. [Google Scholar] [CrossRef] [PubMed]
- Kohler, F.; Verhulst, J.; Van Klink, R.; Kleijn, D. At What Spatial Scale Do High-Quality Habitats Enhance the Diversity of Forbs and Pollinators in Intensively Farmed Landscapes? J. Appl. Ecol. 2008, 45, 753–762. [Google Scholar] [CrossRef]
- Joseph, L.; Turner, N.J. “The Old Foods Are the New Foods!”: Erosion and Revitalization of Indigenous Food Systems in Northwestern North America. Front. Sustain. Food Syst. 2020, 4, 596237. [Google Scholar] [CrossRef]
- Adegbidi, H.G.; Briggs, R.D.; Volk, T.A.; White, E.H.; Abrahamson, L.P. Biomass and Nutrient Removal by Willow Clones in Experimental Bioenergy Plantations in New York State. Biomass Bioenergy 2001, 20, 399–411. [Google Scholar] [CrossRef]
- Irons, C. Vermont Abenakis, A Brief History of the People of the Dawnland, Vermont’s First Human Inhabitants; L. Brown and Sons: Barre, VT, USA, 2021. [Google Scholar]
- Jacke, D. Eric Toensmeier Edible Forest Gardens’ Ecological Vision and Theory for Temperate Climate Permaculture; Chelsea Green Publishing: Chelsea, VT, USA, 2005; Volume 1–2. [Google Scholar]
- Tallamy, D.W. Nature’s Best Hope: A New Approach to Conservation That Starts in Your Yard; Timber Press: Portland, OR, USA, 2019. [Google Scholar]
- Uprety, Y.; Asselin, H.; Bergeron, Y.; Doyon, F.; Boucher, J.-F. Contribution of Traditional Knowledge to Ecological Restoration: Practices and Applications. Écoscience 2012, 19, 225–237. [Google Scholar] [CrossRef]
- Lopez-Hernandez, D.; Brossard, M.; Frossard, E. P-Isotopic Exchange Values in Relation to Po Mineralisation in Soils with Very Low P-Sorbing Capacities. Soil Biol. Biochem. 1998, 30, 1663–1670. [Google Scholar] [CrossRef]
- Paré, L.L.L.-J. COP15 and Its Impacts on Indigenous and Environmental Law. Available online: https://www.lexology.com/library/detail.aspx?g=7acc98e3-9045-4a79-9504-e44cca941a40 (accessed on 23 October 2023).
- Jordan, W.R.; Lubick, G.M. Making Nature Whole: A History of Ecological Restoration; Island Press: Washington, DC, USA, 2011; ISBN 978-1-61091-042-2. [Google Scholar]
- Graham, N.; Bartel, R. Farmscapes: Property, Ecological Restoration and the Reconciliation of Human and Nature in Australian Agriculture. Griffith Law Rev. 2017, 26, 221–247. [Google Scholar] [CrossRef]
- Schwartz, M.W.; Hoeksema, J.D.; Gehring, C.A.; Johnson, N.C.; Klironomos, J.N.; Abbott, L.K.; Pringle, A. The Promise and the Potential Consequences of the Global Transport of Mycorrhizal Fungal Inoculum. Ecol. Lett. 2006, 9, 501–515. [Google Scholar] [CrossRef]
- Vosátka, M.; Látr, A.; Gianinazzi, S.; Albrechtová, J. Development of Arbuscular Mycorrhizal Biotechnology and Industry: Current Achievements and Bottlenecks. Symbiosis 2012, 58, 29–37. [Google Scholar] [CrossRef]
- Faye, A.; Dalpé, Y.; Ndung’u-Magiroi, K.; Jefwa, J.; Ndoye, I.; Diouf, M.; Lesueur, D. Evaluation of Commercial Arbuscular Mycorrhizal Inoculants. Can. J. Plant Sci. 2013, 93, 1201–1208. [Google Scholar] [CrossRef]
- Maltz, M.R.; Treseder, K.K. Sources of Inocula Influence Mycorrhizal Colonization of Plants in Restoration Projects: A Meta-Analysis. Restor. Ecol. 2015, 23, 625–634. [Google Scholar] [CrossRef]
- Kolba, L.; Rubin, J.; Görres, J. Growing Local Mycorrhizal Inoculum, A Guide and Insights from a Field Trial; NESARE: Burlington, VT, USA, 2022; p. 14. [Google Scholar]
- Aoyama, L.; Shoemaker, L.G.; Gilbert, B.; Collinge, S.K.; Faist, A.M.; Shackelford, N.; Temperton, V.M.; Barabás, G.; Larios, L.; Ladouceur, E.; et al. Application of Modern Coexistence Theory to Rare Plant Restoration Provides Early Indication of Restoration Trajectories. Ecol. Appl. 2022, 32, e2649. [Google Scholar] [CrossRef] [PubMed]
- Corntassel, J. Re-Envisioning Resurgence: Indigenous Pathways to Decolonization and Sustainable Self-Determination. University of Victoria. Faculty Publications. UVicSPACE: Research & Learning Repository. 2012. Available online: https://jps.library.utoronto.ca/index.php/des/article/view/18627/15550 (accessed on 5 February 2024).
- Hutchens, A.R. A Handbook of Native American Herbs: The Pocket Guide to 125 Medicinal Plants and Their Uses; Shambhala Publications: Boulder, CO, USA, 1992; ISBN 978-0-8348-2422-5. [Google Scholar]
- Moerman, D.E. Native American Ethnobotany; Timber Press: Portland, OR, USA, 1998. [Google Scholar]
- Webmaster, D.R. (Kingdom) Plants-Montana Field Guide. Available online: https://fieldguide.mt.gov/displayPhyDiv.aspx?Kingdom=Plantae (accessed on 15 December 2023).
- Rhamnus cathartica, R. davurica. Available online: https://www.fs.usda.gov/database/feis/plants/shrub/rhaspp/all.html (accessed on 15 December 2023).


Disclaimer/Publisher’s Note: The statements, opinions and data contained in all publications are solely those of the individual author(s) and contributor(s) and not of MDPI and/or the editor(s). MDPI and/or the editor(s) disclaim responsibility for any injury to people or property resulting from any ideas, methods, instructions or products referred to in the content. |
© 2024 by the authors. Licensee MDPI, Basel, Switzerland. This article is an open access article distributed under the terms and conditions of the Creative Commons Attribution (CC BY) license (https://creativecommons.org/licenses/by/4.0/).