Article

Exploring Tourists’ Preferences for Bike-Sharing Services in the Context of Tourism

1
Faculty of Bridge and Road, Ha Noi University of Civil Engineering, 55 Giai Phong, Hai Ba Trung, Ha Noi 10000, Vietnam
2
Faculty of Transport Economics, University of Transport and Communications, 3 Cau Giay, Lang Thuong, Dong Da, Ha Noi 100000, Vietnam
3
College of Science and Engineering, Ritsumeikan University, 1-1-1 Nojihigashi, Kusatsu 525-8577, Japan
*
Author to whom correspondence should be addressed.
Sustainability 2024, 16(8), 3375; https://doi.org/10.3390/su16083375
Submission received: 6 March 2024 / Revised: 9 April 2024 / Accepted: 15 April 2024 / Published: 17 April 2024

Abstract

:
This study explores tourists’ preferences for bike-sharing services in the context of tourism. Based on a sample of 800 individuals who visited Da Nang, Vietnam between July and August 2023, a latent class behavior model was developed to investigate preferences for bike-sharing services from tourists’ point of view. The results show that tourists prefer a bike-sharing service that ensures round-the-clock availability, is accessible within a 5-min walk from both the origin and destination, features bikes stationed at specific designated locations, and provides a variety of payment options at an affordable rate of USD 1.00 per h. Under these attributes, about 41.63% of tourists are likely to choose a bike-sharing option for their travel tours. These findings offer valuable insights for traffic management authorities and policymakers, demonstrating that bike-sharing services can be hailed as an effective complement to existing transportation modes and can help bridge the gap between supply and demand in tourist cities.

1. Introduction

The demand for sustainable transport modes has risen in response to the imperative to enhance physical health and decrease emissions in addition to reducing traffic congestion [1,2]. Among these services, in addition to traditional public transport, is bike sharing. Bike sharing offers advantages for both individual users and society in terms of safety, individual financial savings, flexible mobility, accessibility, and narrowing the gap between lower-income and higher-income populations [3,4].
In the context of tourism, the utilization of bike sharing can yield favorable advantages in terms of sustainability, attractiveness, and heightened tourism revenue [5,6]. This form of transportation appeals particularly to environmentally mindful tourists in search of sustainable travel alternatives. Specifically, Banet et al. [7] and Durán-Román et al. [8] have confirmed the role of bike sharing in forming a destination’s attractiveness considering its distinctive stopover feature. However, despite the insights provided by these studies, interest in bike sharing within the tourism domain remains relatively scarce. To the best of the authors’ knowledge, no research has delved into tourists’ preferences considering different bike-sharing features. This study aims to fill this gap by examining how tourists evaluate different bike-sharing features when choosing the bike-sharing options.
Our study contributes to the literature by offering insights into the formulation of demand for bike-sharing services and providing recommendations with different policy implications in the context of tourism. In addition, considering that bike-sharing systems require the collaboration between private companies and tourist destination managers, the outcome of this study helps to identify the innovative bike-sharing schemes to improve sustainability in tourism. Furthermore, information from this study can also support city authorities in developing opportunities to promote bike-sharing services as a type of first/last mile of public transport surrounding tourist spots.
It is important to emphasize that previous studies have examined the technical aspects of implementing bike-sharing systems, as shown by studies such as [9,10], along with providing guidelines for successful business strategies, as demonstrated by studies by [3,9,11,12,13,14,15,16,17]. Therefore, this study does not shed light on these aspects. Instead, this study represents efforts to understand the preferences of tourists if the bike-sharing services become fully available to them.
The remainder of this paper is organized as follows. Previous studies regarding bike-sharing features are summarized in Section 2. Experimental design, data, and model design are discussed in Section 3. The findings based on the estimation results are discussed in Section 4. In Section 5, we make our concluding remarks and note our plan for future research.

2. Literature Review

Bike-sharing services are widely regarded as an innovative mobility solution [4]. As summarized by DeMaio and Meddin [18], there are over 2000 operational systems worldwide, with a predominant presence in China, Europe, and North America. From a traveling perspective, bike sharing is mainly used as a substitute for walking and public transport [19,20].
The sustainability aspect of bike-sharing services is comprehensively analyzed in the research by [4]. The authors summarize the pros and cons of bike-sharing systems across seven themes, including environment, health, social equity, economy, modal shift and car reduction, synergies with public transport, and cycling promotion. Potential benefits are well recognized in the literature in terms of GHG mitigation and air pollutant reduction, health gains, affordability, competitiveness in terms of time and cost, travel time savings, reductions in car use, enhancement of public transport network, and promotion of cycling. On the other hand, some limitations of bike sharing are also highlighted, such as the substitution of motorized vehicles, not considering socially disadvantaged groups, who may prefer public transport [4].
Attention has been paid to bike-sharing systems for tourists recently as a means to foster a more sustainable lifestyle in the tourism industry. Promoting tourism sustainability, encompassing social, economic, and environmental aspects, stands as a primary contemporary goal within the tourism industry [8]; the sustainability of tourist destination is intricately linked to the efficiency and sustainability of their transport systems [16,21,22,23]. Compared to public transport, bike sharing offers tourists a more personalized and customizable transportation alternative. Particularly, bike sharing proves to be a practical transportation choice for accessing tourist attractions situated at varying distances from the community center, where walkability levels may vary. In contrast to taxi services, bike sharing results in cost savings and sustainability [13,16].
The study of tourists’ preferences regarding bike sharing is relatively new with much of the existing research focusing on travelers’ behavioral characteristics in terms of cycle tourism [23] or general populations [9]. In the context of cycle tourism, Watthanaklang et al. [6] explored six primary motivations for bicycle riding, including self-development, exploration, physical challenge, contemplation, stimulus seeking, and social interaction. Kaplan et al. [24] investigated that attitudes, technology, subjective norms, perceived ease of use, along with individual characteristics, are motivations for cycle tourism. From a general user perspective, major motivations for bike sharing include convenience [25], time and cost savings [26], as well as pickup and delivery options [27]. On the other hand, overnight closure, inadequate cycle infrastructure, and various regulatory barriers pose significant obstacles to bike-sharing demand [20]. A literature review also suggests a correlation between mode choice preference and tourists’ movement patterns [5]. Gross and Grimm [28] found that travel duration, travel expenses, and the arrival transport means are primary determinants influencing tourists’ mode choice at the destination. Furthermore, Nutsugbodo et al. [29] confirmed that factors such as affordability, accessibility, availability, safety, and comfort play significant roles in influencing tourists’ mode choice.
Following the preceding review, 
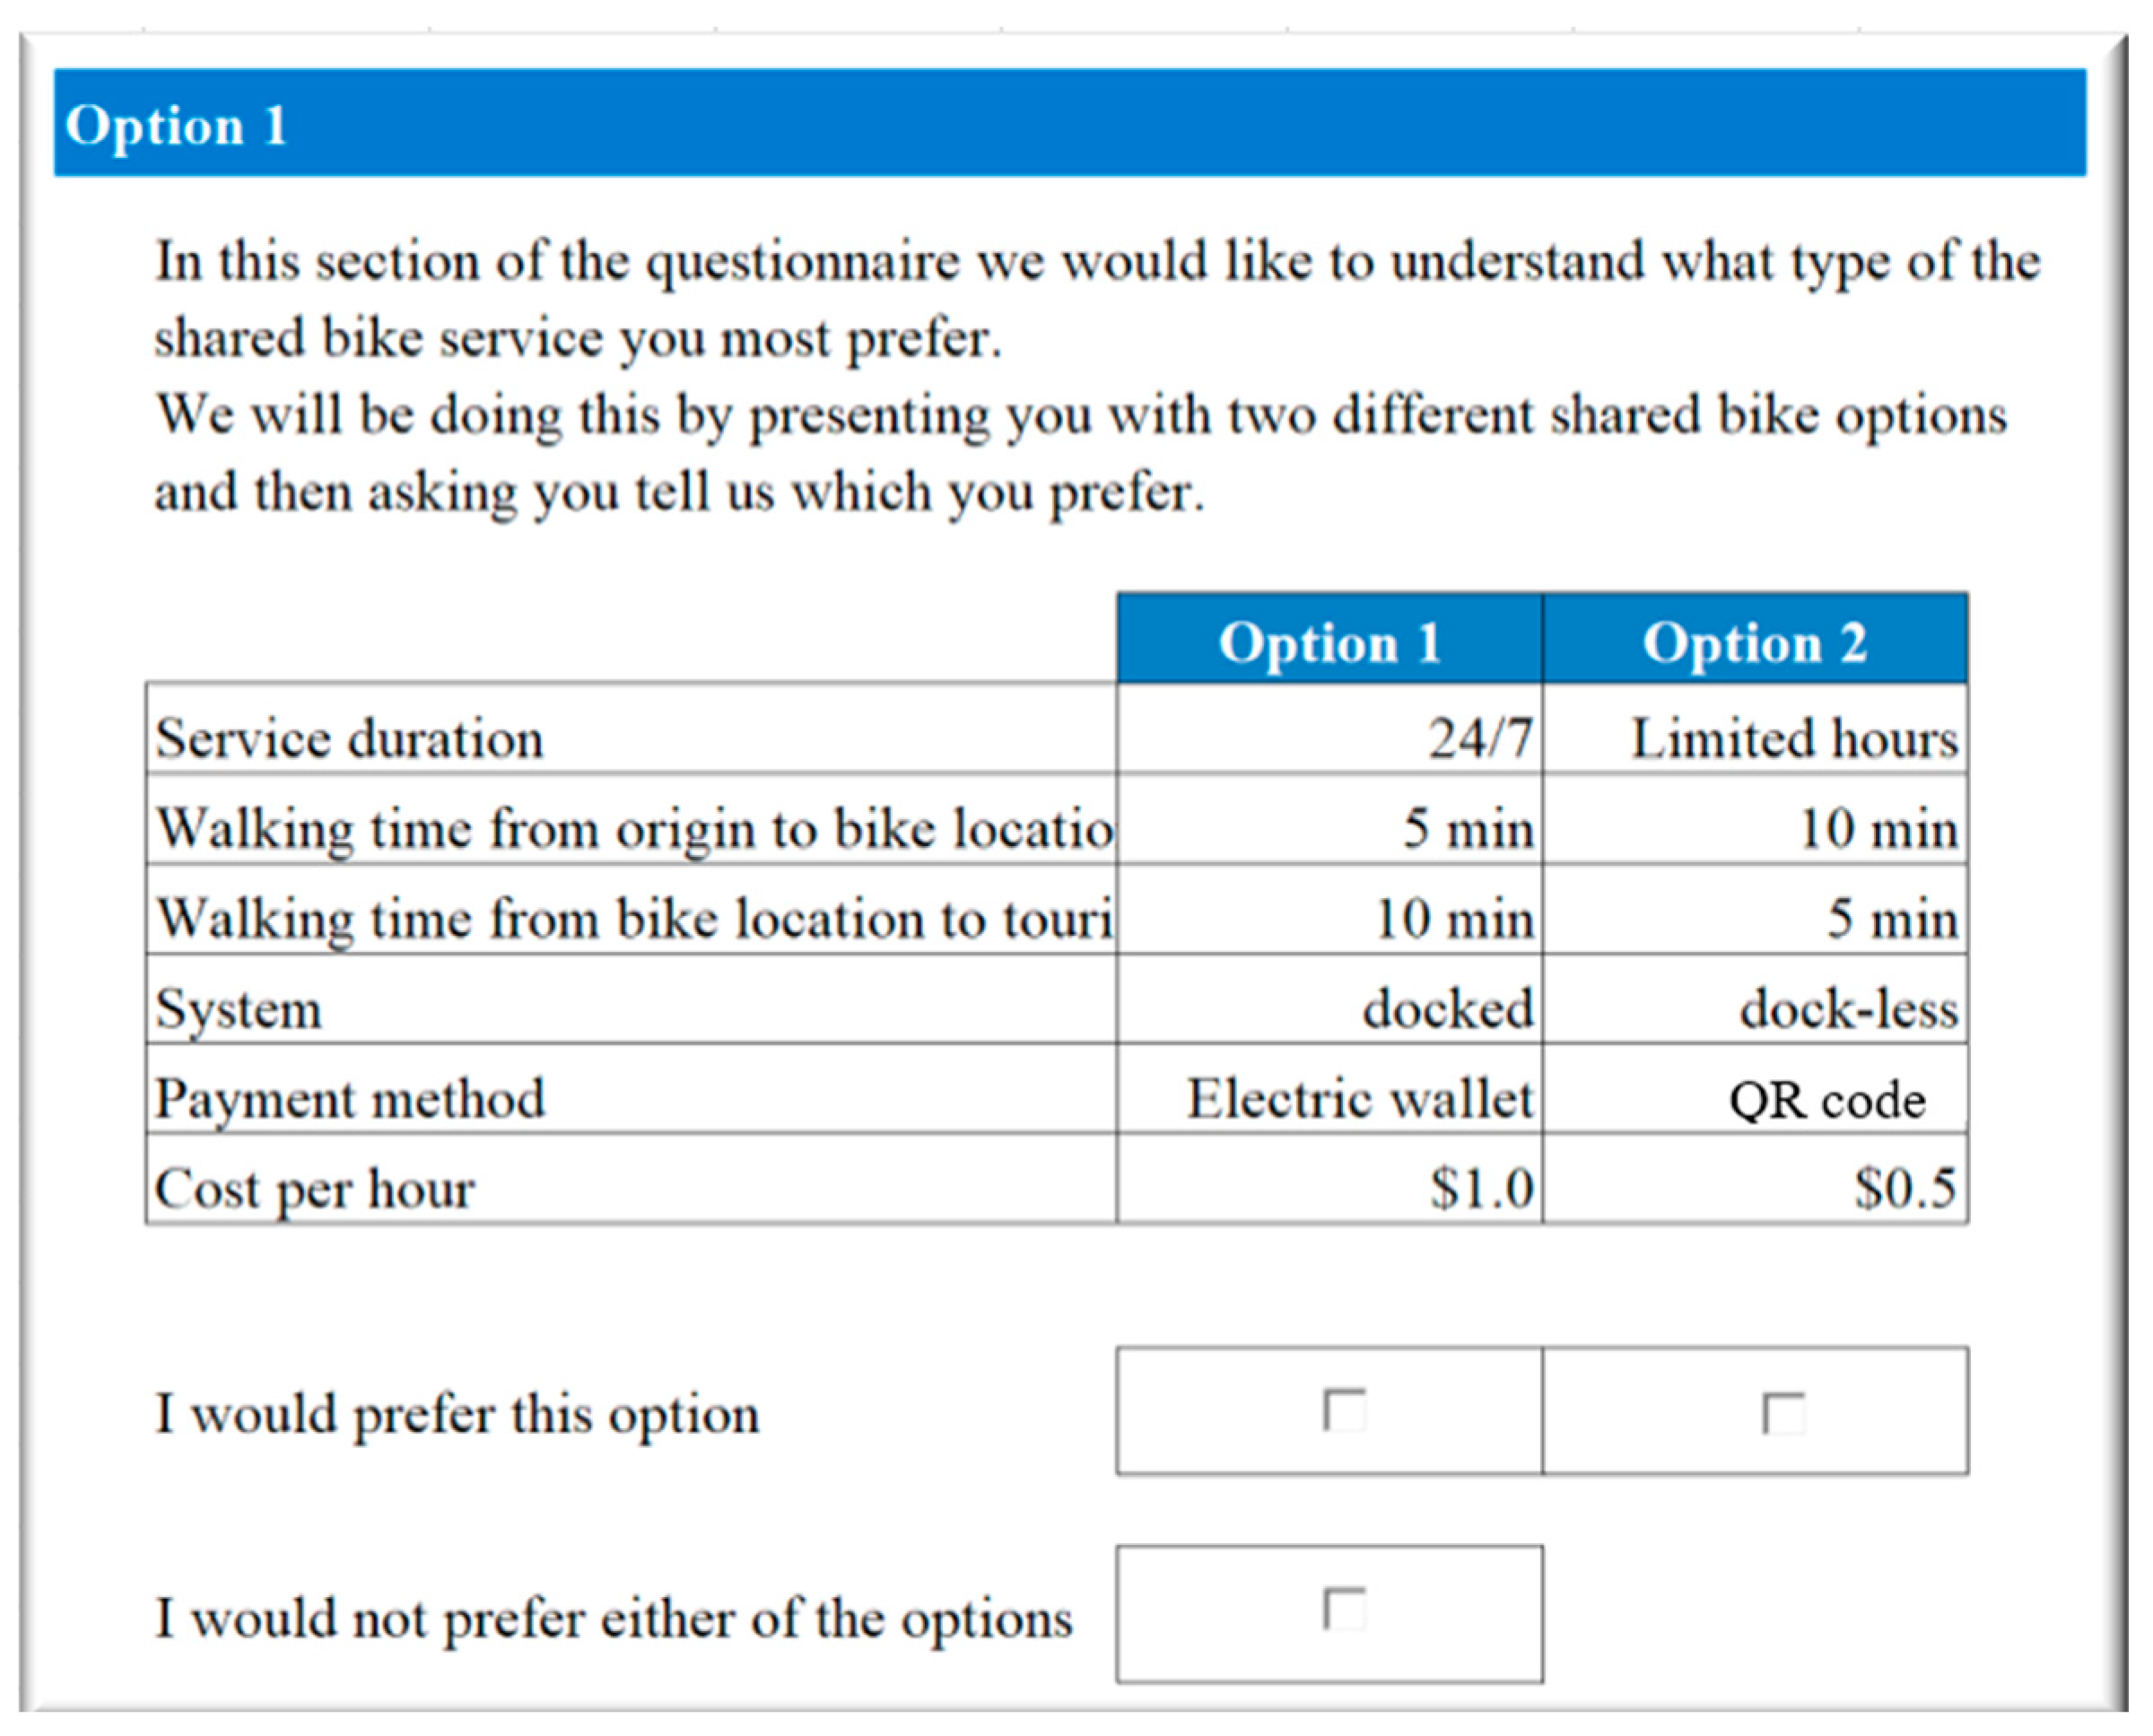
Table 1 compiles a range of bike or bike-sharing features that influence mode choice. These features were taken into account in the formation of the survey design of this study. It is well noted that tourists may have different preferences for bike-sharing systems compared to residents. Tourists often make choices with less comprehensive knowledge about transportation modes for sightseeing, which can result in a dilemma when deciding between public and shared transportation modes [30,31]. Furthermore, tourists frequently explore numerous tourist spots in a single day, thereby their mode choice decisions would depend on how well a mode facilitates interconnected trips between various attractions. Thereby, it is essential to explore the interaction between trip sequence and other factors such as travel context and individual characteristics when developing a bike-sharing system.
While research in the domain of sustainable transportation modes and traffic demand management for tourist cities have proposed a range of strategies aimed at bolstering the effectiveness and addressing the shortcomings of bike-sharing systems, the successful implementation of these strategies is contingent upon understanding and accommodating the compliance and perception of the potential consumers. Therefore, it is crucial to assess tourists’ preferences to guide the direction of interventions before they are implemented in the broader tourist environment.

3. Materials and Methods

3.1. Choice of Experimental Design

Based on the literature review, we have invited eleven experts from various backgrounds to participate in discussions regarding the key attributes and corresponding levels of bike-sharing preferences. These experts include individuals from academic institutions (four people), the Department of Transport (three people), the Department of Tourism (two people), and bike-sharing app developers (two people). After the expert discussion round, six attributes were selected for this study. These attributes included “service duration”, which represents the period during which the bike-sharing service is available for use, and “walking time from origin to bike location”, which indicates an approximate time required for a specific user to walk from the origin to the bike station. Similarly to the previous attribute, “walking time from bike location to tourist destination” represents the time needed for a user to walk from the bike station to their intended tourist destination. “System” denotes whether the drop-off area for the bikes is designated or not. “Payment method” reflects the convenience of payment process for using the bike-sharing service, which is different to the “cost per h” that represents the fee that users are required to pay for renting the bike on an hourly basis. Renting price is a crucial factor influencing users’ choice and directly affects their decision making regarding the services. Attributes such as “searching time” and “extra facilities at bike station” have been excluded in this study. It is assumed that users can easily obtain information about bike locations through smart phone apps, making “searching time” less relevant. Similarly, “extra facilities at bike station” are considered to have minimal influence on tourist bike-sharing choice. Table 2 presents the attributes in this study.
The combination of attributes and levels creates 900 choice situations, which increases the complexity of survey tasks as potential respondents face constraint in processing information and may not be inclined to exert the necessary effort in evaluating alternatives. To reduce the cognitive effort required by respondents in providing information, ten blocks are applied, with each participant receiving nine repeated choice tasks as illustrated in Figure 1.

3.2. Data and Case Study

To address the research questions regarding tourists’ preferences for bike-sharing services in the context of tourism, we designed a stated preference survey focusing on tourists in Da Nang city, a famous coast-based tourist destination in Vietnam. Introducing and exploring bike-sharing services in the tourist cities holds greater significance compared to other areas considering both negative and positive impacts of tourism activity: (1) bike-sharing services appeal to environmentally conscious tourists seeking sustainable travel options [13]; (2) such services offer an affordable, convenient, and eco-friendly transport mode in tourist spots [36]; (3) given the side effects of tourism activities on the environment and socio-cultural balance [37], there is a pressing need for sustainable transportation (or sustainable tourism).
The location of Da Nang city in Vietnam is shown in Figure 2a while Figure 2b provides a map featuring traffic routes and prominent tourist sites. Da Nang city stands out as one of the premier vacation destinations in Vietnam, with over 6 million visitors annually. Renowned for its pristine natural landscape and beautiful beaches, the city boasts a strategic distribution of these attractions across its outskirts and center areas. Motorcycles, taxis, and tourist buses serve as the primary transportation choices for tourists in this city, while the current accessibility of public transport is poor.
Transport stands out as a major contributor to Greenhouse gas (GHG) emission in Da Nang, comprising 44% of citywide GHG emissions in 2013 (https://2050.nies.go.jp/report/file/lcs_asialocal/Danang_brochure_Eng.pdf (accessed on 22 Feburuary 2024)). Among these emissions originating from the transport sector, approximately two-thirds are derived from the use of diesel fuel vehicles while gasoline use contributes to around 16% of the total transport-related emissions. This issue aligns closely with the city’s vision for sustainability and livability and has paved the path for the municipality to promote a modal shift from driving to bicycling. As a result, some app developers and entrepreneurs have started doing business in this city. Currently, there are 61 bike-sharing stations holding approximately 600 bikes in Da Nang. Users can check in and check out bikes from any station using electronic wallet. The initial success of transport sharing initiatives highlights their potential for enhancing mobility and presents an opportunity for policymakers to expand such practices citywide, particularly in support of tourism activities.
For this purpose, in July 2023, a stated preference survey was conducted, targeting 800 tourists in Da Nang city, Vietnam to investigate their preferences on the bike-sharing service. The survey was estimated to take 25 days to complete. Details regarding the selected demographic characteristics of respondents are given in Table 3.
The survey was carried out by a third transport consulting company located in Da Nang city. Considering that the statistical data for the main demographic factors of tourists were not available, no specific quota was enforced for respondents. Gender distribution in the survey showed minimal variance, with no significant difference between male and female proportions. The majority of respondents were domestic visitors, reflecting a substantial representation compared to Da Nang statistics. Over 60% of respondents were between 20 and 40 years old, with incomes ranging between USD 350 to USD 1500, accounting for around 70% of the sample. Furthermore, over 90% of the respondents reported traveling with companions.

3.3. Methodology

Preferences for bike-sharing services were generally investigated using a latent class model (LCM) [38]. In general, preferences are often complex and multidimensional. LCM can capture this complexity by allowing for the simultaneous consideration of multiple attributes that influence preferences. In addition, LCM can identify latent segments within a population based on their preferences; this allows us to uncover distinct groups of potential users with different preferences, needs, or characteristics.
To begin, a finite number C is predefined to categorize the dataset into C classes and then proposed models with different C values were compared. The optimal number of classes is determined based on the Akaike Information Criteria (AIC) and Bayesian Information Criterion (BIC) [39].
The utility function is written for each choice task as follows:
U i j | c = X j β c + ε i j | c ,
where Xj represents the vector of explanatory variables, βc accounts for the class-specific impact of variable Xj on ith choice, and ε i j | c represents the unobserved heterogeneity for j individual with i choice in class c, which is designed as an independent and identically distributed random variable.
The class probability function is given as follows:
P Y i j = 1 Q i c = 1 = e x p ( X j β c ) j J c e x p ( X j β c ) ,
where Yij represents the selection of the bike-sharing service with alternative j and zero otherwise, Xj represents the vector of explanatory variables, and βc accounts for class-specific impact of variable Xj on ith choice. ε i j | c represents the unobserved heterogeneity for j individual with i choice in class c, which is designed as an independent and identically distributed random variable.
The probability Pi = [Pi1, Pi2, …, Pic] will be the contribution of every individual i in the likelihood:
P i | c = t = 1 T i P i t | c .
In the latent class model, there are C sets of βc and R − 1 sets of αc. Respondents are allocated to each class based on a probability. For individual i, the likelihood is the expectation of the donations specific to each class:
P i = c = 1 C Q i c P i | c .
The formulation of the final log likelihood is as follows:
L n L = i = 1 N l n P i = i = 1 N l n c = 1 C Q i c t = 1 T i P i t | c .

4. Results and Discussions

4.1. Model Estimation

The estimation of the model was carried out using STATA 17.0 software. To assess the overall performance of the model, indicators such as the Akaike Information Criterion (AIC) and the Bayesian Information Criterion (BIC) were employed. Furthermore, the significance of the variables was carefully evaluated in the model specifications. The results of AIC and BIC in Table 4 show that these values increase with the class number, suggesting that adding more classes is not recommended in this study. Finally, a two-class model was chosen here.
The estimation results for the two-class model are detailed in Table 5 and Table 6, respectively, including the coefficients, standard errors, and the p-values. The two-class model incorporating a panel effect demonstrates a superior goodness of fit, a measure which we delve into with detailed discussion.
Class 1 comprises 64.5% of the population, with an estimated breakdown of 42.97% male and 57.03% female. Additionally, 49.58% of respondents are younger than 20 years old, 30.52% are aged between 20 and 30 years, and 12.93% are aged between 30 and 40 years. About 66.65% of the population are domestic tourists, while 33.35% are international tourists. The predominant income range falls between USD 350 and USD 1000, accounting for 78.65% of the population.
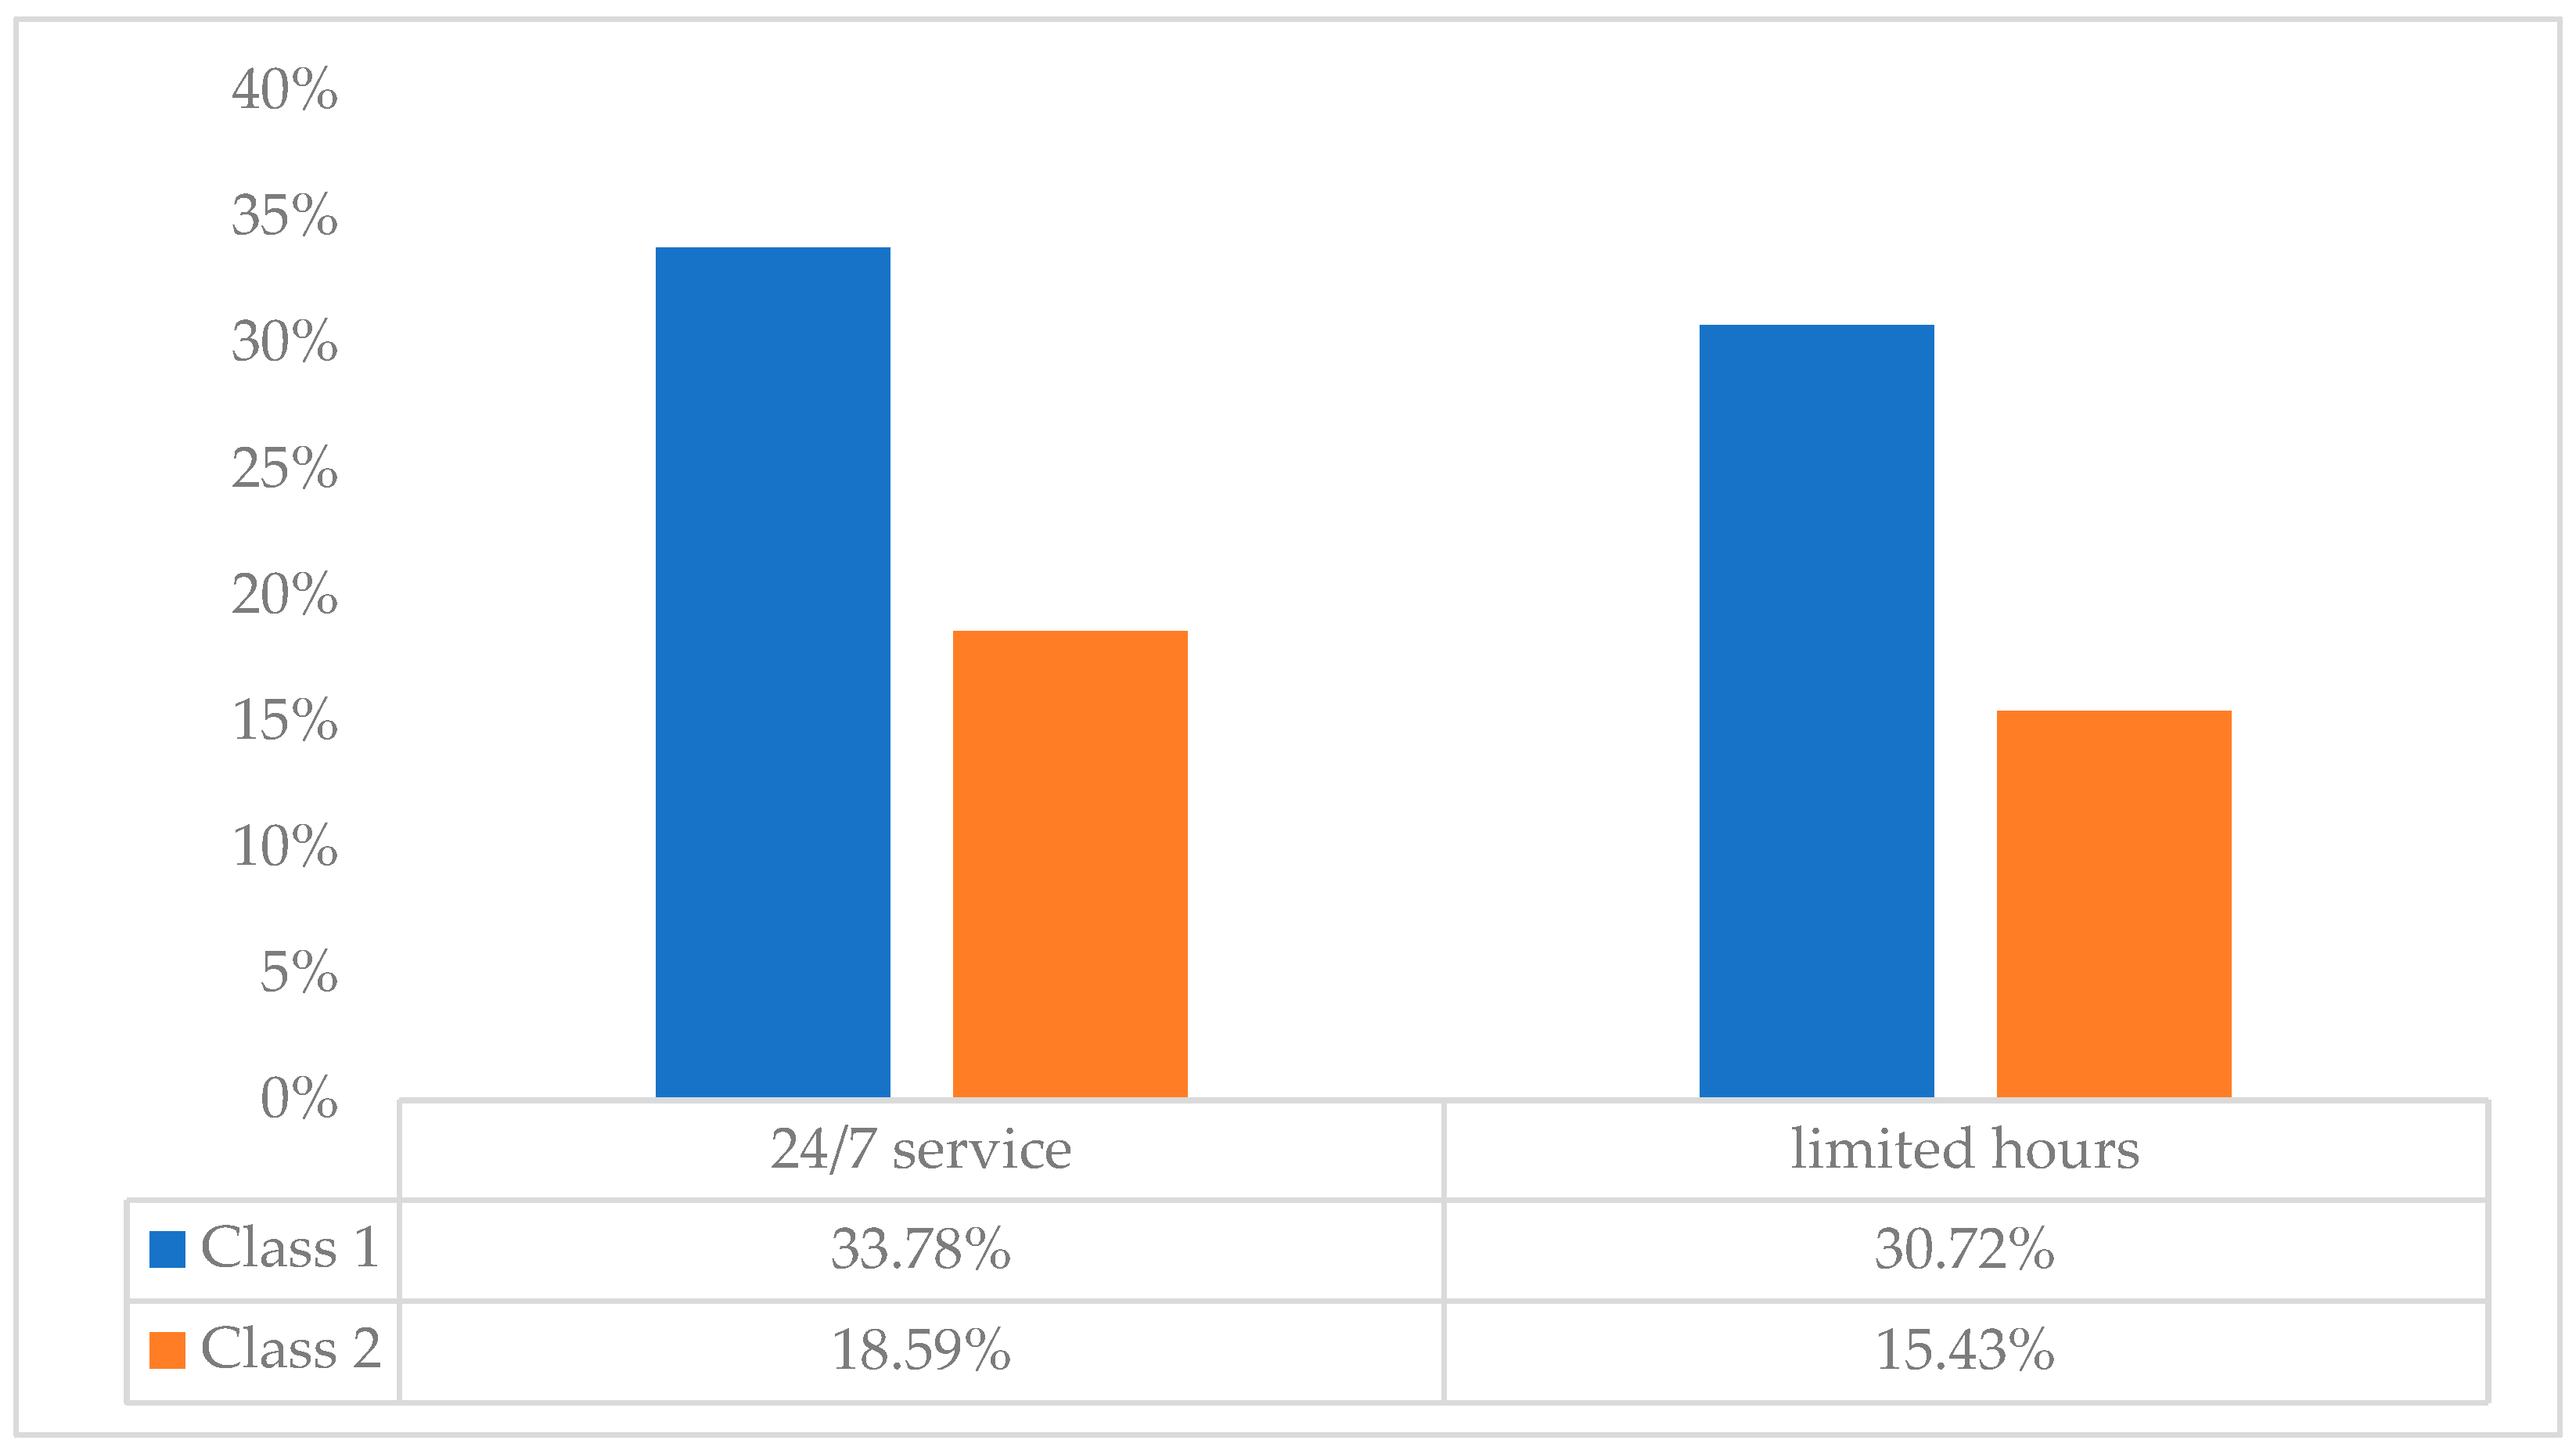
The findings show that respondents in this class value the availability of a bike-sharing option accessible 24 h a day, seven days a week. Both the access and egress walking times to and from the bike-sharing locations were negatively significant, as expected, highlighting that an increase in walking time from hotels or tourist spots reduces the utility for these respondents. Class 1 exhibits less interest in secured bike parking but express a preference for a ‘docked system’. This preference might be motivated by the advantage of finding an available bike nearby whenever needed, offering a sense of freedom rather than the feeling of being monitored by security personnel. Members belonging to class 1 are more willing to pay USD 1.00/h for a bike-sharing service.
In addition to bike-sharing attributes, demographic characteristics also affect tourists’ preferences. Females exhibit a higher propensity to utilize bike-sharing services, whereas tourists aged between 50 and 60 years are less inclined to do so. Additionally, foreign tourists demonstrate a reduced likelihood of utilizing bike-sharing services. Notably, tourists falling within income brackets ranging from USD 350 to USD 1000 and USD 1500 to USD 2500 exhibit a heightened propensity for bike-sharing service utilization.
In contrast to class 1, class 2 constitutes 35.5% of the population and is predominantly composed of females (70.69%). Additionally, the proportion of individuals falling within the age bracket of 20 and 30 years is higher in class 2 compared to class 1, accounting for 33.97%. Furthermore, fewer respondents in class 2 are likely to be domestic tourists (55.24%) compared to class 1, and the average monthly income in this class, ranging between USD 500 and USD 1500, is higher than that of class 1. Table 6 shows the results of class 2.
The findings indicate that members in class 2 display their preferences indifference toward bike-sharing options. Similarly to class 1, members in class 2 also value 24-h access, seven days a week, to bike sharing. Additionally, similarly to class 1, both access and egress walking time have a negative and significant impact, through class 2 respondents exhibit greater sensitivity to these factors. However, contrary to class 1, class 2 members show a distinct lack of preference for both docked systems and secured bike parking options. In terms of cost, similarly to class 1, members in class 2 demonstrate a preference for costs at or below USD 1.00 and show less favorability toward a cost of USD 1.50.
In contrast to class 1, there is no correlation between gender and the utilization of bike-sharing services in class 2. Tourists aged between 50 and 60 years are more likely to use this service. However, similarly to class 1, foreign tourists demonstrate a reduced likelihood of utilizing bike-sharing services and tourists falling within income brackets ranging from USD 350 to USD 1000 and USD 1500 to USD 2500 exhibit a heightened propensity for bike-sharing service utilization.

4.2. Discussions

In this section we discuss how changes in one of the bike-sharing attributes influence the likelihood of selecting a bike-sharing option. Results indicate that on average, 41.72% of the respondents will choose bike sharing, with 26.91% being members of class 1 and 14.81% belonging to class 2. Figure 3 reveals that while all other attributes remain constant, the “24/7 service” option exhibits the highest probability of being selected among the various service durations with a 52.38% chance of being chosen.
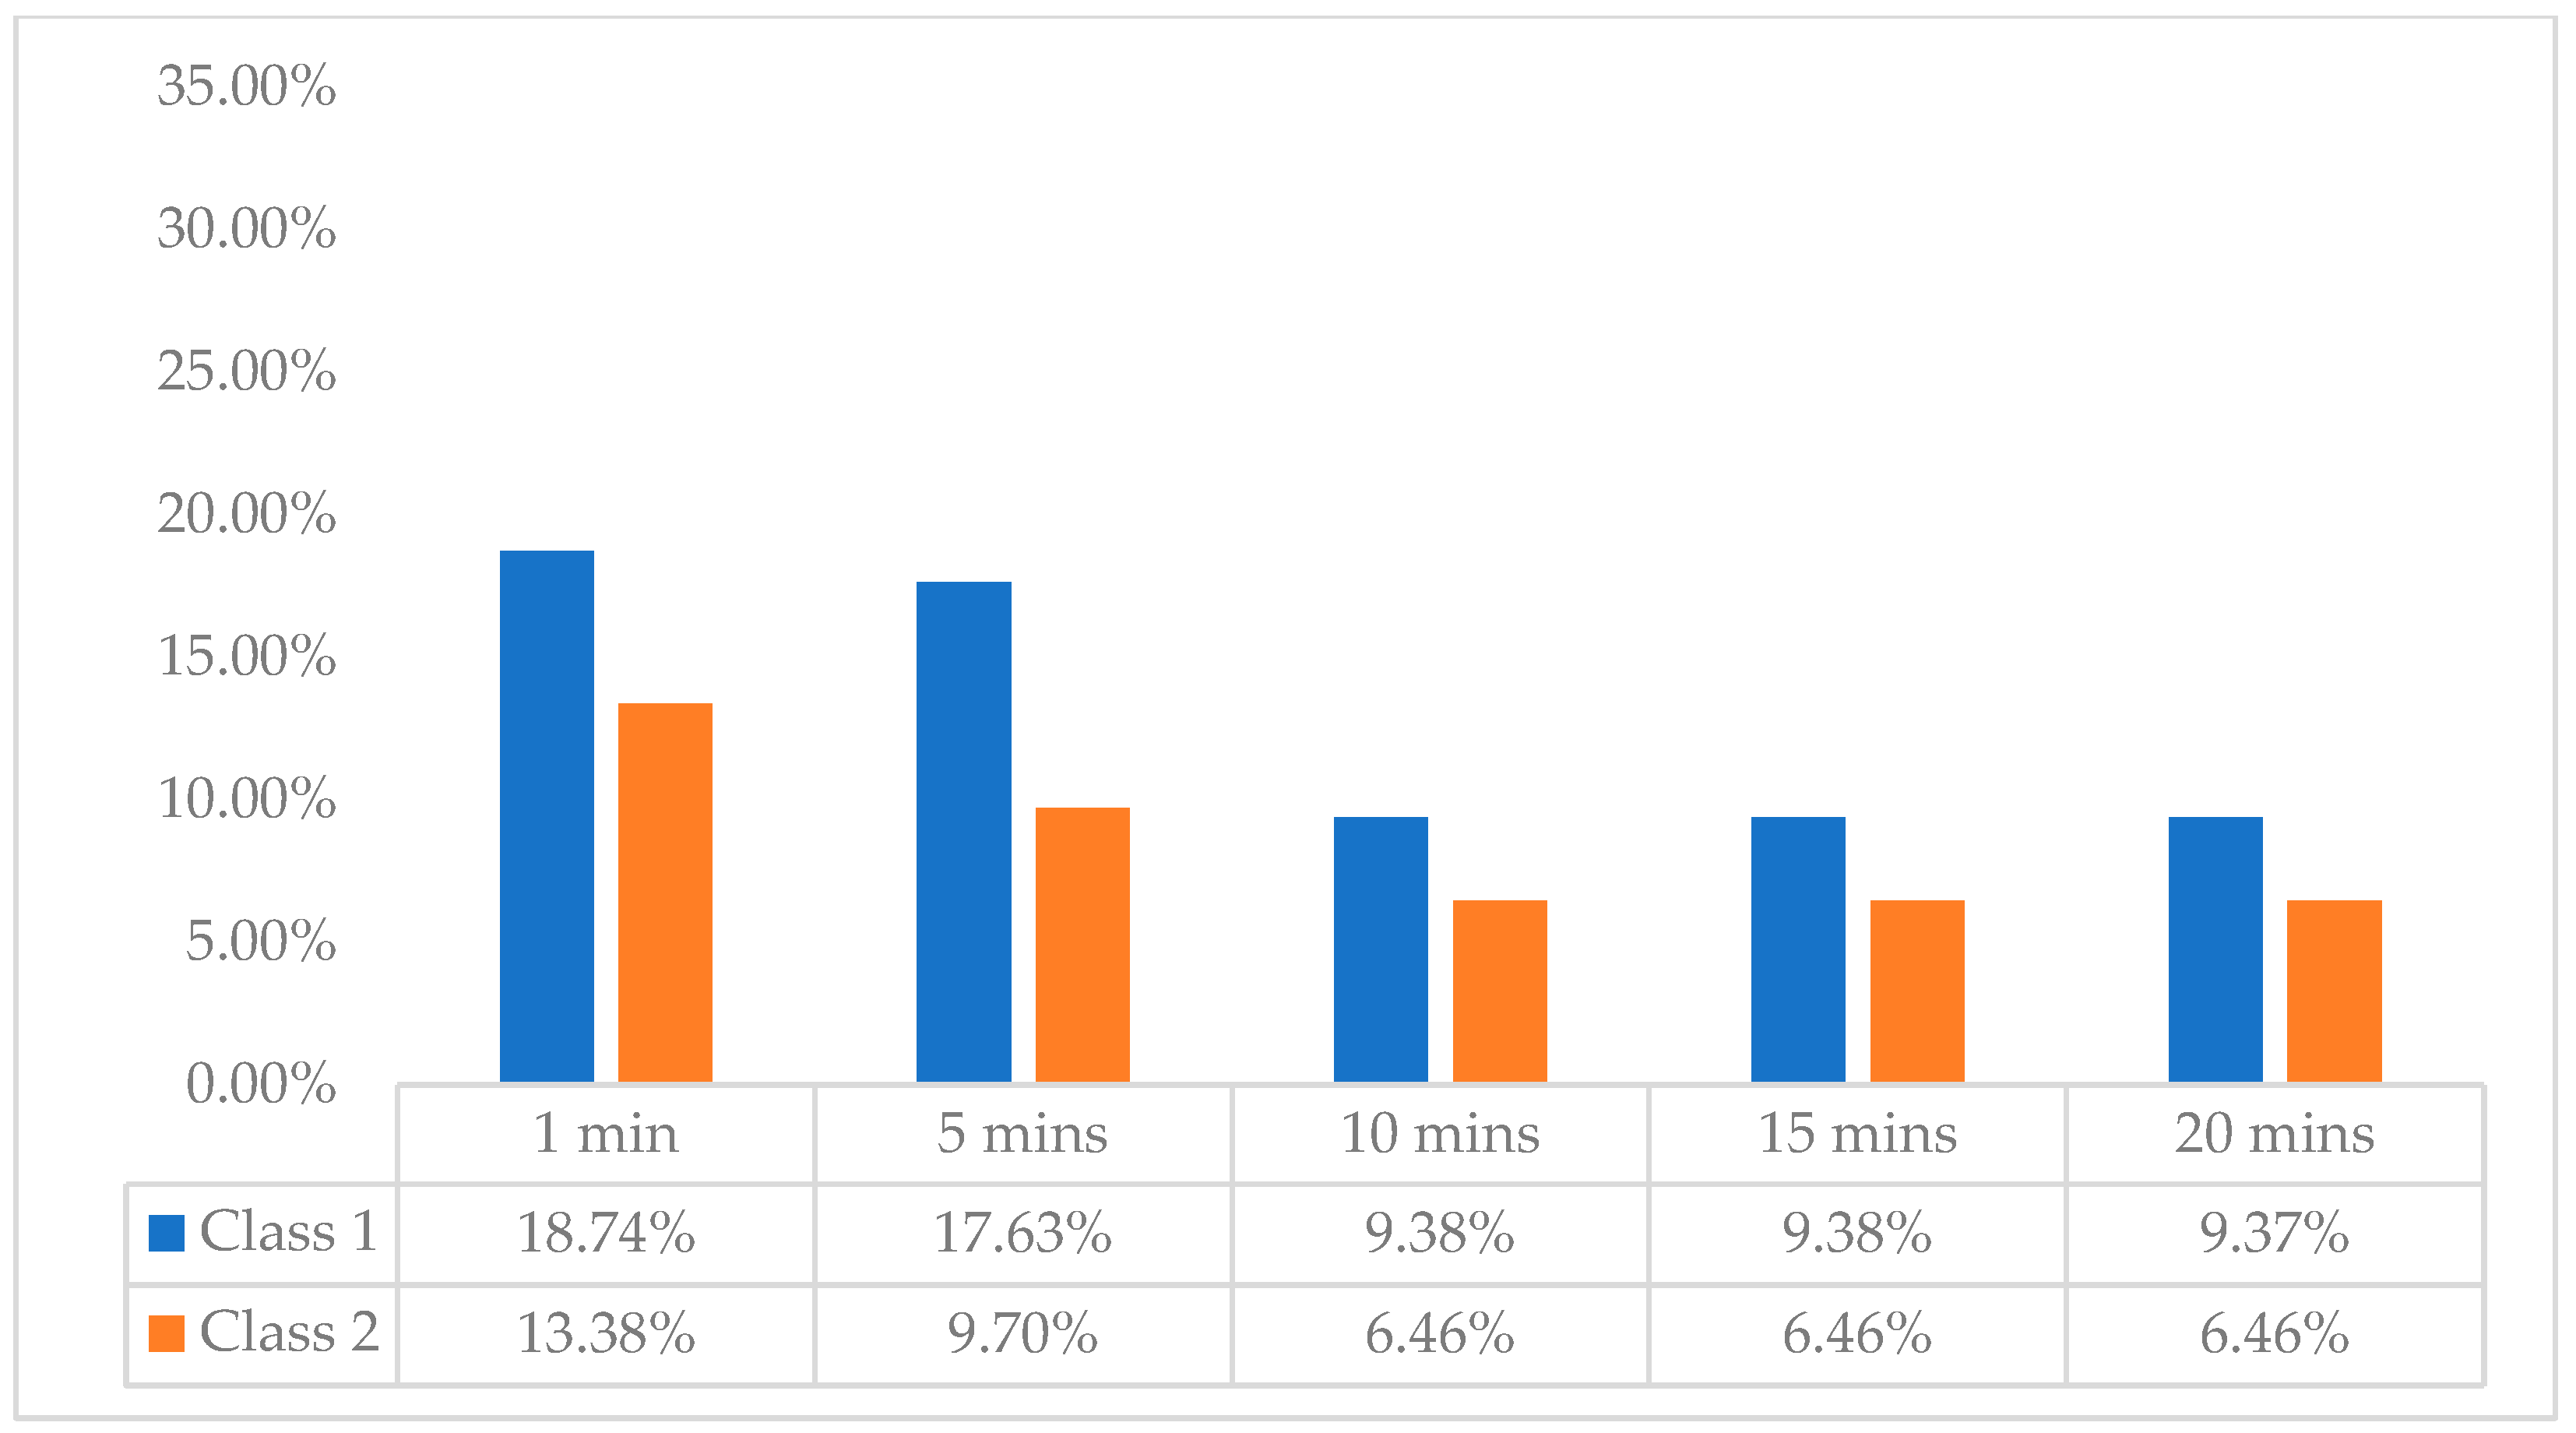
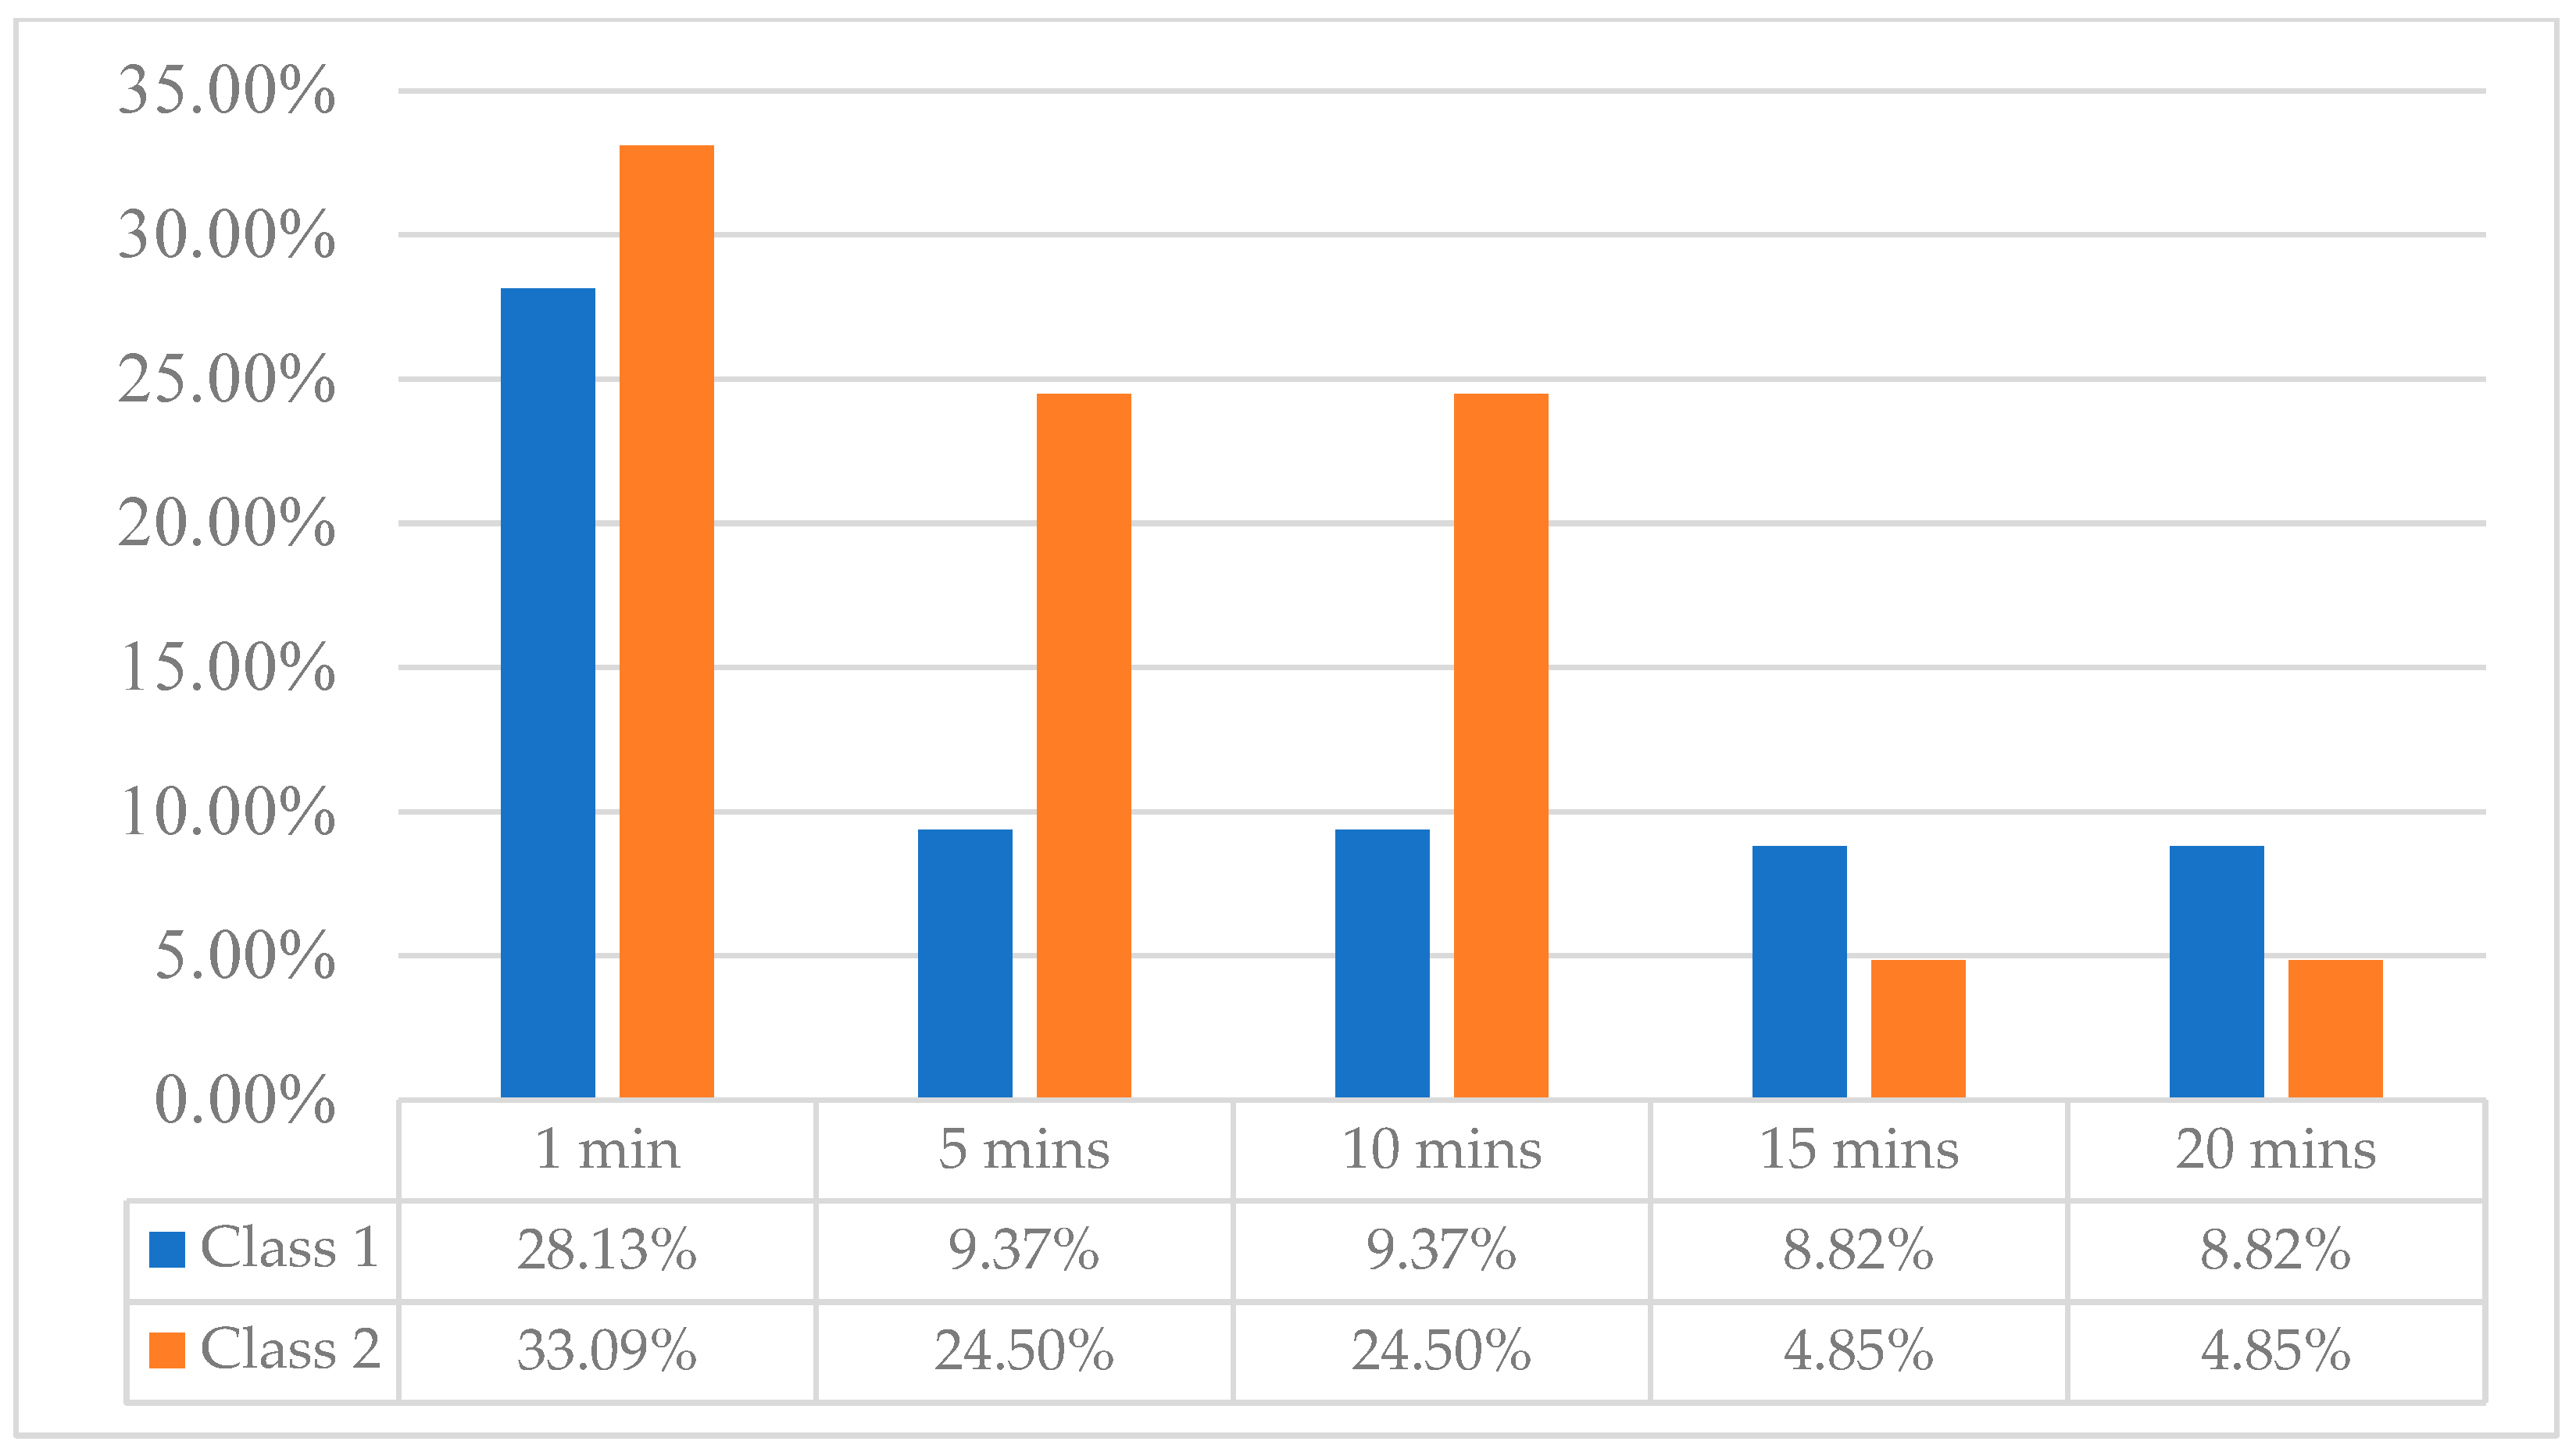
Figure 4 illustrates how the likelihood of choosing a bike-sharing option changes as the access walking distance from the designated origin to the bike-sharing stations increases from 1 min up to 20 min. At the aggregate level, the likelihood of opting for a bike-sharing service located within a 1-min walk stands at approximately 32.12%, while this probability drops to around 15.83% for a station that requires a 20-min walk. Similarly, Figure 5 demonstrates the variation in probability when the walking distance from the intended destination to the bike-sharing station is considered. Here, the chance of selecting a bike-sharing option within a 1-min egress walking distance is about 61.22%, but this likelihood significantly decreases to 13.67% for a 20-min walk. These findings indicate a pronounced sensitivity toward increases in egress walking distance among tourists.
The findings align with a consistent theme in bike-sharing demand research, which has repeatedly noted that an increase in walking distance from a bike station decreases the likelihood of using service [40]. Understanding the impact of both access and egress times on choice decisions provides valuable insights for authorities when devising pricing strategies. By mitigating increases in prices with reductions in access or egress times, authorities can strike a balance between implementing policy measures and preserving equity among users.
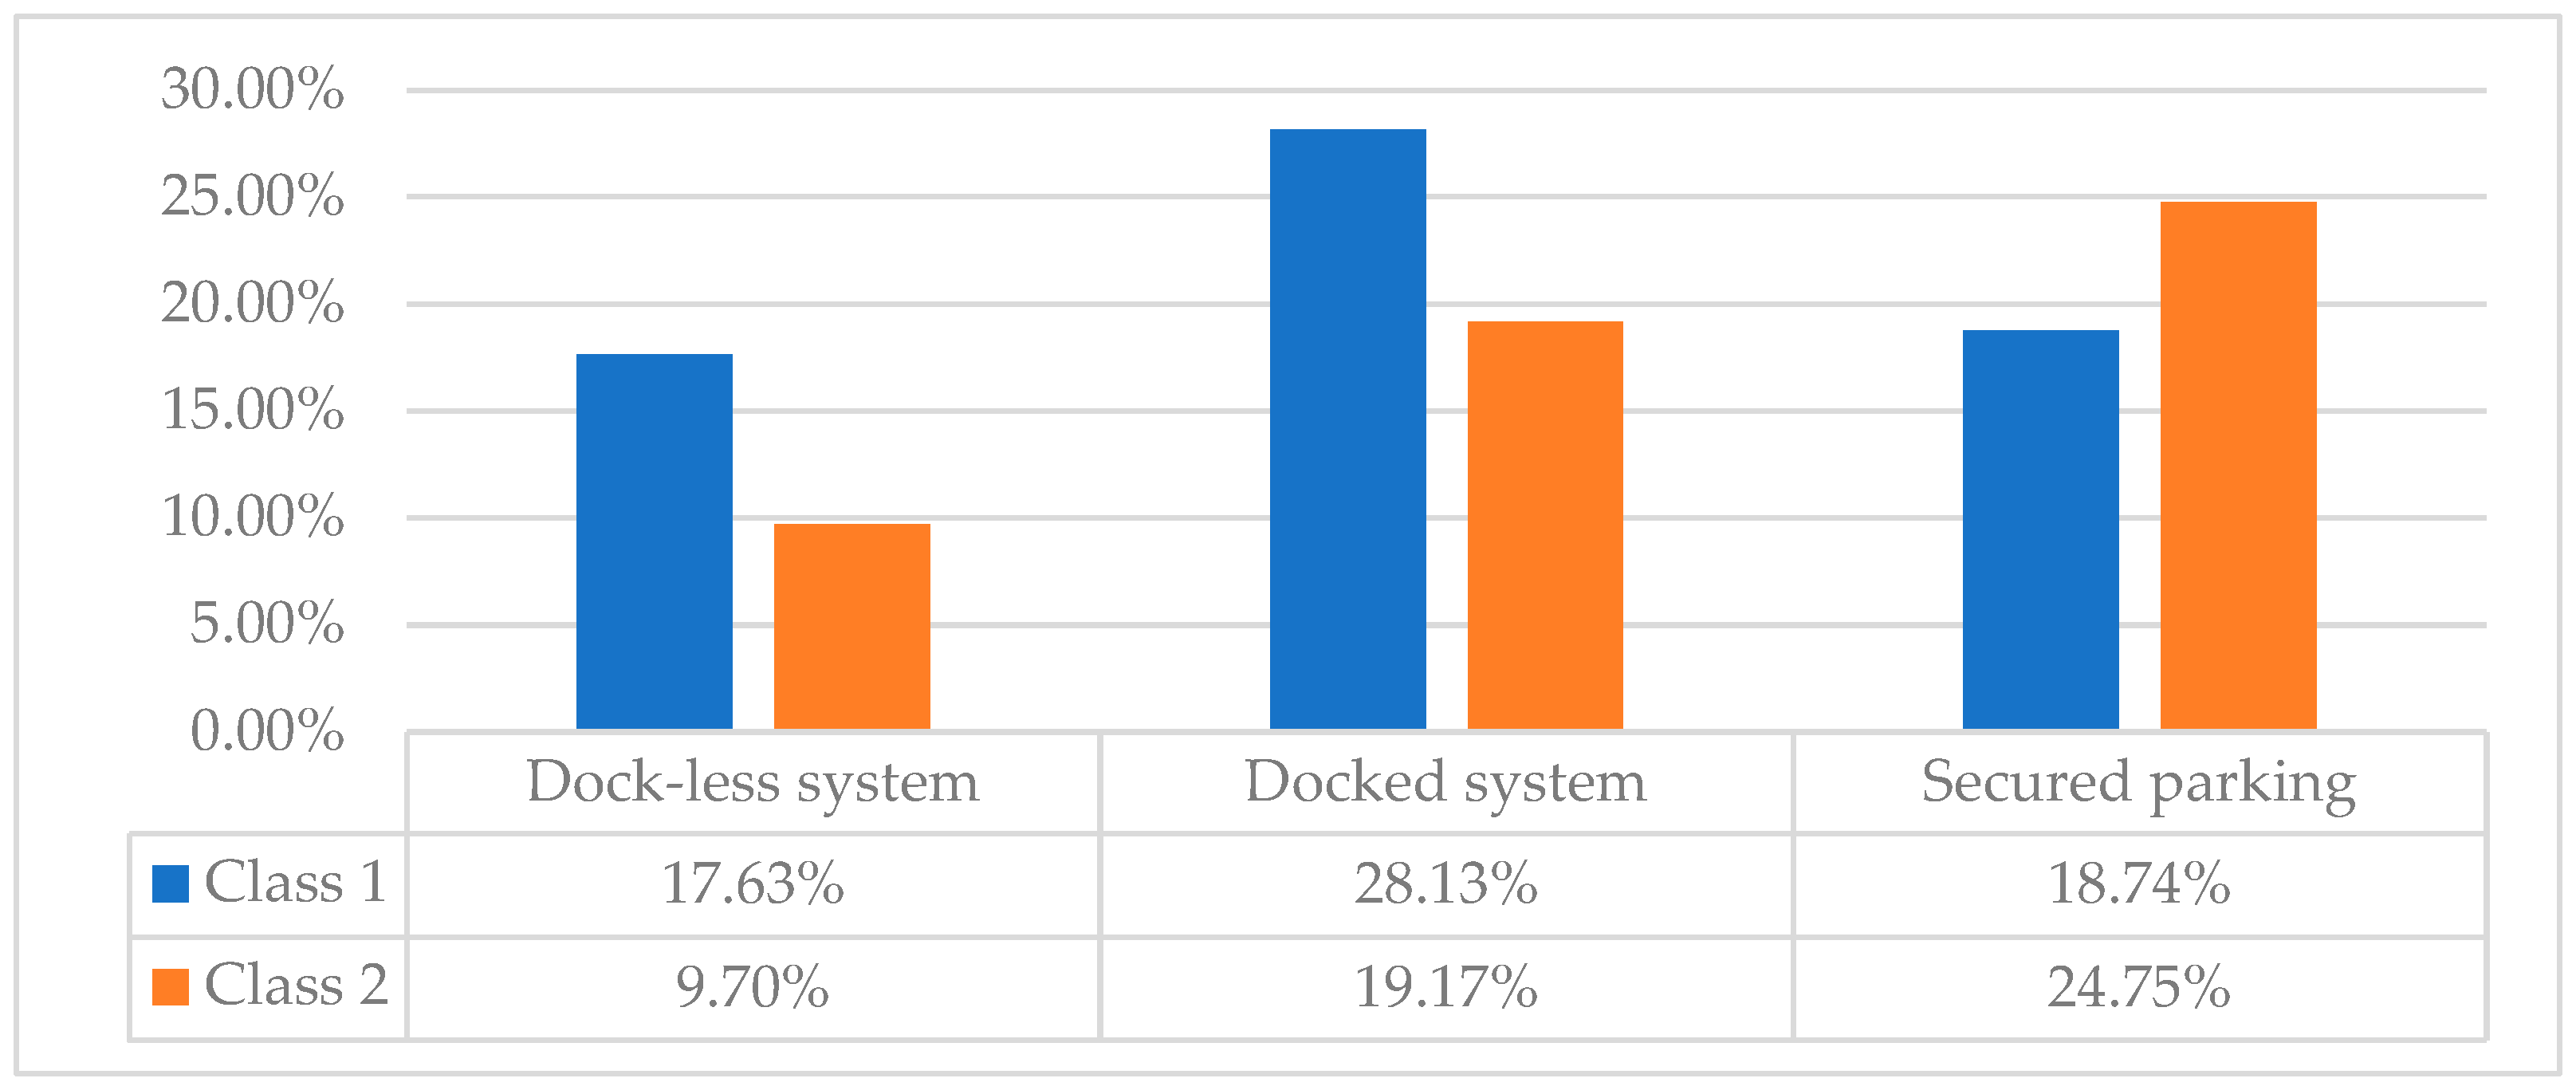
Figure 6 reveals preferences for different types of bike-sharing facilities, indicating that users classified as class 1 exhibit a stronger inclination toward docked bike-sharing systems. On an aggregate level, the “docked bike system” emerges as the most favored option, holding a probability of 47.3%. Conversely, the presence of a dock-less system feature diminishes the likelihood of selecting a bike-sharing option by roughly 20%, bringing the probability down to 27.33% compared to other bike type features. This observation aligns with findings from prior studies. For example, Fukushige et al. [9] demonstrated that bike-share utilization tends to decrease in the absence of designated drop-off locations. Similarly, Lee [41] observed that in Davis, California, the dock-less bike-share service failed to meet fifty percent of the demand. The finding from this study underscores the necessity for operators to devise a well-designed strategic plan that effectively bridges the spatial gap between demand and supply, thereby enhancing bike-share usage among tourists. Furthermore, these findings suggest that policymakers should prioritize the establishment of designated locations as a key requirement for operators. Doing so could help to maximize the community benefits derived from bike-sharing systems.
Finally, 
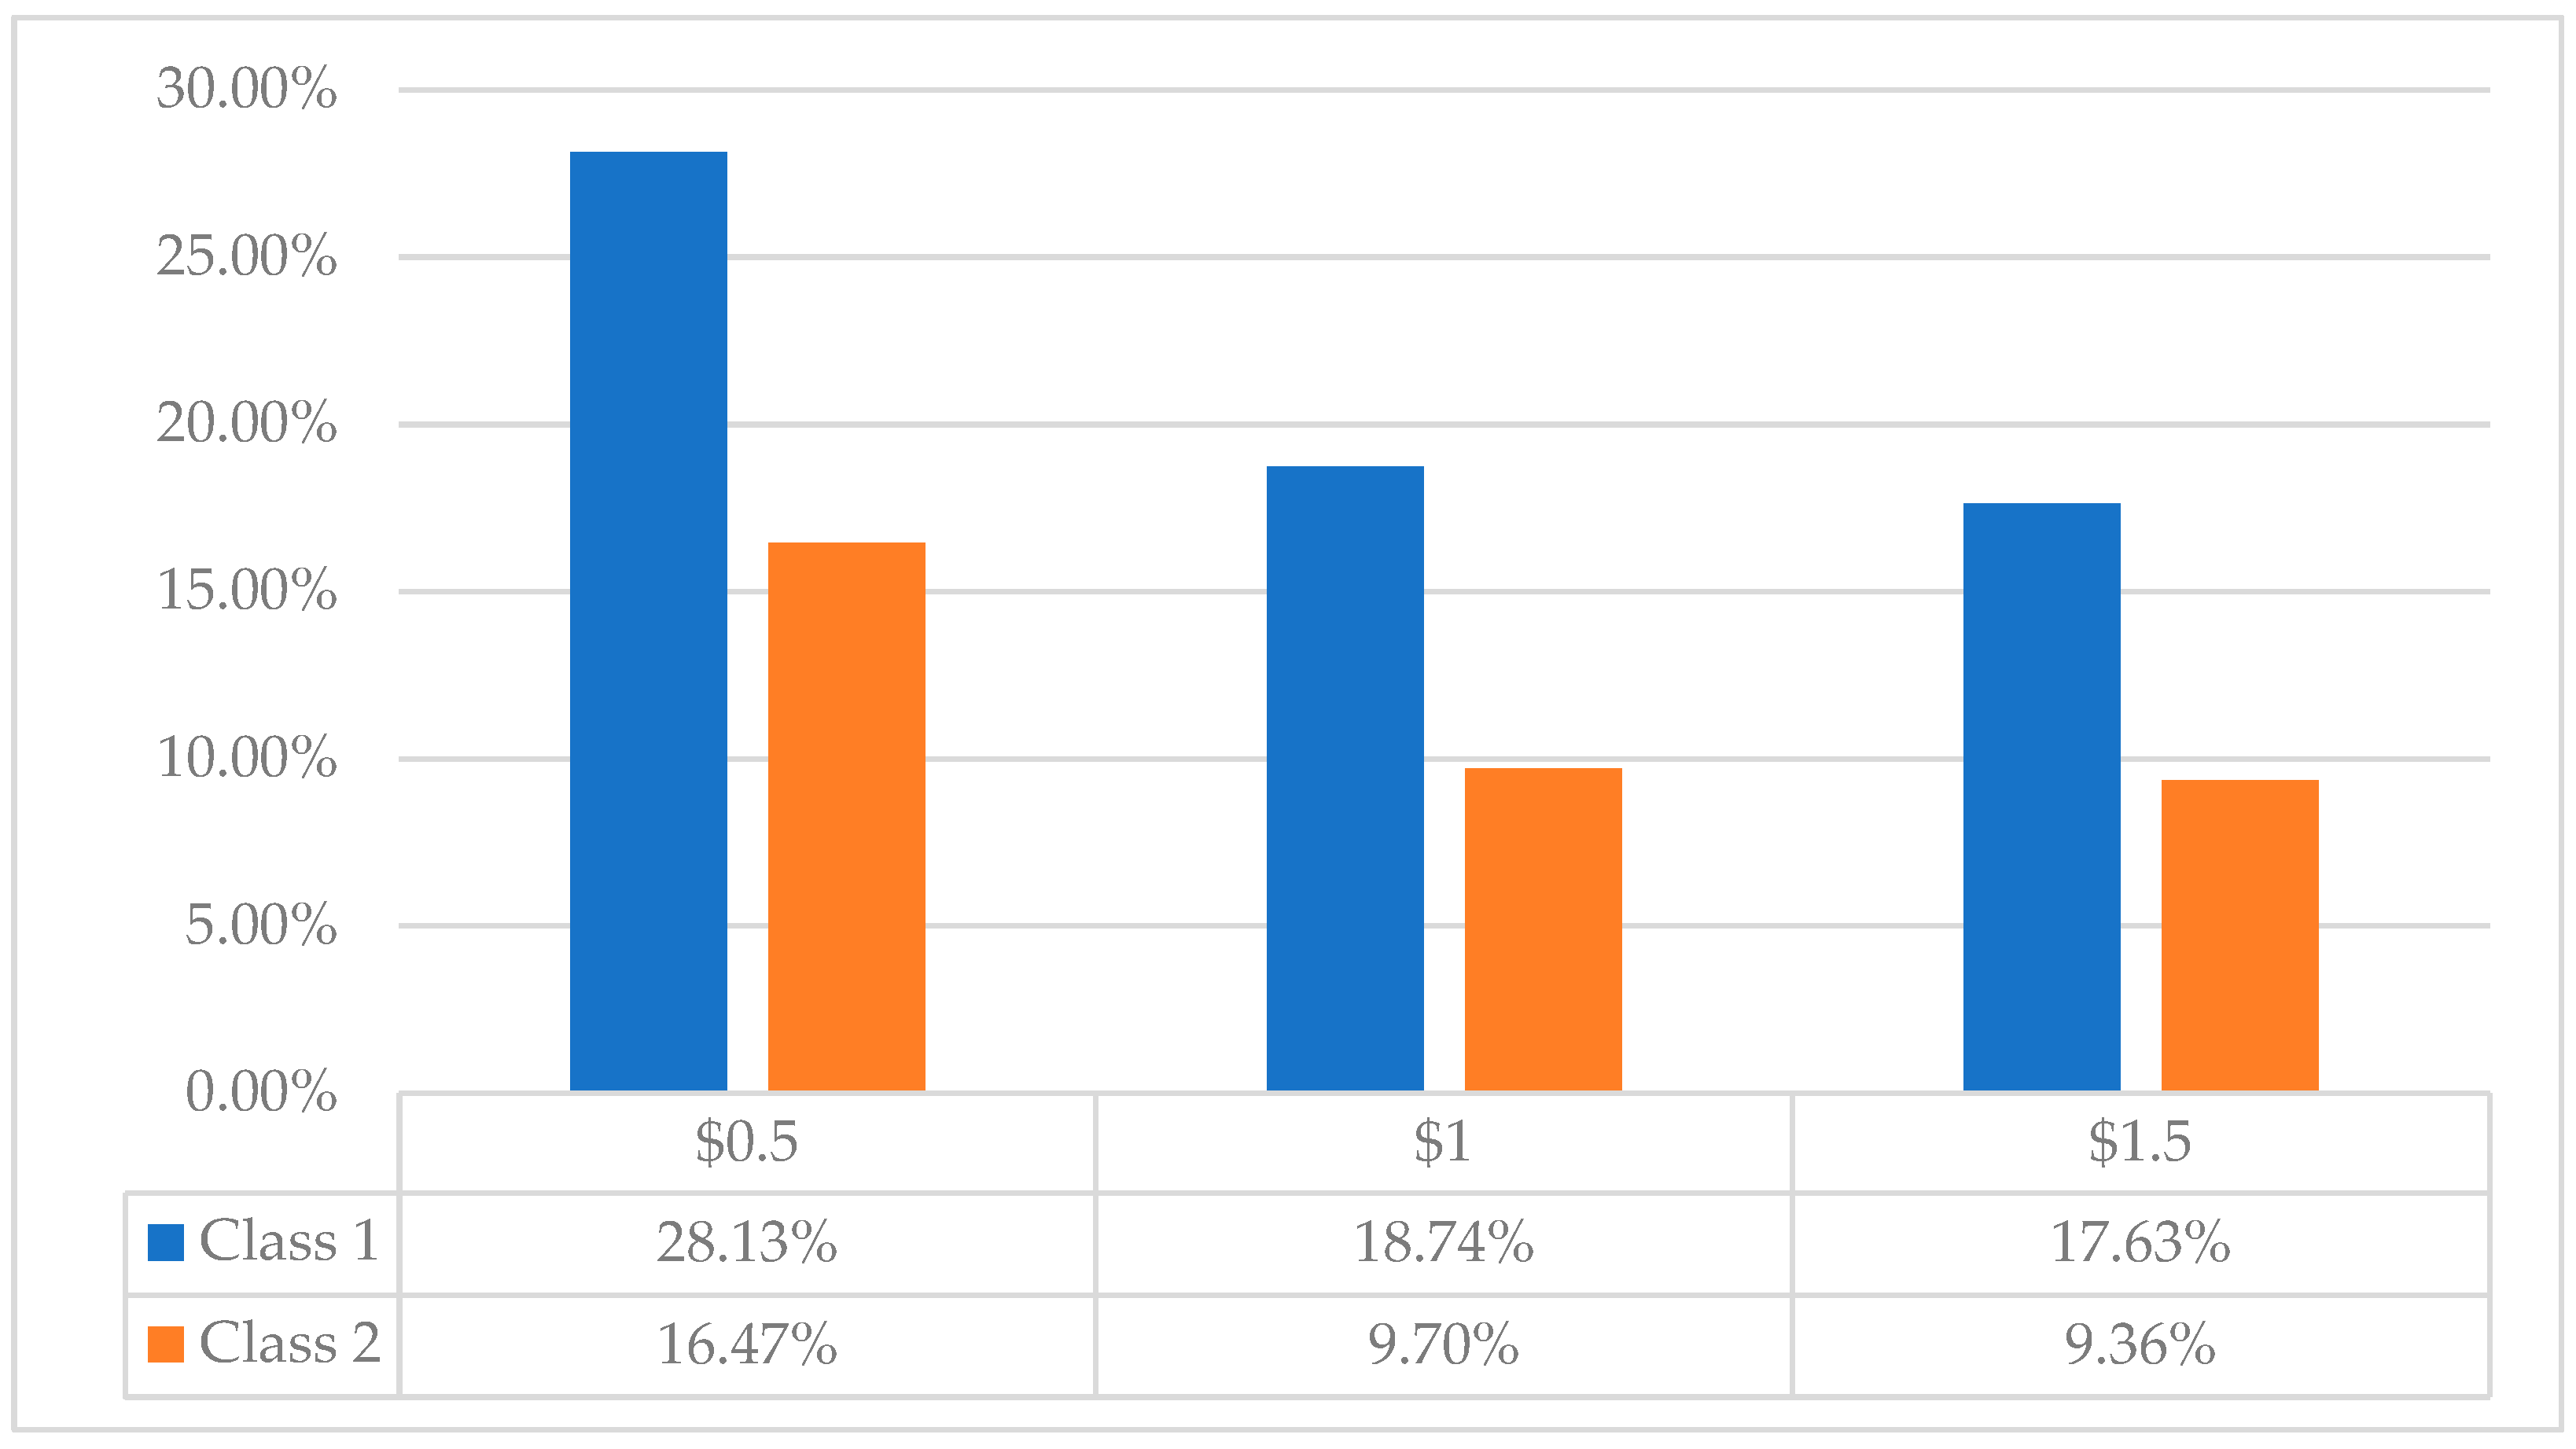
Figure 7 illustrates the significant influence of rental cost per h on user preferences. The data indicate heightened sensitivity toward this attribute. Notably, at a rental price of USD 0.50 per h, the likelihood of choosing a bike-sharing option was highest, reaching 44.6%. Conversely, with a rental cost of up to USD 1.50 per h, the likelihood of selecting this option decreased to approximately 26.99%.
A positive relationship between the cost and the likelihood of choosing a bike-sharing service (as shown in Figure 7) highlights the fact that cost may be the most powerful attribute which can alter mode choice behavior. This observation aligns with previous studies [26,41] which confirm that users perceive the monetary benefits of bike sharing in the form of reduced travel costs. This is especially true in the domain of tourism, where the cost of transportation modes is the key determinant of tourists’ transport choice [42].
To draw further insights into the interaction between non-monetary determinants such as access and egress time and monetary determinants such as cost, willingness to pay (WTP) for walking time from the origin to the bike location and from the bike location to the tourist destination was estimated. The results show that tourists are willing to pay USD 0.02 for every min reduction in their walking time from the origin to the bike location and USD 0.03 for every min reduction in their walking time from the bike location to the tourist destination.
As highlighted in bike-sharing studies [3,14,15,16,23,26,32,33,39], affordable bike-sharing prices can play a crucial role in aiding policymakers to strike a balance between meeting the demand of bike sharing among tourists, generating increased revenue for private business owners, as well as enhancing local community infrastructure from local governments’ perspectives. Adopting such price strategies, especially in tourist cities, can significantly influence mobility patterns, improve traffic safety, reduce air pollution, and enhance accessibility.
Based on the discussion in this section, a final analysis was conducted with a bike-sharing model that integrates the most optimal features identified for each alternative. This envisioned bike-sharing service offers round-the-clock availability (24 h a day, seven days a week), is accessible within a 5-min walk from both the origin and destination, features bikes stationed at specific designated locations, and provides a variety of payment options, notably including QR code payments, at an affordable rate of USD 1.00 per h. The findings from this scenario reveal that more than two out of five individuals (with a probability of 41.63%) are likely to choose this bike-sharing option for their travel tours. These outcomes offer valuable insights for traffic management authorities and policymakers, demonstrating that bike sharing can serve as an effective complement to existing transportation modes and help bridge the gap between supply and demand in tourist cities.

5. Conclusions

Bike sharing represents a relatively new sharing economy model that offer a switch mode for medium-distance utilitarian and recreational trips. While the feasibility of bike sharing has been deliberated in various countries [9,14,26,39], a recent concern has arisen regarding how bike sharing contributes to enhancing transportation sustainability [16]. In the domain of tourism, the imperfect public transport services necessitate alternative modes that are more convenient, cost-effective, and environmentally friendly for tourists. Nonetheless, the attributes of a bike-share system in tourism have not been well discussed.
Accordingly, this study explored how tourists consider different bike-share features when contemplating bike-sharing adoption, thus enriching the literature by offering firsthand insights into tourists’ demand for bike sharing and its diverse features.
Through the implementation of an SP survey, we applied a latent class model to understand tourists’ preferences regarding sharing economy transport modes. Our results revealed that variations in tourists’ preferences for bike-sharing selection in different situations could be explained by the effect of rental cost and walking time, as well as their interactions with other factors such as individual attributes and tourist types.
The present study highlights several crucial policy implications that are applicable across different contexts, underscoring the multifaceted nature of mode choice and its potential impact on mobility in tourist cities:
-
Pricing acts as the key monetary determinant: The study reaffirms that pricing remains the most potent instrument in the traffic management policy. Effective pricing strategies can significantly influence mode choice behavior, underscoring the importance of carefully calibrated rental bike fees to manage demand in tourist cities.
-
Access and egress time act as the key non-monetary determinant: The importance of access or egress time in bike-sharing selection points to the potential of policies aimed at modifying walking times as an effective complement to pricing strategies. Such measures can help in enforcing policies while also maintaining a degree of equity. The interaction between pricing and reduced walking times suggests that these strategies could be most effective when implemented together as part of a comprehensive policy bundle.
-
Individual attributes and other system attributes also play a crucial role in shaping bike-sharing selection: By understanding and leveraging these factors, private business owners can design more nuanced and effective pricing strategies. These factors provide additional levers to influence mode choice behavior beyond mere pricing adjustments.
-
Bike sharing acts as a solution: In tourist cities, bike sharing emerges as a viable strategy to address the challenges of tourists’ demand and the insufficient supply of public transport. Bike sharing has the potential to alleviate up to 41.63% of bike demand in the best-case scenarios. The availability of bike sharing in tourist cities contributes to a more sustainable mobility landscape.
While considering applicable policy implications, it is important to highlight that the existing transportation infrastructure plays a crucial role in the feasibility of implementing bike-sharing services. Assessing the current state of infrastructure and identifying areas for improvement is essential in determining the feasibility of implementing bike-sharing services in the context of tourism.
Overall, this study suggests both pricing (e.g., rental cost) and non-pricing strategies (e.g., access time and egress time) for bike sharing to provide more potential benefits for tourist cities. By adopting a bundled policy approach, authorities can enhance the efficiency and equity of bike-sharing systems, ultimately contributing to more sustainable and accessible tourism environments.
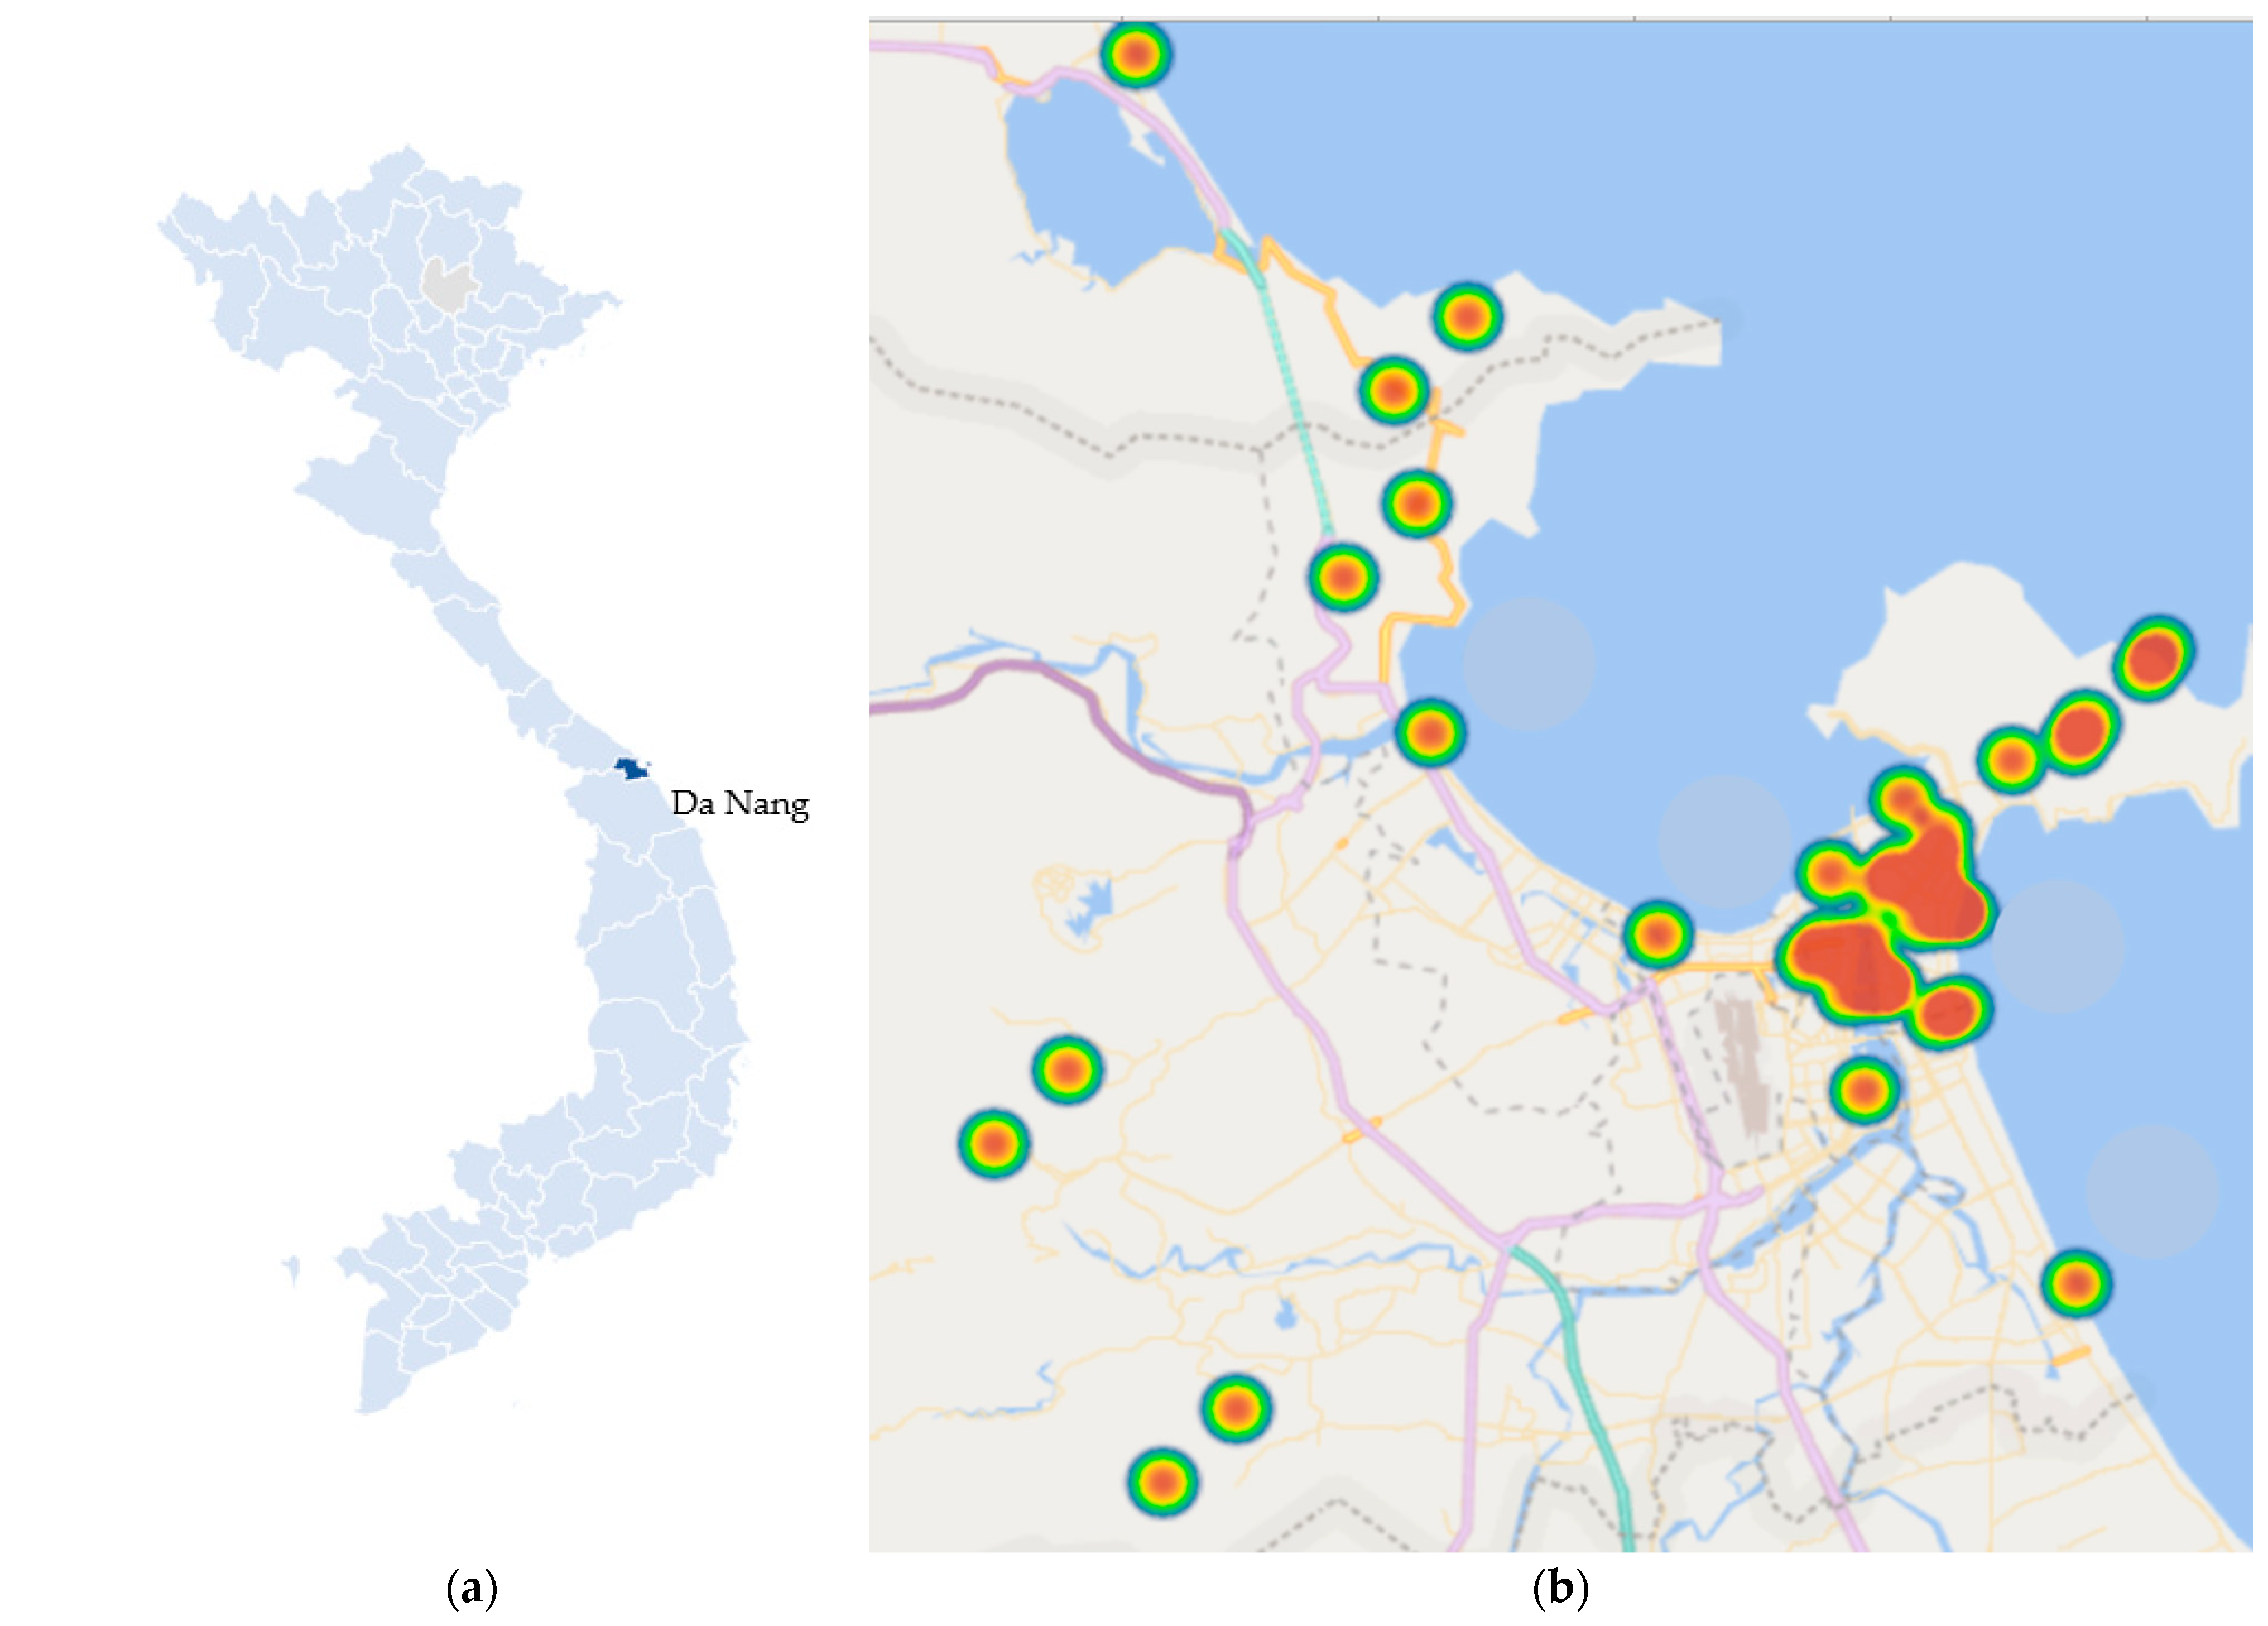
Although the present study offers insights into bike-sharing choice behavior by examining various attributes, it is important to acknowledge several limitations that could guide future research. First, our data were limited to a single destination, Da Nang, which may not be representative of cities with different public transport infrastructures. Variation in transport options across different cities could lead to differing patterns in bike-sharing choice behavior. Future studies should aim to gather data from diverse locations to ensure the generalizability of findings. Second, the travel mode choices of tourists are heavily influenced by factors beyond transportation attributes, such as the availability and quality of tourist attractions and accommodations [43]. Unsatisfactory transportation services at specific destinations or accommodations may prompt tourists to alter their mode choice or accommodation. Third, a connection between tourists’ preferences and the actual behavioral outcome was not ascertained due to insufficient data. Finally, our assumption regarding the irrelevance of “searching time” for a bike due to smartphone app availability may overlook a significant proportion of tourists who either lack access to smartphones or who may be unfamiliar with the app. This oversight could potentially skew the understanding of convenience factors in bike sharing. Future research should address these limitations.

Author Contributions

Conceptualization, V.N.T.; methodology, A.M.N.; software, A.M.N.; validation, V.N.T.; formal analysis, V.N.T. and A.M.N.; investigation, A.M.N.; resources, V.N.T.; data curation, V.N.T.; writing—original draft preparation, A.M.N.; writing—review and editing, V.N.T. and A.M.N.; visualization, V.N.T.; supervision, V.N.T. All authors have read and agreed to the published version of the manuscript.

Funding

This research received no external funding.

Institutional Review Board Statement

Not applicable.

Informed Consent Statement

Informed consent was obtained from all subjects involved in the study.

Data Availability Statement

Data are contained within the article.

Conflicts of Interest

The authors declare no conflicts of interest.

References

  1. Jain, D.; Tiwari, G. Sustainable mobility indicators for Indian cities: Selection methodology and application. Ecol. Indic. 2017, 79, 310–322. [Google Scholar] [CrossRef]
  2. Pulido-Fernández, J.; López-Sánchez, Y. Are Tourists Really Willing to Pay More for Sustainable Destinations? Sustainability 2016, 8, 1240. [Google Scholar] [CrossRef]
  3. DeMaio, P. Bike-sharing: History, Impacts, Models of Provision, and Future. J. Public Transp. 2009, 12, 41–56. [Google Scholar] [CrossRef]
  4. Teixeira, J.F.; Silva, C.; Moura e Sá, F. Empirical evidence on the impacts of bikesharing: A literature review. Transp. Rev. 2021, 41, 329–351. [Google Scholar] [CrossRef]
  5. Masiero, L.; Zoltan, J. Tourists Intra-destination visits and transport mode: A bivariate probit model. Ann. Tour. Res. 2013, 43, 529–546. [Google Scholar] [CrossRef]
  6. Watthanaklang, D.; Ratanavaraha, V.; Chatpattananan, V.; Jomnonkwao, S. Measuring the motivation to ride bicycles for tourism through a comparison of tourist attractions. Transp. Policy 2016, 52, 153–163. [Google Scholar] [CrossRef]
  7. Banet, K.; Naumov, V.; Kucharski, R. Using city-bike stopovers to reveal spatial patterns of urban attractiveness. Curr. Issues Tour. 2022, 25, 2887–2904. [Google Scholar] [CrossRef]
  8. Durán-Román, J.L.; Cárdenas-García, P.J.; Pulido-Fernández, J.I. Tourists’ willingness to pay to improve sustainability and experience at destination. J. Destin. Mark. Manag. 2021, 19, 100540. [Google Scholar] [CrossRef]
  9. Fukushige, T.; Fitch, D.T.; Handy, S. Can an Incentive-Based approach to rebalancing a Dock-less Bike-share system Work? Evidence from Sacramento, California. Transp. Res. Part A Policy Pract. 2022, 163, 181–194. [Google Scholar] [CrossRef]
  10. Mix, R.; Hurtubia, R.; Raveau, S. Optimal location of bike-sharing stations: A built environment and accessibility approach. Transp. Res. Part A Policy Pract. 2022, 160, 126–142. [Google Scholar] [CrossRef]
  11. Dilay, Ç.; Aslı, Y.; Hanife, I. Bicycle sharing system design with capacity allocations. Transp. Res. B Methodol. 2018, 114, 86–98. [Google Scholar]
  12. Florido-Benítez, L. The impact of tourism promotion in tourist destinations: A bibliometric study International. Int. J. Tour. Cities 2022, 8, 844–882. [Google Scholar] [CrossRef]
  13. Park, C.; Lee, S.; Lee, C.-K.; Reisinger, Y. Volunteer tourists’ environmentally friendly behavior and support for sustainable tourism development using Value-Belief-Norm theory: Moderating role of altruism. J. Destin. Mark. Manag. 2022, 25, 100712. [Google Scholar] [CrossRef]
  14. Radzimski, A.; Dzięcielski, M. Exploring the relationship between bike-sharing and public transport in Poznań, Poland. Transp. Res. Part A Policy Pract. 2021, 145, 189–202. [Google Scholar] [CrossRef]
  15. Shaheen, S.A.; Martin, E.W.; Cohen, A.P.; Chan, N.D.; Pogodzinski, M. Public Bikesharing in North America during a Period of Rapid Expansion: Understanding Business Models, Industry Trends & User Impacts; Mineta Transportation Institute: San Jose, CA, USA, 2014. [Google Scholar]
  16. Shaheen, S.A.; Guzman, S.; Zhang, H. Bikesharing in Europe, the Americas, and Asia. Transp. Res. Rec. J. Transp. Res. Board 2010, 2143, 159–167. [Google Scholar] [CrossRef]
  17. Zhang, Z.; Yang, Y.; Yang, S.; Zhang, Z. Can bike-sharing availability improve tourist satisfaction? Evidence in Chicago. Tour. Manag. Perspect. 2023, 48, 101164. [Google Scholar] [CrossRef]
  18. DeMaio, P.; Meddin, R. The Bike-Sharing World Map. 2020. Available online: www.bikesharingmap.com (accessed on 22 February 2024).
  19. Basak, E.; Iris, Ç. Do the First- and Last-Mile Matter? Examining the Complementary and Substitution Effects of Bike-Sharing Platforms on Public Transit. SSRN Electron. J. 2023; preprint. [Google Scholar] [CrossRef]
  20. Fishman, E.; Washington, S.; Haworth, N. Barriers and facilitators to public bicycle scheme use: A qualitative approach. Transp. Res. Part F Traffic Psychol. Behav. 2012, 15, 686–698. [Google Scholar] [CrossRef]
  21. Idowu, A.; Ohikhuare, O.M.; Chowdhury, M.A. Does industrialization trigger carbon emissions through energy consumption? Evidence from OPEC countries and high industrialised countries. Quant. Financ. Econ. 2023, 7, 165–186. [Google Scholar] [CrossRef]
  22. Li, Z.; Huang, Z.; Su, Y. New media environment, environmental regulation and corporate green technology innovation:Evidence from China. Energy Econ. 2023, 119, 106545. [Google Scholar] [CrossRef]
  23. Yang, Y.; Jiang, L.; Zhang, Z. Tourists on shared bikes: Can bike-sharing boost attraction demand? Tour. Manag. 2021, 86, 104328. [Google Scholar] [CrossRef]
  24. Kaplan, S.; Manca, F.; Nielsen TA, S.; Prato, C.G. Intentions to use bike-sharing for holiday cycling: An application of the Theory of Planned Behavior. Tour. Manag. 2015, 47, 34–46. [Google Scholar] [CrossRef]
  25. Fuller, D.; Gauvin, L.; Kestens, Y.; Daniel, M.; Fournier, M.; Morency, P.; Drouin, L. Use of a New Public Bicycle Share Program in Montreal, Canada. Am. J. Prev. Med. 2011, 41, 80–83. [Google Scholar] [CrossRef]
  26. Buehler, R.; Hamre, A. Economic Benefits of Capital Bikeshare: A Focus on Users and Businesses. 2014. Available online: https://rosap.ntl.bts.gov/view/dot/27421 (accessed on 22 February 2024).
  27. Hernández-Pérez, H.; Salazar-González, J.-J. A branch-and-cut algorithm for a traveling salesman problem with pickup and delivery. Discret. Appl. Math. 2004, 145, 126–139. [Google Scholar] [CrossRef]
  28. Gross, S.; Grimm, B. Sustainable mode of transport choices at the destination—Public transport at German destinations. Tour. Rev. 2018, 73, 401–420. [Google Scholar] [CrossRef]
  29. Nutsugbodo, R.Y.; Amenumey, E.K.; Mensah, C.A. Public transport mode preferences of international tourists in Ghana: Implications for transport planning. Travel Behav. Soc. 2018, 11, 1–8. [Google Scholar] [CrossRef]
  30. Grotenhuis, J.-W.; Wiegmans, B.W.; Rietveld, P. The desired quality of integrated multimodal travel information in public transport: Customer needs for time and effort savings. Transp. Policy 2007, 14, 27–38. [Google Scholar] [CrossRef]
  31. Le-Klähn, D.-T.; Roosen, J.; Gerike, R.; Hall, C.M. Factors affecting tourists’ public transport use and areas visited at destinations. Tour. Geogr. 2015, 17, 738–757. [Google Scholar] [CrossRef]
  32. Singla, A.; Santoni, M.; Bartók, G.; Mukerji, P.; Meenen, M.; Krause, A. Incentivizing Users for Balancing Bike Sharing Systems. In Proceedings of the AAAI Conference on Artificial Intelligence, Austin, TX, USA, 25–30 January 2015; Volume 29. [Google Scholar] [CrossRef]
  33. Ban, S.; Hyun, K.H. Designing a User Participation-Based Bike Rebalancing Service. Sustainability 2019, 11, 2396. [Google Scholar] [CrossRef]
  34. Murphy, E.; Usher, J. The Role of Bicycle-sharing in the City: Analysis of the Irish Experience. Int. J. Sustain. Transp. 2015, 9, 116–125. [Google Scholar] [CrossRef]
  35. Bachand-Marleau, J.; Lee, B.H.Y.; El-Geneidy, A.M. Better Understanding of Factors Influencing Likelihood of Using Shared Bicycle Systems and Frequency of Use. Transp. Res. Rec. J. Transp. Res. Board 2012, 2314, 66–71. [Google Scholar] [CrossRef]
  36. Roman, M.; Roman, M. Bicycle Transport as an Opportunity to Develop Urban Tourism—Warsaw Example. Procedia Soc. Behav. Sci. 2014, 151, 295–301. [Google Scholar] [CrossRef]
  37. Drius, M.; Bongiorni, L.; Depellegrin, D.; Menegon, S.; Pugnetti, A.; Stifter, S. Tackling challenges for Mediterranean sustainable coastal tourism: An ecosystem service perspective. Sci. Total Environ. 2019, 652, 1302–1317. [Google Scholar] [CrossRef]
  38. García-Melero, G.; Sainz-González, R.; Coto-Millán, P.; Valencia-Vásquez, A. Ridesourcing mode choice: A latent class choice model for UberX in Chile. Transp. Res. Interdiscip. Perspect. 2022, 16, 100722. [Google Scholar] [CrossRef]
  39. McFadden, D. Conditional Logit Analysis of Quantitative Choice Behavior. 1972. Available online: https://escholarship.org/content/qt61s3q2xr/qt61s3q2xr.pdf (accessed on 22 February 2024).
  40. Kabra, A.; Belavina, E.; Girotra, K. Bike-Share Systems: Accessibility and Availability. Manag. Sci. 2020, 66, 3803–3824. [Google Scholar] [CrossRef]
  41. Lee, A. Results of the 2019–2020 Campus Travel Survey; National Center for Sustainable Transportation, University of California: Davis, CA, USA, 2020. [Google Scholar]
  42. Lew, A.; McKercher, B. Modeling Tourist Movements. Ann. Tour. Res. 2006, 33, 403–423. [Google Scholar] [CrossRef]
  43. Kim, E.-J.; Kim, Y.; Jang, S.; Kim, D.-K. Tourists’ preference on the combination of travel modes under Mobility-as-a-Service environment. Transp. Res. Part A Policy Pract. 2021, 150, 236–255. [Google Scholar] [CrossRef]
Figure 1. Example of a choice task (translated from Vietnamese to English).
Sustainability 16 03375 g001
Figure 2. (a) location of Da Nang city in Vietnam and (b) road map in Da Nang city with tourist sites.
Sustainability 16 03375 g002
Figure 3. Likelihood of choosing a bike-share option depending on different service durations.
Sustainability 16 03375 g003
Figure 4. Likelihood of choosing a bike-share option depending on access distance.
Sustainability 16 03375 g004
Figure 5. Likelihood of choosing a bike-share option depending on egress distance.
Sustainability 16 03375 g005
Figure 6. Likelihood of choosing a bike-share option depending on different systems.
Sustainability 16 03375 g006
Figure 7. Likelihood of choosing a bike-share option depending on different rental costs per h.
Sustainability 16 03375 g007
Table 1. Summary of bike-sharing attributes used in previous studies.
Author (Year)Factors Influencing Bike-Sharing Choice
(Singla et al., 2015) [32]Accessibility, incentives, and value of time with the docked bike-sharing system
(Ban and Hyun, 2019) [33]Combination of accessibility and incentives with the docked bike-sharing system
(Fukushige et al., 2022) [6]Combination of accessibility and incentives in using dock-less bike-sharing system
(Murphy and Usher, 2015) [34]Gender, age, income, and payment method (debit/credit card)
(S.A. Shaheen et al., 2014) [15]Accessibility, affordability, journey travel time, and mobility cost
(Buehler and Hamre, 2014) [26]Travel time savings, enjoyment, exercise, and travel cost savings
(Fishman et al., 2012) [20]Mandatory helmet legislation, overnight closure, barriers to instant access, lack of cycle infrastructure, and road safety concerns
(Fuller et al., 2011) [25]Proximity to docking stations and age
(Bachand-Marleau et al., 2012) [35]Spatial factors, travel habits, annual membership, and positive opinion about bike design
Table 2. Attributes and levels in the choice of experimental design.
AttributesLevels
Service duration1-24/7
2-Limited h
Walking time from origin to bike location1-1 min
2-5 min
3-10 min
4-15 min
5-20 min
Walking time from bike location to tourist destination1-1 min
2-5 min
3-10 min
4-15 min
5-20 min
System1-dock-less system
2-docked system
3-secured parking
Payment method1-electronic wallet
2-QR code
Cost per h1-USD 0.50
2-USD 1.00
3-USD 1.50
Table 3. Descriptive analysis of survey sample.
VariableSurveyStatistics
Sample%
GenderMale39549.4%NA
Female40550.6%NA
TouristDomestics61977.4%65.4%
Foreigners18122.6%34.6%
Age groupYounger than 2015419.3%NA
20–3027934.9%NA
30–4020425.5%NA
40–509511.9%NA
50–60617.6%NA
Above 6070.9%NA
IncomeLess than USD 35013016.3%NA
USD 350–50016821.0%NA
USD 500–100022227.8%NA
USD 1000–150016821.0%NA
USD 1500–20008010.0%NA
USD 2000–2500232.9%NA
Above USD 250091.1%NA
Number of companions120.3%NA
2718.9%NA
372790.9%NA
Table 4. Comparison results for models with different numbers of latent classes.
Number of ClassesClass #Prob aLL bAICBIC
210.645 *−7628.115,264.815,294.3
20.355
310.529 *−7622.515,269.915,363.66
20.193 *
30.278
410.659 *−7620.915,276.6315,412.18
20.191
30.059
40.091
510.584 *−7617.7115,293.6515,525
20.155 *
30.066
40.144
50.051
a Estimated average class probability. b Log likelihood value. * Indicates that the constant term is significant at a 95% level of confidence.
Table 5. Results of model estimation for class 1.
VariablesLatent ClassLatent Class with Panel Effect
Coef.Std. Errorp-ValueCoef.Std. Errorp-Value
Service duration24/7 Base outcome
Limited h−0.0770.0310.014−0.0690.0280.013
Walking time from origin to bike location−0.1110.0240.000−0.1010.0220.000
Walking time from bike location to tourist destination−0.0690.0180.000−0.0610.0160.000
Systemdock-less systemBase outcome
docked system0.7000.0370.0000.6770.0360.000
Secured parking−0.1900.0460.000−0.1840.0440.000
Payment methodelectronic walletBase outcome
QR code0.0280.0280.3190.0280.0280.315
Cost per hUSD 0.50Base outcome
USD 1.000.7090.0380.0000.6770.0360.000
USD 1.50−0.2170.0520.000−0.1840.0440.000
GenderMaleBase outcome
Female0.0520.0300.0870.0490.0280.081
AgeYounger than 20Base outcome
20–30−0.0270.0350.459−0.0250.0320.422
30–40−0.0690.0480.166−0.0630.0440.152
40–50−0.0470.0710.558−0.0430.0650.512
50–60−0.4110.1270.001−0.3840.1190.001
TouristDomesticBase outcome
Foreigner−0.1640.0320.000−0.1520.0300.000
IncomeLess than USD 350Base outcome
USD 350–5000.1060.0380.0050.1180.0420.005
USD 500–10000.0960.0470.0470.0880.0430.043
USD 1000–1500−0.1090.0810.177−0.1110.0830.181
USD 1500–20000.2680.1230.0300.2760.1270.031
USD 2000–25000.4680.1830.0120.42200.1650.011
Companions0.0010.0030.5920.001.0030.536
Sigma −0.533 0.000
Model fit estimation
Number of estimated parameters4042
Sample size72007200
Initial log likelihood−8153.04−8928.956
Final log likelihood−7658.52−7628.075
Rho-square for the initial model0.1370.215
Akaike Information Criterion (AIC)16,185.3815,264.751
Bayesian Information Criterion (BIC)16,217.7515,294.343
Number of draws 1000
Table 6. Results of model estimation for class 2.
VariablesLatent ClassLatent Class with Panel Effect
Coef.Std. Errorp-ValueCoef.Std. Errorp-Value
Service duration24/7 Base outcome
Limited h−0.1880.0760.036−0.1700.0690.032
Walking time from origin to bike location−0.5710.1240.000−0.5180.1130.000
Walking time from bike location to tourist destination−0.1910.0500.000−0.1680.0440.000
Systemdock-less systemBase outcome
docked system−2.625−0.1400.000−2.539−0.1350.000
Secured parking−0.0800.0190.000−0.0780.0190.000
Payment methodelectronic walletBase outcome
QR code0.0250.0250.2850.0250.025 0.281
Cost per hUSD 0.50Base outcome
USD 1.000.7350.0390.0000.7020.0370.000
USD 1.50−1.1390.2720.000−0.9660.2310.000
GenderMaleBase outcome
Female0.3440.1970.5690.3210.1840.531
AgeYounger than 20Base outcome
20–30−0.0670.0861.131−0.0620.0791.039
30–40−0.3520.2460.850−0.3230.2260.779
40–50−0.1290.1961.541−0.1190.1791.414
50–601.5410.4780.0041.4400.4460.004
TouristDomesticBase outcome
Foreigner−0.0690.0140.000−0.0640.0130.000
IncomeLess than USD 350Base outcome
USD 350–5000.0950.0340.0040.1050.0380.004
USD 500–10000.0990.0490.0490.0910.0450.045
USD 1000–1500−0.5710.4270.931−0.5830.4360.950
USD 1500–20001.7550.8070.1971.8090.8330.203
USD 2000–25001.1530.4510.0301.0390.4060.027
Companions0.0010.0060.0173.0320.0050.015
Sigma −0.007 0.000
Model fit estimation
Number of estimated parameters4042
Sample size72007200
Initial log likelihood−8153.04−8928.956
Final log likelihood−7658.52−7628.075
Rho-square for the initial model0.1370.215
Akaike Information Criterion (AIC)16,185.3815,264.751
Bayesian Information Criterion (BIC)16,217.7515,294.343
Number of draws 1000
Disclaimer/Publisher’s Note: The statements, opinions and data contained in all publications are solely those of the individual author(s) and contributor(s) and not of MDPI and/or the editor(s). MDPI and/or the editor(s) disclaim responsibility for any injury to people or property resulting from any ideas, methods, instructions or products referred to in the content.

