Article

China’s Sustainable Energy Transition Path to Low-Carbon Renewable Infrastructure Manufacturing under Green Trade Barriers

1
Innovation Centre for Environment and Resources, Shanghai University of Engineering Science, No. 333 Longteng Road, Songjiang District, Shanghai 201620, China
2
Department of Environmental Sciences and Engineering, Gillings School of Global Public Health, University of North Carolina, Chapel Hill, NC 27599, USA
3
Centre for Process Integration, Department of Chemical Engineering and Analytical Science, The University of Manchester, Manchester M13 9PL, UK
*
Authors to whom correspondence should be addressed.
These authors contributed equally to this work.
Sustainability 2024, 16(8), 3387; https://doi.org/10.3390/su16083387
Submission received: 31 March 2024 / Revised: 11 April 2024 / Accepted: 16 April 2024 / Published: 18 April 2024
(This article belongs to the Special Issue Environmental Footprint and Sustainable Development)

Abstract

:
Facing green trade barriers from developed nations, particularly the EU, based on product carbon footprints, China’s renewable energy industries confront significant challenges in transitioning towards sustainability and low carbon emissions. This study delves into the carbon footprint of China’s renewable infrastructure, evaluating wind turbines, photovoltaic (PV) panels, and lithium batteries across varied decarbonization scenarios, emphasizing both production and international trade transportation. The initial findings for 2022 indicate baseline carbon footprints of 990,701 kg CO2-eq/MW for wind turbines, 2994.97 kg CO2-eq/kWp for PV panels, and 67.53 kg CO2-eq/kWh for batteries. Projections for 2050 suggest that decarbonization advancements could slash these footprints by up to 36.1% for wind turbines, 76.7% for PV panels, and 72.5% for batteries, closely mirroring the EU’s 2050 low-carbon benchmarks. Considerable carbon footprints from both domestic and international transportation have been quantified, underscoring the importance of logistic decarbonization. Based on these results, it is concluded that China’s steadfast commitment to a sustainable and climate-ambitious development path can provide globally competitive, low-carbon renewable infrastructure after 2030. The study advocates for a collaborative approach to product decarbonization across international trade, as opposed to erecting barriers, to effectively contribute to global climate objectives.

1. Introduction

Amid the rising challenges of climate change, the global community has rallied around a unified sustainability agenda, significantly underscored by the United Nations’ Sustainable Development Goals (SDGs) established in 2015 [1]. These ambitious goals aim to address a comprehensive array of global issues, including poverty, inequality, environmental degradation, and, crucially, climate action. Among them, achieving carbon neutrality is a critical objective across the globe to mitigate the adverse impacts of climate change. The Intergovernmental Panel on Climate Change (IPCC) has underscored the pressing need for immediate and substantial reductions in greenhouse gas (GHG) emissions to limit global warming to well below 2 degrees Celsius, aiming for 1.5 °C above pre-industrial levels, thereby emphasizing the urgency of curtailing emissions [2].
Reflecting the global call for action, many countries have now pledged to reach carbon neutrality by the mid-21st century [3]. Achieving Paris Agreement temperature goals requires carbon neutrality by the middle of the century with far-reaching transitions in the whole of society [4]. China, as part of its contribution to this global effort, announced in September 2020 its commitment to peak carbon dioxide emissions before 2030 and achieve carbon neutrality before 2060. The industrial sector has been identified as a significant contributor to China’s GHG emissions, responsible for over 65% of the country’s energy consumption and more than 70% of its total GHG emissions [5]. Thus, electricity supply should be the first priority for decarbonization, as it is instrumental in advancing the country’s climate goal [6].
Renewable energy is becoming increasingly pivotal in the context of globalized interactions, significantly influencing the way nations collaborate and engage with each other. As the global community grows more conscious of the need for sustainable development, the significance of renewable energy infrastructure, including wind turbines, photovoltaic (PV) panels, and lithium batteries, is taking center stage in international trade and diplomacy [7,8]. Wind and PV power are pivotal in developing a sustainable society toward carbon neutrality [9]. The intermittency and unpredictability of these natural resources necessitate energy storage systems, with rechargeable Li-ion batteries emerging as leading candidates [10]. Investments in renewable energy sources are becoming economically viable as the costs of PV and wind turbines continue to decline, further driving the transition to a low-carbon economy [10]. The global and U.S. cumulative installed capacities for solar and wind energy, significant as of 2020, are expected to increase substantially by 2050, underscoring the growing reliance on these sustainable energy sources [11]. Additionally, the electrification of transportation, particularly through electric vehicles powered by lithium-ion batteries, is set to play a crucial role in reducing carbon emissions and fostering a net-zero economy [12].
The transition towards renewable energy and the associated infrastructure are crucial not just for reducing GHG emissions but also for ensuring energy security and economic sustainability. As such, the development and deployment of wind turbines, PV panels, and lithium batteries represent key components of the global strategy to combat climate change and achieve the SDGs, especially those related to affordable and clean energy (SDG 7) and climate action (SDG 13).
However, the production of renewable energy infrastructure is associated with significant carbon footprints. This paradox arises because the manufacturing processes often rely on energy-intensive materials and methods. For instance, the production of PV panels still entails environmental impacts that occur earlier in the supply chain, indicating a shift in carbon footprint shares along the supply chain [13]. Developed countries are addressing the challenge of significant indirect GHG emissions associated with imported goods, while also safeguarding their own manufacturing industries, through the implementation of green trade barriers. These include measures such as the Carbon Border Adjustment Mechanism and new European battery regulations. It is highly probable that China’s renewable energy products, in addition to batteries, will fall under such trade policies, potentially restricting their exportation [14]. The European Union’s Battery Regulation, with its mandatory eligibility for full-life cycle carbon footprint declaration, significantly impacts the global leading lithium battery industry, China. Consequently, the export competitiveness of Chinese lithium batteries is expected to decline due to the imposition of import carbon tariffs by receiving countries [15]. This indicates the importance of analyzing the future carbon footprint of renewable energy infrastructure to understand its potential effectiveness in preventing carbon leakage.
Previous studies have extensively investigated the carbon footprint of renewable energy power generation, focusing largely on the national level and specific technologies. For example, Li et al. [16] examined the life cycle CO2 emissions of eight power generation technologies across China, offering a comprehensive overview at a national scale. Pehnt [17] utilized a dynamic life cycle assessment (LCA) method to assess the projected environmental impact of renewable energy by 2030, while Emmott et al. [18] analyzed the impact of photovoltaic technology selection on the carbon budget during the energy transition. The cradle-to-gate energy use and GHG emissions of lithium-ion batteries were analyzed along with the potential emission reductions through grid decarbonization [19].
These studies, alongside data from the Ecoinvent database [20], provide valuable insights into a clear carbon footprint level and contribution for the renewable energy infrastructure. However, these existing analyses have limitations, particularly in not adequately considering dynamic decarbonization scenarios or accounting for the carbon footprint contributions from international trade transportation. This oversight is significant in the context of international trade policies leveraging product carbon footprints as a means to restrict high-carbon products from countries like China, where the energy system is still predominantly coal-based. The absence of a thorough analysis that incorporates a wide array of future decarbonization pathways and accounts for the carbon footprint of international transportation limits the efficacy of guiding China and other developing nations in formulating industrial manufacturing decarbonization strategies [21].
Thus, to fill these voids, this study provides a detailed examination of renewable energy infrastructure’s carbon footprint in China, factoring in different decarbonization pathways and the implications of international trade. Employing a comprehensive cradle-to-gate analysis, we meticulously assess the future carbon footprint of wind turbines, PV panels, and lithium batteries within the context of various decarbonization scenarios in China. Furthermore, this study uniquely integrates the carbon footprint contributions from both domestic and international transportation, offering a holistic view of the climate change impact of China’s renewable infrastructure manufacturing and exportation. This study highlights the pivotal role of China’s shift towards low-carbon manufacturing and sustainable trade practices in overcoming the hurdles of green trade barriers. It advocates for a global collaborative approach to climate change mitigation, emphasizing the interconnection of domestic energy policies, manufacturing practices, and international trade dynamics in reducing the environmental impact of renewable energy infrastructure.

2. Methods

We employed the ISO 14040 standard [22] as the framework for the LCA methodology, which consists of Goal and Scope Definition, Life Cycle Inventory (LCI), Life Cycle Impact Assessment (LCIA), and Interpretation [23]. The scenario analysis framework was advanced based on our previous research about water treatment module manufacture [24].

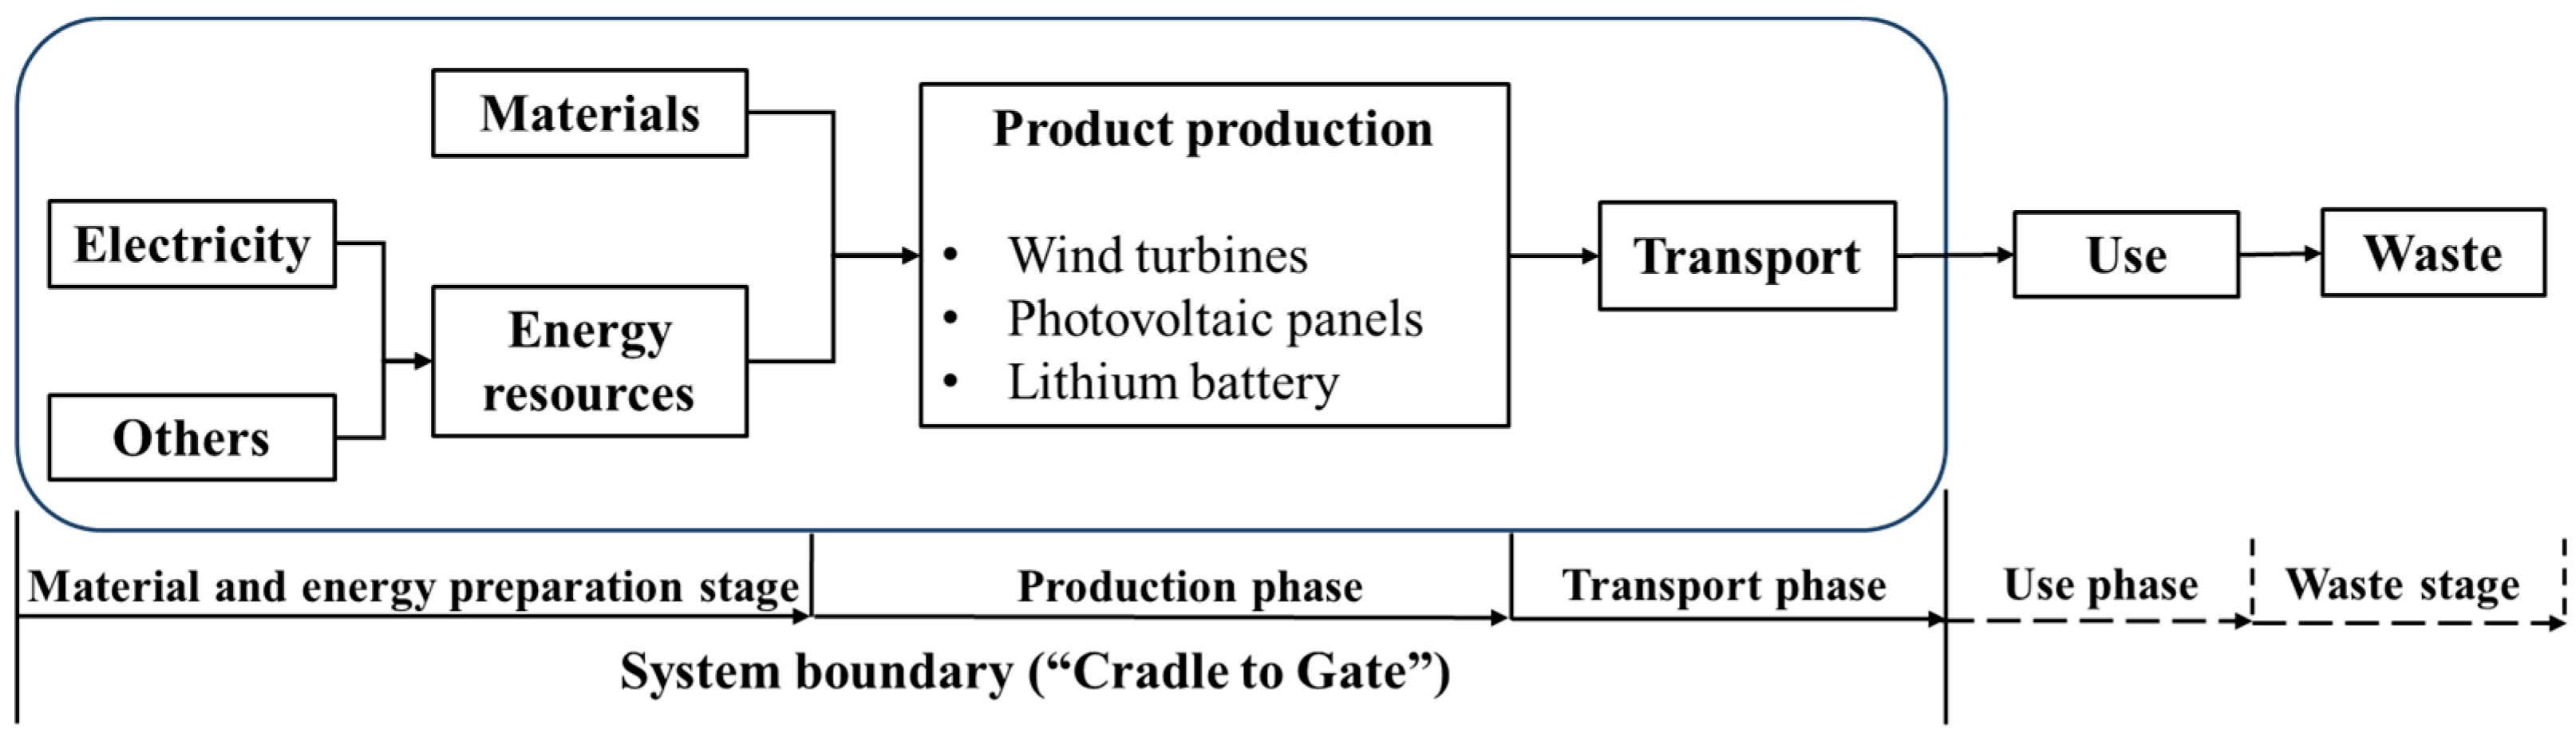
2.1. Goal and Scope Definition

PAS 2050 categorizes the life cycle of a product as either “cradle-to-gate” or “cradle-to-grave”. The former encompasses the process from the extraction of raw materials through the production and processing of products and packaging, up to the point where products are shipped or delivered to downstream customers. The latter extends this to include use, disposal, and recycling. In this study, the system boundary in Figure 1 is divided into three stages: the acquisition of raw materials required for the product, the energy input at the production stage, and the transportation process from the producer to the consumer. Depending on the distinct characteristics of the product, the functional unit is defined as the total peak power of solar photovoltaic cells per kWp, the carbon footprint generated by photovoltaic panels and wind turbines per MW, and lithium batteries per kWh capacity. Due to uncertainties in the upstream and downstream supply chains, the transportation of raw materials, product use, and waste management are not considered in this analysis.

2.2. Inventory Analysis

The inventory analysis for the LCA considers data for 1 kWp of ground-mounted solar panels, 1 MW of onshore wind turbines, and 1 kg of lithium-ion batteries sourced from the Ecoinvent V3.7 database. GHG emissions associated with these products are computed using the IPCC 2013 GWP 100a method, which provides the Global Warming Potential over a 100-year period, as shown in Table 1. The energy storage capacity of lithium batteries is adjusted based on the average energy density of lithium-ion batteries (160 Wh/kg) [25]. The detailed data required for the calculation are contained in the Supplementary Materials S1.

2.3. Impact Analysis

The carbon footprint analysis model within the specified system boundary involves summing the total carbon footprint across the three life cycle stages of raw material acquisition, energy input, and transportation. This is reflected in the life cycle carbon footprint formula for the three products as follows:
G H G P i = G H G M i + G H G E i + G H G T i
where GHGPi represents the life cycle carbon footprint of the three different products and GHGMi, GHGEi, and GHGTi denote the carbon footprints at the stages of raw material acquisition, energy input, and transportation, respectively.
Given the paper’s emphasis on the influence of electricity decarbonization on the future carbon footprint of products, referring to Lu’s method [26], the cumulative GHG emissions from cradle to gate for 1 kWp photovoltaic panels, 1 MW wind turbines, and 1 kg lithium batteries are divided into electricity consumption processes (GHGele) and other processes (GHGother), as shown in Equation (2).
G H G P i = G H G e l e ( i ) + G H G o t h e r ( i )
G H G e l e ( i ) = P C i × E C F n a t i o n
Within this equation, PCi corresponds to the electricity consumption by different products during the production process. The energy transition plays a vital role in the global shift to a low-carbon future, and the extensive deployment of renewable energy facilities will influence the carbon footprint factor of electricity. Therefore, the ECFnation [kg CO2-eq/kWh] produced by the grid structure of different countries (n) at different times (t) will vary, as outlined in the following equation:
E C F n a t i o n n , t =   k E C F e n e r g y   n , t , k × E L E n , t , k   k E C F e n e r g y   n , t , k
Based on the World Energy Outlook 2023 report by the International Energy Agency [27], this study incorporates seven types of energy sources for power generation: coal, natural gas, nuclear power, hydropower, biomass, wind, and solar. ECFenergy [kg CO2-eq/kWh] represents the carbon footprint per kilowatt–hour for electricity produced by these different energy sources. ELE [kWh] corresponds to the amount of electricity generated within the grid structure by each type of energy source. For detailed data on ECFenergy and ELE, refer to Supplementary Materials S1.
The calculation for the carbon footprint during the transportation phase is as per the following Equation (5):
G H G T i = W i × D × T C F j
Here, Wi is the weight of different products, D is the distance traveled, and TCFj is the carbon footprint per kilometer of different modes of transportation [kg CO2-eq/(t∙km)], which in this paper are considered for road, rail, and shipping. Refer to S1 in the SI for detailed data regarding Wi and TCFj.

2.4. Scenario Analysis

2.4.1. Scenario Definition for Power Grid Decarbonization

The social transformation pathways proposed by the IPCC in 2010 [28] are namely SSP1 (sustainability, taking the green road); SSP2 (middle of the road); SSP3 (regional rivalry, a rocky road); SSP4 (inequality, a road divided); and SSP5 (fossil-fueled development, taking the highway). Based on the SSPs and temperature targets, namely no climate target (NCT), a deep decarbonization target (2 °C) [29], and a net-zero emissions target (1.5 °C) [30], Li et al. [31] projected changes in the energy mix of China’s power sector from 2020 to 2050. Based on these data, SSP1 + 1.5 °C, SSP2 + 2 °C, and SSP3 + NCT, which represent the low-carbon scenario, the medium-carbon scenario, and the high-carbon scenario, were selected after calculating and screening the electricity carbon footprint under each pathway. Then, taking into account the future development of CCS technologies to promote the decarbonization of the power sector, this paper sets different CCS penetration ratios and combines them with the selected scenarios to explore the impact on low-carbon power infrastructure under extreme and intermediate scenarios, as explained in Supplementary Materials S2.
Three distinct power decarbonization scenarios emerge from this combination: SSP1, which adheres to the ambitious 1.5 °C warming threshold with full CCS implementation (PDS1); SSP2, a middle-of-the-road scenario that aims for the 2 °C target with 50% CCS (PDS2); and SSP5, a business-as-usual scenario with no GHG mitigation efforts (PDS3), as outlined in Table 2.

2.4.2. Different Transport Scenarios

To thoroughly analyze products’ carbon footprints in the context of international trade, the study incorporates various transportation scenarios, encompassing diverse origins, destinations, and combinations of domestic and international transport modes [32,33,34]. These scenarios encompass manufacturing in Xinjiang, leveraging its abundant solar energy for global markets, and trucking—encompassing diesel and electric vehicles—from coastal regions such as Shanghai to Japan and India. The scenario matrix captures the varied transport distances, product weights, and modes of transportation (Table 3), with specific transport distance data detailed in Supplementary Materials S2.

3. Results and Discussion

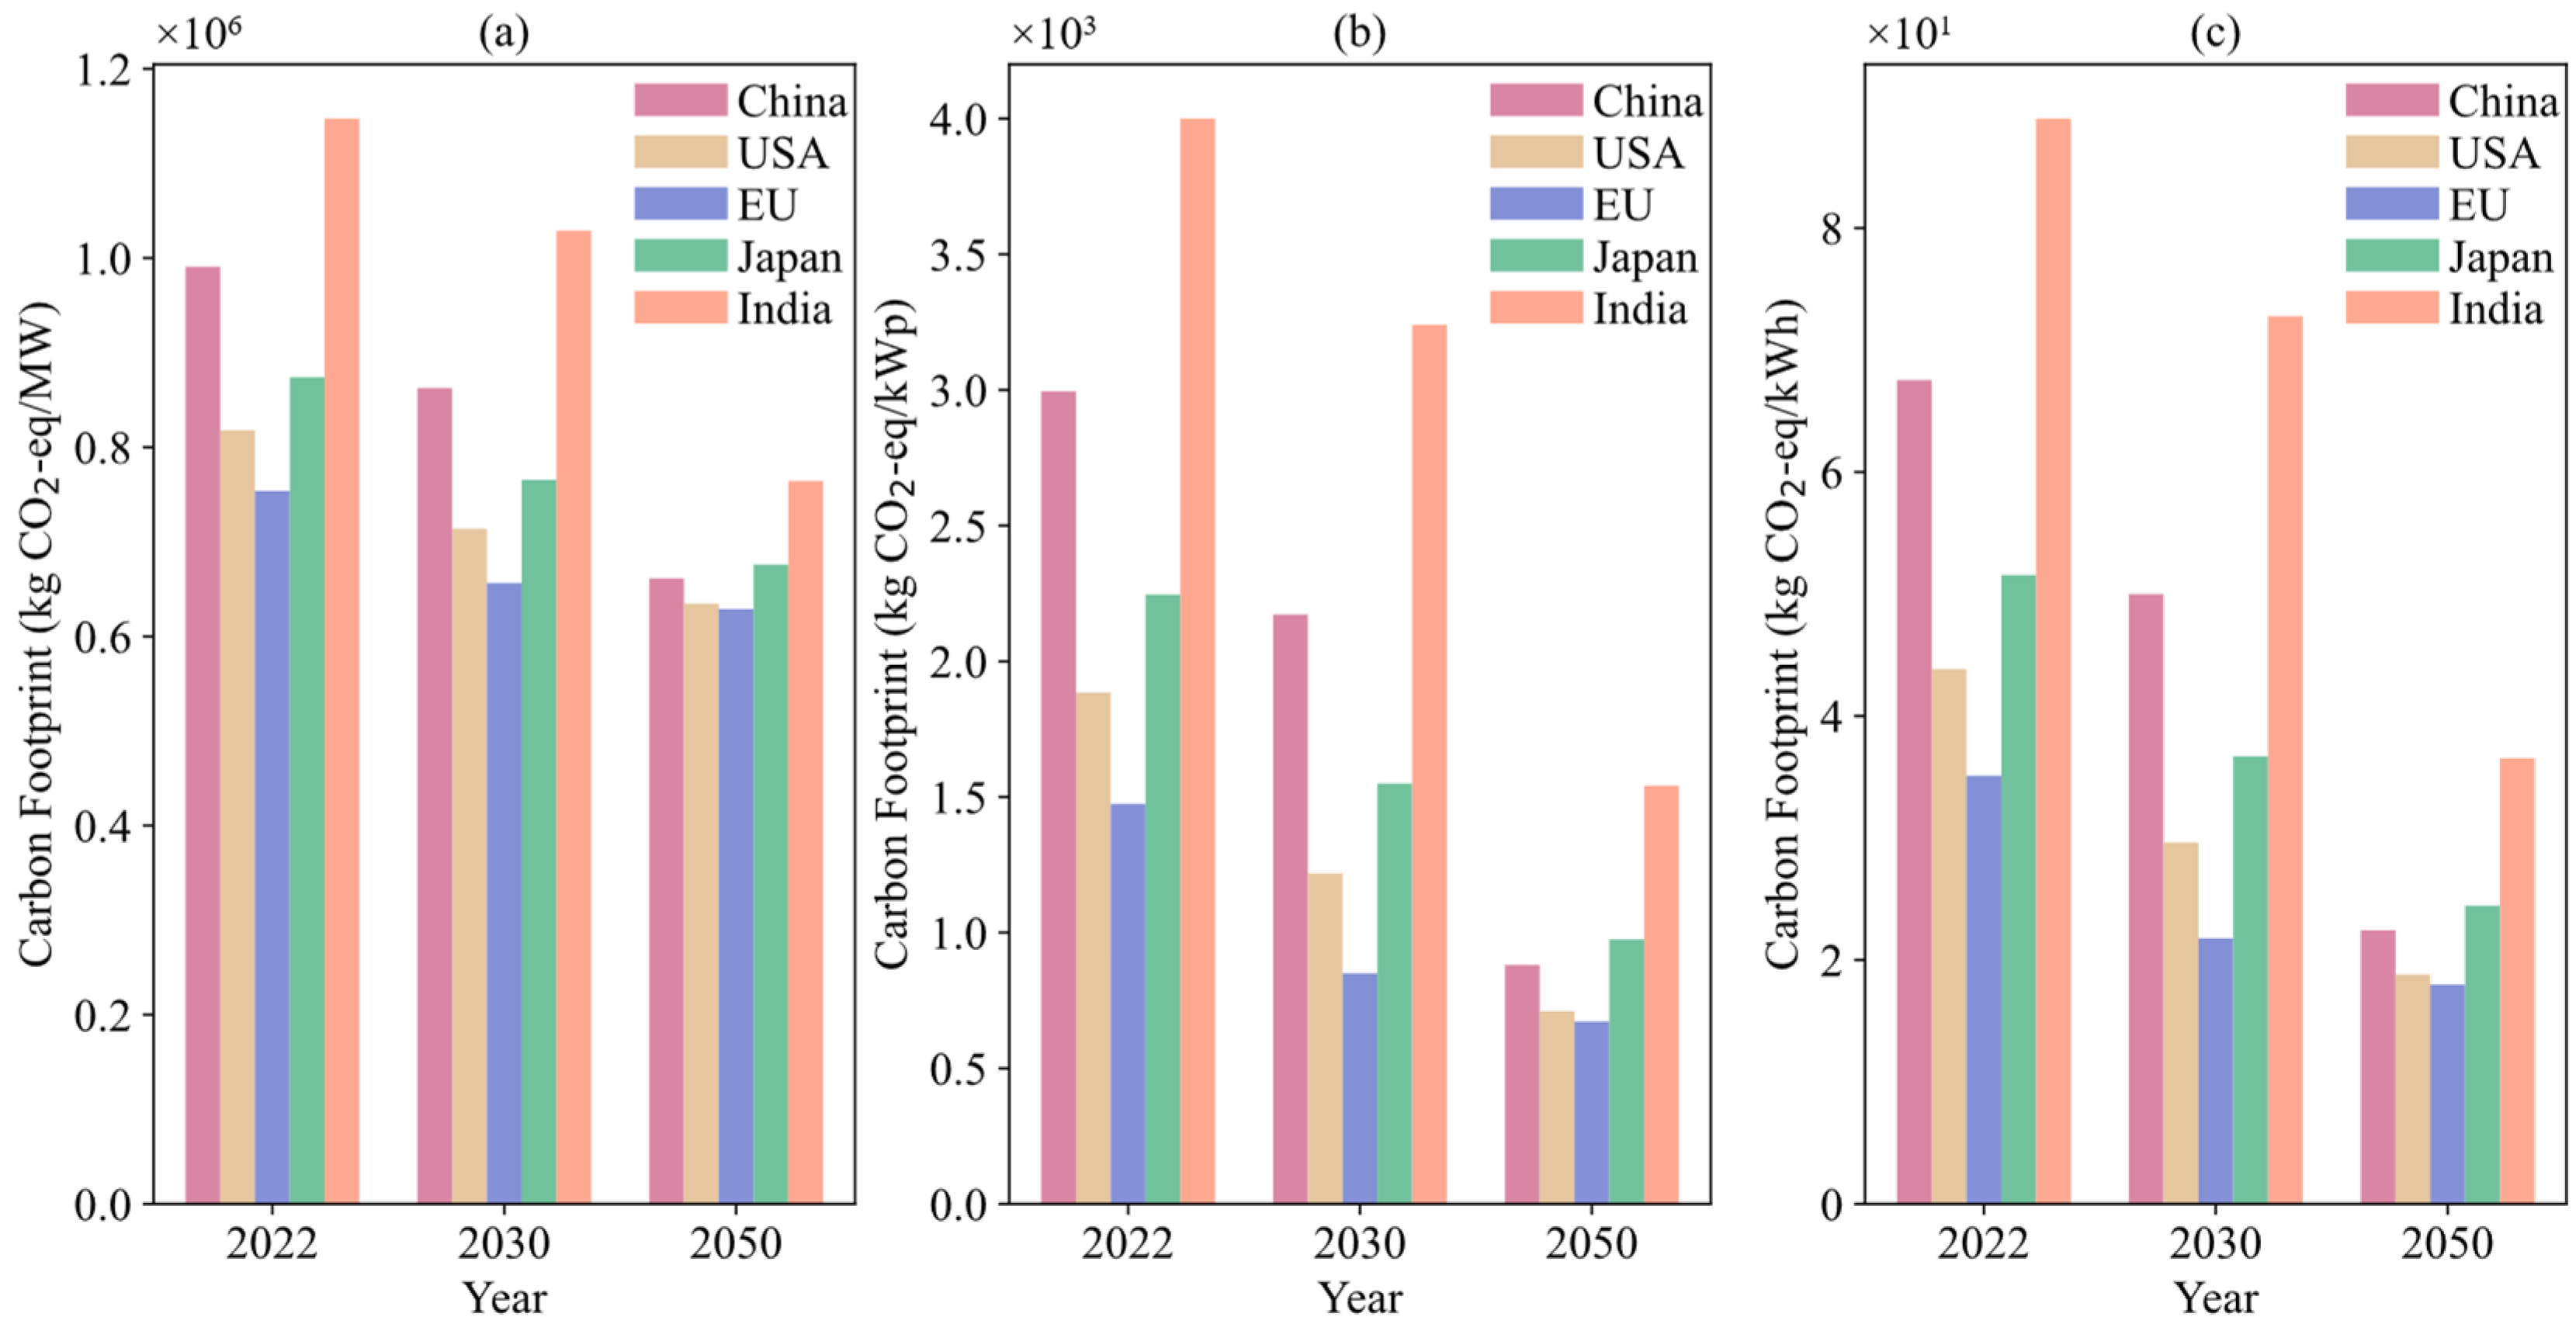
3.1. Future Carbon Footprint of Renewable Infrastructure Manufactured in Various Countries

Figure 2 estimates the carbon footprint of renewable energy infrastructure based on the IEA’s projections of the grid structure in different countries in 2022, 2030, and 2050. The relevant data can be found in Table S5.
The 2022 data serve as a reference point: India’s carbon footprint was the highest at approximately 1,147,288 kg CO2-eq/MW, primarily due to carbon-intensive practices. China followed with a footprint of about 990,701 kg CO2-eq/MW, then Japan, the USA, and the EU with 873,959, 817,712, and 753,774 kg CO2-eq/MW, respectively. The latter regions’ lower footprints reflect more efficient production methodologies. Projections for 2050, based on the anticipated energy mix changes, suggest the EU will lead in footprint reduction, with a 16.6% decrease from its 2030 figure. The USA and China are projected to decrease by 11.1% and 23.3%, respectively, from their 2030 levels, illustrating significant strides, especially by China, in enhancing renewable energy capacity. Japan and India are also expected to achieve further reductions. Comparatively, China’s 2022 carbon footprint stood 31.4% higher than the EU’s and 21.1% higher than the USA’s. By 2050, progressive energy policies are forecasted to narrow this gap significantly, positioning China’s footprint within 5.2% of the EU’s and only 4.2% higher than the USA’s—a remarkable alignment with global decarbonization leaders. Furthermore, China is anticipated to surpass Japan with a 2.2% lower footprint, underlining China’s notable decarbonization advancements relative to its peers.
The trend of decarbonization in photovoltaic (PV) panel production parallels that observed in wind turbine manufacturing, yet the extent and impact of reductions vary, notably due to the significant energy intensity inherent in PV panel production. In the baseline year of 2022, China’s carbon footprint for PV panel production was approximately 2994.97 kg CO2-eq/kWp, with projections indicating an impressive 70.6% reduction by 2050. By the year 2050, the anticipated reduction in carbon footprint positions China as a leading nation in the energy decarbonization of the PV supply chain. Although China’s carbon footprint for producing PV panels remains about 24.0% and 31.0% higher than that of the EU and the USA, respectively, this represents a significant decrease from the 58.9% and 103.1% higher rates observed in 2022. Notably, China’s efforts result in a carbon footprint that is 9.6% lower than Japan’s and markedly 42.9% lower than India’s by 2050. The differential reduction rates across these countries are primarily due to the variable impacts of electricity’s contribution compared with wind turbines. The energy-intensive nature of PV panel production means that shifts towards a cleaner electricity grid translate more directly into reductions in the carbon footprint of PV products.
The trajectory of decarbonization in lithium battery production is among the trends observed in both wind turbine and PV panel manufacturing. In 2022, China’s carbon footprint in lithium battery production stood at approximately 67.53 kg CO2-eq/kWh, showcasing a projected reduction to 22.43 kg CO2-eq/kWh by 2050, marking a substantial decrease of about 66.8%. By 2050, while China’s lithium battery production carbon footprint is anticipated to be slightly higher than the EU’s (17.99 kg CO2-eq/kWh) and the USA’s (18.80 kg CO2-eq/kWh) by approximately 24.7% and 19.3%, respectively, it represents a significant improvement from 2022, demonstrating China’s substantial progress in closing the gap with these regions. Moreover, China’s efforts yield a footprint 9.2% lower than Japan’s (24.44 kg CO2-eq/kWh) and significantly lower than India’s (36.52 kg CO2-eq/kWh) by 38.5%.
To sum up, the decarbonization trends in wind turbine, photovoltaic (PV) panel, and lithium battery production underline the critical role of electricity consumption in determining the overall carbon footprint of these technologies. Beyond the impact of electricity’s carbon intensity, other significant sources contribute to the life cycle carbon footprint of these products, for example, from the production of critical metals [35], silicon crystals [36], and electrode materials [37], which are essential components of these technologies. Nevertheless, the projections of the IEA, while informative, fall short of detailing the nuanced year-on-year shifts and scenario-based outcomes necessary for a robust low-carbon strategy. This highlights the critical need for a deeper, more tailored analysis to effectively navigate China’s sustainable energy transition under different scenarios.

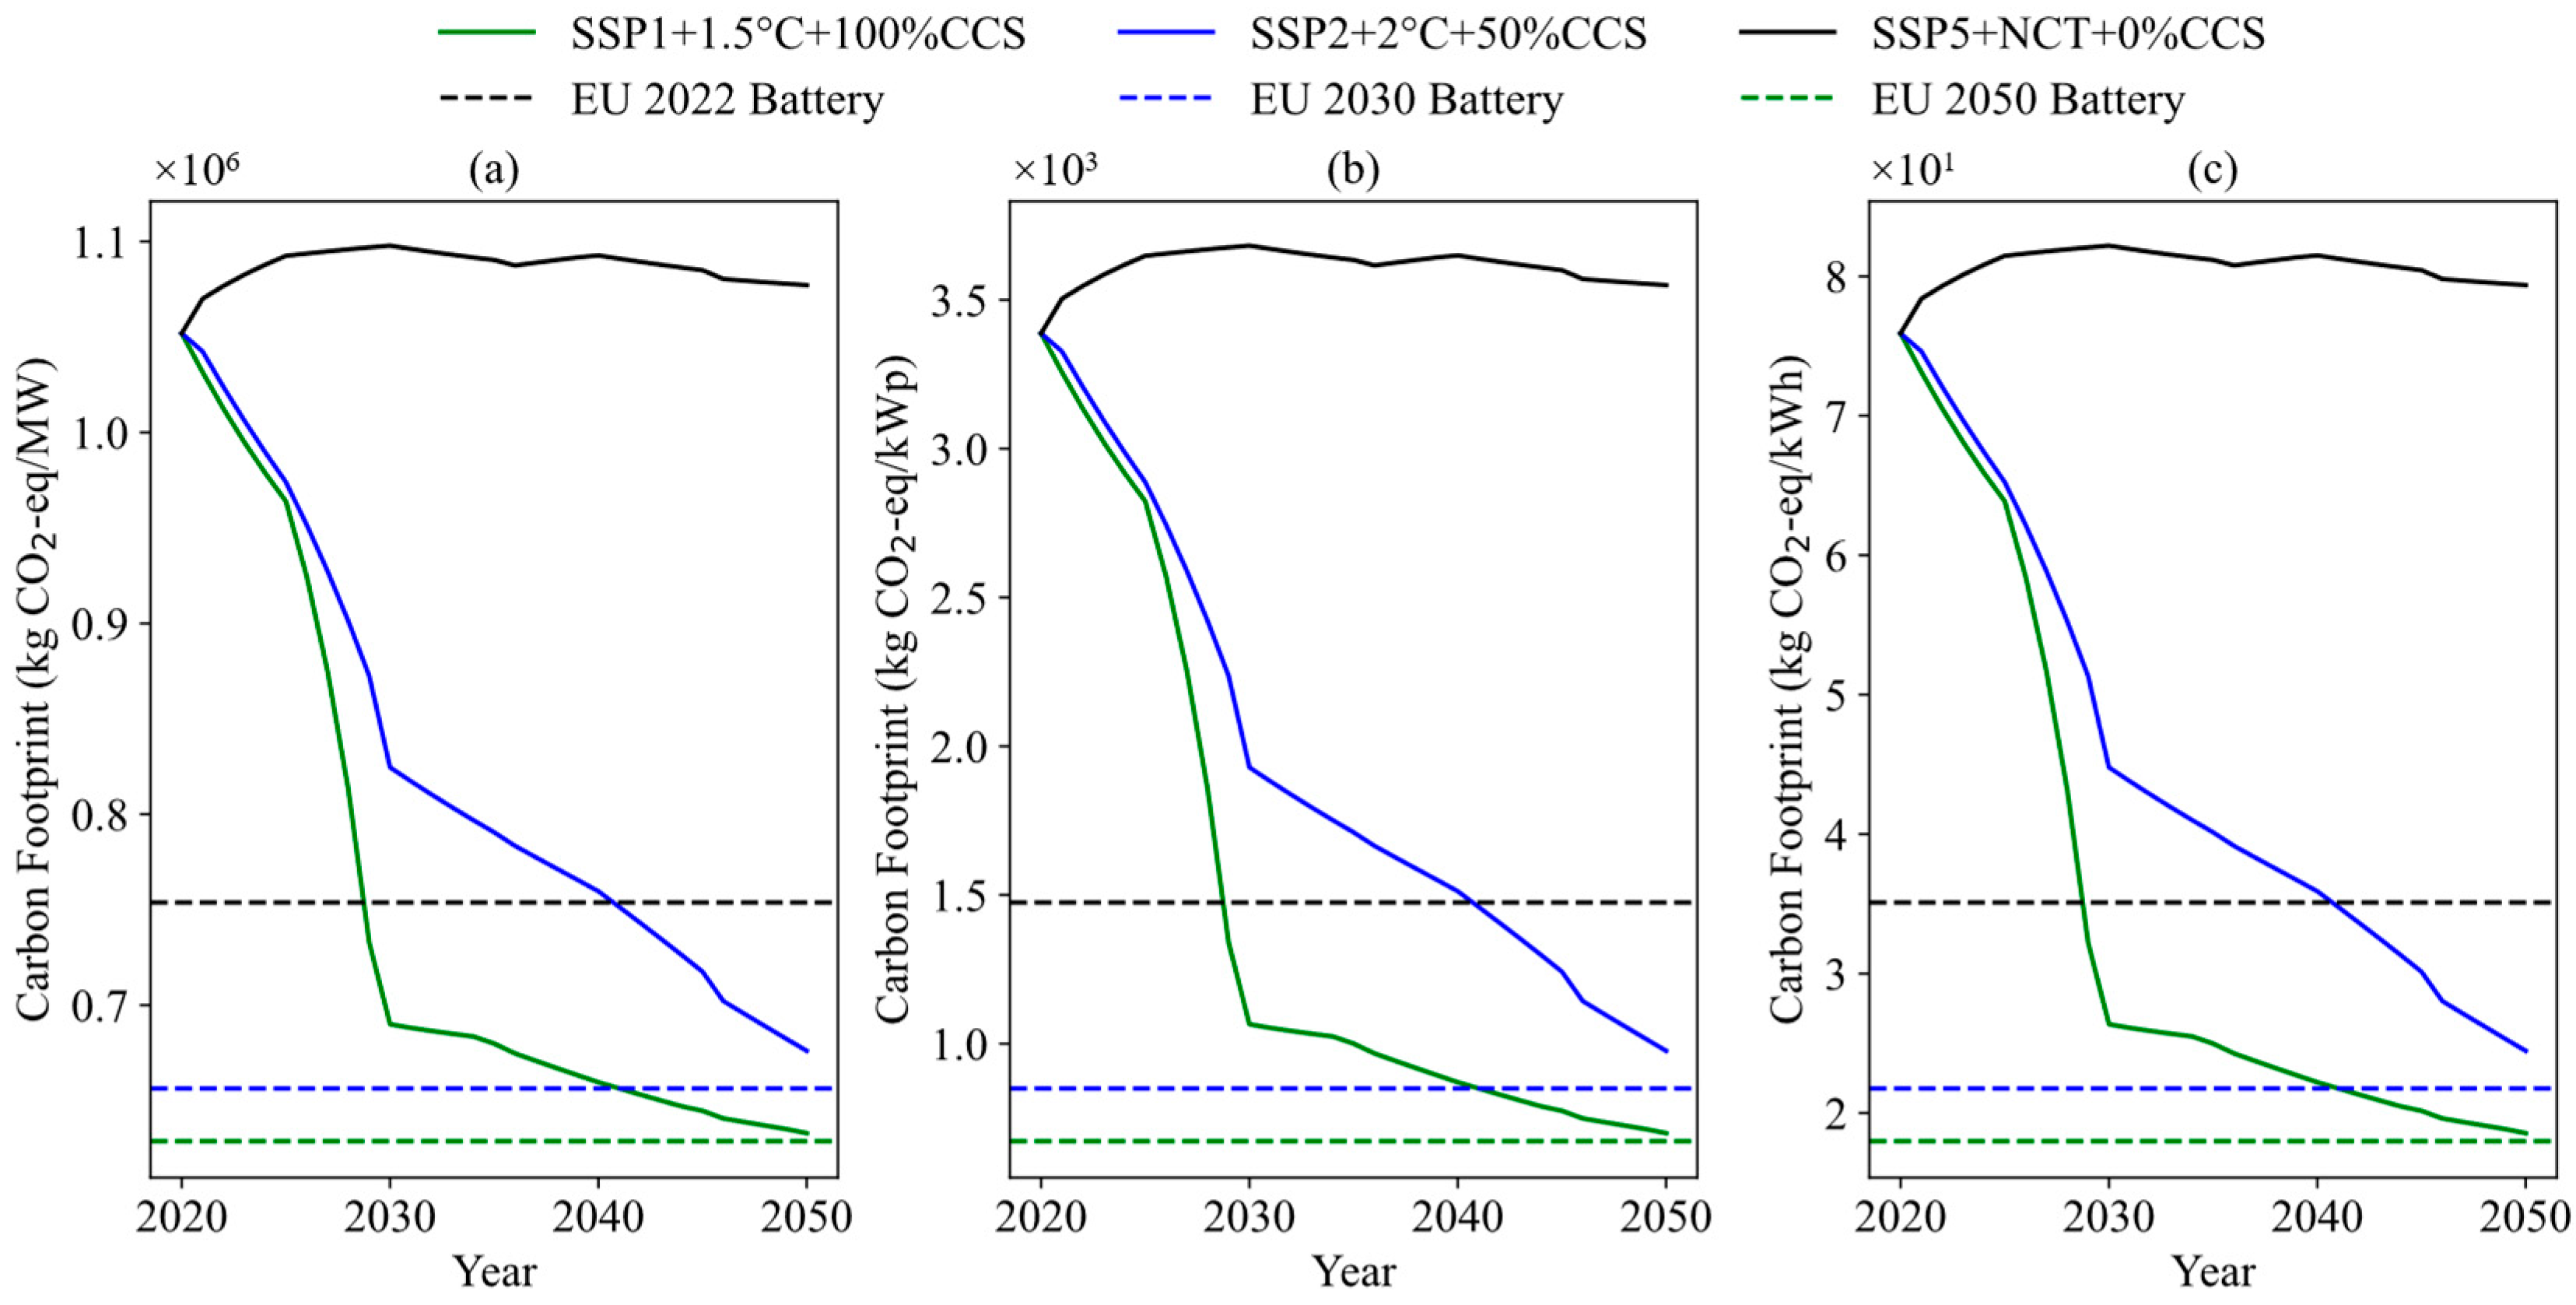
3.2. The Impact of the Chinese Electricity Decarbonization Pathway on the Product Carbon Footprint

The modeled projections in Figure 3 delineate the anticipated progression of carbon footprints for wind turbines, photovoltaic (PV) panels, and lithium batteries within China. Notably, the SSP1 scenario projects a substantial decline in carbon footprints for all three energy technologies by the year 2050, highlighting the transformative potential of an aggressive energy transition coupled with comprehensive CCS in thermal power. In contrast, the SSP5 scenario projects an escalation in carbon footprints compared with those in 2020, starkly illustrating the dire consequences of neglecting to adopt assertive climate policies.
In contrasting our modeled carbon footprint for wind turbines, PV panels, and lithium batteries against the results derived from IEA reports, the projections for the 2022 baseline are consistently higher—by approximately 5–15% across different scenarios—suggesting a more conservative starting point for China’s current decarbonization efforts in our analysis. By 2030, under scenarios PDS1 and PDS2, product carbon footprints can achieve more significant reductions: PDS1 surpasses IEA-based results by 20.0% for wind, 51.0% for solar, and 47.3% for batteries, while PDS2 shows improvements of 4.4%, 11.2%, and 10.4%, respectively, in each category. Continuing to 2050, the PDS1 scenario maintains a lower carbon footprint than the IEA’s figures by 4.3% for wind turbines, 55.1% for solar panels, and 62.9% for batteries, but PDS2’s slower decarbonization pace suggests potentially higher footprints, underscoring the imperative of ambitious policy action for long-term sustainability.
By 2029, under the ambitious PDS1 scenario, China’s product carbon footprint for wind turbines, photovoltaic (PV) panels, and batteries is expected to surpass the EU’s 2022 levels, indicating swift progress in renewable energy technology production. This progress demonstrates China’s potential leadership in global carbon reduction initiatives. For the PDS2 scenario, it will not be until 2041 that such renewable energy equipment could match the decarbonization levels of the EU’s 2022 benchmark. Looking at the EU’s decarbonization progress in 2030, the PDS1 scenario predicts that China’s production could align with the same level by 2041. However, under the PDS2 scenario, even by 2050, the carbon footprint for wind turbines, PV panels, and batteries is projected to be higher than the EU’s 2030 levels by 3.0%, 14.9%, and 12.3%, respectively. In comparison to the EU’s 2050 carbon footprint, the PDS1 scenario positions China’s renewable energy equipment production at just marginally higher levels—0.7% for wind turbines, 4.0% for PV panels, and 3.2% for batteries. These findings highlight the challenges of a moderate decarbonization pace, especially against the backdrop of increasingly urgent global carbon reduction targets. Such moderate progress may not keep pace with the international community’s reduction trajectory and could be constrained by green trade barriers established by developed regions such as the EU.
In summary, this section highlights the profound impact of different decarbonization scenarios on the carbon footprint of renewable infrastructure products manufactured in China. It posits that achieving parity with the carbon footprint standards of developed nations is contingent upon China’s commitment to its most sustainable and low-carbon strategies. It is important to note that our analysis has yet to account for the carbon footprint incurred by international trade transportation, which holds a significant share of global GHG emissions [38]. In advancing our assessment, it will be crucial to incorporate variables such as the production locations within China, the final destinations of products, and the modes of transportation used to gain a comprehensive view of the overall carbon footprint and inform more effective decarbonization policies.

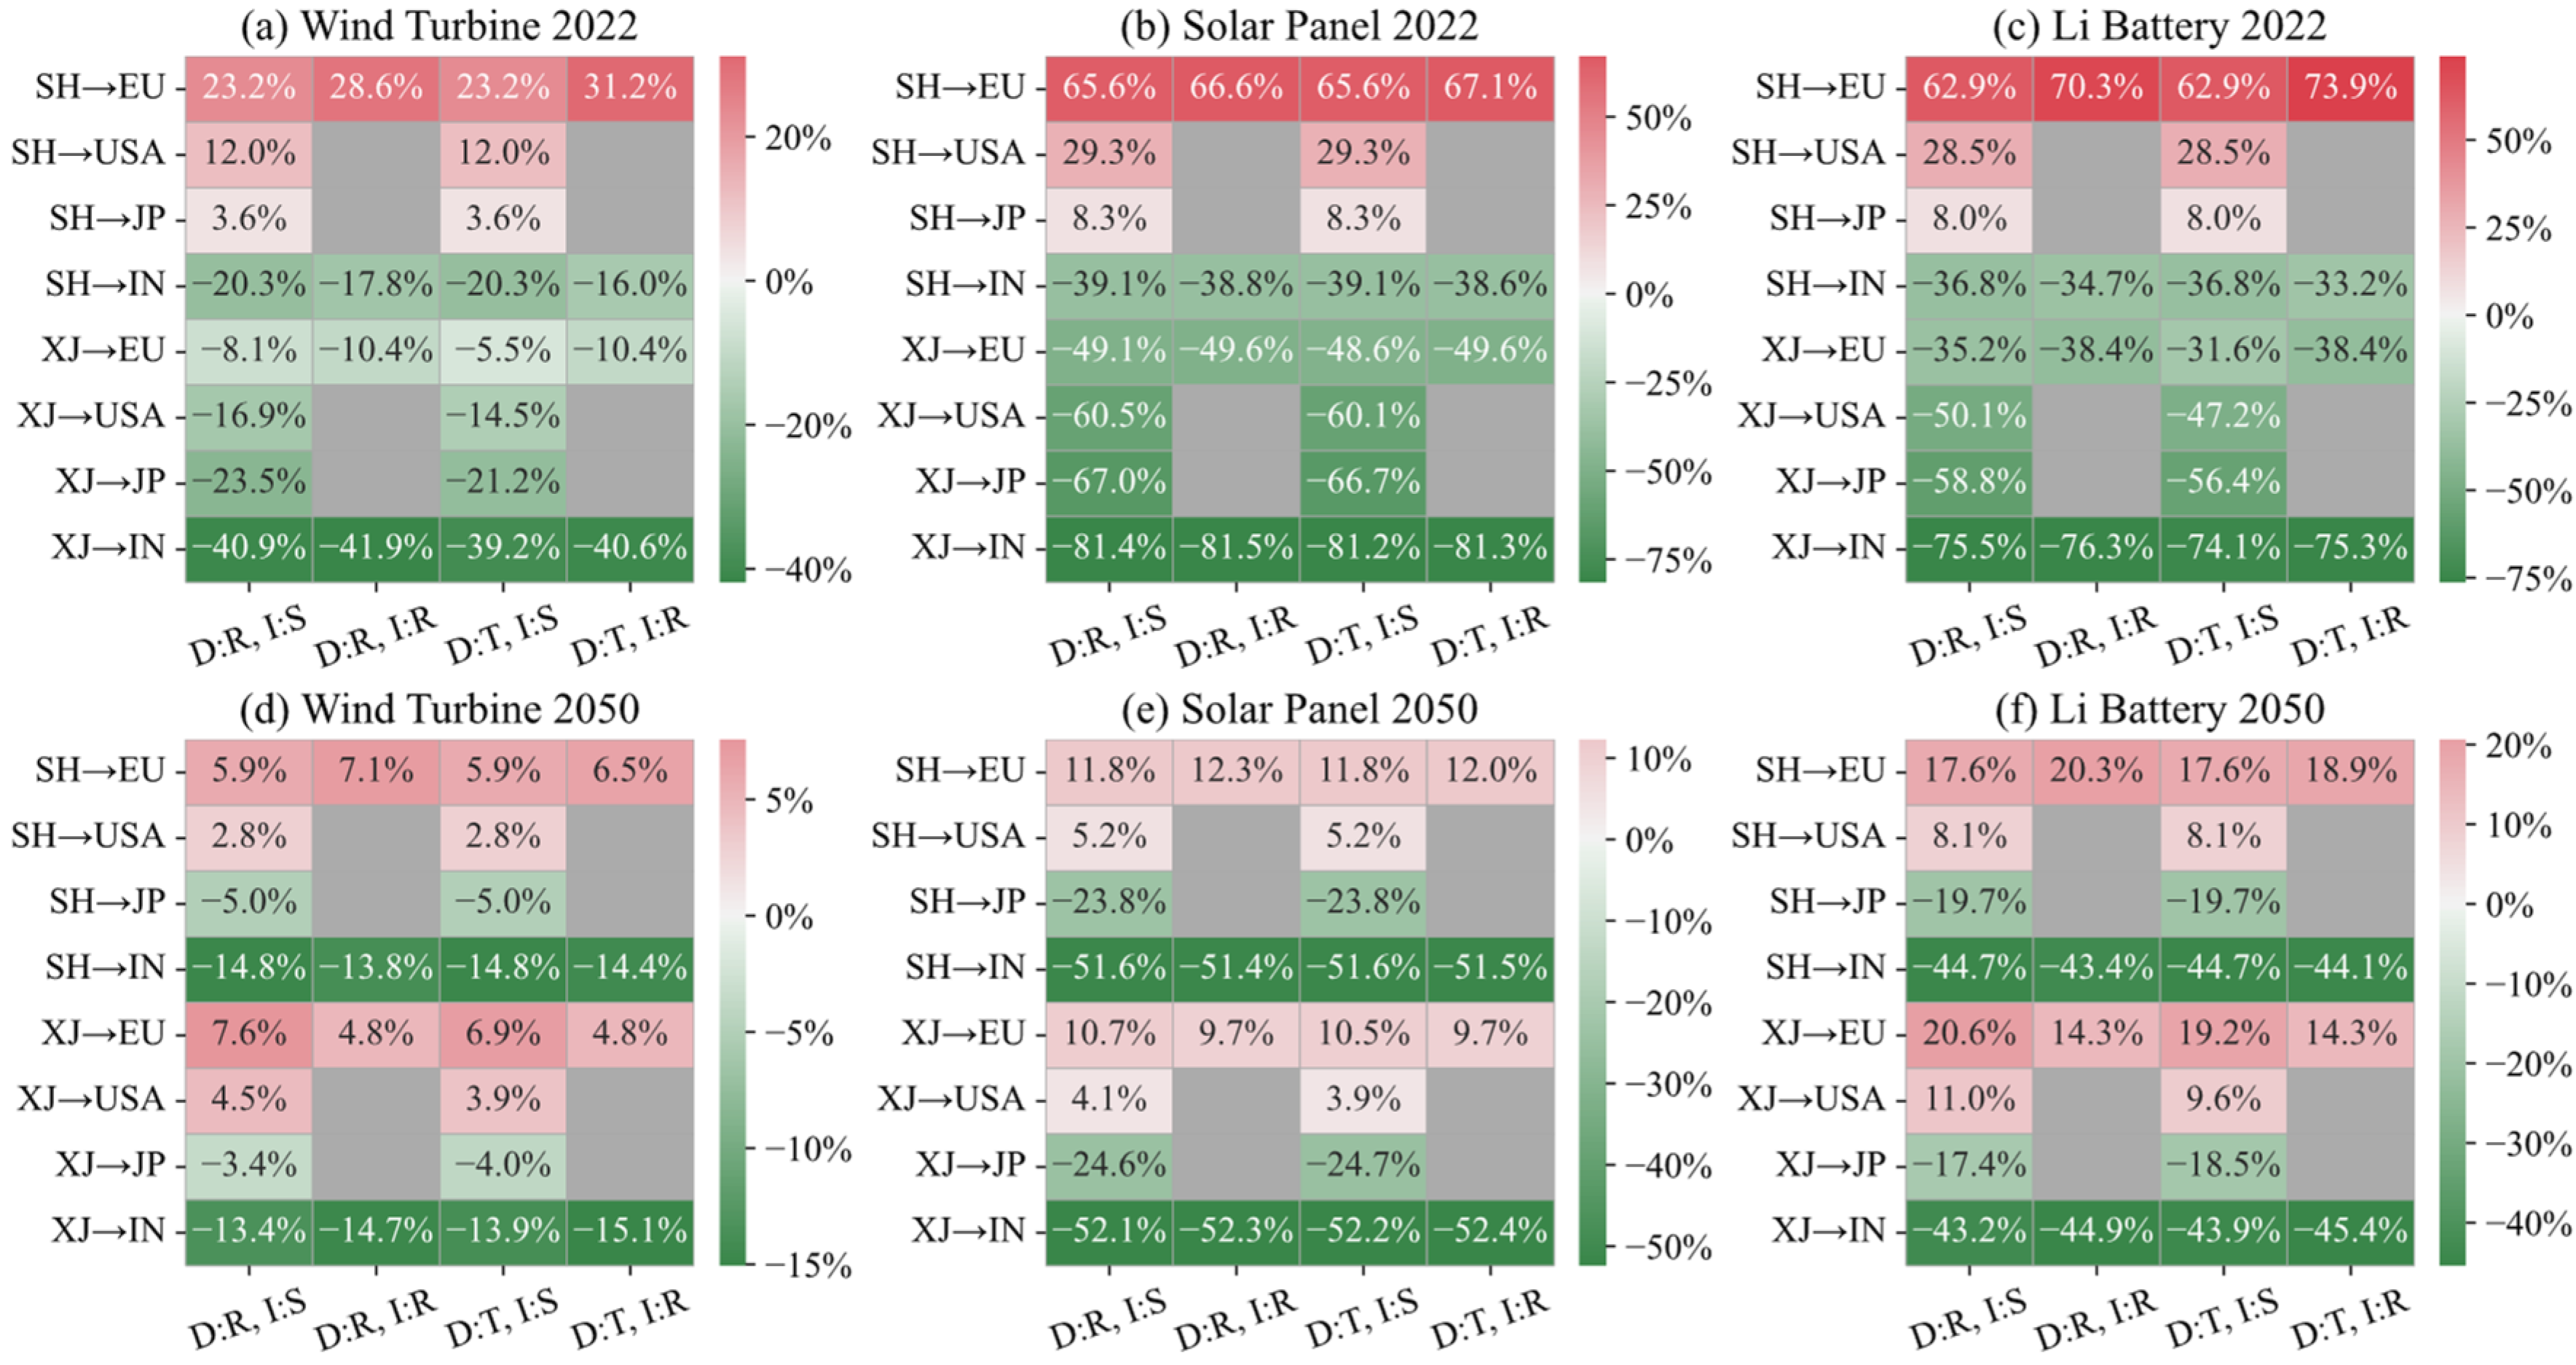
3.3. Carbon Footprint Analysis of the International Trade Transportation for Renewable Infrastructure

Figure 4’s heatmap visually quantifies whether the carbon footprint of products manufactured in China, which considers the heterogeneity of Shanghai’s grid mix and Xinjiang’s use of solar electricity, is higher or lower when including domestic and international transportation, as opposed to products produced locally in the EU, the USA, Japan, and India. For coastal regions like Shanghai, using the grid to produce renewable energy equipment could lead to an increase in carbon footprint by approximately 1–9% for wind turbines, 0.1–1% for solar panels, and 1–8% for batteries as of 2022. For Xinjiang, known for its ample solar radiation suitable for photovoltaic production, the transportation component could add approximately 5–12% to the carbon footprint for wind turbines, 2–3% for solar panels, and 10–25% for batteries. By 2050, while transportation processes will have also undergone decarbonization, their rate of carbon footprint reduction may not align uniformly with that of product carbon footprints. For production in Shanghai, significant decarbonization of the product carbon footprint is anticipated, which could result in a relative increase in the impact of transportation on the overall carbon footprint. In contrast, production in Xinjiang is expected to continue utilizing solar electricity, meaning that the decarbonization of transportation could lead to a decreased contribution to the overall carbon footprint of products. This divergence highlights the importance of regional energy strategies and the integration of renewable energy sources in manufacturing processes to optimize the carbon footprint of transported goods.
For products manufactured in Shanghai, the carbon footprint is significantly high as of 2022 in comparison with local manufacturing in developed countries, implying that additional transportation—domestic and international—will further augment these footprints. For example, Li batteries produced in Shanghai exhibit more than a 58% higher carbon footprint than those produced in the EU, and the highest carbon transport combinations can add up to an extra 16% of emissions. Despite transportation emissions, China maintains a substantial carbon footprint advantage relative to India, with the potential to achieve reductions of up to 10.4% for wind power, 49.6% for solar panels, and 36.8% for batteries when utilizing solar electricity production in Xinjiang and considering transport to the EU. By 2050, even with the decarbonization of transportation, the additional emissions from the transit process are not expected to be as significant compared to the product carbon footprint changes. The transportation of batteries remains a notable contributor to the carbon footprint, yet due to Xinjiang’s consistent solar power production, the carbon footprint for products shipped to the EU and USA remains higher than local production. However, for Japan and India, regardless of the production location, Chinese renewable energy equipment boasts a lower carbon footprint.
Different transport modes yield various impacts; for products manufactured in Shanghai, shipping to the EU presents a lower carbon footprint, while rail transport to India is more carbon-efficient if viable. Commonly, rail transportation is more energy-efficient and emits fewer emissions compared to road transportation, particularly for diesel trucks [39]. Meanwhile, the electrification of trucks can potentially bring considerable GHG emissions with the decarbonization of the power grid [40]. And the rail–sea combination has lower carbon intensity, but its capacity is minor, and the transfer center may bring additional GHG emissions [41]. In Xinjiang’s case, using the transcontinental China–Europe Railway or potential routes through Nepal to India could be more carbon-efficient. However, these routes carry political risks due to traversing multiple countries and regions. There are also concerns about the environmental and social impacts of such projects on the Himalayan landscape, which is undergoing paradigm shifts in governance with potentially far-reaching effects on regional forest resources [42]. Specifically, the Belt and Road Initiative, while offering opportunities for trade and infrastructure development, brings with it both opportunities and risks for the region, including significant cultural disruptions in Central Asia’s mountain regions [42].
This analysis illuminates how transportation modes and production locations significantly affect the carbon footprint of China’s exported renewable infrastructure. Products from Shanghai, reliant on the grid mix, show a considerable transportation-induced increase in carbon footprint, suggesting that future decarbonization policies must prioritize the enhancement of regional renewable energy utilization, such as Xinjiang’s solar capacity. By 2050, despite overall decarbonization, the transportation sector’s slower reduction rate, compared to production emissions, underscores the need for innovative transportation solutions, including increased rail and sea freight efficiency and the electrification of road transport. Moreover, the geopolitical complexities associated with transcontinental routes emphasize the urgency of developing resilient and low-carbon trade corridors. These findings call for a nuanced approach to decarbonization, one that accounts for regional disparities and integrates the latest data on energy and transportation emissions to inform policy and sustainable trade practices.
In the short term, China can leverage its abundant renewable energy resources in western regions to produce low-carbon products for export. However, by 2050, considering the impact of transportation, these products may not hold a carbon footprint advantage over those produced in the EU and USA. This analysis not only identifies the lowest-carbon transportation options for different production and destination pairings but also underscores the importance of synchronizing decarbonization efforts between production processes and transportation systems. The transition towards sustainable trade practices necessitates a harmonized reduction in emissions across the entire supply chain, from manufacturing to the final delivery of goods. This integrative approach is crucial for maintaining a competitive edge in a future where green trade standards are expected to intensify.

3.4. Limitations of This Study

This study acknowledges certain limitations inherent to its methodology and scope. Primarily, the reliance on Ecoinvent data, while standard in environmental impact assessments, may not fully capture the current efficiency gains in energy and material use within China’s renewable energy components industry due to advancements in large-scale production processes. Consequently, this could lead to an underestimation of the level of progress China has made in manufacturing renewable energy equipment [43]. Furthermore, our analysis does not account for the progressive enhancements in China’s thermal power generation efficiency [44], potentially skewing the estimated carbon footprint of the power sector. The Ecoinvent data employed predominantly reflect the state of China’s power generation situation in 2013, which may not accurately represent recent improvements.
Additionally, the energy structure scenario models utilized in this research are derived from various sources, including IEA reports, and carry inherent uncertainties. There is a need for a more in-depth and objective analysis of the future changes in China’s and other countries’ electricity energy structures [45,46]. Moreover, future technological advancements, such as developments in biomass power generation, the impact of increasing energy storage demands on the grid’s carbon footprint, and innovations in the manufacturing processes of PV, wind, and battery equipment, could significantly influence product carbon footprints [47]. The potential for enhanced flexibility in PV systems and increased efficiency in power consumption and distribution due to advancements in energy storage, particularly a reduction in lithium-ion battery costs, should not be overlooked in future assessments [48,49].

4. Prospect

The IEA’s energy development scenarios in Section 3.1 serve as a valuable benchmark for projecting the future carbon footprint of general products manufactured in China. Although China’s carbon footprint remains higher than that of the EU and the USA, the projections indicate that China is rapidly approaching a similar decarbonization trajectory by 2050. The decarbonization scenario frameworks outlined in Section 3.2 of this study highlight the annual changes in product carbon footprints under diverse conditions. This quantitative scenario analysis will facilitate businesses to develop more efficient emission reduction strategies, including electrification, the supply of green hydrogen, and waste recycling, in concert with decarbonizing the national power grid. For instance, as detailed in Section 3.3, road transportation can achieve lower carbon emissions through a synergy between deploying electric trucks and grid decarbonization. In the context of comprehensive transportation decarbonization, it is crucial to consider the life cycle processes of metals and plastics and their end-of-life management for conveyances.
In discussions surrounding green trade barriers imposed by developed nations, the substantial GHG emissions embodied in international trade must be acknowledged [50]. Setting import restrictions based on product carbon footprints could theoretically mitigate carbon leakage [51], but it is essential to balance these measures with empowering developing countries like China to effectively contribute to global climate goals. These nations have the capacity to manufacture low-carbon products using renewable resources such as solar power, notably in regions like Xinjiang. However, a sole focus on green trade barriers without a cooperative decarbonization strategy could curtail global emission reduction potential [52]. An interregional management system for green, low-carbon products could more effectively promote supply chain decarbonization in energy-intensive industries.
Furthermore, the greater the installations of renewable energy in China for manufacturing processes, the lower the embedded environmental footprints in exported goods such as renewable energy modules [53]. Therefore, in the face of potential short-term green trade barriers, China could adopt a proactive approach towards a sustainable and low-carbon transition by domestically expanding its renewable energy infrastructure. Subsequently, with a decarbonized energy sector, China is projected to become competitive with the low-carbon standards of developed countries by 2030. Consequently, China should maintain confidence in the face of potential product carbon footprint-based trade barriers by persistently pursuing sustainable transformations and actively engaging in international collaborative emission reduction efforts.
Section 3.2 highlights the significant carbon footprint of international trade transportation for products, emphasizing the need for decarbonization in both domestic and international transport, particularly for export-driven economies like China. Expanding electric rail lines for freight presents a key decarbonization route [54], while adopting alternative energy vehicles marks a crucial long-term strategy in the transport sector [55]. Internationally, transitioning the shipping industry towards alternative fuels and systems is vital, especially for inland shipping benefiting from localized infrastructure [56]. Policies promoting less carbon-intensive transportation and supporting zero-emission vehicle infrastructure are essential for decarbonizing major transport modes [57]. Implementing innovative technologies in the traditionally conservative rail industry is increasingly seen as critical for sustainability. These strategies indicate that China can significantly reduce its product carbon footprint through comprehensive decarbonization efforts. Nonetheless, cross-border transport decarbonization remains crucial to addressing international concerns. A collaborative approach to emission reduction is preferable over unilateral green trade barriers, advocating for a trans-regional green, low-carbon product management system to enhance supply chain decarbonization in energy-intensive industries.

5. Conclusions

This study delves into the carbon footprint of China’s renewable infrastructure manufacturing, highlighting significant strides and challenges in aligning with global decarbonization efforts. Aggressive domestic energy transition strategies, especially in the electricity sector, could markedly diminish the carbon footprint of wind turbines, PV panels, and lithium batteries. By 2050, adopting the most ambitious decarbonization scenario (PDS1) positions China’s renewable product carbon footprint nearly on par with developed countries, emphasizing China’s potential leadership role in global climate action.
International trade transportation emerges as a considerable carbon footprint contributor, necessitating focused decarbonization initiatives. Domestic shifts towards electric rail lines and international movements towards sustainable shipping and rail solutions can significantly mitigate transportation-related emissions. However, geopolitical considerations and the inherent carbon intensity of different transportation modes underscore the complexity of achieving a fully decarbonized supply chain for exported renewable infrastructure.
The implementation of green trade barriers by developed nations, while aimed at mitigating carbon leakage, may inadvertently stifle global emission reduction potential if not paired with collaborative decarbonization strategies. China’s commitment to a low-carbon transition, complemented by proactive international cooperation, could ensure its renewable infrastructure remains competitive under increasingly stringent global trade and environmental standards.
Moreover, the study acknowledges limitations stemming from reliance on potentially outdated datasets and the exclusion of emerging technologies and energy efficiency improvements. Future research should incorporate more high-resolution data and explore the integration of novel manufacturing and energy generation technologies to provide a more accurate depiction of the renewable infrastructure’s carbon footprint.
In conclusion, achieving a sustainable balance between economic growth and environmental preservation requires a multifaceted approach, encompassing aggressive local decarbonization policies, innovations in transportation technologies, and international collaboration on green trade practices. China’s transition towards a sustainable, low-carbon future presents a valuable model for other developing countries navigating the complexities of economic development and climate change mitigation.

Supplementary Materials

The following supporting information can be downloaded at https://www.mdpi.com/article/10.3390/su16083387/s1, S1. Data Source; S2. Scenario Analysis; S3. Electricity decarbonization scenarios; S4. Transport decarbonization scenarios. References [27,28,29,30,31,39,58,59,60,61,62,63,64,65,66,67,68,69] are cited in Supplementary Materials.

Author Contributions

J.T.: methodology, software, investigation, data curation, writing—original draft. X.X.: data curation, writing—original draft. M.H.: software, validation, writing—review and editing. R.S.: conceptualization, writing—review and editing. D.G.: investigation, writing—review and editing. T.H.: methodology, software, validation. G.L.: funding acquisition, project administration. P.R.: validation, funding acquisition. N.Z.: software, supervision. J.L.: conceptualization, supervision, writing—review and editing, project administration. All authors have read and agreed to the published version of the manuscript.

Funding

This work was supported by the Capacity Building Project of Local Colleges and Universities in Shanghai (No. 21010501400) from the Science and Technology Commission of Shanghai Municipality.

Data Availability Statement

All data have been presented in the main text or in the Supporting Information.

Conflicts of Interest

The authors declare no conflicts of interest.

References

  1. United Nations. Transforming Our World: The 2030 Agenda for Sustainable Development; United Nations: New York, NY, USA, 2015. [Google Scholar]
  2. IPCC. Global Warming of 1.5 °C; An Ipcc Special Report; IPCC: Geneva, Switzerland, 2018. [Google Scholar]
  3. Huang, M.-T.; Zhai, P.-M. Achieving Paris Agreement Temperature Goals Requires Carbon Neutrality by Middle Century with Far-Reaching Transitions in the Whole Society. Adv. Clim. Change Res. 2021, 12, 281–286. [Google Scholar] [CrossRef]
  4. Guo, H.-D.; Zhang, L.; Zhu, L.-W. Earth Observation Big Data for Climate Change Research. Adv. Clim. Chane. Res. 2015, 6, 108–117. [Google Scholar] [CrossRef]
  5. Ma, X.; Wang, C.; Dong, B.; Gu, G.; Chen, R.; Li, Y.; Zou, H.; Zhang, W.; Li, Q. Carbon Emissions from Energy Consumption in China: Its Measurement and Driving Factors. Sci. Total Environ. 2019, 648, 1411–1420. [Google Scholar] [CrossRef] [PubMed]
  6. Bataille, C.; Waisman, H.; Colombier, M.; Segafredo, L.; Williams, J.; Jotzo, F. The Need for National Deep Decarbonization Pathways for Effective Climate Policy. Clim. Policy 2016, 16, S7–S26. [Google Scholar] [CrossRef]
  7. Kut, P.; Pietrucha-Urbanik, K. Bibliometric Analysis of Renewable Energy Research on the Example of the Two European Countries: Insights, Challenges, and Future Prospects. Energies 2023, 17, 176. [Google Scholar] [CrossRef]
  8. Pietrucha-Urbanik, K.; Rak, J. Water, Resources, and Resilience: Insights from Diverse Environmental Studies. Water 2023, 15, 3965. [Google Scholar] [CrossRef]
  9. Zhang, S.; Ueno, K.; Dokko, K.; Watanabe, M. Recent Advances in Electrolytes for Lithium–Sulfur Batteries. Adv. Energy Mater. 2015, 5, 1500117. [Google Scholar] [CrossRef]
  10. Papadopoulos, V.; Knockaert, J.; Develder, C.; Desmet, J. Investigating the Need for Real Time Measurements in Industrial Wind Power Systems Combined with Battery Storage. Appl. Energy 2019, 247, 559–571. [Google Scholar] [CrossRef]
  11. Arent, D.J.; Green, P.; Abdullah, Z.; Barnes, T.; Bauer, S.; Bernstein, A.; Berry, D.; Berry, J.; Burrell, T.; Carpenter, B. Challenges and Opportunities in Decarbonizing the US Energy System. Renew. Sustain. Energy Rev. 2022, 169, 112939. [Google Scholar] [CrossRef]
  12. Xu, H.; Chen, B.; Tan, P.; Sun, Q.; Maroto-Valer, M.M.; Ni, M. Modelling of a Hybrid System for On-Site Power Generation from Solar Fuels. Appl. Energy 2019, 240, 709–718. [Google Scholar] [CrossRef]
  13. Rabaia, M.K.H.; Abdelkareem, M.A.; Sayed, E.T.; Elsaid, K.; Chae, K.-J.; Wilberforce, T.; Olabi, A. Environmental Impacts of Solar Energy Systems: A review. Sci. Total Environ. 2021, 754, 141989. [Google Scholar] [CrossRef] [PubMed]
  14. Ren, D. The Impact of EU Carbon Border Adjustment Mechanism on the Development of New Energy in China and Suggestions for Response. China Energy 2022, 4, 21–28. [Google Scholar]
  15. Melin, H.E.; Rajaeifar, M.A.; Ku, A.Y.; Kendall, A.; Harper, G.; Heidrich, O. Global Implications of the EU Battery Regulation. Science 2021, 373, 384–387. [Google Scholar] [CrossRef] [PubMed]
  16. Li, X.; Chalvatzis, K.J.; Pappas, D. Life Cycle Greenhouse Gas Emissions from Power Generation in China’s Provinces in 2020. Appl. Energy 2018, 223, 93–102. [Google Scholar] [CrossRef]
  17. Pehnt, M. Dynamic Life Cycle Assessment (Lca) of Renewable Energy Technologies. Renew. Energy 2006, 31, 55–71. [Google Scholar] [CrossRef]
  18. Emmott, C.J.M.; Ekins-Daukes, N.J.; Nelson, J. Dynamic Carbon Mitigation Analysis: The Role of Thin-Film Photovoltaics. Energy Environ. Sci. 2014, 7, 1810–1818. [Google Scholar] [CrossRef]
  19. Llamas-Orozco, J.A.; Meng, F.; Walker, G.S.; Abdul-Manan, A.F.; MacLean, H.L.; Posen, I.D.; McKechnie, J. Estimating the Environmental Impacts of Global Lithium-Ion Battery Supply Chain: A Temporal, Geographical, and Technological Perspective. PNAS Nexus 2023, 2, pgad361. [Google Scholar] [CrossRef]
  20. Wernet, G.; Bauer, C.; Steubing, B.; Reinhard, J.; Moreno-Ruiz, E.; Weidema, B. The Ecoinvent Database Version 3 (Part I): Overview and Methodology. Int. J. Life Cycle Assess. 2016, 21, 1218–1230. [Google Scholar] [CrossRef]
  21. Sacchi, R.; Terlouw, T.; Siala, K.; Dirnaichner, A.; Bauer, C.; Cox, B.; Mutel, C.; Daioglou, V.; Luderer, G. Rospective EnvironMental Impact asSEment (premise): A streamlined Approach to Producing Databases for Prospective Life Cycle Assessment Using Integrated Assessment Models. Renew. Sustain. Energy Rev. 2022, 160, 112311. [Google Scholar] [CrossRef]
  22. ISO 14040; Environmental Management—Life Cycle Assessment—Principles and Framework. ISO: Geneva, Switzerland, 2006.
  23. ISO 14044; Environmental Management-Life Cycle Assessment-Requirements and Guidelines. Standardization, International Organization: Geneva, Switzerland, 2006.
  24. Xue, N.; Lu, J.; Gu, D.; Lou, Y.; Yuan, Y.; Li, G.; Kumagai, S.; Saito, Y.; Yoshioka, T.; Zhang, N. Carbon Footprint Analysis and Carbon Neutrality Potential of Desalination by Electrodialysis for Different Applications. Water Res. 2023, 232, 119716. [Google Scholar] [CrossRef] [PubMed]
  25. Chen, H.; Cong, T.N.; Yang, W.; Tan, C.; Li, Y.; Ding, Y. Progress in Electrical Energy Storage System: A Critical Review. Prog. Nat. Sci. 2009, 19, 291–312. [Google Scholar] [CrossRef]
  26. Lu, J.; Tang, J.; Shan, R.; Li, G.; Rao, P.; Zhang, N. Spatiotemporal Analysis of the Future Carbon Footprint of Solar Electricity in the United States by a Dynamic Life Cycle Assessment. iScience 2023, 26, 106188. [Google Scholar] [CrossRef] [PubMed]
  27. IEA. World Energy Outlook 2023: Executive Summary; IEA: Paris, France, 2023. [Google Scholar]
  28. van Vuuren, D.P.; Kriegler, E.; O’Neill, B.C.; Ebi, K.L.; Riahi, K.; Carter, T.R.; Edmonds, J.; Hallegatte, S.; Kram, T.; Mathur, R.; et al. A New Scenario Framework for Climate Change Research: Scenario Matrix Architecture. Clim. Change 2013, 122, 373–386. [Google Scholar] [CrossRef]
  29. Liu, Q.; Chen, Y.; Teng, F.; Tian, C.; Zheng, X.; Zhao, X. Pathway and Policy Analysis to China’s Deep Decarbonization. Chin. J. Popul. Resour. Environ. 2017, 15, 39–49. [Google Scholar] [CrossRef]
  30. Jiang, K.; He, C.; Dai, H.; Liu, J.; Xu, X. Emission Scenario Analysis for China under the Global 1.5 °C Target. Carbon Manag. 2018, 9, 481–491. [Google Scholar] [CrossRef]
  31. Li, H.; Cui, X.; Hui, J.; He, G.; Weng, Y.; Nie, Y.; Wang, C.; Cai, W. Catchment-Level Water Stress Risk of Coal Power Transition in China under 2 °C/1.5 °C Targets. Appl. Energy 2021, 294, 116986. [Google Scholar] [CrossRef]
  32. Que, Z.; Wang, S.; Li, W. Potential of Energy Saving and Emission Reduction of Battery Electric Vehicles with Two Type of Drivetrains in China. Energy Procedia 2015, 75, 2892–2897. [Google Scholar] [CrossRef]
  33. Wang, Q.-Z.; Chen, J.-M.; Tseng, M.-L.; Luan, H.-M.; Ali, M.H. Modelling Green Multimodal Transport Route Performance with Witness Simulation Software. J. Clean. Prod. 2020, 248, 119245. [Google Scholar] [CrossRef]
  34. Wang, X.; Wang, Y.; Liu, Y.; Liu, J.; Hu, X.; Hu, J.; Wan, Y.; Wang, X.; Ma, J.; Wang, X. Consumption-Driven Freight Turnover of Interprovincial Trade and Related Air Pollution Emissions in China from 2007 to 2012. Environ. Pollut. 2023, 318, 120914. [Google Scholar] [CrossRef] [PubMed]
  35. Song, X.; Du, S.; Deng, C.; Shen, P.; Xie, M.; Zhao, C.; Chen, C.; Liu, X. Carbon Emissions in China’s Steel Industry from a Life Cycle Perspective: Carbon Footprint Insights. J. Environ. Sci. 2025, 148, 650–664. [Google Scholar] [CrossRef]
  36. Marimuthu, C.; Kirubakaran, V. Carbon Pay Back Period for Solar and Wind Energy Project Installed in India: A Critical Review. Renew. Sustain. Energy Rev. 2013, 23, 80–90. [Google Scholar] [CrossRef]
  37. Wang, C.; Chen, B.; Yu, Y.; Wang, Y.; Zhang, W. Carbon Footprint Analysis of Lithium Ion Secondary Battery Industry: Two Case Studies from China. J. Clean. Prod. 2017, 163, 241–251. [Google Scholar] [CrossRef]
  38. Wang, Y.; Liu, J.; Guan, D.; Meng, J.; Liu, Z.; Xiang, S.; Yang, H.; Fu, X.; Hu, X.; Yang, Q. The Volume of Trade-Induced Cross-Border Freight Transportation Has Doubled and Led to 1.14 Gigatons CO2 Emissions in 2015. One Earth 2022, 5, 1165–1177. [Google Scholar] [CrossRef]
  39. Spielmann, M.; Scholz, R. Life Cycle Inventories of Transport Services: Background Data for Freight Transport (10 pp). Int. J. Life Cycle Assess. 2005, 10, 85–94. [Google Scholar] [CrossRef]
  40. Lu, J.; Shan, R.; Kittner, N.; Hu, W.; Zhang, N. Emission Reductions from Heavy-Duty Freight Electrification Aided by Smart Fleet Management. Transp. Res. Part D Transp. 2023, 121, 103846. [Google Scholar] [CrossRef]
  41. Guo, X.; He, J.; Lan, M.; Yu, H.; Yan, W. Modeling Carbon Emission Estimation for Hinterland-Based Container Intermodal Network. J. Clean. Prod. 2022, 378, 134593. [Google Scholar] [CrossRef]
  42. Verma, A.; Schmidt-Vogt, D.; De Alban, J.D.T.; Lim, C.L.; Webb, E.L. Drivers and mechanisms of forest change in the Himalayas. Glob. Environ. Change 2021, 68, 102244. [Google Scholar] [CrossRef]
  43. An, M.; Sun, X. Carbon Footprints of Solar Panels in China Provinces Based on Different Production and Waste Treatment Scenarios. J. Clean. Prod. 2024, 435, 140453. [Google Scholar] [CrossRef]
  44. Fan, J.-L.; Zhang, H.; Zhang, X. Unified Efficiency Measurement of Coal-Fired Power Plants in China Considering Group Heterogeneity and Technological Gaps. Energy Econ. 2020, 88, 104751. [Google Scholar] [CrossRef]
  45. Qiu, S.; Lei, T.; Wu, J.; Bi, S. Energy Demand and Supply Planning of China through 2060. Energy 2021, 234, 121193. [Google Scholar] [CrossRef]
  46. Sovacool, B.K.; Griffiths, S. The Cultural Barriers to a Low-Carbon Future: A Review of Six Mobility and Energy Transitions across 28 Countries. Renew. Sustain. Energy Rev. 2020, 119, 109569. [Google Scholar] [CrossRef]
  47. Zhao, N.; You, F. Can Renewable Generation, Energy Storage and Energy Efficient Technologies Enable Carbon Neutral Energy Transition? Appl. Energy 2020, 279, 115889. [Google Scholar] [CrossRef]
  48. Perera, A.; Hong, T. Vulnerability and Resilience of Urban Energy Ecosystems to Extreme Climate Events: A Systematic Review and Perspectives. Renew. Sustain. Energy Rev. 2023, 173, 113038. [Google Scholar] [CrossRef]
  49. Zubi, G.; Dufo-López, R.; Carvalho, M.; Pasaoglu, G. The Lithium-Ion Battery: State of the Art and Future Perspectives. Renew. Sustain. Energy Rev. 2018, 89, 292–308. [Google Scholar] [CrossRef]
  50. Xia, C.; Zheng, H.; Meng, J.; Li, S.; Du, P.; Shan, Y. The Evolution of Carbon Footprint in the Yangtze River Delta City Cluster during Economic Transition 2012–2015. Resour. Conserv. Recycl. 2022, 181, 106266. [Google Scholar] [CrossRef]
  51. Qi, T.; Winchester, N.; Karplus, V.J.; Zhang, X. Will Economic Restructuring in China Reduce Trade-Embodied CO2 Emissions? Energy Econ. 2014, 42, 204–212. [Google Scholar] [CrossRef]
  52. Sheng, Y.; Wang, Q. Influence of Carbon Tariffs on China’s Export Trade. Environ. Sci. Pollut. Res. 2022, 29, 24651–24659. [Google Scholar] [CrossRef] [PubMed]
  53. Liu, J.; Goldstein, D. Understanding China’s Renewable Energy Technology Exports. Energy Policy 2013, 52, 417–428. [Google Scholar] [CrossRef]
  54. Buira, D.; Tovilla, J.; Farbes, J.; Jones, R.; Haley, B.; Gastelum, D. A Whole-Economy Deep Decarbonization Pathway for Mexico. Energy Strategy Rev. 2021, 33, 100578. [Google Scholar] [CrossRef]
  55. Wang, L.; Zhao, Z.; Wang, X.; Xue, X. Transportation De-Carbonization Pathways and Effect in China: A Systematic Analysis Using Stirpat-Sd Model. J. Clean. Prod. 2021, 288, 125574. [Google Scholar] [CrossRef]
  56. Evers, V.; Kirkels, A.F.; Godjevac, M. Carbon Footprint of Hydrogen-Powered Inland Shipping: Impacts and Hotspots. Renew. Sustain. Energy Rev. 2023, 185, 113629. [Google Scholar] [CrossRef]
  57. Ahsan, N.; Hewage, K.; Razi, F.; Hussain, S.A.; Sadiq, R. A Critical Review of Sustainable Rail Technologies Based on Environmental, Economic, Social, and Technical Perspectives to Achieve Net Zero Emissions. Renew. Sustain. Energy Rev. 2023, 185, 113621. [Google Scholar] [CrossRef]
  58. Net Zero by 2050: A Roadmap for the Global Energy Sector. 2021. Available online: https://www.iea.org/reports/net-zero-by-2050 (accessed on 15 March 2024).
  59. Shafique, M.; Azam, A.; Rafiq, M.; Luo, X. Life Cycle Assessment of Electric Vehicles and Internal Combustion Engine Vehicles: A Case Study of Hong Kong. Res. Transp. Econ. 2022, 91, 101112. [Google Scholar] [CrossRef]
  60. Li, W.; Bai, H.; Yin, J.; Xu, H. Life Cycle Assessment of End-of-Life Vehicle Recycling Processes in China—Take Corolla Taxis for Example. J. Clean. Prod. 2016, 117, 176–187. [Google Scholar] [CrossRef]
  61. Jingsun 144 Half-Cell 182 mm 570 w Mono Solar Panel. Available online: https://www.jingsun-energy.com/Jingsun-144-Half-cell-182mm-570W-Mono-Solar-Panel-pd46370033.html (accessed on 15 March 2024).
  62. High Efficience Half Cut Mono Solar Panel 570 w. Available online: https://www.sunketsolar.com/standard-mono-solar-panel/59373483.html (accessed on 15 March 2024).
  63. Jinko Tiger Neo 570 w Half-Cut—Jkm570n-72hl4-V. Available online: https://suministrosdelsol.com/en/panels-from-505-to-700w/1015-jinko-tiger-neo-570w-half-cut-jkm570n-72hl4-v.html (accessed on 15 March 2024).
  64. Vestas V150 4.2 Megawatt (Mw) Wind Turbine Generator. Available online: https://www.enelgreenpower.com/content/dam/enel-egp/documenti/impianti/flat-rocks-wind-farme-stage-1-project/resources/Wind%20Turbine%20Factsheet%20for%20Flat%20Rocks%20Wind%20Farm%20Stage%201.pdf (accessed on 15 March 2024).
  65. 3.6 mw Series Wind Turbine. Available online: http://shanghaielectric-smec.com/1-3-3-wind-turbines/ (accessed on 15 March 2024).
  66. Hw82 1.5 Mw. Available online: https://www.thewindpower.net/turbine_en_969_hewind_hw82-1.5-mw.php (accessed on 15 March 2024).
  67. Lithium Ion Batteries: Energy Density? Available online: https://thundersaidenergy.com/downloads/lithium-ion-batteries-energy-density/ (accessed on 15 March 2024).
  68. Li-on Vs. Lead Acid. Available online: https://www.ultralifecorporation.com/PrivateDocuments/WP_li-ion-vs-lead-acid-WEB_1.pdf (accessed on 15 March 2024).
  69. EVBox. Electric Car Battery Weight Explained. Available online: https://blog.evbox.com/ev-battery-weight (accessed on 15 March 2024).
Figure 1. System boundary illustration for the LCA of renewable energy technologies. The diagram delineates the stages included within the cradle-to-gate analysis, which covers the extraction and acquisition of raw materials, the product’s manufacturing phase, and the transportation process to the point of delivery to consumers. Not represented in the diagram are the upstream and downstream supply chain activities such as raw material transport, the product use phase, and end-of-life management, which are outside the scope of this study due to supply chain uncertainties.
Sustainability 16 03387 g001
Figure 2. Projected product carbon footprint for renewable energy infrastructure based on IEA power sector projections of different countries in 2022, 2030, and 2050: (a) wind turbines, (b) photovoltaic (PV) panels, and (c) lithium batteries.
Sustainability 16 03387 g002
Figure 3. Annual decarbonization trajectories for renewable energy infrastructure under SSP1 + 1.5 °C + 100% CCS (PDS1), SSP2 + 2 °C + 50% CCS (PDS2), and SSP5 + NCT + 0% CCS (PDS3) scenarios in China from 2020 to 2050: (a) wind turbines, (b) photovoltaic (PV) panels, and (c) lithium batteries. Dashed lines are the comparisons with the EU’s levels for the years 2022, 2030, and 2050 based on the IEA scenarios.
Sustainability 16 03387 g003
Figure 4. Comparative carbon footprint of renewable infrastructure considering trade transportation in 2022 (ac) and 2050 (df). The heatmap displays the differences for the product carbon footprints from Shanghai (grid mix) and Xinjiang (solar electricity) to the EU, the USA, Japan, and India compared with local manufacturing. Four transportation scenarios are compared: domestic rail and international shipping (D:R, I:S), domestic rail and international rail (D:R, I:R), domestic truck and international shipping (D:T, I:S), and domestic truck and international rail (D:T, I:R). Rail transport to the USA and Japan is excluded due to infeasibility.
Sustainability 16 03387 g004
Table 1. Reference database for electricity generation by different products.
CategoryUnitPower ConsumptionUnitElectricity Carbon FootprintOther Carbon Footprint
Wind turbineskWh/MW475,459.48kgCO2-eq/MW249,252.61597,021.17
Photovoltaic panelskWh/kWp3051.04kgCO2-eq/kWp1758.86468.72
Lithium batterykWh/kg10.41kgCO2-eq/kg5.942.18
Table 2. Three different scenarios for power grid decarbonization.
AbbreviationCategoryDetailed Description
PDS1SSP1 + 1.5 °C+ 100% CCSLow-carbon scenario: this scenario is to follow the sustainable development path SSP1 under the 1.5 °C target and match 100% CCS for thermal power.
PDS2SSP2 + 2 °C+ 50% CCSMedium-carbon scenario: this scenario is an intermediate development pathway, SSP1, under the 2 °C target, and 50% CCS is matched for thermal power.
PDS3SSP5 + NCT + 0%CCSHigh-carbon scenario: This scenario uses a stagnant approach with no GHG mitigation measures.
Table 3. Scenario matrix of the transport process.
ProductionSaleMethod of Transportation
SHEUISDRs + IRsDTs + IRs
USIS
JapanIS
IndiaISDRs + IrsDTs + IRs
XJEUDRs + ISDTs + ISIRs
USDRs + ISDTs + IS
JapanDRs + ISDTs + IS
IndiaDRs + ISDTs + ISIRs
Note: SH, Shanghai, China; XJ, Xinjiang, China; EU, Europe Union; US, the United States; DRs, domestic railways; IS, international shipping; DTs, domestic trucks; IRs, international railways.
Disclaimer/Publisher’s Note: The statements, opinions and data contained in all publications are solely those of the individual author(s) and contributor(s) and not of MDPI and/or the editor(s). MDPI and/or the editor(s) disclaim responsibility for any injury to people or property resulting from any ideas, methods, instructions or products referred to in the content.

