
Assessing the Potential Climate Impacts and Benefits of Waste Prevention and Management: A Case Study of Sweden


Abstract
:1. Introduction
2. Materials and Methods
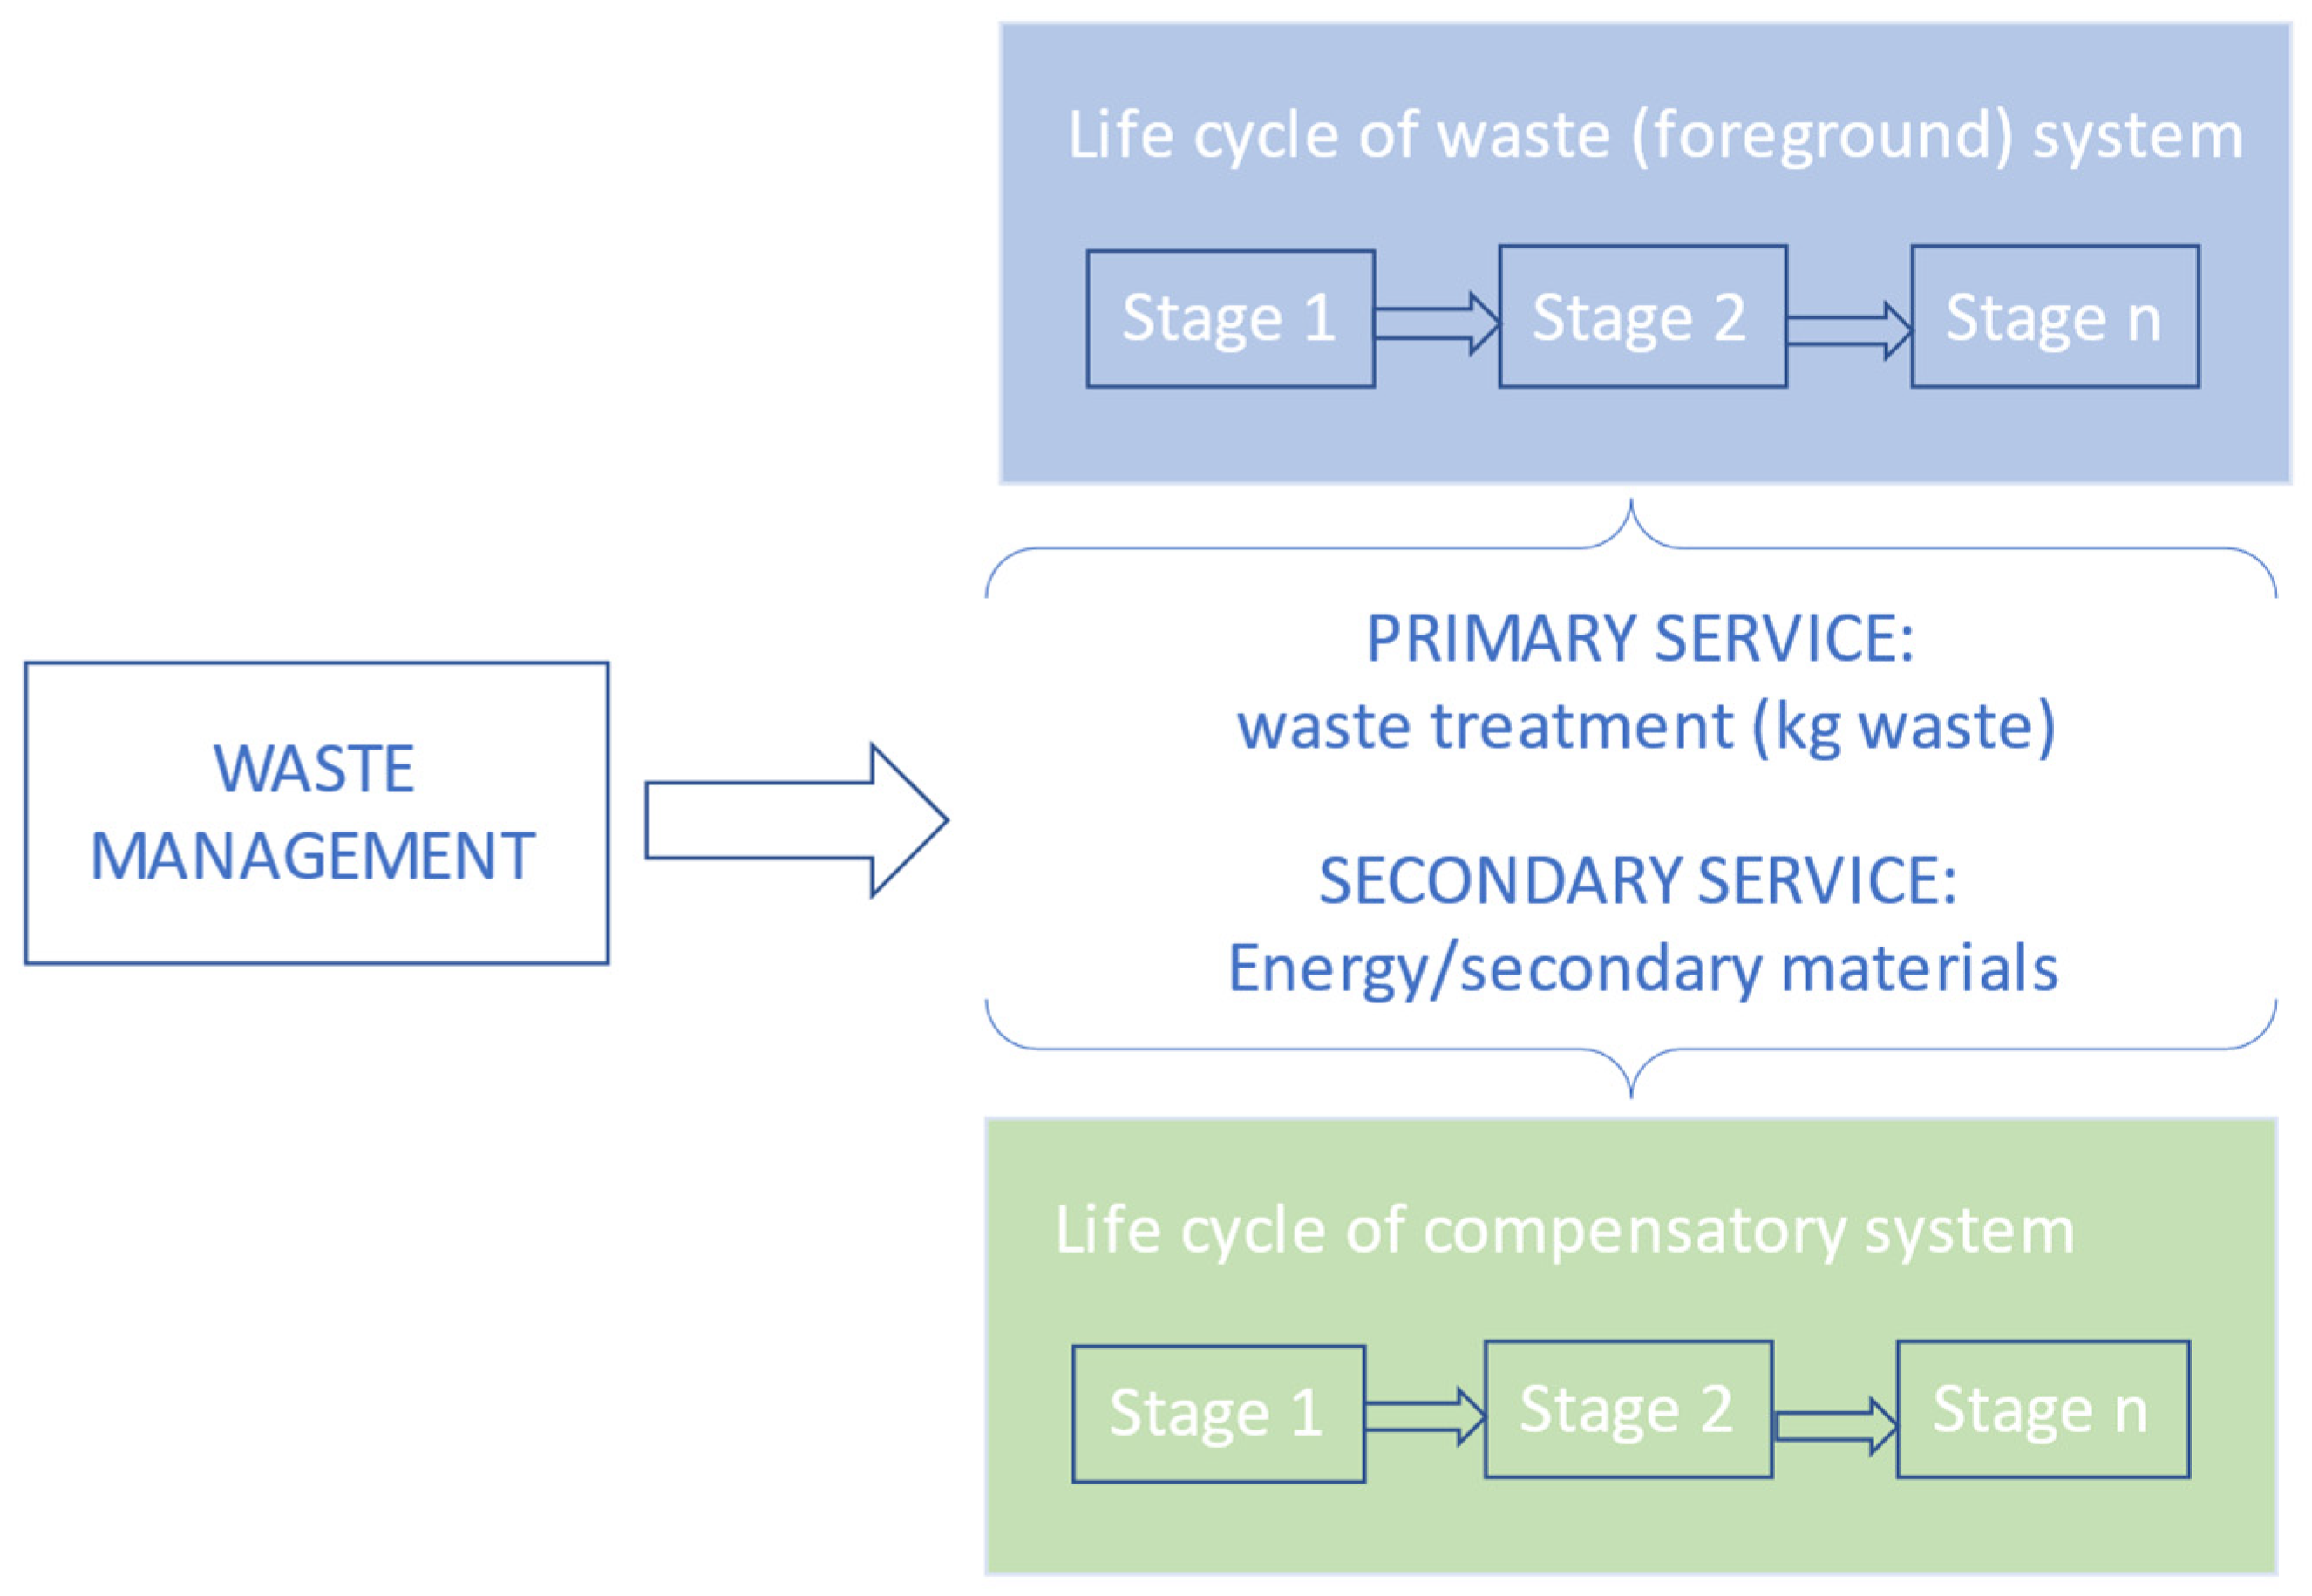
2.1. Scope and Approach
2.2. System Boundaries
2.3. Data Sources
2.4. Description of Case Study
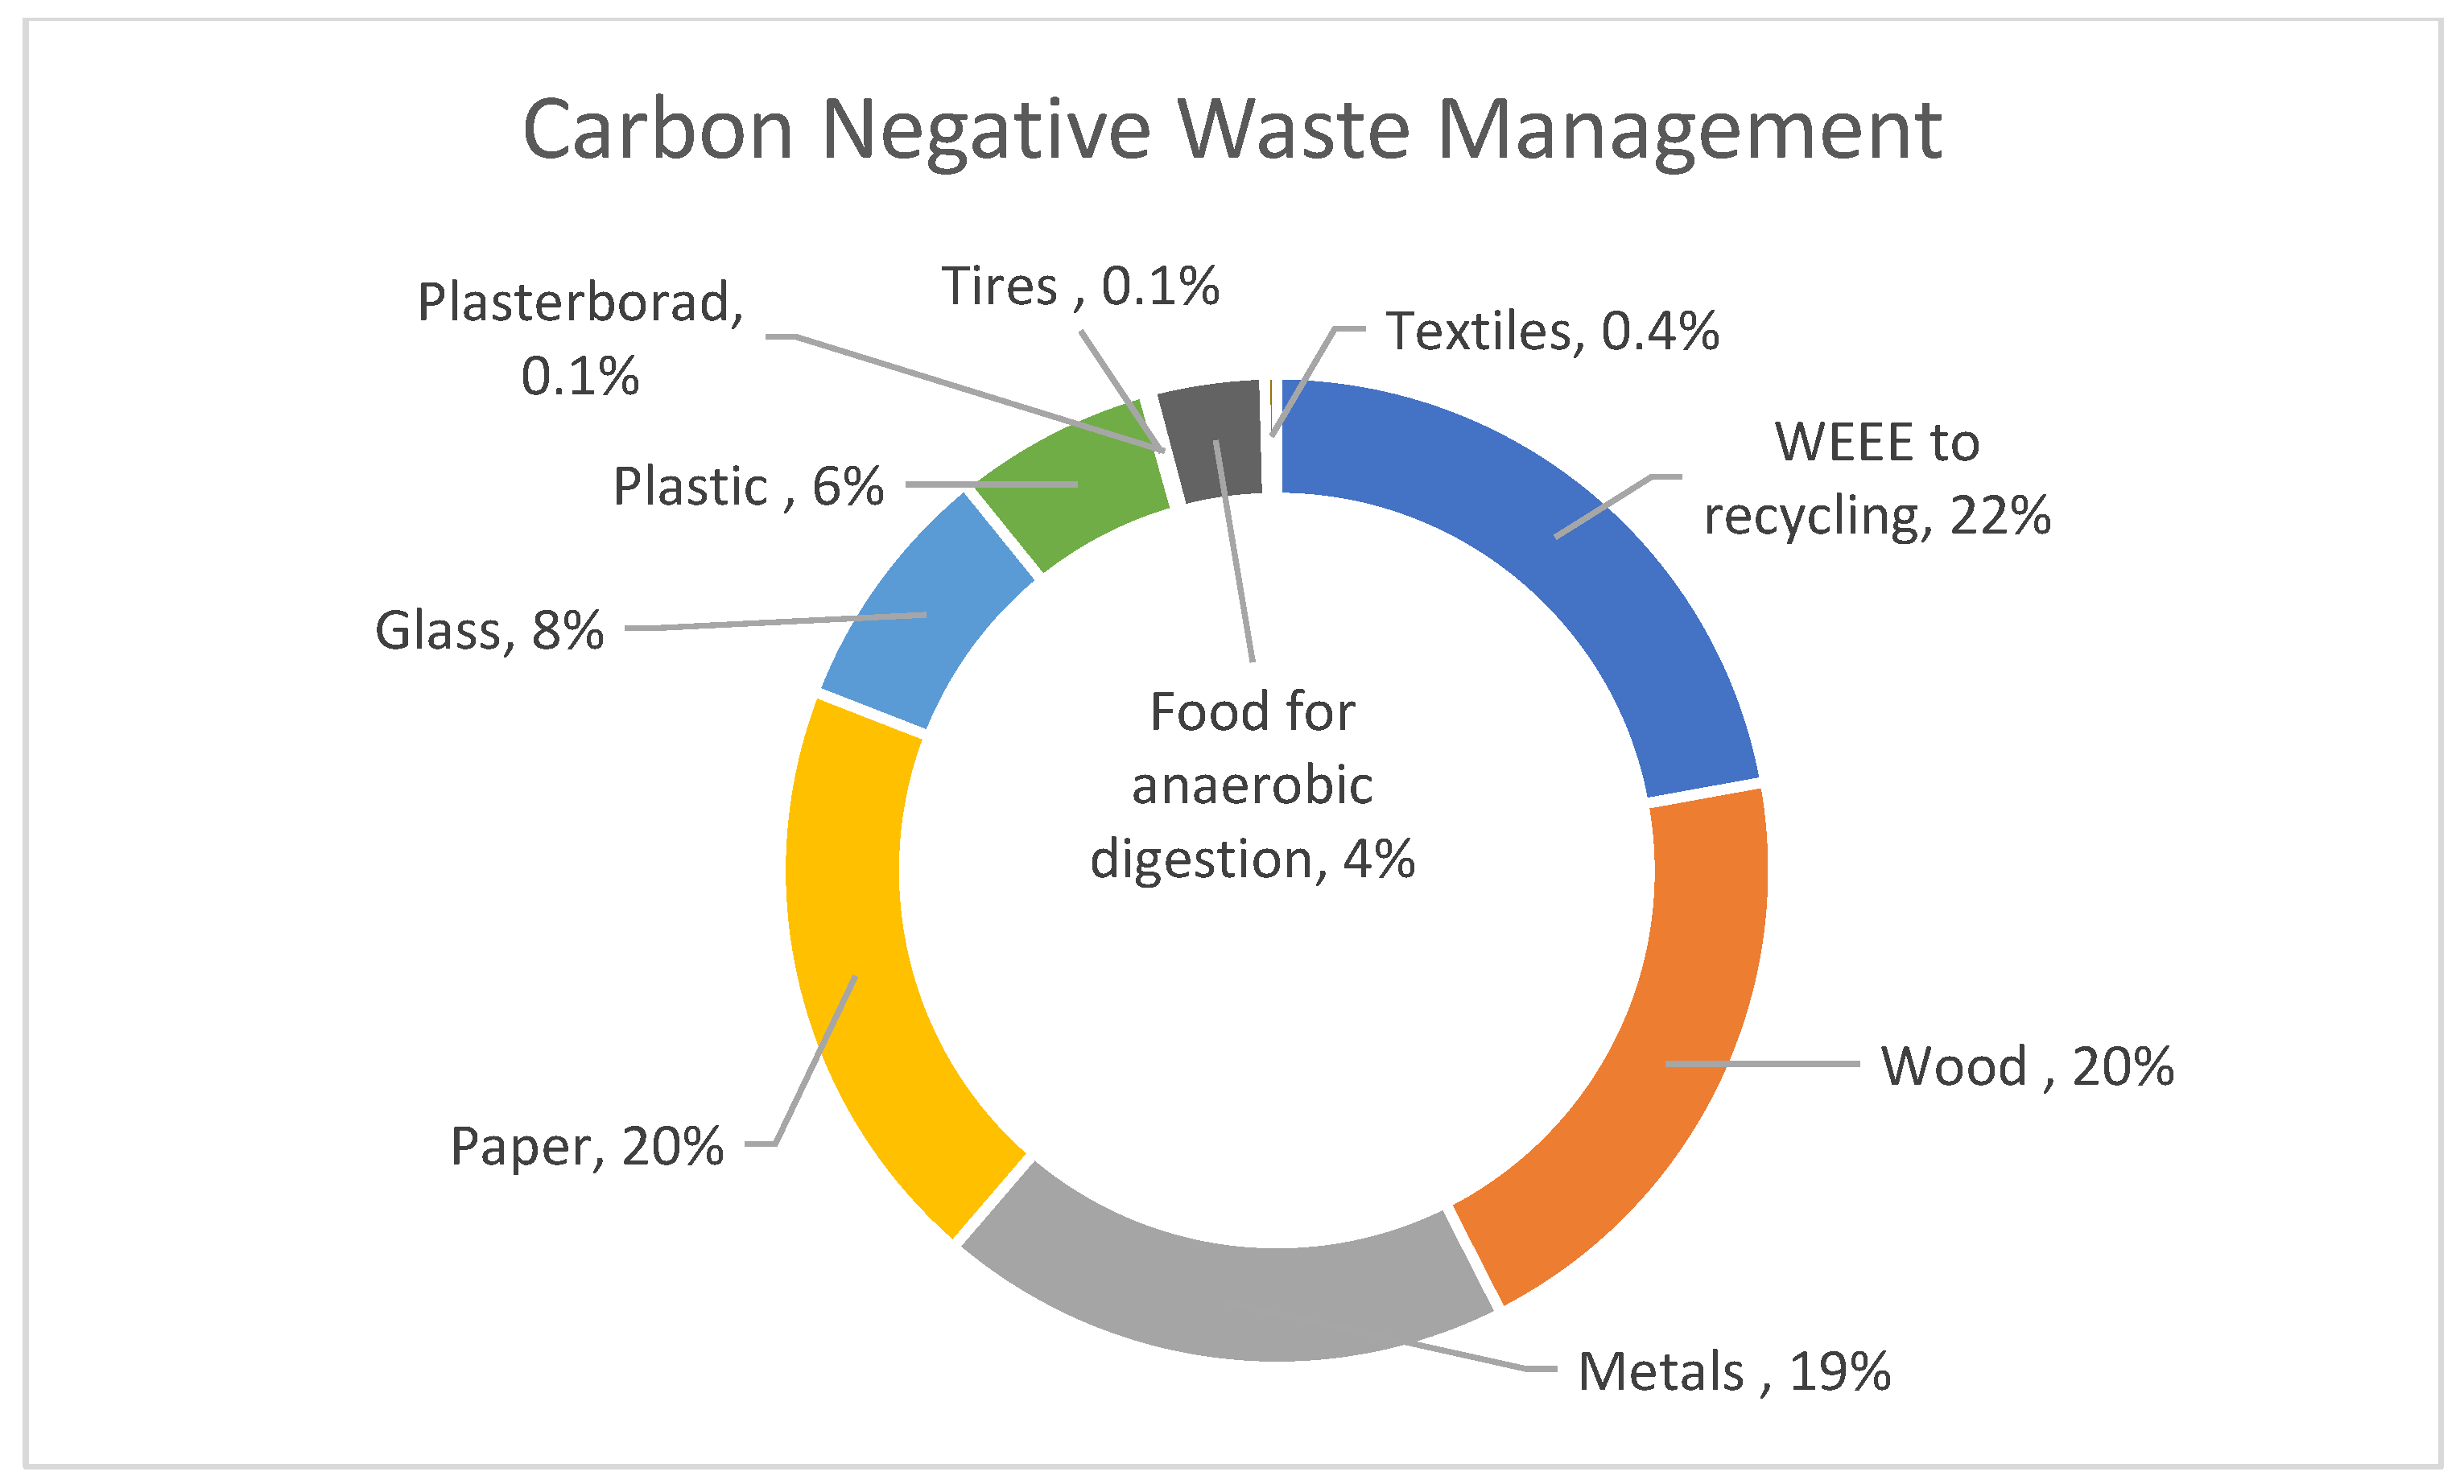
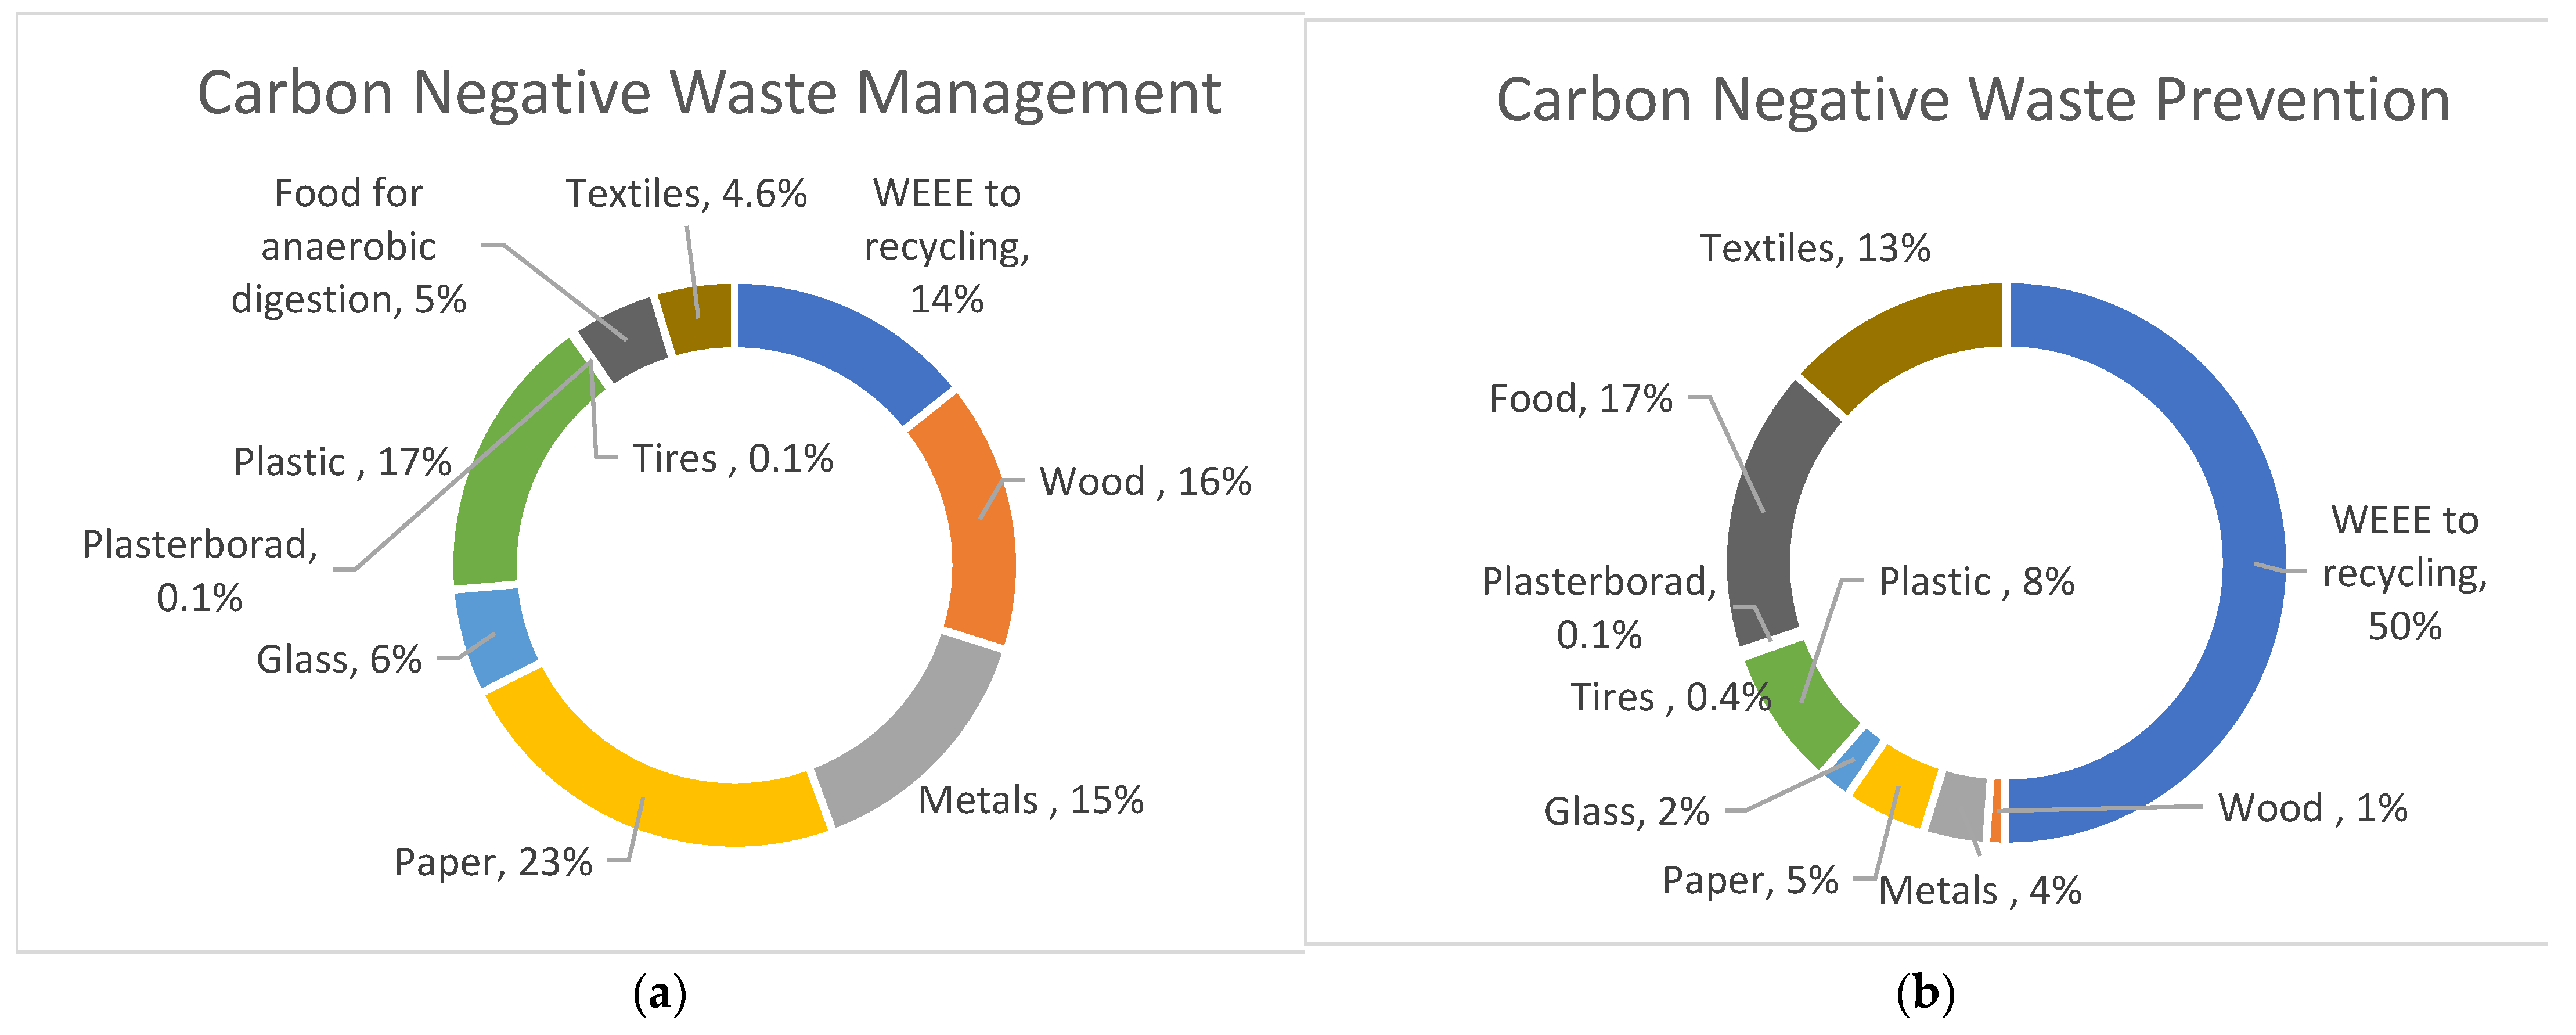
3. Results
3.1. Waste Electrical and Electronic Equipment (WEEE)
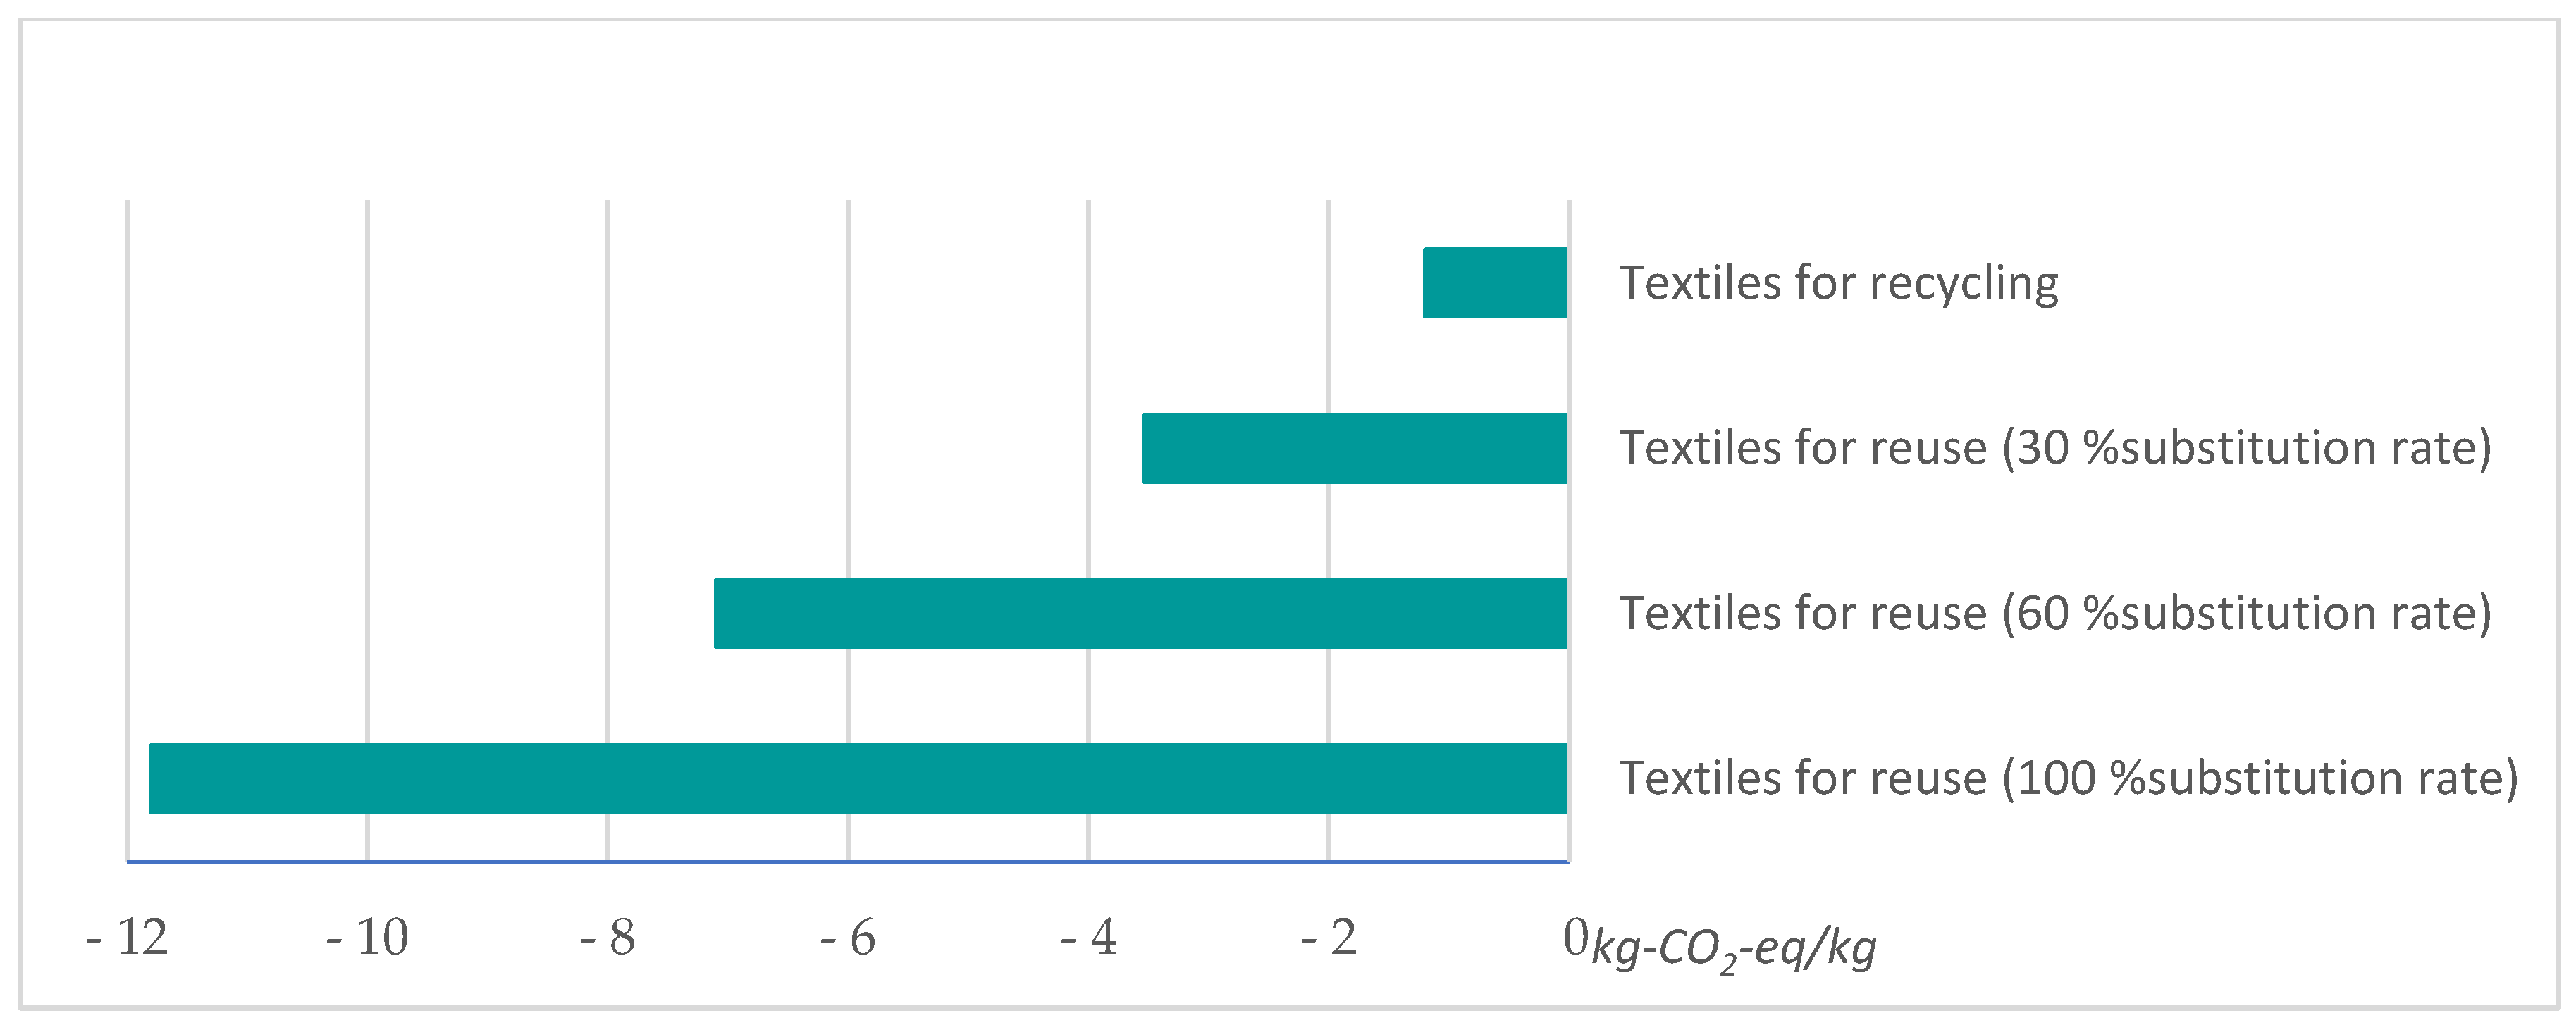
3.2. Textiles
3.3. Other Waste Streams
3.4. Recycling Versus Other Treatment Methods
4. Discussion
4.1. Uncertainties
4.2. Support for Decision-Making and Potential Limitations
5. Conclusions
Author Contributions
Funding
Institutional Review Board Statement
Informed Consent Statement
Data Availability Statement
Conflicts of Interest
Appendix A

| Waste Fraction | Modeled Substances/Composition | |
|---|---|---|
| Upstream Study | Downstream Study | |
| Food waste | Avoidable food waste composition: Meat 10% (pork 5%, beef 2.5% poultry meat 2.5%), bread 15%, dairy products 3% (cheese 2.4%, milk, filet, yogurt 0.3%, cream 0.3%), vegetables and fruits 37% (carrot 4.1%, onion 4.1%, tomato 4.1%, cucumber 4.1%, lettuce 4.1%, broccoli 4.1%, apple 4.1%, orange 4.1%, melon 4.1%), processed food 27% (pasta 9%, rice 9%, potatoes 9%), other 8% [37]. | Generic food waste composition (Swedish average) based on generic data in WAMPS |
| Residual (mixed household waste) | Waste shares: food 29.1%, green 2.8%, paper waste 2.8%; packaging: paper 9.8%, plastic 13.5%, glass 2.5%, metal 1.6%, textiles 3.6%, other non-combustible 5%, other combustible 25%, hazardous waste 0.1%, batteries 0.05%, WEEE 0.35%. Source: Avfall Web, 2016. | |
| Paper packaging | 100% paper packaging | |
| Plastic packaging | 50% hard PE, 50% soft PE (assumption). | |
| Metal packaging | 20% aluminum, 80% steel [34]. | |
| Glass | 100% glass packaging | 90% glass packaging, 10% combustible material (as a reject) |
| Wastepaper | 100% newspaper | |
| WEEE | ICT products 12%, fridges/freezers 20%, other 30%, diverse electronics 38%. Source: [38] | Household appliances: large 46%, small 5%, ICT and office 12%; home equipment (TV, A/V) 23%. power tools 3%, toys, leisure and sports 1%. other: 15% [38]. |
| Office paper | 100% office paper | 100% paper packaging. |
| Corrugated cardboard | 100% corrugated cardboard. | 100% paper packaging. |
| Textiles | Cotton 37.4%, polyester 57.4%, other (viscose) 5.4% [39]. | |
| Metal scrap | 100% steel | |
| Plasterboard | 100% plasterboard (assumption) | |
| Flat glass | Window glass without frame: 80%; wood: 15% PVC frame: 5% (assumption). | |
| Plastic (not packaging) | PP 28%; HDPE 7%; LDPE 6%; PET 3%; PVC 7%. Other 49%—aggregated weighted average of the above [40]. | 50/50% of HDPE/LDPE. |
| Tires | 100% tires. | 100% tires. |
| Wood waste, not impregnated wood | 100% wood material | 100% wood material |
| Combustible bulky waste | 20% PE plastic, 20% mixed paper, 20% garden waste, 20% wood, 10% other combustible, 10% non-combustible (assumption). | |
| Construction materials and non-combustible, inert waste | Assumption: 100% inert material (50% concrete, 50% soil/sand). | |
Appendix B
| Waste Fraction | Data Sources, Including Main Assumptions |
|---|---|
| Mixed municipal waste | Weighted values based on household waste composition in Sweden and prevention values for different materials as defined/calculated below. |
| Food waste prevention | Based on composition of “avoidable” waste and weighed values for food waste products based on [41], includes the life cycle from cradle to retail, manufacturing in Sweden and abroad, based on market 2011–2015, but excludes use phase [41] The use phase has been additionally calculated based on an average household with 1800 kWh/y (freezer and refrigerator) and 800 kWh cooking equipment [42]. Annual food consumption 267 kg/pers or 720 kg/household. Electricity for cooking −2.5 kWh/kg food. Climate intensity of electricity in Sweden: 0.11 kg-CO2-eq/kWh [43]. |
| Paper packaging | Calculations/data sources: average value of 10 different paper products (source: [44], additional calculation of transports based on Thinkstep (2018). Assumptions: Manufacturing in Sweden; transport within Sweden (500 km); use phase is considered insignificant, therefore excluded. |
| Plastic packaging | Calculations/data sources: based on material production from PlasticsEurope (2014) (Coinvent database) with 10% additional GWP from manufacturing (assumption) and transports within Europe (based on Thinkstep (2018). Assumptions: manufacturing in Europe, transports within Europe (1500 km), assumption that manufacturing corresponds 10% of impact of material production; use is considered insignificant and excluded. |
| Metal packaging | Calculations/data sources: based on the European metal market data [45,46,47], incl. transports within Europe, based on Thinkstep (2018). Assumptions: transports within Europe (1500 km); use phase is considered insignificant, therefore excluded. |
| Glass packaging | Calculations/data sources: Impacts of container glass from cradle to consumer of glass packaging in Europe (mixed products, EU production, recycling rate 7%, all transports included, inventory database Ecoinvent v3.5. Assumptions: use phase is considered insignificant and excluded. |
| Waste paper | Calculation/assumptions: average of 4 products (newspapers and magazines) manufactured and used in Sweden [48,49,50]. Assumptions: use phase considered insignificant and excluded. |
| WEEE | Calculation/data sources: weighted values on composition) of 5 WEEE products is for refrigerators [51], smart phones [27] laptops computers—3 average products [52,53], screens [53]; electric drill [54]. Use phase electricity consumption based on Swedish electricity [43]. |
| Textiles | Calculation/data sources: based on total GHG emissions from Swedish consumption of textiles [30] with adjustments (we excluded 14% of CO2 eq. for consumer transport. Data on the total amount of textiles consumed in Sweden—[55] and population size—[56]. |
| Office paper | Calculations and sources: Assumed Swedish production (cradle to the gate) including transportation within Sweden (internal IVL’s data and Thinkstep (2018) Assumptions: use phase considered insignificant and neglected. |
| Corrugated cardboard | Manufacturing cradle to the gate in Europe [57] including transportation of average product based on Thinkstep (2018). Assumptions: use phase is considered insignificant and neglected. |
| Metal (bulky) | Low alloy cradle to gate steel production in Europe (Ecoinvent database); average transportation within Europe (Thinkstep (2018): the use phase is considered insignificant, therefore excluded. |
| Plasterboard | Based on the data from the main Swedish producer (Gypro) [44]; use phase is considered insignificant and neglected. |
| Flat glass | Flat glass production in Europe (Gabi database); for PVC frame production—[44]; transportation of average product based on Thinkstep (2018); use phase is considered insignificant and neglected. |
| Plastic (not packaging) | Material production in Europe based on PlasticsEurope (2014); manufacture of packaging—10% of primary production (assumption); transportation average product within Europe (Thinkstep (2018)); use phase is considered insignificant and neglected. |
| Tires | 50% production in Europe [58] and 50% in China [59] Transportation of average product based on Thinkstep (2018). Assumptions: average weight 9.5 kg; the use phase was excluded. |
| Wood waste, not impregnated wood | Fiber-board production data—[44]; use phase is considered insignificant and neglected. |
| Combustible bulky waste | Average of the different materials and their impact. Assumptions 20% PE plastic, 20% mixed paper, 20% garden waste, 20% wood, 10% other combustible, 10% non-combustible |
| Construction and non-combustible, inert waste | Assumption: impacts of mixed sand/soil and concrete |
Appendix C
| Waste Fraction | Data Sources, Including Main Assumptions |
|---|---|
| Mixed municipal waste | WAMPS (v.2019) modeling. Main input data and assumptions: Produced energy (in co-generation plants): 85% district heating, 15% electricity; Replaced products/energy: district heating is biofuel and electricity production replaces the Swedish electricity mix. |
| Food waste to anaerobic digestion | WAMPS (v.2019) modeling. Main input data and assumptions: All 100% are directed to anaerobic digestion; produced energy is used: biogas for vehicles (90%) and district heating (10%); digestate/bio-fertilizer products replace the equivalent nitrogen and phosphorous compounds in mineral fertilizers; transports within Sweden. |
| Food waste to ind./home composting (same for paper packaging) | WAMPS (v.2019) modeling. Main input data and assumptions: All 100% are directed to central composting plant; the produced compost replaces the equivalent nitrogen and phosphorous compounds in mineral fertilizers; transports within Sweden. |
| Plastic packaging | WAMPS (v.2019) modeling. Main input data and assumptions: All 100% are sent to material sorting of which 25% are rejects (go to energy recovery), and 75% undergo material recycling; the collection transports within Sweden, 50% of centrally pre-sorted materials are assumed to be transported to Germany for further recycling. |
| Metal packaging | Mixed data from literature on emissions from primary and secondary material production in Europe and Sweden [45,46,47,60]. |
| Glass packaging | Based on data from the Nordic region [61]. |
| Waste paper | WAMPS (v.2019) modeling. Main input data and assumptions: All 100% are sent to material sorting, 15% are rejects (energy recovery), and 85% undergo material recycling with transports within Sweden. |
| WEEE | WAMPS (v.2019) modeling for the handling of the reject by incineration and landfilling. Main input data and assumptions: WEEE treatment (of 100% separately collected, after dismantling and shredding) with 75% recycling and 13% incineration with energy recovery. CO2-eq data is from the recycling is based on maximum possible savings due to material content [62]. |
| Textiles (recycling) | WAMPS (v.2019) modeling for the handling of rejects by incineration. Main input data and assumptions: separately collected waste textiles—80% recycling and 20% (reject) by energy recovery. CO2-eq data is from recycling (avg. of different recycling technologies) [63,64]. |
| Textiles (reuse) | Main input data and assumptions: separately collected waste textiles—80% reuse (reject) by energy recovery. Modeling based on [63,64] and WAMPS (v.2019) |
| Office paper and corrugated cardboard | WAMPS (v.2019) modeling. Main input data and assumptions: All 100% are sent to material pre-sorting of which 15% is reject (energy recovery), and 85% (material recycling; same emissions from recycling process as with paper packaging, but assumed to replace office paper produced in Sweden. |
| Metal scrap (bulky) | Emissions from primary and secondary material production in Europe and Sweden (Eco-invent 3.1) and WAMPS (v.2019) modeling for the rejects. |
| Plasterboard | Data on virgin plasterboard based on the LCA study [65] on plasterboard but adjusted according to the Swedish electricity production and transports. Waste operations based on interview [66] on energy use, transports and the reject modeled with WAMPS. Main input data and assumptions: 90% recycling and 10% landfilling (rejects). |
| Flat glass | WAMPS (v.2019) modeling and Hillman, Damgaard [61]. Main input data and assumptions: 80% glass (for recycling), same as glass packaging, 15% (wood) and 5% plastic, to energy recovery. |
| Plastic (not packaging) | WAMPS (v.2019) modeling. Main input data and assumptions: 100% is sent to material sorting of which 25% is reject (goes to energy recovery), and 75% undergoes material recycling. Collection transports within Sweden, 50% of centrally pre-sorted materials are assumed to be transported to be transported to Germany for further recycling. |
| Tires | WAMPS (v.2019) modeling of energy recovery; recycling-literature based [67]. Main input data and assumptions: Treatment of separately collected tires [68]: 40% recycling (10% granulated tires used as fill layers in artificial turf and replace fossil-based alternatives *, 30% other use (e.g., used as elements of playground or road marking; and replaces wooden materials); 60% for energy recovery: 30% more cement factories (replaces coal); 30% to conventional waste incineration. * assumed to replace three alternative filling materials: expanded cork, EPDM and TPE14 (average of all three used in calculations). |
| Non-impregnated wood and combustible bulk waste | WAMPS (v.2019) modeling. Main input data and assumptions: All 100% are incinerated with energy recovery: 85/15% heating/electricity; energy replacement:—biofuels for heating and the Swedish electricity mix for the produced electricity. |
| Construction materials | WAMPS (v.2019) modeling. Main input data and assumptions: 100% used as construction materials and replaced sand, soil, gravel, stone or similar. |
| Non-combustible/inert waste | WAMPS (v.2019) modeling. Main input data and assumptions. 100% landfilled. Assumed to contain 4% organic material that is deposited in the landfill. |
Appendix D
- −
- Baseline Scenario 1: Reflects the waste management practices in Sweden as of 2020. “Waste quantities 1” as listed in Table A4 was utilized for this scenario.
- −
- Recycled Waste Scenario 2: In addition to the fractions already recycled in 2020, this scenario assumes that all residual waste and mixed bulky waste are separated and recycled. The compositional analyses of mixed residual household waste and mixed combustible bulky waste (referenced in Appendix A and Appendix B, respectively) were used to allocate mixed waste to recyclables. “Waste quantities 2” from Table A4 were applied in this scenario.
- −
- Prevented Recyclables Scenario 3: Assumes that all residual waste and mixed bulky waste, alongside all recyclables already collected separately in 2020, are prevented from entering the waste stream. The same compositional analyses used in the Recycled Waste Scenario are applied here. “Waste quantities 2” from Table A4 were applied in this scenario.
| Waste Fraction | Waste Quantities 1 (Tons) [33] | Waste Quantities 2 | Baseline 2020 (Ton-CO2-eq) | Prevented Recyclables (Ton-CO2-eq) | Recycled Waste (Ton-CO2-eq) | Difference (Ton-CO2-eq) | Rank |
|---|---|---|---|---|---|---|---|
| WEEE | 155,840 | 161,900 | −233,800 | −6,152,300 | −242,900 | −5,909,500 | 1 |
| Textiles to recycling | 3490 | 65,860 | −4200 | −1,646,500 | −79,000 | −1,567,500 | 3 |
| Tires | 12,000 | 12,000 | −1200 | −43,200 | −1200 | −42,000 | 12 |
| Residual household waste | 1,669,090 | 5010 | 333,800 | −11,500 | 1000 | −12,500 | 17 |
| Metal packaging (20% Al; 80%Fe) | 21,750 | 49,470 | −39,200 | −108,800 | −89,000 | −19,800 | 15 |
| Food waste to anaerobic digestion | 389,572 | 850,220 | −39,000 | −1,870,500 | −85,000 | −1,785,500 | 2 |
| Food waste to central composting | 7658 | 16,710 | 200 | −36,800 | 500 | −37,300 | 13 |
| Food waste to home composting | 29,140 | 63,600 | 2000 | −139,900 | 4500 | −144,400 | 8 |
| Plastic packaging | 99,600 | 333,490 | −59,800 | −700,300 | −200,100 | −500,200 | 5 |
| Plastic (not packaging, bulky) | 14,540 | 137,320 | −8700 | −288,400 | −82,400 | −206,000 | 6 |
| Combustible bulky waste | 613,910 | 494,520 | 184,200 | −989,000 | 148,400 | −1,137,400 | 4 |
| Metal scrap (bulky) (steel: 50% virgin, 50% recycled) | 176,550 | 176,550 | −158,900 | −335,400 | −158,900 | −176,600 | 7 |
| Flat glass | 2900 | 2900 | −600 | −3500 | −600 | −2900 | 19 |
| Paper waste (non/packaging) (within EPR) | 168,400 | 339,690 | −151,600 | −373,700 | −305,700 | −67,900 | 11 |
| Glass packaging | 248,520 | 291,830 | −87,000 | −233,500 | −102,100 | −131,300 | 9 |
| Corrugated cardboard | 56,340 | 56,340 | −16,900 | −33,800 | −16,900 | −16,900 | 16 |
| Paper packaging | 190,860 | 360,650 | −38,200 | −180,300 | −72,100 | −108,200 | 10 |
| Plasterboard | 27,330 | 27,330 | −1400 | −8200 | −1400 | −6800 | 18 |
| Wood waste, not impregnated wood | 538,351 | 661,130 | −215,300 | −132,200 | −264,500 | 132,200 | 22 |
| Construction materials | 192,214 | 192,210 | 0 | −1900 | 0 | −1900 | 20 |
| Non-combustible/inert waste | 94,200 | 242,220 | 9400 | −2400 | 24,200 | −26,600 | 14 |
| Garden waste | 439,728 | 611,020 | 44,000 | 61,100 | 61,100 | 0 | 21 |
| Total | 5,151,980 | 5,151,980 | −481,900 | −13,231,200 | −1,462,200 |
References
- EC. Communication from the Commission to the European Parliament, the Council, the European Economic and Social Committee and the Committee of the Regions. Stepping up Europe’s 2030 Climate Ambition. 2020. Available online: https://eur-lex.europa.eu/legal-content/EN/TXT/?uri=CELEX:52020DC0562 (accessed on 6 March 2024).
- SEPA. Sweden’s Climate Act and Climate Policy Framework. 2020. Available online: https://www.swedishepa.se/Environmental-objectives-and-cooperation/Swedish-environmental-work/Work-areas/Climate/Climate-Act-and-Climate-policy-framework-/ (accessed on 6 March 2024).
- EC. Directive (EU) 2018/851 of the European Parliament and of the Council of 30 May 2018 amending Directive 2008/98/EC on waste (Text with EEA Relevance) [WWW Document]. 2018. Available online: https://eur-lex.europa.eu/legal-content/EN/TXT/?uri=uriserv:OJ.L_.2018.150.01.0109.01.ENG (accessed on 6 March 2024).
- Alhazmi, H.; Almansour, F.H.; Aldhafeeri, Z. Plastic Waste Management: A Review of Existing Life Cycle Assessment Studies. Sustainability 2021, 13, 5340. [Google Scholar] [CrossRef]
- Christensen, T.H.; Damgaard, A.; Levis, J.; Zhao, Y.; Björklund, A.; Arena, U.; Barlaz, M.A.; Starostina, V.; Boldrin, A.; Astrup, T.F.; et al. Application of LCA modelling in integrated waste management. Waste Manag. 2020, 118, 313–322. [Google Scholar] [CrossRef] [PubMed]
- Bisinella, V.; Schmidt, S.; Varling, A.S.; Laner, D.; Christensen, T.H. Waste LCA and the future. Waste Manag. 2024, 174, 53–75. [Google Scholar] [CrossRef]
- Llatas, C.; Bizcocho, N.; Soust-Verdaguer, B.; Montes, M.V.; Quiñones, R. An LCA-based model for assessing prevention versus non-prevention of construction waste in buildings. Waste Manag. 2021, 126, 608–622. [Google Scholar] [CrossRef] [PubMed]
- Bizcocho, N.; Llatas, C. Inclusion of prevention scenarios in LCA of construction waste management. Int. J. Life Cycle Assess. 2019, 24, 468–484. [Google Scholar] [CrossRef]
- Batool, F.; Kurniawan, T.A.; Mohyuddin, A.; Othman, M.H.; Aziz, F.; Al-Hazmi, H.; Goh, H.H.; Anouzla, A. Environmental impacts of food waste management technologies: A critical review of life cycle assessment (LCA) studies. Trends Food Sci. Technol. 2024, 143, 104287. [Google Scholar] [CrossRef]
- Boldrin, A.; Andersen, J.K.; Christensen, T.H. Environmental assessment of garden waste management in the Municipality of Aarhus, Denmark. Waste Manag. 2011, 31, 1560–1569. [Google Scholar] [CrossRef]
- Xue, M.; Xu, Z. Application of Life Cycle Assessment on Electronic Waste Management: A Review. Environ. Manag. 2017, 59, 693–707. [Google Scholar] [CrossRef] [PubMed]
- Liu, G.; Hao, Y.; Dong, L.; Yang, Z.; Ulgiati, S. An emergy-LCA analysis of municipal solid waste management. Resour. Conserv. Recycl. 2017, 120, 131–143. [Google Scholar] [CrossRef]
- Andreasi Bassi, S.; Christensen, T.H.; Damgaard, A. Environmental performance of household waste management in Europe—An example of 7 countries. Waste Manag. 2017, 69, 545–557. [Google Scholar] [CrossRef]
- Yan, Z.; Wang, H.-T.; Lu, W.-J.; Damgaard, A.; Christensen, T.H. Life-cycle assessment of the municipal solid waste management system in Hangzhou, China (EASEWASTE). Waste Manag. Res. 2009, 27, 399–406. [Google Scholar] [CrossRef] [PubMed]
- Miliūte, J.; Staniškis, J.K. Application of life-cycle assessment in optimisation of municipal waste management systems: The case of Lithuania. Waste Manag. Res. 2009, 28, 298–308. [Google Scholar] [CrossRef] [PubMed]
- Wang, D.; He, J.; Tang, Y.-T.; Higgitt, D.; Robinson, D. Life cycle assessment of municipal solid waste management in Nottingham, England: Past and future perspectives. J. Clean. Prod. 2020, 251, 119636. [Google Scholar] [CrossRef]
- Zhang, J.; Qin, Q.; Li, G.; Tseng, C.-H. Sustainable municipal waste management strategies through life cycle assessment method: A review. J. Environ. Manag. 2021, 287, 112238. [Google Scholar] [CrossRef] [PubMed]
- Laurent, A.; Bakas, I.; Clavreul, J.; Bernstad, A.; Niero, M.; Gentil, E.; Hauschild, M.Z.; Christensen, T.H. Review of LCA studies of solid waste management systems—Part I: Lessons learned and perspectives. Waste Manag. 2014, 34, 573–588. [Google Scholar] [CrossRef] [PubMed]
- Laurent, A.; Clavreul, J.; Bernstad, A.; Bakas, I.; Niero, M.; Gentil, E.; Christensen, T.H.; Hauschild, M.Z. Review of LCA studies of solid waste management systems—Part II: Methodological guidance for a better practice. Waste Manag. 2014, 34, 589–606. [Google Scholar] [CrossRef] [PubMed]
- Arushanyan, Y.; Björklund, A.; Eriksson, O.; Finnveden, G.; Ljunggren Söderman, M.; Sundqvist, J.O.; Stenmarck, Å. 2017. Environmental Assessment of Possible Future Waste Management Scenarios. Energies 2017, 10, 247. [Google Scholar] [CrossRef]
- Ekvall, T.; Azapagic, A.; Finnveden, G.; Rydberg, T.; Weidema, B.P.; Zamagni, A. Attributional and consequential LCA in the ILCD handbook. Int. J. Life Cycle Assess. 2016, 21, 293–296. [Google Scholar] [CrossRef]
- Earles, J.M.; Halog, A. Consequential life cycle assessment: A review. Int. J. Life Cycle Assess. 2011, 16, 445–453. [Google Scholar] [CrossRef]
- Moora, H.; Stenmarck, Å.; Sundqvist, J.-O. Use of life cycle assessment as decision support tool in waste management planning—optimal waste management scenarios for the baltic states. Environ. Eng. Manag. J. 2006, 5, 445–455. [Google Scholar] [CrossRef]
- Sundqvist, J.-O.; Palm, D. Miljöpåverkan Från Avfall. Underlag för Avfallsprevention och Förbättrad Avfallshantering; IVL Svenska Miljöinstitutet: Stockholm, Sweden, 2010; Available online: https://ivl.diva-portal.org/smash/get/diva2:1552148/FULLTEXT01.pdf (accessed on 6 March 2024).
- Bjarnadóttir, H.J.; Friðriksson, G.B.; Johnsen, T.; Sletsen, H. Guidelines for the Use of LCA in the Waste Managment Sector; Technical Report, TR 517; Nordic Innovation Centre, Nordtest: Espoo, Finland, 2002; Available online: https://fenur.is/wp-content/uploads/2018/04/Guidline-for-the-use-of-LCA-in-the-wastemanagement-sector-with-appendixes_Nordtest-report-nr-1537-01.pdf (accessed on 6 March 2024).
- Avfall Sverige. Svensk Avfallshantering 2019. 2020. Available online: https://newsroom.notified.com/avfall-sverige/media/104250/sah-2019-publ2020pdf (accessed on 6 March 2024).
- Ercan, M.; Malmodin, J.; Bergmark, P.; Kimfalk, E.; Nilsson, E. Life Cycle Assessment of a Smartphone. In Proceedings of ICT for Sustainability 2016; Atlantis Press: Amsterdam, The Netherlands, 2016. [Google Scholar] [CrossRef]
- Bachér, J.; Dams, Y.; Duhoux, T.; Deng, Y.; Teittinen, T.; Mortensen, L.F. Electronic Products and Obsolescence in a Circular Economy. European Topic Centre Waste and Materials in a Green Economy. 2020. Available online: https://www.eionet.europa.eu/etcs/etc-wmge/products/etc-wmge-reports/electronics-and-obsolescence-in-a-circular-economy/@@download/file/ETC-WMGE_Electronics%20and%20obsolescence%20in%20CE_final.pdf (accessed on 6 March 2024).
- El-Kretsen. Från återvinnare till råvaruleverantör–plast och elektronik. Hållbarhetsredovisning 2019. Available online: https://kunskapsrummet.com/wp-content/uploads/2021/02/2019.pdf (accessed on 6 March 2024).
- Roos, S.; Larsson, M. Klimatdata för Textilier in Uppdragsrapport. 2018. Available online: https://www.naturvardsverket.se/upload/miljoarbete-i-samhallet/miljoarbete-i-sverige/uppdelat-efter-omrade/hallbar-konsumtion/rapport-klimatdata-for-textilier-swerea-2018.pdf (accessed on 6 March 2024).
- Sandin, G.; Peters, G.M. Environmental impact of textile reuse and recycling—A review. J. Clean. Prod. 2018, 184, 353–365. [Google Scholar] [CrossRef]
- Ljungkvist Nordin, H.; Westöö, A.-K.; Boberg, N.; Fråne, A.; Guban, P.; Sörme, L.; Ahlm, M. Kartläggning av Plastflöden i Sverige: Råvara, Produkter, Avfall och Nedskräpning, in SMED Rapport. 2019. Available online: http://urn.kb.se/resolve?urn=urn:nbn:se:naturvardsverket:diva-8118 (accessed on 6 March 2024).
- Avfall Sverige. Svensk Avfallshantering 2020, Avfall Sverige: Malmö. 2021. Available online: https://www.avfallsverige.se/aktuellt/nyheter/sa-utvecklas-svensk-avfallshantering-statistik-for-ar-2020/ (accessed on 6 March 2024).
- FTI. Med Metall in i Evigheten. 2019. Available online: https://www.ftiab.se/2281.html (accessed on 29 March 2019).
- Sorrell, S.; Dimitropoulos, J. The rebound effect: Microeconomic definitions, limitations and extensions. Ecol. Econ. 2008, 65, 636–649. [Google Scholar] [CrossRef]
- Livsmedelsverket. Report Summaries from the Swedish Government Commission to Reduce Food Loss and Waste 2017—2019, Livsmedelsverket (Swedish National Food Agency). 2019. Available online: https://www.livsmedelsverket.se/globalassets/publikationsdatabas/rapporter/2020/2020-report-summaries-food-lost-and-waste-2017-2019.pdf (accessed on 6 March 2024).
- Bernstad Saraiva Schott, A.; Andersson, T. Food waste minimization from a life-cycle perspective. J. Environ. Manag. 2015, 147, 219–226. [Google Scholar] [CrossRef] [PubMed]
- El-Kretsen. Insamlingsstatistik 2017; El-Kretsen: Stockholm, Sweden, 2018. [Google Scholar]
- IVL. Livcyckel Analys av Svensk Textilkonsumption. 2013. Available online: https://www.ivl.se/download/18.694ca0617a1de98f473476/1628416214092/FULLTEXT01.pdf (accessed on 6 March 2024).
- Fråne, A.; Andersson, T.; Lassesson, H. Materialåtervinning av Plastavfall från Återvinningscentraler, IVL. 2017. Available online: https://www.diva-portal.org/smash/record.jsf?pid=diva2%3A1549703&dswid=-2725 (accessed on 6 March 2024).
- Moberg, E.; Andersson, M.W.; Säll, S.; Hansson, P.-A.; Röös, E. Determining the climate impact of food for use in a climate tax—Design of a consistent and transparent model. Int. J. Life Cycle Assess. 2019, 24, 1715–1728. [Google Scholar] [CrossRef]
- Energirådgivare. Elförbrukning i en Genomsnittlig Villa Respektive Lägenhet. 2011. Available online: http://www.energiradgivaren.se/2011/09/elforbrukning-i-en-genomsnittlig-villa-respektive-lagenhet/ (accessed on 6 March 2024).
- Erlandsson, M.; Sandberg, E.; Berggren, B.; Francart, N.; Adolfsson, I. Timdata för Svensk el och Färrvärme från Rapporten: Byggnaders Klimatpåverkan, Timme för Time—Idag Och i Framtiden. En Gemensam Metod för Energi- och Miljöklassning., Energimyndigheten; IVL Svenska Miljöinstitutet: Stockholm, Sweden, 2018; Available online: https://ivl.diva-portal.org/smash/get/diva2:1549625/FULLTEXT01.pdf (accessed on 6 March 2024).
- Envirodec. EPD Library. 2019. Available online: https://environdec.com/library (accessed on 6 March 2024).
- European Aluminium. Environemental PROFILE report. Life-Cycle Inventory Data for Aluminium Production and Transformation Processes in Europe. 2018. Available online: https://european-aluminium.eu/wp-content/uploads/2022/10/european-aluminium-environmental-profile-report-2018-executive-summary.pdf (accessed on 6 March 2024).
- European Aluminium. “Recycled Content” vs. “End-of-Life Recycling Rate”. 2016. Available online: https://european-aluminium.eu/wp-content/uploads/2022/10/recycled-content-vs-end-of-life-recycling-rate-may-2016.pdf (accessed on 1 March 2019).
- Apeal. Life Cycle Assessment (LCA) on Tinplate. Steel for Packaging. 2015. Available online: https://www.apeal.org/wp-content/uploads/2015/09/APEAL_LCA_Summary_report2015.pdf (accessed on 6 March 2024).
- Achachlouei, M.A.; Moberg, Å. Life Cycle Assessment of a Magazine, Part II: A Comparison of Print and Tablet Editions. J. Ind. Ecol. 2015, 19, 590–606. [Google Scholar] [CrossRef]
- Atterhög. Förenklad Livscykelanalys (LCA) och Livscykelkostnadsanalys för en Kvällstidning. Examensarbete. Datavetenskap och Kommunikation; KTH: Stockholm, Sweden, 2008. [Google Scholar]
- Kronqvist, M.; Löfgren, C.S.; Teleman, A.A. Miljöbedömning av Mediekanalerna Papperstidskrift och Internetpublicering. In Innventiarapport: Stockholm. 2010. Available online: https://www.grafiska.se/imagevault/publishedmedia/0gnwvwkj979mj1bmqec9/innventia-report-97.pdf?download=0 (accessed on 6 March 2024).
- Jema. Consider the Life Cycle of the Refrigerator. 2012. Available online: https://www.jema-net.or.jp/English/businessfields/environment/data/summary_consider.pdf (accessed on 6 March 2024).
- Dell. Dell Laptop Carbon Footprint. 2018. Available online: https://i.dell.com/sites/content/corporate/corp-comm/en/Documents/dell-laptop-carbon-footprint-whitepaper.pdf (accessed on 1 March 2019).
- Apple. Your product’s Environmental Report Card. 2019. Available online: https://www.apple.com/lae/environment/ (accessed on 6 March 2024).
- Laurenti, R.; Moberg, Å.; Stenmarck, Å. Calculating the pre-consumer waste footprint: A screening study of 10 selected products. Waste Manag. Res. 2016, 35, 65–78. [Google Scholar] [CrossRef] [PubMed]
- Naturvårdsverket. Nettoinflöde (Import Minus Export) av Nya Textilier Per Person. 2018. Available online: http://www.naturvardsverket.se/Sa-mar-miljon/Statistik-A-O/Textil/ (accessed on 6 March 2024).
- SCB. Sveriges Befolkning. 2019. Available online: https://www.statistikdatabasen.scb.se/pxweb/sv/ssd/START__BE__BE0101__BE0101A/BefolkningNy/table/tableViewLayout1/ (accessed on 6 March 2024).
- FEFCO. European Database for Corrugated Board LCA Studies. 2018. Available online: http://www.fefco.org/lca/data-description/weighted-averages (accessed on 6 March 2024).
- Evonik. Tires Go Green–A Life Cycle Assessment. 2016. Available online: https://www.rubber-silanes.com/en/attachment/3509?rev=1 (accessed on 6 March 2024).
- Sun, X.; Liu, J.; Hong, J.; Lu, B. Life cycle assessment of Chinese radial passenger vehicle tire. Int. J. Life Cycle Assess. 2016, 21, 1749–1758. [Google Scholar] [CrossRef]
- IVL. Avfall Sveriges Nyckeltal Kring Materialåtervinning. Materialåtervinning Sparar Energi—Här Ser du Hur Mycket. 2010. [Google Scholar]
- Hillman, K.; Damgaard, A.; Eriksson, O.; Jonsson, D.; Lena, F. Climate Benefits of Material Recycling. Inventory of Average Greenhouse Gas Emissions for Denmark, Norway and Sweden; Nordisk Ministerråd: Copenhagen, Denmark, 2015; Available online: http://norden.diva-portal.org/smash/get/diva2:839864/FULLTEXT03.pdf.http://norden.diva-portal.org/smash/get/diva2:839864/FULLTEXT03.pdf (accessed on 6 March 2024).
- Ivert, L.K.; Raadal, H.L.; Fråne, L.H. The Role of the WEEE Collection and Recycling System Setup on Environmental, Economic och Socio-Economic Performance. 2015. Available online: https://www.diva-portal.org/smash/get/diva2:1552379/FULLTEXT01.pdf (accessed on 6 March 2024).
- Palm, D.; Harris, S.; Ekvall, T. Livscykelanalys av Svensk Textilkonsumption. Underlagsrapport Till Naturvårdsverkets regeringsuppdrag om nya Etappmål, IVL. 2013. Available online: https://www.diva-portal.org/smash/get/diva2:1552424/FULLTEXT01.pdf (accessed on 6 March 2024).
- Schmidt, A.; Watson, D.; Roos, S.; Askham, C.; Poulsen, P.B. Gaining Benefits from Discarded Textiles: LCA of Different Treatment Pathways; TemaNord; Nordisk Ministerråd: Copenhagen, Denmark, 2016; Available online: https://norden.diva-portal.org/smash/get/diva2:957517/FULLTEXT02.pdf (accessed on 6 March 2024).
- Fořt, J.; Černý, R. Carbon footprint analysis of calcined gypsum production in the Czech Republic. J. Clean. Prod. 2018, 177, 795–802. [Google Scholar] [CrossRef]
- Miliute-Plepiene, J.; Unsbo, H.; Sundqvist, J.-O. Klimatnyttan med Materialåtervinning av Byggavfall; IVL: Stockholm, Sweden, 2022; p. 40. ISBN 978-91-7883-402-0. Available online: http://urn.kb.se/resolve?urn=urn:nbn:se:ivl:diva-3999 (accessed on 6 March 2024).
- Johansson, K. Life Cycle Assessment of Two End-of-Life Tyre Applications: Artificial Turfs and Asphalt Rubber; Ragn-Sells Däckåtervinning AB: Landskrona, Sweden, 2018; Available online: https://www.sdab.se/media/1323/2018-1511-sdabs-annex-4-lca-granulat-foer-konstgraesplaner-ragn-sells.pdf (accessed on 6 March 2024).
- SMED. Avfall i Sverige 2016, SMED på Uppdrag av Naturvårdsverket. 2018. Available online: https://www.naturvardsverket.se/Documents/publikationer6400/978-91-620-6839-4.pdf?pid=22595 (accessed on 6 March 2024).
| Waste Fraction | Waste Prevention, kg-CO2-eq | Waste Management, kg-CO2-eq | Difference, kg-CO2-eq | Rank | Dominant (Typical) WM (incl. Pre-Sorting) |
|---|---|---|---|---|---|
| WEEE | −38 | −1.5 | −36.5 | 1 | Recycling (78%), incineration (13%), landfilling (9%) |
| Textiles (reuse) | −25 | −7.1 | −17.9 | 3 | Reuse (80%), incineration (20%) |
| Textiles (recycling) | −25 | −1.2 | −23.8 | 2 | Recycling (80%), incineration (20%) |
| Tires | −3.6 | −0.1 | −3.5 | 4 | Recycling (40%); used for fuel (60%) |
| Residual household waste | −2.3 | 0.2 | −2.5 | 5 | Incineration (100%) |
| Metal packaging (20% Al; 80%Fe) | −2.2 | −1.8 | −0.4 | 16 | Recycling (100%) |
| Food waste (anaerobic digestion) | −2.2 | −0.1 | −2.1 | 10 | Anaerobic digestion (100%) |
| Food waste (industrial composting) | −2.2 | 0.03 | −2.2 | 8 | Industrial composting (100%) |
| Food waste (home composting) | −2.2 | 0.07 | −2.3 | 7 | Home composting (100%) |
| Plastic packaging | −2.1 | −0.6 | −1.5 | 11 | Recycling (60%), incineration (40%) |
| Plastic (not packaging, bulky) | −2.1 | −0.6 | −1.5 | 11 | Recycling (75%), incineration (25%) |
| Combustible bulky waste | −2 | 0.3 | −2.3 | 6 | Incineration (100%) |
| Example of bulky waste: sofa | −2.1 | 0.1 | −2.2 | 9 | Incineration (100%) |
| Metal scrap (bulky) (steel: 50% virgin, 50% recycled) | −1.9 | −0.9 | −1.0 | 14 | Recycling (100%) |
| Flat glass | −1.2 | −0.2 | −1.0 | 13 | Recycling (80%), incineration (20%) |
| Paper waste (non/packaging) (within EPR) | −1.1 | −0.9 | −0.2 | 20 | Recycling (85%), incineration (15%) |
| Glass packaging | −0.8 | −0.35 | −0.5 | 15 | Recycling (90%), incineration (10%) |
| Corrugated cardboard | −0.6 | −0.3 | −0.3 | 17 | Recycling |
| Office paper | −0.4 | −0.2 | −0.2 | 21 | Recycling (85%), incineration (15%) |
| Paper packaging | −0.5 | −0.2 | −0.3 | 17 | Recycling (85%), incineration (15%) |
| Plasterboard | −0.3 | −0.05 | −0.3 | 19 | Recycling (90%), landfilling as reject (10%) |
| Wood waste, not impregnated wood | −0.2 | −0.4 | 0.2 | 22 | Incineration (100%) |
| Construction materials | −0.01 | 0 | −0.01 | 23 | Use as road materials for landfills (100%) |
| Non-combustible/inert waste | −0.01 | 0.1 | −0.4 | 16 | Use as road materials for landfills (100%) |
| Garden waste | n/r | 0.1 | Open windrow composting (100%) |
| Product Group | Waste Prevention, kg-CO2-eq/kg | Waste Prevention, kg-CO2-eq/Piece |
|---|---|---|
| Mobile phone | −415 | −68 |
| Laptop | −199 | −252 |
| Screen | −175 | −989 |
| Electric drill | −4.3 | −10 |
| Refrigerator | −7.5 | −768 |
| Materials | Various Small Electronics | Refrigerators and Freezers |
|---|---|---|
| Iron (material recycling) | 40% | 64.5% |
| Copper (material recycling) | 5% | 2.5% |
| Aluminum (material recycling) | 4% | 3% |
| Plastic (material recycling) | 18% | 9% |
| Glass | 0.5% | |
| Silver (material recycling) | 0.012% | |
| Gold (material recycling) | 0.001% | |
| Palladium (material recycling) | 0.0005% | |
| Other metals (material recycling) | 10% | |
| Other combustible materials (energy recovery) | 10% | 19% |
| Other non-recyclable or non-combustible materials (landfilling) | 13% | 1.5% |
| Total | 100% | 100% |
Disclaimer/Publisher’s Note: The statements, opinions and data contained in all publications are solely those of the individual author(s) and contributor(s) and not of MDPI and/or the editor(s). MDPI and/or the editor(s) disclaim responsibility for any injury to people or property resulting from any ideas, methods, instructions or products referred to in the content. |
© 2024 by the authors. Licensee MDPI, Basel, Switzerland. This article is an open access article distributed under the terms and conditions of the Creative Commons Attribution (CC BY) license (https://creativecommons.org/licenses/by/4.0/).
Share and Cite
Miliute-Plepiene, J.; Sundqvist, J.-O. Assessing the Potential Climate Impacts and Benefits of Waste Prevention and Management: A Case Study of Sweden. Sustainability 2024, 16, 3799. https://doi.org/10.3390/su16093799
Miliute-Plepiene J, Sundqvist J-O. Assessing the Potential Climate Impacts and Benefits of Waste Prevention and Management: A Case Study of Sweden. Sustainability. 2024; 16(9):3799. https://doi.org/10.3390/su16093799
Chicago/Turabian StyleMiliute-Plepiene, Jurate, and Jan-Olov Sundqvist. 2024. "Assessing the Potential Climate Impacts and Benefits of Waste Prevention and Management: A Case Study of Sweden" Sustainability 16, no. 9: 3799. https://doi.org/10.3390/su16093799