Article

Probabilistic Embodied Carbon Assessments for Alkali-Activated Concrete Materials

1
School of Sustainability, Civil and Environmental Engineering, University of Surrey, Guildford GU2 7XH, UK
2
Facultad de Ingeniería en Ciencias de la Tierra, Escuela Superior Politécnica del Litoral (ESPOL), Guayaquil 090506, Ecuador
3
Department of Civil Engineering, Xi’an Jiaotong-Liverpool University, Suzhou 215123, China
*
Author to whom correspondence should be addressed.
Sustainability 2025, 17(1), 152; https://doi.org/10.3390/su17010152
Submission received: 1 December 2024 / Revised: 23 December 2024 / Accepted: 26 December 2024 / Published: 28 December 2024
(This article belongs to the Special Issue Advances in Green and Sustainable Construction Materials)

Abstract

:
This study evaluates the environmental impact of alkali-activated concrete materials (AACMs) as alternatives to conventional concrete. The influence of binder and activator content and type, along with other mix parameters, is analysed using a probabilistic embodied carbon assessment on a large dataset that includes 580 mixes. Using a cradle-to-gate approach with region-specific life-cycle inventory data, emissions are analysed against binder intensity, activator-to-binder and water-to-binder ratios, and fresh/mechanical properties. A multicriteria assessment quantifies the best-performing mix in terms of embodied carbon, compressive strength, and slump. AACM environmental impact is compared to conventional concrete through existing classification schemes and literature. AACM emissions vary between 41 and 261 kgCO2eq/m3, with activators contributing the most (3–198 kgCO2eq/m3). Uncertainty in transport-related emissions could shift these values by ±38%. AACMs can achieve up to four-fold less emissions for high-strength materials compared to conventional concrete, although this benefit decreases with lower mechanical properties. AACM environmental sustainability depends on activator characteristics, curing, mix design, and transportation.

1. Introduction

The annual global cement output has increased from 1.0 billion tonnes to around 1.7 billion tonnes in recent years [1,2]. The sector has been under pressure to mitigate its environmental consequences, notably in terms of CO2 emissions, considering that 7% of total global CO2 emissions are attributed to cement [3]. The calcination of limestone and the energy needed for high-temperature kiln operations for cement manufacturing are the main contributors to these high CO2 emissions. Cement manufacturing also contributes to the depletion of natural resources like limestone and clay, and also is responsible for substantial energy consumption during this process [4]. Moreover, the extraction of natural aggregates for concrete production can trigger soil erosion or the degradation of ecosystems [5]. Additionally, the discharge of sludge and wastewater from a concrete batching plant has been reported to cause harmful effects on aquatic environments [6,7].
As a result of these matters, the concrete sector has converted its attention to more ecologically friendly practices such as recycling and employing eco-friendly constituents in concrete [8,9,10]. These techniques not only seek to mitigate the environmental impact of concrete but also to link the industry with wider sustainability aims. Research in this field has focused largely on the impact of greenhouse gas (GHG) emissions on global warming [11,12], but other environmental impact factors such as acidification, ozone layer depletion, and eutrophication have also been considered [13]. Considering that cement production is the highest contributor to GHG emissions in the industry, one sustainable direction to minimise environmental impact involves the utilisation of alternative binders.
Conventional concrete mixes use Ordinary Portland Cement (OPC)/Cement Type I (CEM I), which can be adjusted according to the design mix and water–cement ratio to meet specific structural needs and environmental conditions. Eco-friendly alternatives like alternative binders partially replace OPC/CEM I and include options such as limestone, fly ash (FA), ground granulated blast furnace slag (GGBS), and metakaolin (MK), among others [14]. In combination with clinker, these constituents are adopted in British and European standards as CEM II, III, IV, and V cements. These cements directly contribute to minimising the environmental impact of CEM I.
Alternative binders are also used for alkali-activated concrete materials (AACMs) as a full substitution of OPC/CEM I. AAMCs require an alkali solution, such as sodium hydroxide, to activate the mix [15,16].
Sodium or potassium hydroxides and silicates are commonly used as alkaline solutions, while aluminosilicates can be sourced from various industrial by-products [17]. AACMs find applications across multiple industries. By utilising industrial waste such as metallurgical slags, fly ashes, bauxite residues, and construction and demolition wastes, AACMs production offers significant environmental benefits [18,19]. This process transforms waste into value-added products and decreases the dependence of the construction sector on virgin raw materials, thus reducing its environmental footprint [20].
Alkali-activated slag concrete can reduce CO2 emissions by approximately 7% compared to Ordinary Portland Cement (OPC) or CEM I concrete [21]. Geopolymers, a subset of AACMs made from red ceramic waste and rice husk ash, achieve high compressive strength without commercial sodium silicate or high-temperature curing [22]. Using volcanic ash and other aluminosilicate materials activated by NaOH, LiOH, or KOH forms dense silica–aluminate gels, enhancing mechanical properties and sustainability [23]. Recycled glass and calcium aluminate cement in AACMs improve residual strength and dimensional stability after high-temperature exposure [24].
Environmental assessments quantify emissions across Environmental Impact (EI) categories [25]. In construction, Global Warming Potential (GWP) is widely used, measuring greenhouse gas (GHG) effects in CO2 equivalents (CO2eq) [26]. Carbon emissions in the built environment are classified as embodied and operational carbon [27]. Embodied carbon accounts for GHG emissions from material extraction to decommissioning, while operational carbon pertains to emissions during use [28]. Life Cycle Assessments (LCA) evaluate environmental impacts across stages and multiple indicators, although simplified LCA often focuses solely on embodied carbon, a key metric in construction. Multicriteria assessments that integrate compressive strength, carbon emissions, and cost enable comprehensive evaluation of concrete performance [29].
Data are scarce regarding the quantitative assessment of CO2 emissions for AACMs. Whilst alternative binders are typically considered wastes with very low CO2 contributions [1,30], alkali activators could exhibit high CO2 emissions due to the presence of activators [31,32]. The reduction in CO2 in AACMs is heavily influenced by several factors, including the type, concentration, and amount of alkali activators utilised, the curing conditions, and the constituent proportions [33,34,35]. Environmental evaluation studies of AACM exist, but they are carried out on a single set of mixes, and the results cannot be generalised as these strongly depend on system boundaries and regional characteristics [36,37,38]. An in-depth analysis over a wider dataset would confirm the sustainability of AACMs with respect to their fresh and mechanical properties, particularly since AACMs with similar constituents have significant variations in embodied carbon and properties.
This paper evaluates the embodied carbon of AACMs using an extensive database of 580 mix designs and fresh and mechanical properties. To include potential variations in emissions attributed to transportation between manufacturing to the ready-mix concrete plant, a probabilistic approach is considered. The environmental, strength, and workability parameters are then combined in a multicriteria assessment. Finally, the results of the dataset are placed within the wider-context classification of low-carbon concrete using industry-relevant benchmarking.

2. Methodology

Life Cycle Assessment (LCA) evaluates environmental impacts across a product’s life cycle, encompassing production, transportation, and disposal [12]. Standardised under EN 15978 [39], LCA is used to assess the embodied carbon of concrete, including AACMs [40]. By analysing each life cycle stage, LCA identifies opportunities for environmental improvements in products or processes [41,42]. The goals, scope, and system boundaries of an LCA vary depending on the concrete life cycle stage under consideration [43]. Among Environmental Impact (EI) categories, Global Warming Potential (GWP) is most relevant in construction, accounting for over 95% of impacts, with other EI categories contributing less than 5% [32]. GWP quantifies the climate effects of greenhouse gases (GHGs) in CO2 equivalents (CO2eq) [44].
In this paper, the methodology was designed to evaluate the embodied carbon of 580 AACM mixes, and the relationship between embodied carbon and main engineering properties (Figure 1). To enable reliable estimates, a large database was collected. The data collection and conversion procedures as well as the main parameters are first described. Then, after describing the system boundaries, functional unit, life-cycle inventory, and simplified embodied carbon assessments are carried out. To allow for a unified view of the best-performing AACM configurations, a multicriteria assessment was undertaken.

2.1. Data Collection

The collection and classification of data relevant to the production process and the corresponding environmental inputs and outputs of these processes are the foundation of establishing a reliable environmental impact assessment. This was achieved by collecting data from multiple platforms or from publicly available sources to obtain appropriate mix design tables as it was one of the main criteria of those sources. Data were collected from ScienceDirect and Scopus using keywords such as alkali, activated, geopolymer, mechanical, one-part, and two-part, resulting to a total of 171 documents. Papers that provided full data on mix designs and at least one compressive strength were selected to a corelation between the mix parameters, embodied carbon, and compressive strength can be made. Where available, the workability parameters as well as other mechanical properties were considered. The database details are shown in Figure 2.

2.2. Database Characteristics

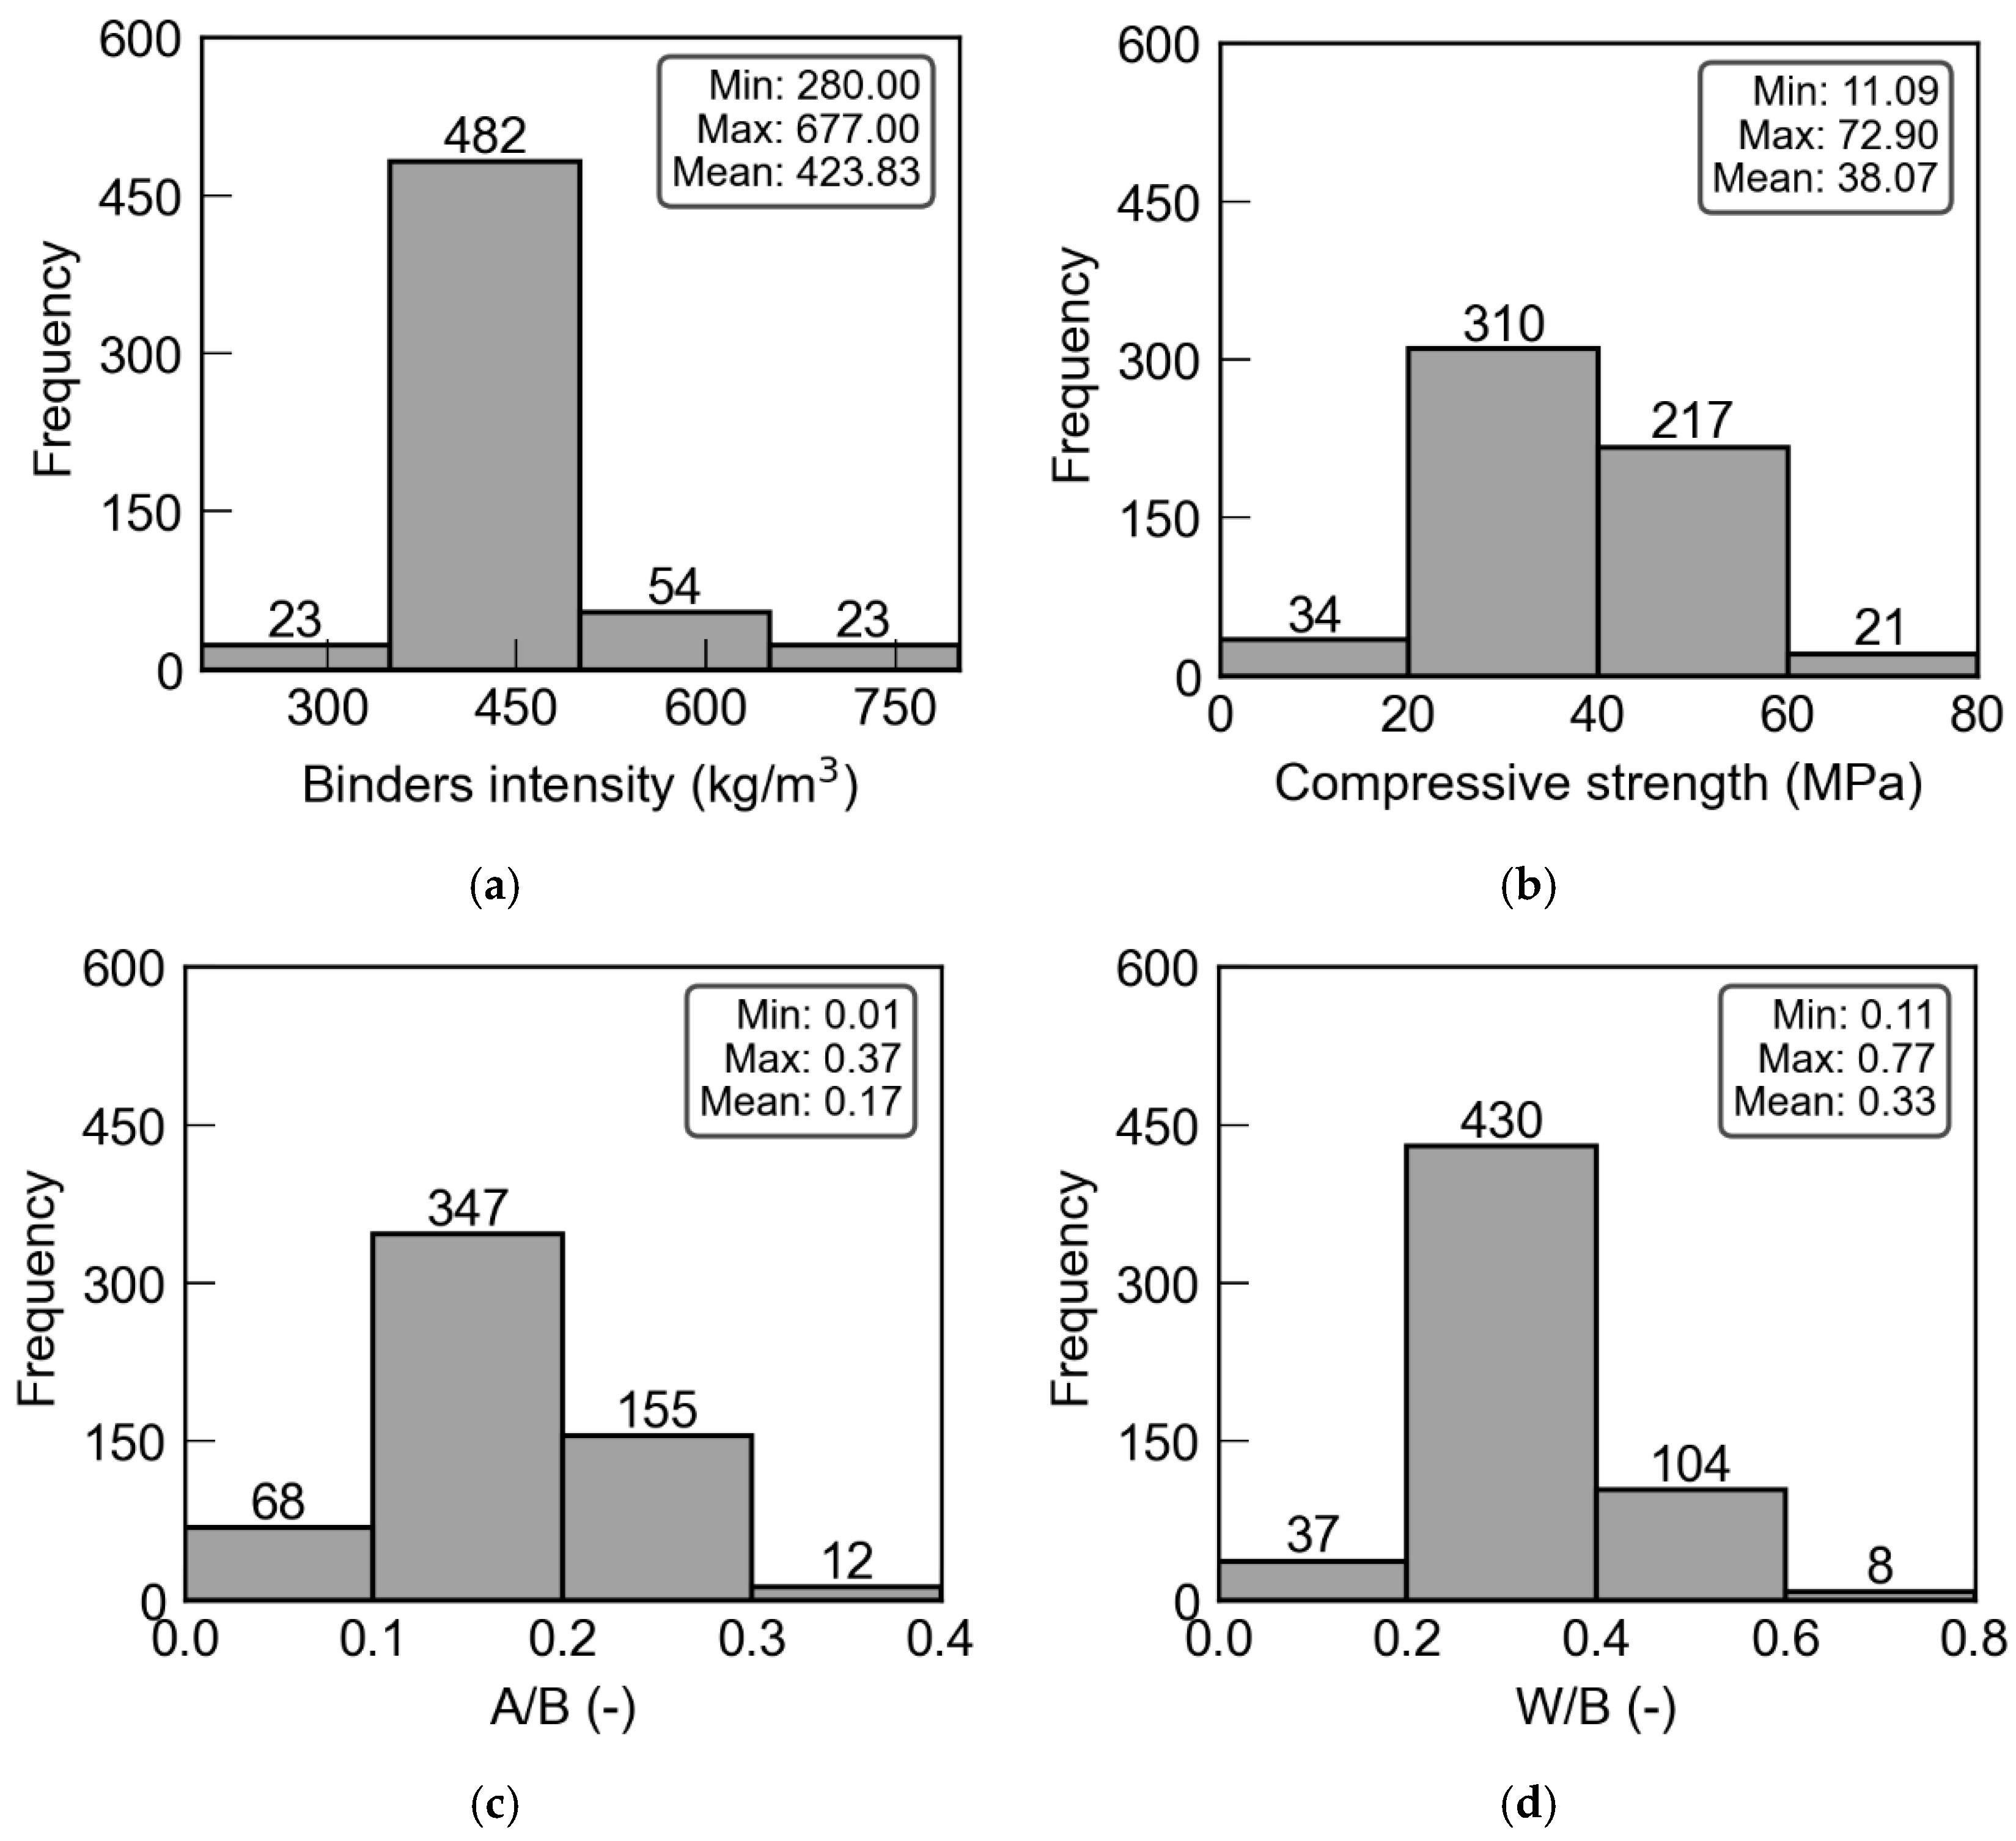
A total of 580 one-part and two-part AACM mixes were collected for this study [16,45,46,47,48,49,50,51,52,53,54,55,56,57,58,59,60,61,62,63,64,65,66,67,68,69,70,71,72,73,74,75,76,77,78,79,80,81,82,83,84,85,86]. The mixes had Ca(OH)2, Na2SiO3, and NaOH as the activators, and kg/m3 was the chosen unit for all the materials’ quantities. AACMs had various mix ratios. The histograms shown in Figure 2 illustrate the relationship between the materials employed in this study. Figure 2a,b represent the frequency of materials and number of mix designs vs. binder intensity (total of binders) and a number of mixes and compressive strength, respectively. Figure 2c,d illustrate the correlation between a number of mix designs and the activator-to-binder (A/B) ratio and the water-to-binder (W/B) ratio, respectively. It is worth noting that for two-part mixes, the activator content refers to the solid part of the solution, and the water from the solution was attributed to the water content. This is to enable a comparative assessment of environmental impact for both one- and two-part systems together, although the activation mechanisms could differ. Full details on the relationship between mix parameters and AACM properties are available in the literature [84].
The AACMs mixing procedure was the same for the mixes selected in this database and depended on whether this was a one-part or a two-part system. For one-part systems, first binders, fine aggregates, and coarse aggregates were added and mixed, followed by water that was continuously added. The alkaline activators were mixed and then added to the mixture, and the mixing process continued before the fresh concrete was poured into multiple moulds. For the two-part systems, the activator solution was added to the mix after all dry components were pre-mixed together. Full details on mixing procedures are available in the literature [87]. After mixing, the moulds with fresh concrete were then placed on a vibration table to eliminate entrapped air bubbles. Typically, plastic covers were then placed on the moulds to reduce evaporation, and the specimens were typically demoulded after 24 h and cured. Most of the investigations performed the slump test of the fresh concrete. Compressive strength tests were carried out on cubic samples (100 mm or 150 mm), or cylinders of ϕ100 × 200 or ϕ150 × 300 (where ϕ is the diameter), at 28 days and at various times from casting. Where necessary, the strength was converted from cubic to cylinder strength using a scalar parameter given by Eurocode 2 [88]. For the assessments in this paper, the cylinder concrete strength at 28 days is considered. In all situations, ambient temperature curing was considered (25 ± 5)° and relative humidity was stipulated in the standards.
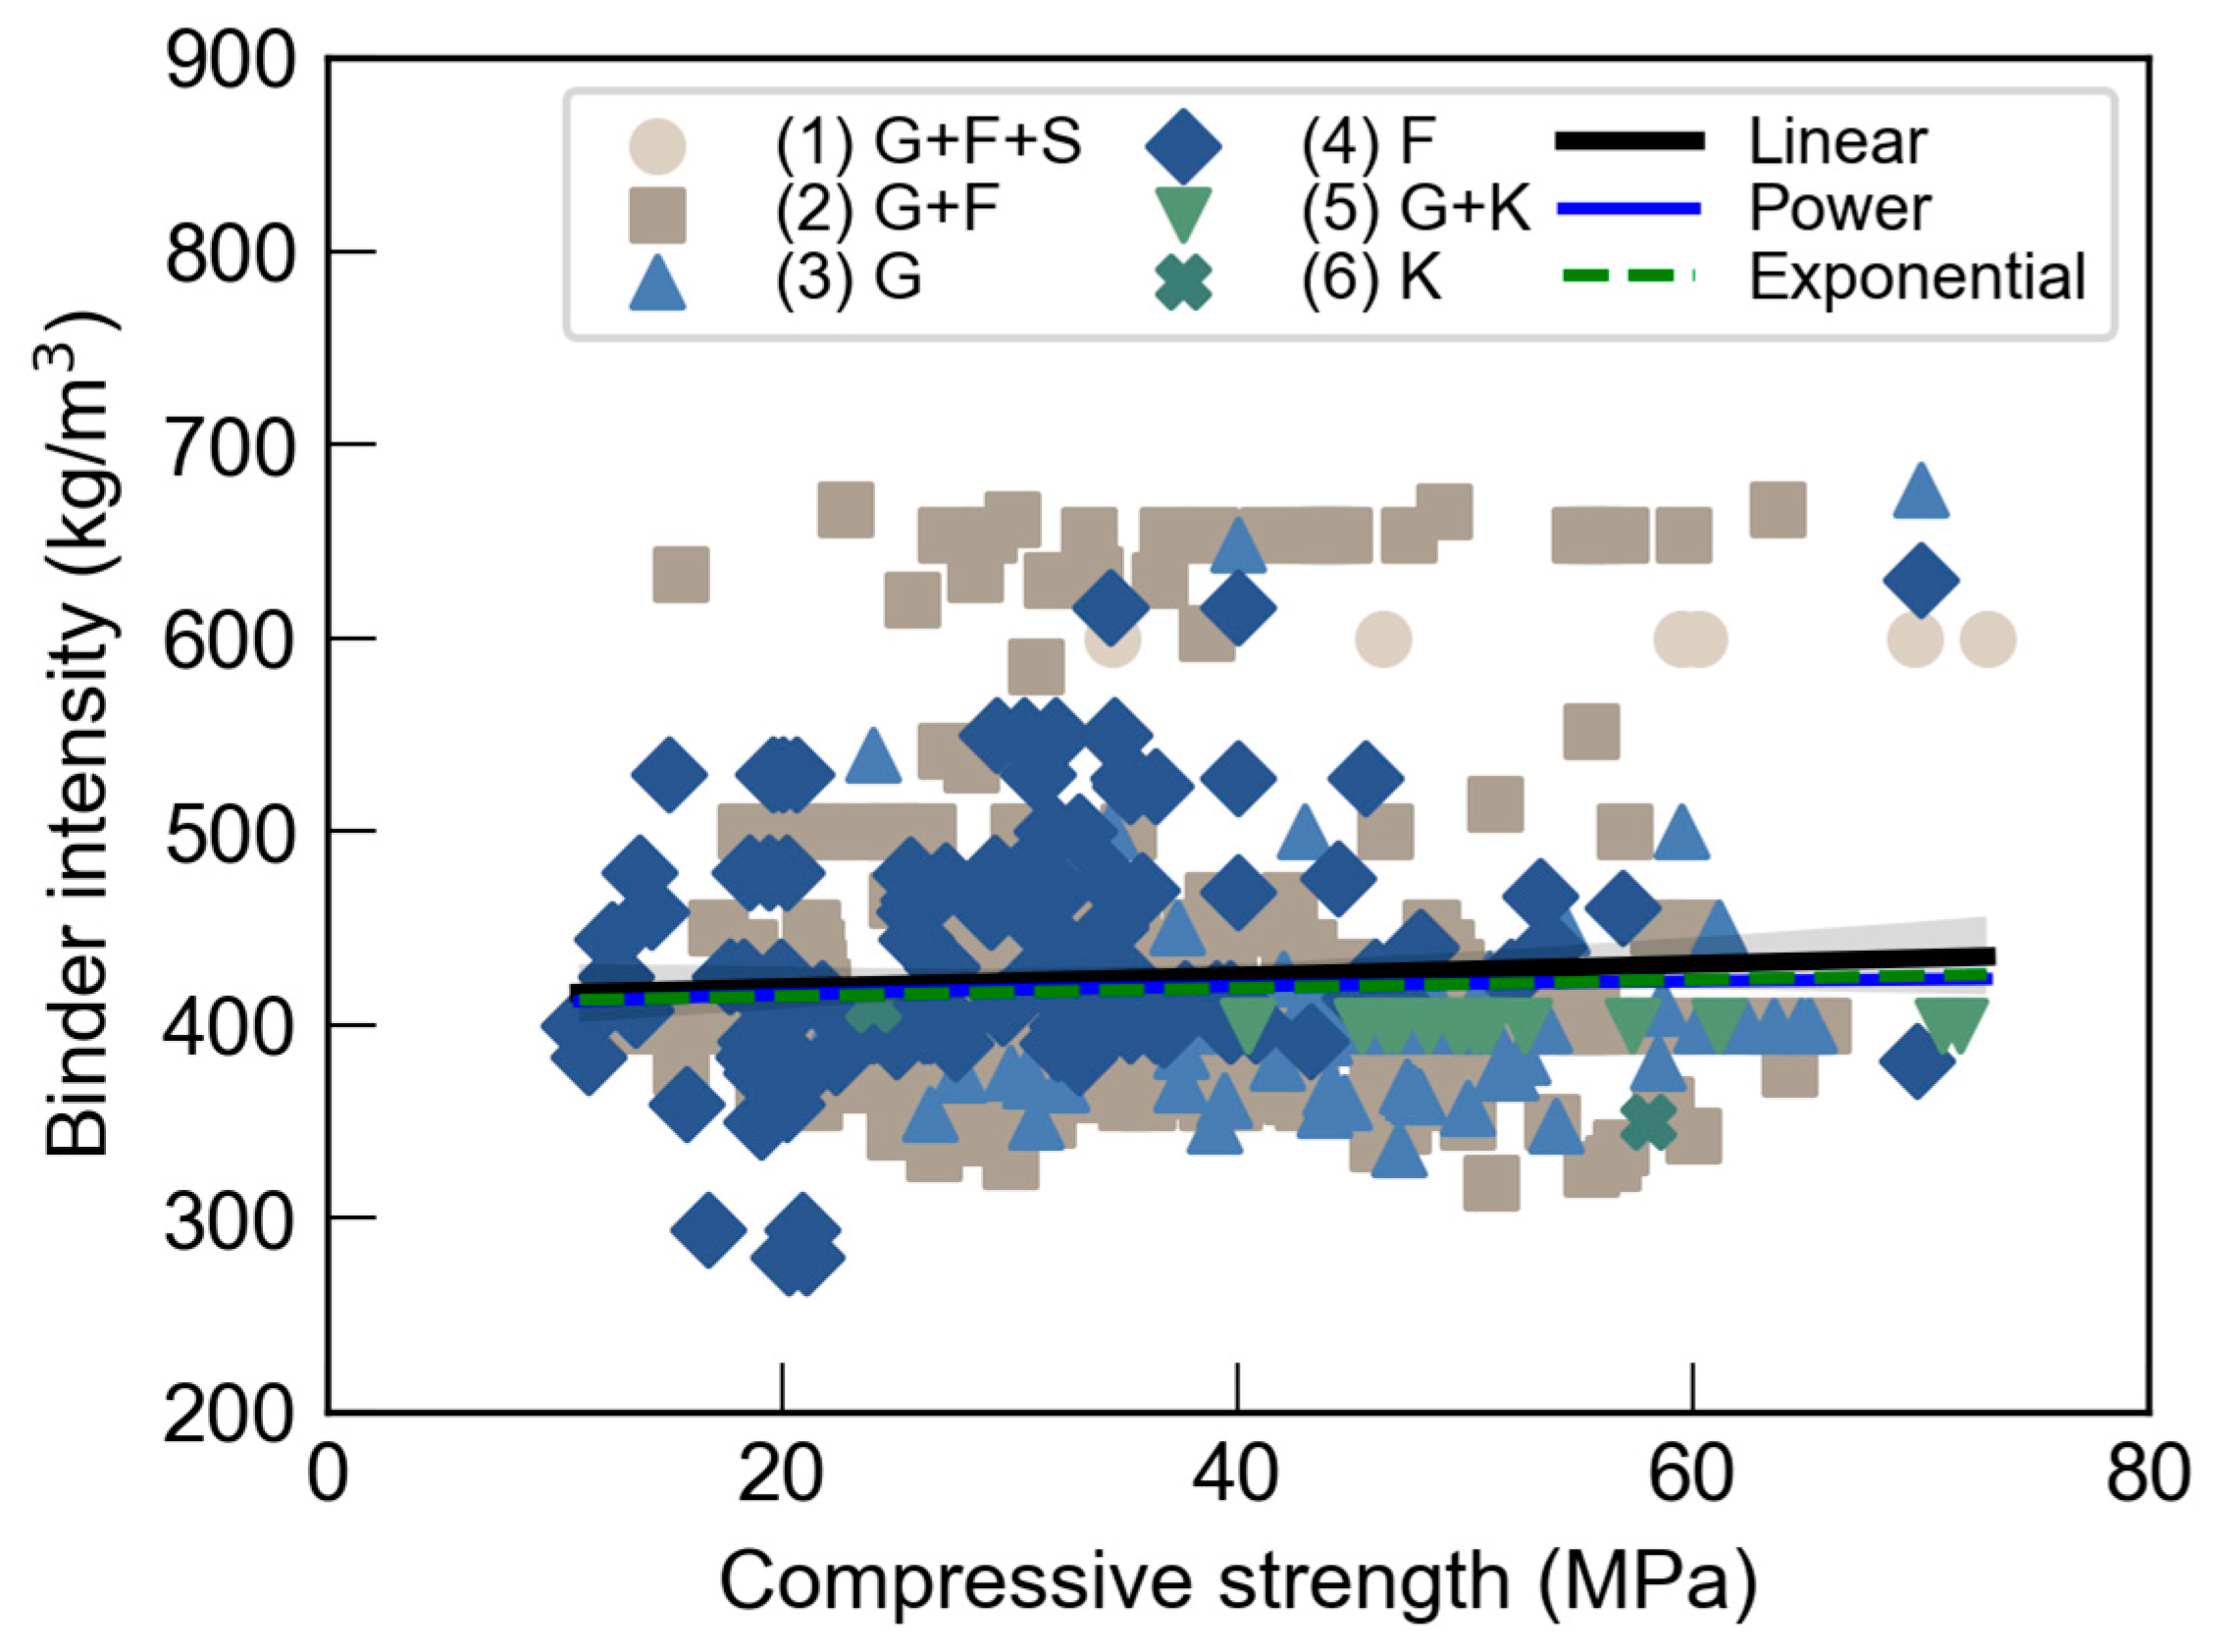
Figure 3 shows the relationship between binder intensity and compressive strength in AACMs, obtained from the collated database. The binder intensity refers to the amount of binder used in mixes, such as FA, GGBS, microsilica, and metakaolin, or their combinations. In the legend of the figure, G is for GGBS, F is for FA, S for microsilica, and K for metakaolin. It is shown that an increase in binder intensity leads to a slight increase in compressive strength, although at a very small slope. This is largely expected, as the compressive strength in AACMs is heavily influenced by the quality and quantity of the binders. When the binder content decreases, the matrix becomes more porous and penetrable, compromising the matrix integrity [89]. FA provides silica and alumina for the activation process, and, for example, lower FA concentrations limit the molecules available for reaction with alkaline substances, weakening AACM formation [90]. Additionally, insufficient binder volume can create brittleness and voids in the mix [91]. As commonly agreed, GGBS contributes to the mechanical and durability properties of AACM concrete, forming products that enhance strength when mixed with alkaline substances [28]. The binder intensity also affects curing process efficiency and may lead to suboptimal curing reactions, resulting in decreased strength. Full details on activation mechanisms and influence of various constituents to AACM properties are available in existing literature reviews [84,87] and are outside the scope of this paper. Regarding the linear regression line in Figure 3, although alternative regression models might provide a better fit, the significant scatter in the data could lead to trends that are inconsistent with the materials’ physical behaviour. For comparison, Figure 3 includes linear, exponential, and power fits. The results indicate negligible differences between the curves, with exponential and power fits closely approximated by a linear plot within the ranges considered.

2.3. Environmental Assessments

2.3.1. Procedures and Boundaries

The primary objective of the assessment in this paper was to evaluate the environmental impact associated with the production of AACM using a probabilistic approach that accounts for variation in transportation characteristics. The binders considered were FA, GGBS, microsilica, MK, and SG; the activators were calcium hydroxide (Ca(OH)2), sodium silicate (Na2SiO3), and sodium hydroxide (NaOH). The rest of the mix constituents included coarse aggregates (CA), fine aggregates (FA), water, and superplasticiser.
LCA encompasses all stages of a product system, from raw material procurement to final disposal, as defined by EN 15978 [39,92]. For the study in this paper, the system boundary included a ‘cradle to factory/ready-mix plant gate’ approach (modules A1–A3 in the EN 15978 [39]). This stage of the life-cycle material is typically used by the construction industry to evaluate various conceptual designs of future built assets. The emissions associated with the ready-mix plant to the construction site (to the gate) or beyond the gate to the end of life are not accounted for in this study; these are asset-specific and country-specific. These are not a material characteristic, thus out of the scope of this assessment.
A functional unit is a measurable performance of a product system under investigation that is used as a reference unit for the inputs of the system and outputs while conducting an environmental impact assessment [93]. The reference unit permits the comparison of various products or systems capable of performing the same function. Furthermore, the functional unit depends on the quantified functional utilisation or performance attributes of the product when integrated into the desired purpose. The functional unit considered in this assessment was 1 m3 of concrete (AACMs and OPC) (Figure 1) [94,95].

2.3.2. Inventory and Assessment

The inventory analysis is the second stage after defining the system boundary and the functional unit. This includes gathering and verifying the data, performing calculations, and assigning inputs and outputs. Life-cycle inventory analysis (LCI) entails gathering and characterising the amounts of resources such as energy and materials necessary, in addition to the generation of waste, flows, and emissions connected with the life cycle of a product. An LCI results in an inventory of environmental exchanges associated with a functional unit throughout a given product system. In the case of AACM constituents, this corresponds with the extraction of raw materials, transportation to the plant, and all processes associated with the production of the final material. As noted, FA and GGBS are considered industrial by-products and waste materials, and thus are assumed to have low environmental impact as the majority of emissions are attributed to the main material produced. The production of the main AAM constituents and associated embodied carbon factors are described below for reference only [96].
FA is generated in coal-fired plants. Pulverised coal ignites in the boiler, producing heat and molten residue that cools to form ash [97]. Bottom ash settles in the combustion chamber, while fly ash remains suspended and is removed by electrostatic precipitators or baghouses. The embodied carbon of fly ash is 0.004 kgCO2eq/kg [98]. Fly ash sinking spherical beads (SSB) are used in oil-well cement slurry and ultra-high-performance concrete. They are denser and finer than regular fly ash, with more amorphous stages [99]. The embodied carbon of GGBS is 0.0416 kgCO2eq/kg [98]. Silica fume, a by-product of elemental silicon or silicon alloy production, forms when high-purity quartz is reduced at 2000 °C, creating silicon dioxide vapour that condenses. Its embodied carbon is 0.028 kgCO2eq/kg [100]. MK primarily comes from treated kaolin or paper sludge and can also be produced by calcining lateritic soils. Its embodied carbon is 0.40 kgCO2eq/kg [101]. Aggregates are typically either extracted from riverbeds or through crushing from larger blocks. The embodied carbon associated with the production of 1 kg of coarse and fine aggregates is 0.01577 and 0.00747 kgCO2eq/kg [98], respectively.
Commercial sodium silicates (Na2SiO3) are white, spherical powders made by heating sodium carbonate (Na2CO3) with SiO2 at 1200 °C, and then dissolving the resulting glass in water to form Na2SiO3 solution. Its embodied carbon is 1.514 kgCO2eq/kg [102]. Sodium hydroxide (NaOH), produced through the energy-intensive chlor-alkali process, has an embodied carbon of 0.68 kgCO2eq/kg [103]. Ca(OH)2 has an embodied carbon of 0.76 kgCO2eq/kg [103]. Superplasticisers, made from naphthalene sulfonic acid or melamine and formaldehyde, have an embodied carbon of 2.388 kgCO2eq/kg [104]. The carbon factors that were used in this investigation are shown in Table 1.
The following step is the impact assessment, which offers quantitative data on how the examined products or processes affect the environment. Simplified LCA, typically adopted in construction practice, requires the multiplication of each material quantity by its respective carbon factor for the life cycle modules under consideration, i.e., A1–A3 (cradle to factory/ready-mix plant gate). The operation can be written following the representation shown in Equation (1).
E C A 13 = i = 1 n [ Q i E C F A 13 , i ]
ECA13 = total of embodied carbon for LCA modulus A1–A3 (kg CO2eq)
Qi = material quantity (kg)
ECFA13 = A1–A3 modulus embodied carbon factor for materials kgCO2eq/kg
In assessing the transportation-related uncertainty in the life cycle inventory (LCI) of materials such as cement, aggregates, fly ash (FA), and ground granulated blast furnace slag (GGBS), several factors must be accounted for. Transport distances, modes of transport, fuel type, and vehicle load optimisation introduce variability in emissions, which can influence the embodied carbon estimates [107]. Cement typically involves shorter transport distances, often limited to national production plants. For cement, the uncertainty is often around ±10–20% [108,109]. Aggregates often exhibit an uncertainty range of ±5–15%, as they are generally sourced locally due to their heavy and bulky nature, which minimises transport distances, thereby reducing the uncertainty in transportation emissions. Materials such as FA and GGBS exhibit a higher degree of uncertainty due to the variability in sourcing locations. FA, often transported from coal plants, may involve long-distance transport via road or rail, resulting in a broader uncertainty range. Similarly, GGBS, a by-product of steel production, may be imported, significantly increasing the variability in transport distances and modes. For these two materials, the variability ranges are between ±15 and 30% [110]. The transportation of other constituents like silica, kaolin, activators, and plasticisers may also involve specialised sourcing, adding further uncertainty in the range of ±10–30% from the mean. In this paper, uncertainty ranges in LCI calculations for these materials are estimated to be in the range of ±10–30%, depending on factors such as local sourcing or reliance on imported materials. Local sourcing generally results in a lower degree of uncertainty, while imported materials, particularly when transported over long distances, exhibit a much wider range.
Monte Carlo simulations were applied in this paper to quantify the uncertainty arising from transportation-related variables [111]. By incorporating the upper bound value variability to reflect changes in transport distance, transport mode, fuel efficiency, and vehicle load factors, a distribution of possible outcomes was generated, allowing for a more robust assessment of these impacts. Confidence intervals were then calculated to capture the range of potential emissions, with specific focus on how these parameters influence the embodied carbon results.

2.3.3. Multicriteria Evaluation

To enhance this stage of the assessment, a multicriteria evaluation was carried out to get a quantitative representation of the most effective performing mixes. To achieve this objective, a multicriteria decision-making technique was used, with multiple experimental parameters given equal weighting. The slump test, compressive strength at 28 days, and embodied carbon (EC) were chosen as indicators of workability, mechanical performance, and environmental impact. This investigation completed the evaluation by first dividing the chosen indicators into beneficiary and non-beneficiary categories. EC was a non-beneficiary indicator, whereas both the compressive strength and slump fall under the beneficiary category. Second, a normalised matrix was formed for both the non-beneficiary and beneficiary parameters. Third, the following step was the weighting. To aggregate criteria with numerical data of different units and measures, these were normalised based on the criteria type [112]. For beneficial criteria, the performance value (e.g., compressive strength) was divided by the maximum value of the dataset, while for non-beneficial criteria, the minimum value of the dataset was divided by the performance value (e.g., embodied carbon). Each normalised sub-unitary factor was then multiplied by a weighting factor of 1/3, meaning that all parameters were given equal weighting.

3. Assessment Results

3.1. Embodied Carbon and Mix Constituents

Figure 4 shows the influence of various AACMs on the mean embodied carbon emissions with the variation of binder intensity (total quantity of binders). Close inspection on the dataset results indicate that GGBS-only mixes had an average median embodied carbon of 113 kgCO2eq/m3, FA-only mixes an average of 130 kgCO2eq/m3, GGBS+FA mixes an average of 136 kgCO2eq/m3, whilst the other groups of mixed binders an average of 192 kgCO2eq/m3. A comparatively higher embodied carbon for GGBS versus FA-only or mixed GGBS-FA is due to a higher attributed carbon factors for the former constituent. The highest embodied carbon values were for a mix with MK. Regarding activator content, although not directly plotted, the mixes with Na2SiO3 + NaOH had an average mean embodied carbon of 139 kgCO2eq/m3. These mixes were 516 of the complete datasets. Mixes with NaOH or Na2SiO3 alone had lower average mean embodied carbon of 58 and 122 kgCO2eq/m3, respectively, although consisting of a much smaller number of data points from the complete dataset.
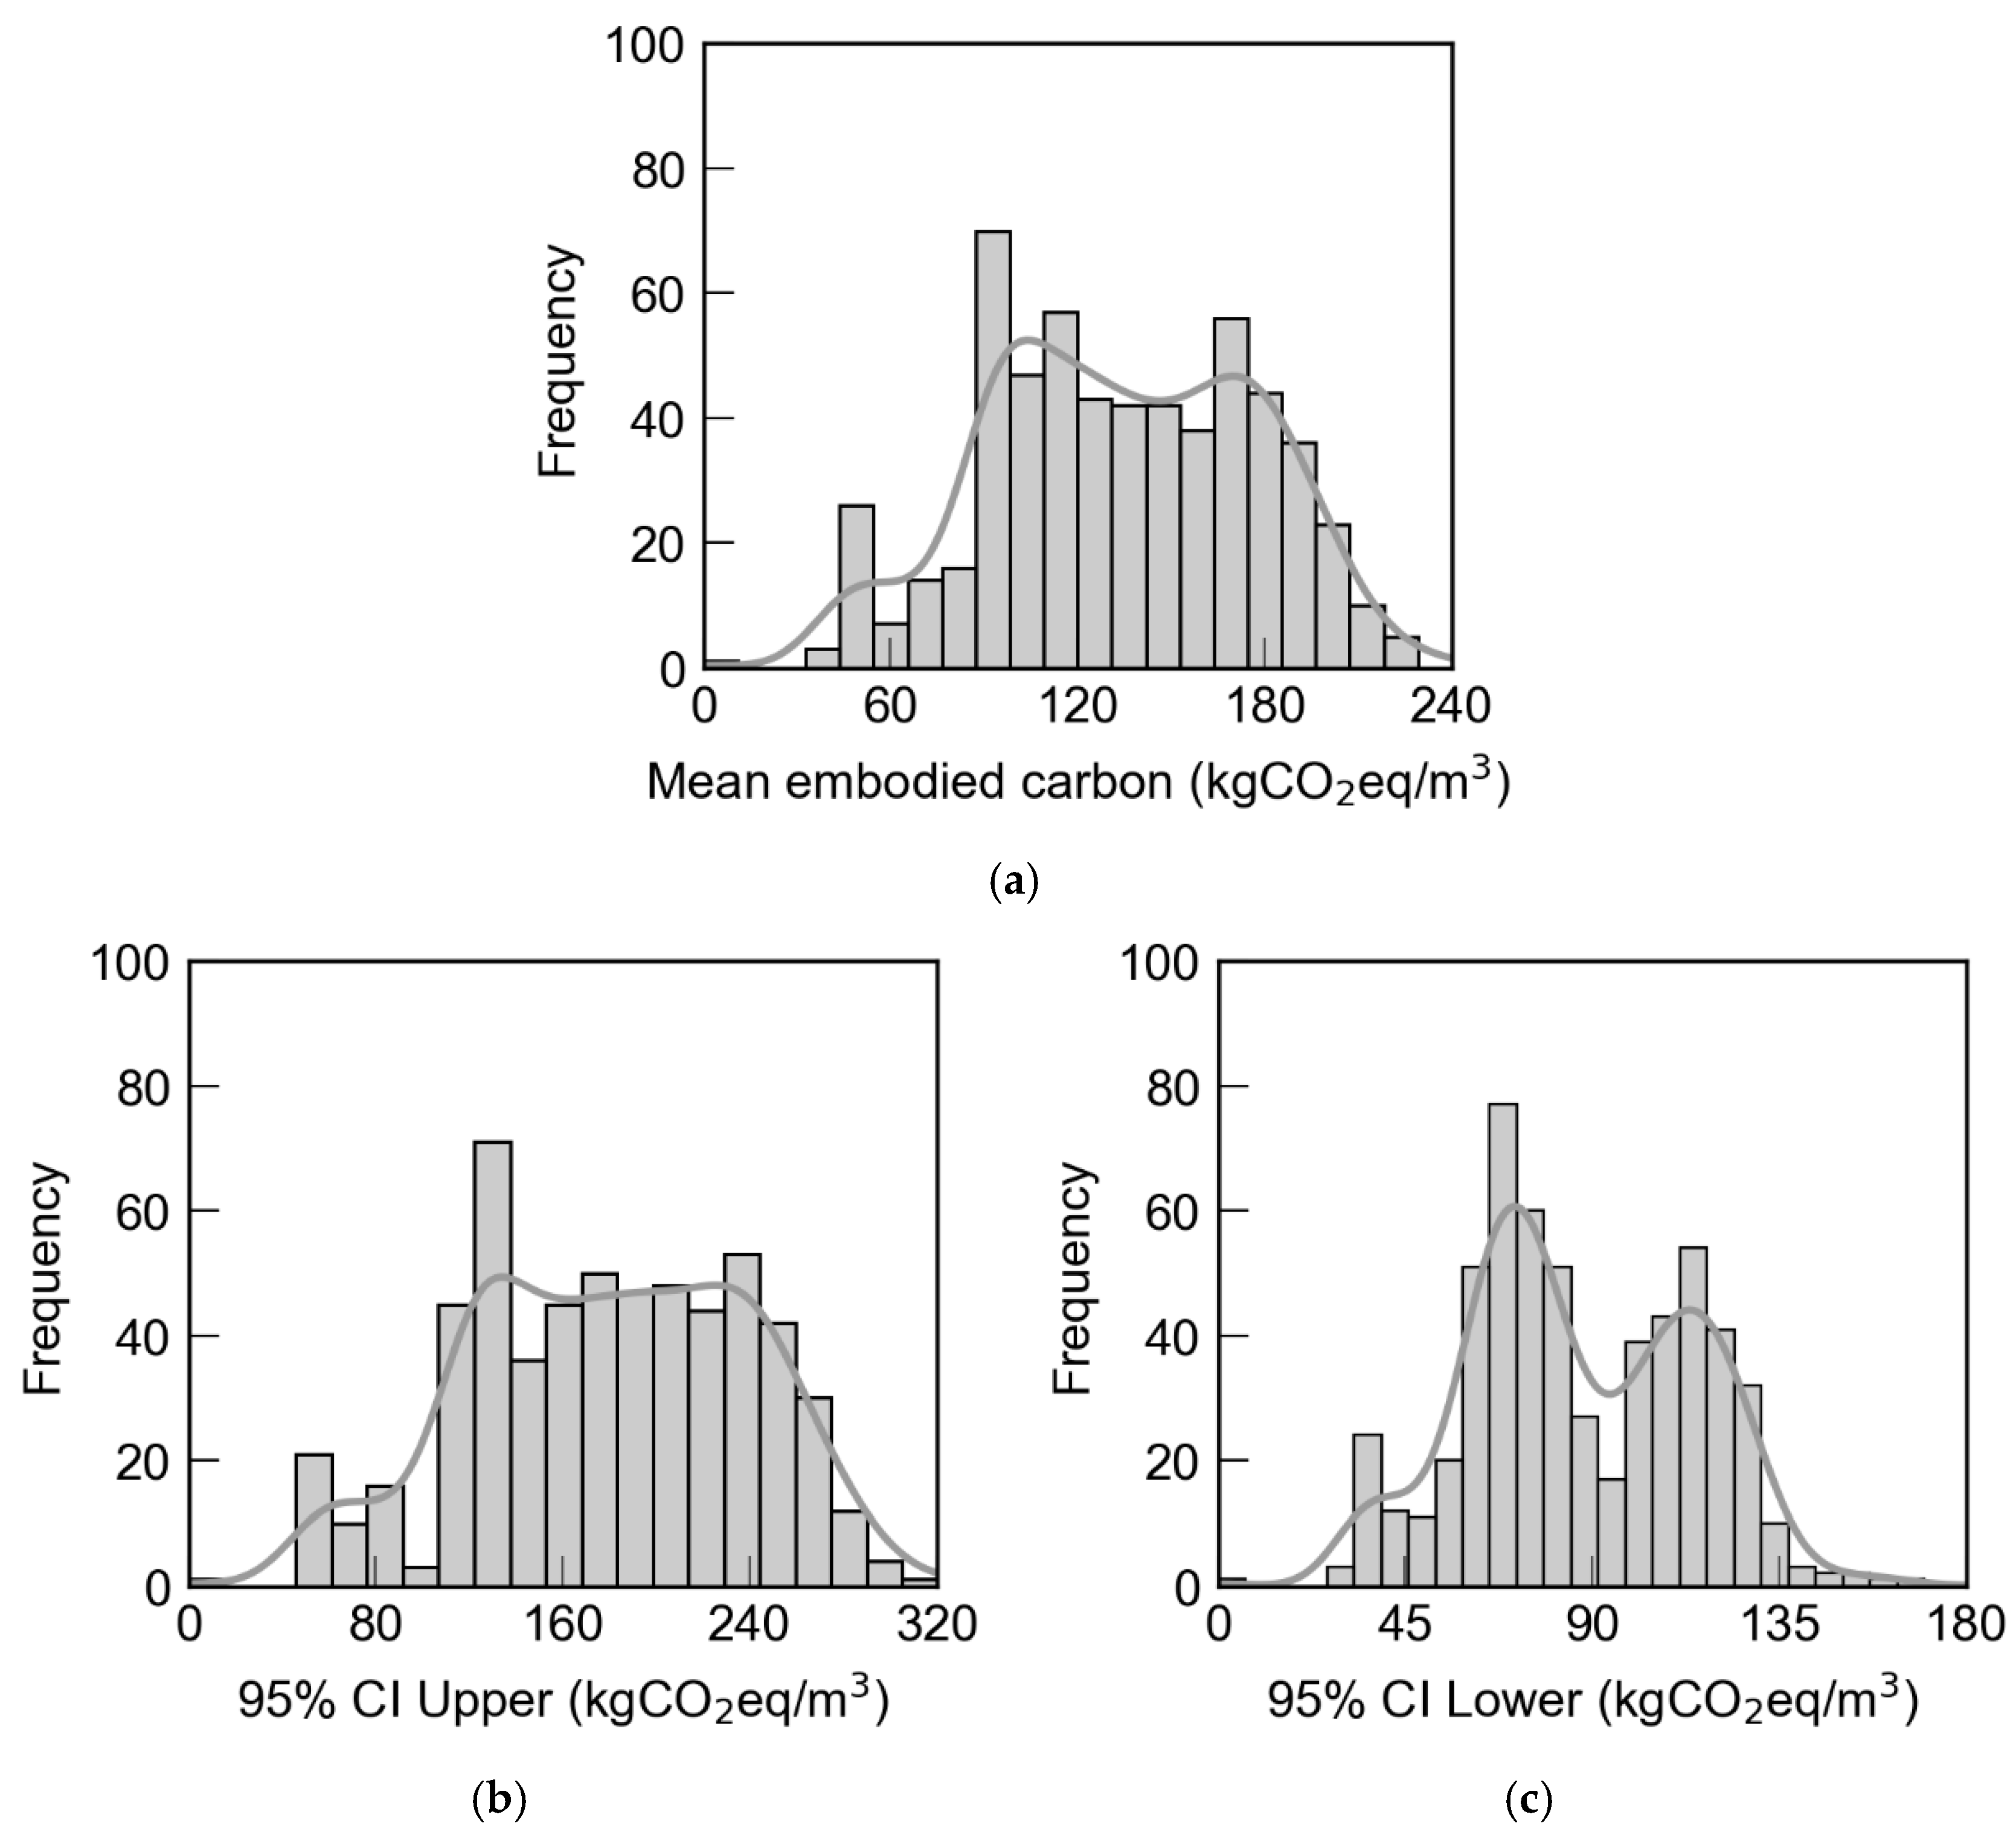
The three histograms shown in Figure 5a depict the results of the probabilistic embodied carbon assessment for the mixes in the AACM database. The histogram in Figure 5a shows the distribution of mean embodied carbon values (kgCO2eq/m3). The data are roughly normally distributed around a mean value of approximately 120 kgCO2eq/m3, indicating a central tendency with variations extending from near 0 to about 240 kgCO2eq/m3. This suggests a significant variation in embodied carbon values across different samples or conditions assessed. The second histogram in Figure 5b represents the upper 95% confidence interval (CI) limits of the embodied carbon estimates. This distribution is also approximately normal but shifted towards higher values, ranging from about 80 kgCO2eq/m3 to slightly over 320 kgCO2eq/m3, with a peak around 160 kgCO2eq/m3. The wider spread in this histogram compared to the mean indicates greater uncertainty in the upper range of the estimates, suggesting that factors influencing the higher end of embodied carbon calculations are more variable or less consistently estimated. The third histogram in Figure 5c depicts the lower 95% confidence interval limits of the embodied carbon assessments. The distribution of these values is narrower and more centrally located than the upper limits, with values predominantly ranging from 0 to approximately 180 kgCO2eq/m3 and peaking around 90 kgCO2eq/m3. A direct comparison between the three histograms indicate embodied carbon estimates vary with uncertainty in modelling, and the nominal values increase with increase in uncertainty.
To validate the work in this paper, which showed the AACMs have 41–261 kgCO2eq/m3, various ranges available in the literature were added for comparative purposes. For example, for a 24 MPa compressive strength GGBS-based AACM, the embodied carbon was 110 kgCO2eq/m3, and for a FA-based AACM, the embodied carbon was 160 kgCO2eq/m3. These carbon emissions increased by 11.9% and 13.1% for a 40 MPa, for a corresponding 40 MPa AACM [86]. FA-based AACM had 269 and 320 kg CO2eq/m3 for around 40 MPa compressive strength [113,114]. Values as low as 93 kgCO2eq/m3 for a 35 MPa material for slag-based AACM were also reported [115]. Slag-based AACMs seem to be more favourable, as they tend to have a comparatively lower embodied carbon footprint than FA-based counterparts, and they can achieve 85% of the compressive strength for ACC at 28 days after 1 day of curing [116,117].
For AACMs, the allocation of embodied carbon for the entire dataset amidst the various constituents of the mixture is predominantly governed by the activator, followed by the admixtures, aggregates, binders, and finally water, as illustrated in Figure 6 through a box-and-whisker plot. The box shows the interquartile range (IQR), encompassing the middle 50% of the data, with a horizontal line indicating the median. The whiskers extend to the minimum and maximum values within 1.5 × IQR, excluding outliers. The mean is displayed as black circles, while the median is represented as grey diamonds. Because of the energy-intensive chemical procedures required in its synthesis, the activator, which is often a high-pH substance such as Na2SiO3 or NaOH, has a significant amount of embodied carbon [118]. While superplasticisers are utilised in relatively small quantities, they significantly contribute to the embodied carbon owing to their synthetic nature and the energy consumed during their manufacturing process [114]. Aggregates, which generally undergo minimal processing and entail low transportation energy, make a relatively smaller contribution to the overall embodied carbon, although visible due to the high amount of the material (70–80%) needed in a cubic metre. The binders, on the contrary, which frequently are classified as wastes, have minor contribution to the total emissions [119]. As for water, being the least processed constituent, it exhibits the least impact on embodied carbon. Regarding specific values for the main constituents, the embodied carbon in kgCO2eq/m3 varied between 35.2 and 48.0 for Ca(OH)2, 3.8 and 177.9 for Na2SiO3, 2.0 and 72.1 for NaOH, 1.4 and 28.2 for GGBS, 0.1 and 2.5 for FA, 2.4 and 59.7 for admixtures, 9.6 and 20.6 for coarse aggregates, 3.2 and 6.7 for fine aggregates, and less than 0.1 for water. For the same constituents, the average values in kgCO2eq/m3 were 41.8 for Ca(OH)2, 75.5 for NA2SIO3, 16.7 NAOH, 8.5 for GGBS, 1.2 FA, 29.1 for admixtures, 17.2 for coarse aggregates, 5.0 for fine aggregates, and around 0.04 for water.
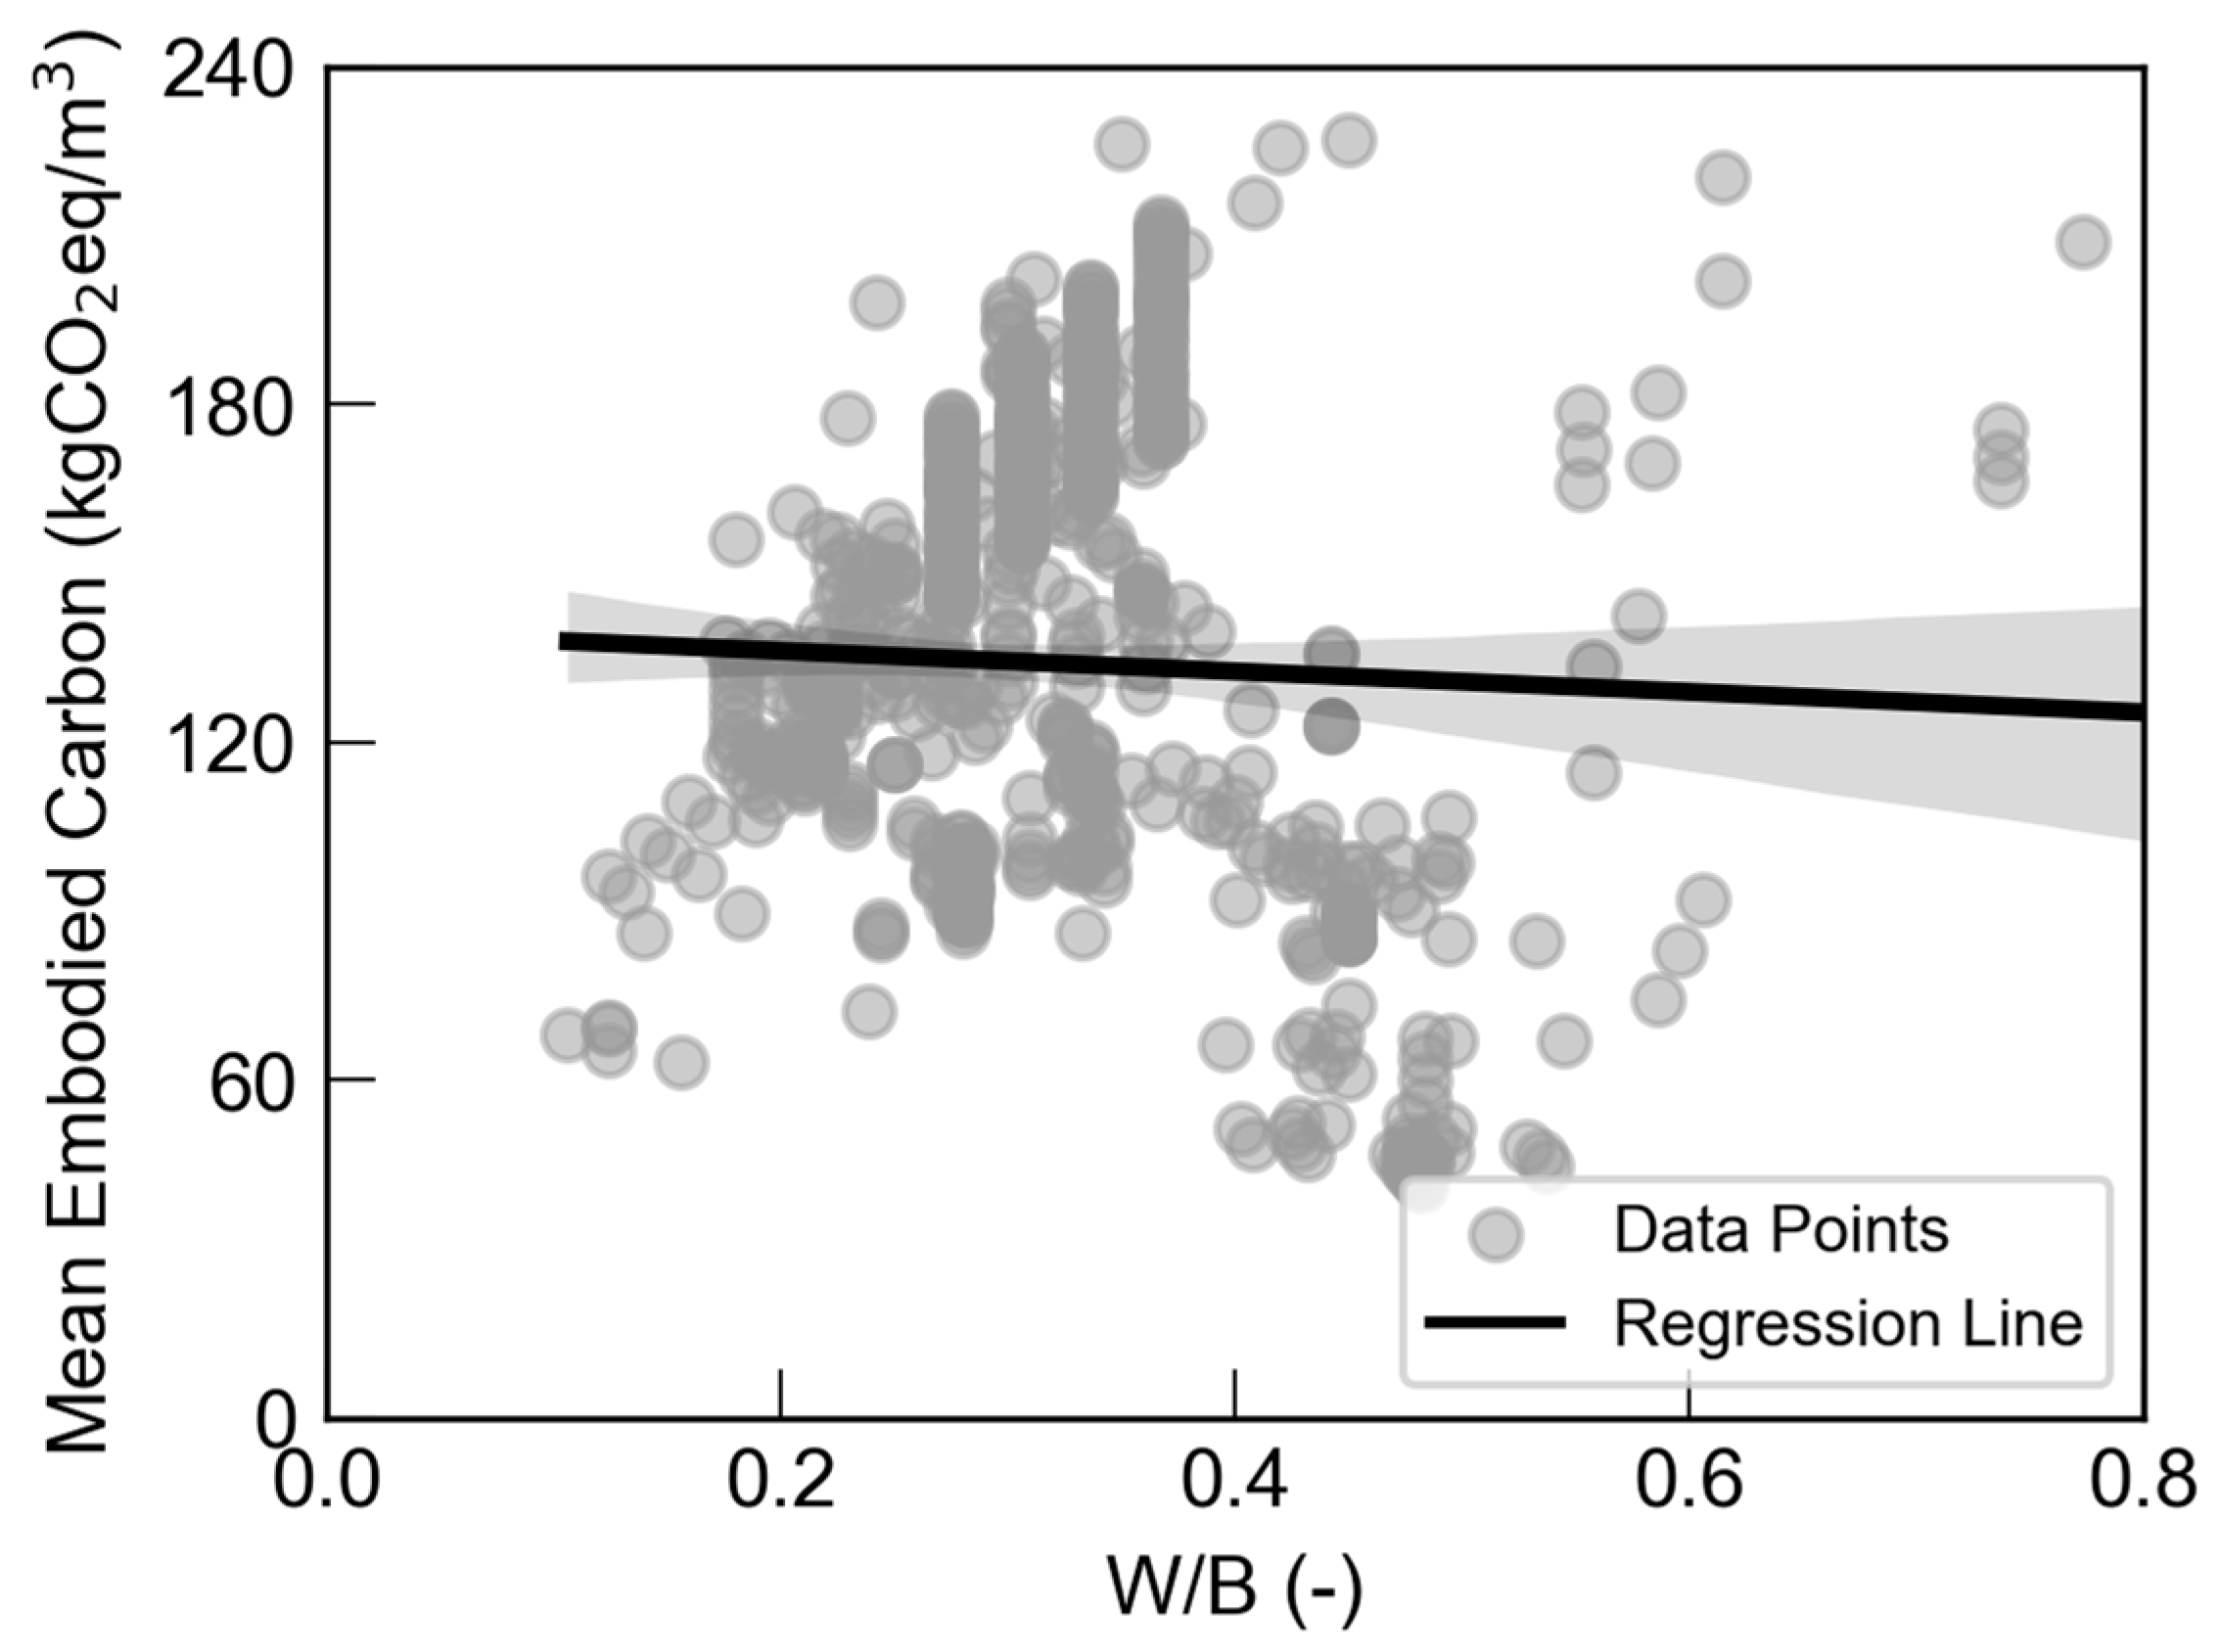
The activator-to-binder ratio (A/B) is a critical factor in AACM as it governs the alkali activation processes within the materials. As indicated in Figure 7, increasing the A/B ratio also increased the embodied carbon emissions. The reason behind the production and transportation processes of solid activators required high energy consumption [120]. To achieve maximum efficiency with no unintended environmental implications, the A/B ratio should be controlled. Although larger A/B ratios can improve specific characteristics, among them, early-age strength, they must be used with caution to prevent the reduction in their durability over time and enhance the total impact on the environment. Excessive amounts of activators, such as sodium silicate, could be detrimental to AACM durability, as the activator promotes the breakdown of high-modulus raw materials, leading to a less cohesive mixture. As illustrated in Figure 8, it shows that by increasing the W/B ratio, the overall trend indicates embodied carbon emissions decrease, although within a minor decline for the entire dataset. Within common W/B ranges (0.2–0.5), there is a largely constant trend in embodied carbon emissions with increase in W/B.

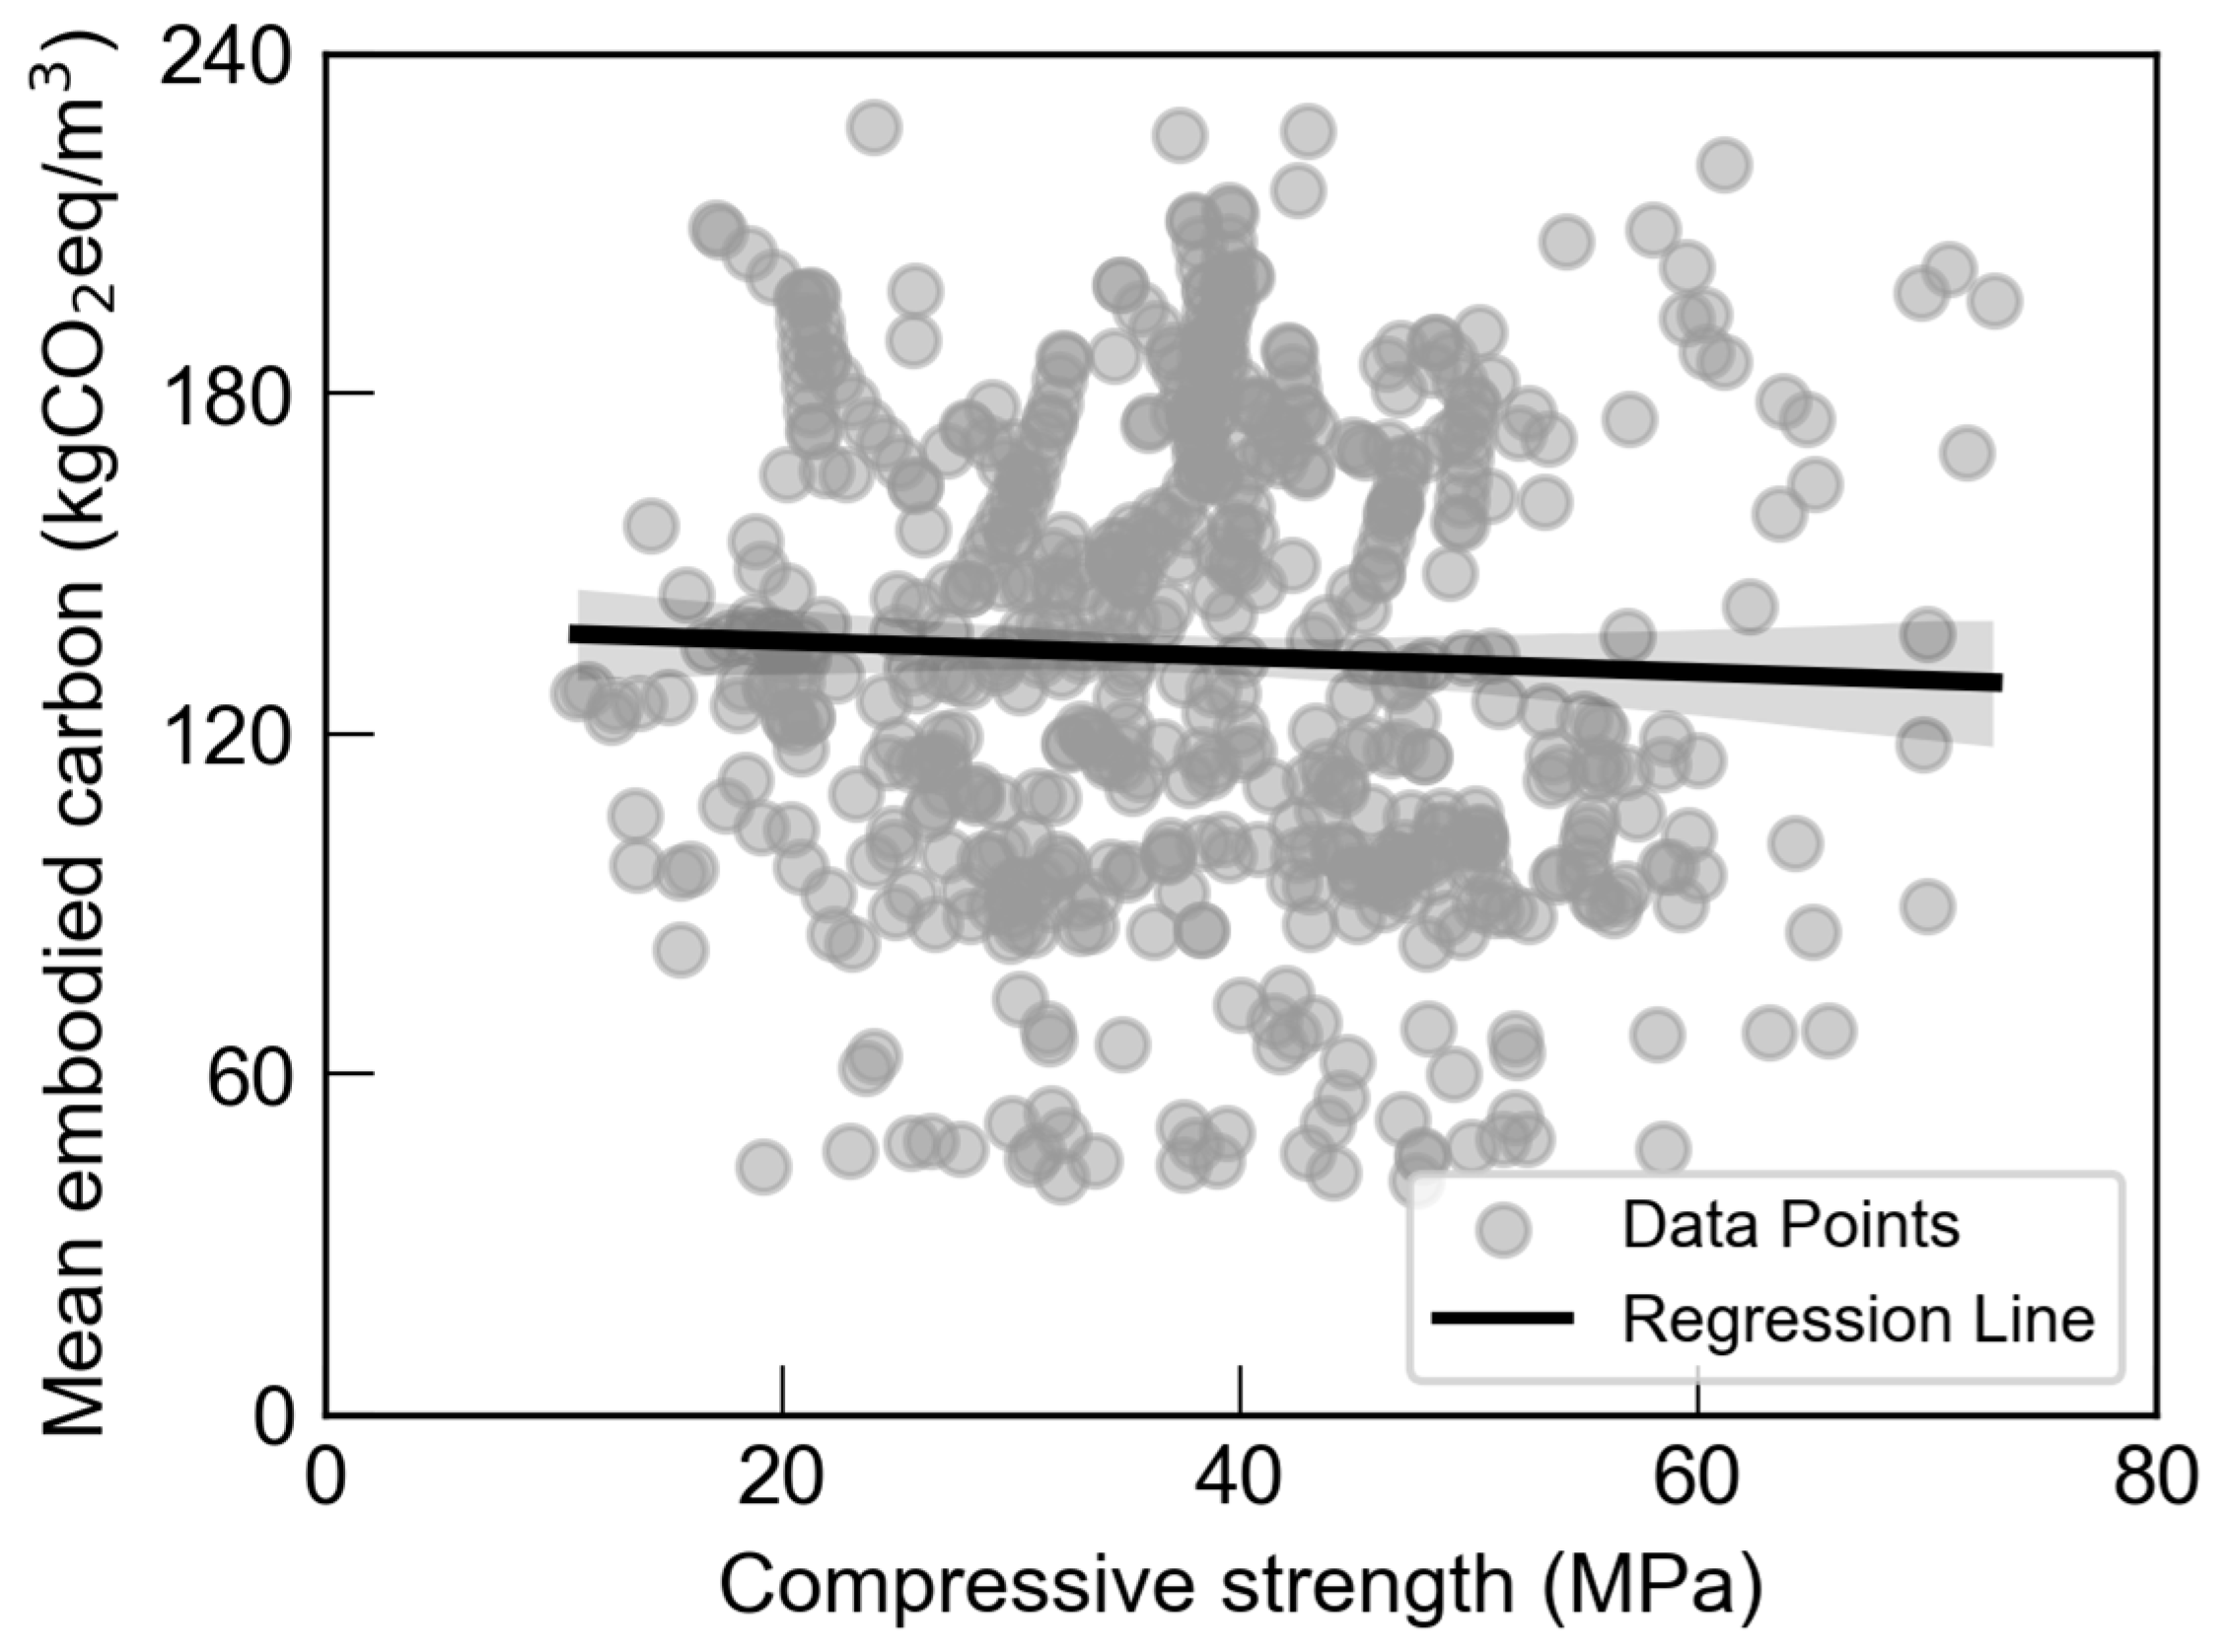
3.2. Concrete Properties

The results of the probabilistic embodied carbon assessments with regard to strength and workability are shown in Figure 9 and Figure 10. The compressive strength–CO2eq relationship is represented by a declining pattern, but with a very small slope. Based on the dataset, the highest compressive strengths were achieved for GGBS-blended AACMs. A mix with GGBS, silica fume, and borax achieved 72.9 MPa, and a corresponding mean embodied carbon value of 196 kgCO2eq/m3 with a total binder content of 630 kg/m3 and A/B of 0.11. Mixes with GGBS and MK also achieved strengths around 70 MPa at 185 kgCO2eq/m3 and a binder content of 400 kg/m3, but a much higher A/B above 0.25. GGBS or FA-only mixes achieved strengths of similar magnitude for lower embodied carbon values below 150 kgCO2eq/m3. The lowest value of compressive strength was 11.1 MPa for a mean embodied carbon of 127 kgCO2eq/m3, which is below the strengths accepted for structural applications. Concerning workability, close inspection of the data indicates an increase in workability with embodied carbon.

3.3. Multicriteria Assessment

For the AACM mixes analysed in this study, the compressive strengths varied from 11 to 73 MPa for the same binder quantity, while the embodied carbon values are within a much narrower span of 41–261 kgCO2eq/m3. A multicriteria evaluation was conducted in this paper to evaluate the material performance using three key parameters of equal importance as indicators of workability, mechanical strength, and environmental impact, using the methods described in Section 2.3.3. Figure 11 presents the outcomes of the evaluation using the method outlined before, for selected studies. Aggregate values close to unity indicate optimal performance, while mixes with values approaching zero are less desirable.
As indicated in the figure, the aggregate scores vary from 0.27 to 0.61. The lowest and largest score for the mixes in Figure 11a is 0.51 and 0.61, respectively. These correspond to mix A0.08-W0.45 and A0.08-W0.52, respectively. For this case, the score associated with embodied carbon was nearly identical, whilst the difference was made by the strength and slump. The latter had a significantly higher workability, thus performing better for the aggregate score. Figure 11b shows scores between 0.48 and 0.60. These were the mixes S75-W0.3 and S50-W0.5, respectively. The mix with the highest score had comparatively significantly higher workability and lower embodied carbon, but also lower compressive strength. For the mixes in Figure 11c, the slump and embodied carbon were largely the same for A1-S10 and C4-S50, but the compressive strength was 16 MPa and 55 MPa, respectively—thus, a wider range between the minimum (0.27) and maximum (0.44) score. Finally, for the mixes in Figure 11d, the scores varied between 0.44 and 0.61. The higher score was due to larger compressive strength and similar embodied carbon emissions and slump values. It is shown that the scoring depends on the set criteria. The weighting could be adjusted based on the user’s need to favour strength, workability, or sustainability.

3.4. Classification Scheme

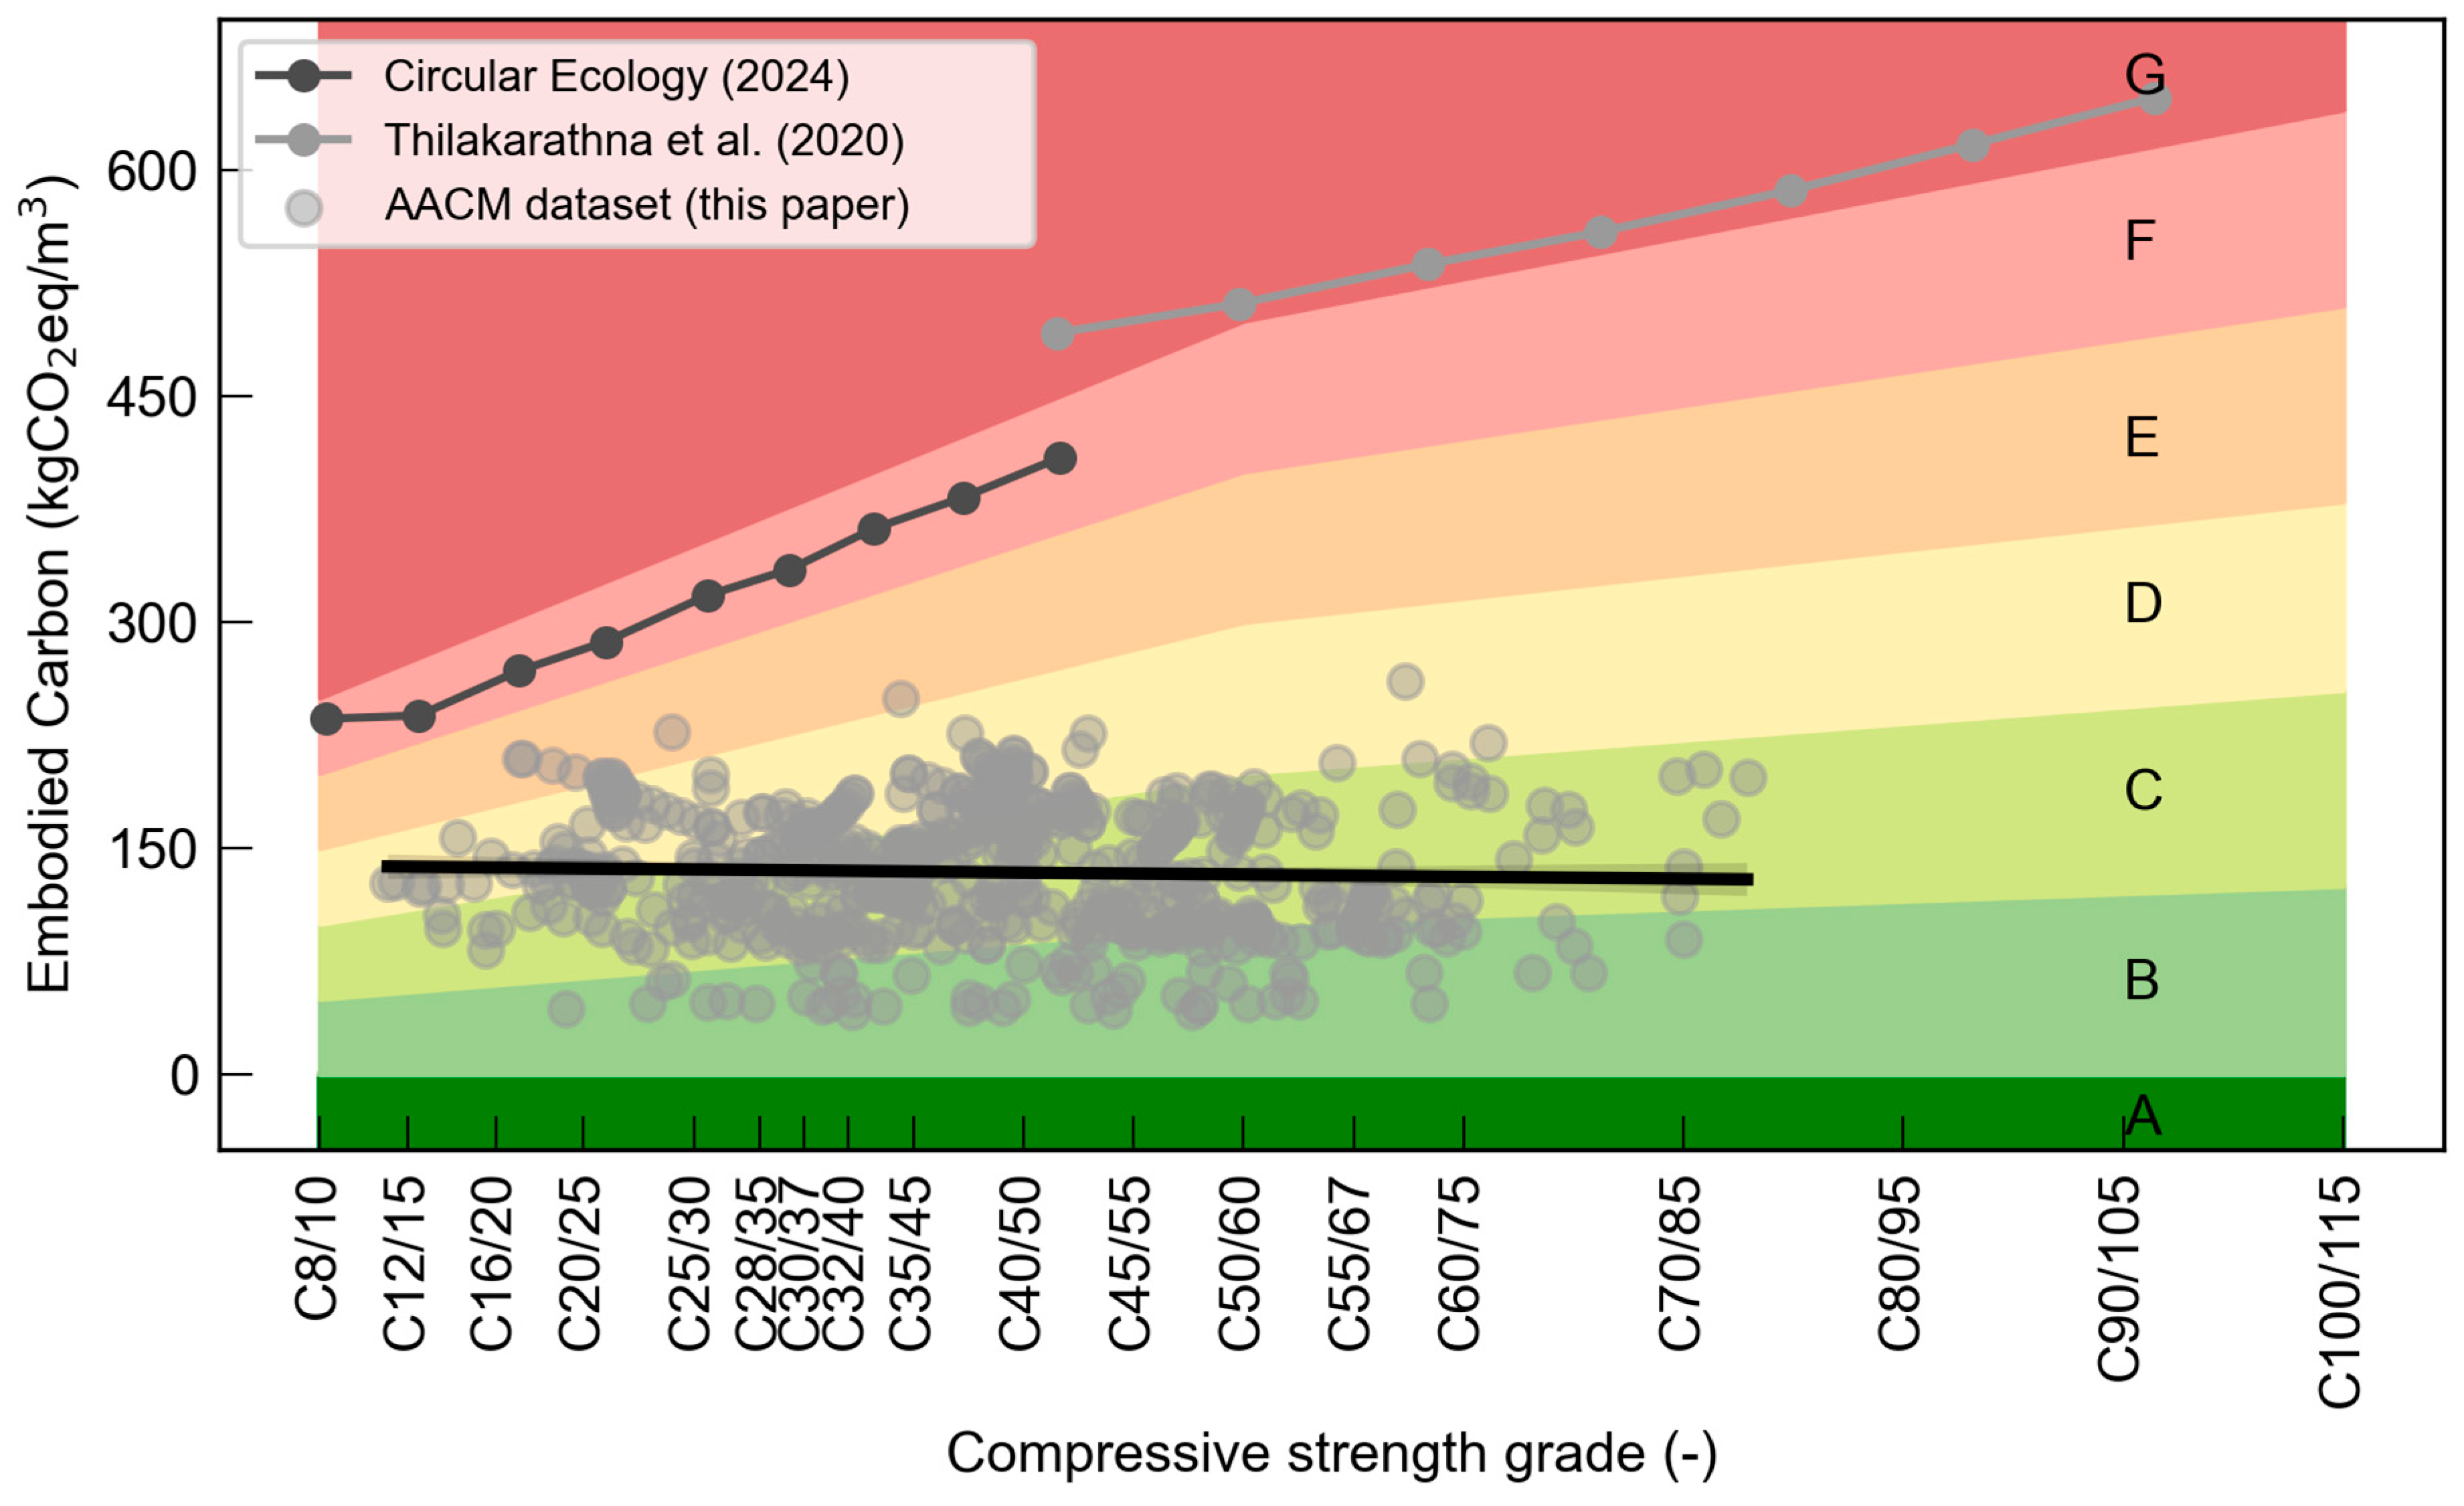
One of the aspects that encourages the adoption of AACMs is their relationship with carbon footprint and their superiority to cement-based concrete. Figure 12 presents the Embodied Carbon Classification Scheme for concrete, delineating baseline values and corresponding rating bands for normal weight concrete across various strength classes [121]. This classification specifies the cradle-to-gate (A1–A3) embodied carbon of concrete in kgCO2eq/m3, varying from the lowest rating ‘A’, signifying virtually negative carbon footprint, up to the baseline threshold, which marks the F/G boundary in the rating system. The specified compressive strength classes for normal weight concrete are shown along the x-axis. These classes range from C8/10, indicating the lowest strength, to C100/115, which represents the highest specified compressive strength available. The F/G boundary corresponds with a baseline (EC100) serving as a reference for different strength classes. In Ref. [121], these boundaries were determined for concrete up to C50/60 grade by integrating the ICE v3 ready-mix concrete CEM I series [122], low concrete carbon group ’G’ embodied carbon rating band [123], and OneClick LCA CEM I series [124]. For concrete with grade greater than C50/60, a dataset for high-strength concrete mixes was used [125].
When evaluating the rating using this scheme, for producer-declared embodied carbon ratings, concrete producers must use product-specific Environmental Product Declarations (EPDs) to existing standards and concrete mix quantities from actual batching records. Techniques such as carbon capture and storage (CCS) can be included in the EC calculation, provided the carbon is permanently sequestered. However, temporary storage or use of captured carbon, as well as carbon offsetting, are excluded from the producer-declared EC rating. Based on guidance, natural carbonation, which involves the reaction of atmospheric CO2 with calcium hydroxide and hydrated calcium silicate in concrete, cannot be included in the calculation. This exclusion ensures that only intentional, permanent measures to reduce carbon emissions are considered, maintaining the integrity and accuracy of the embodied carbon ratings provided under this scheme. Further details on the classification scheme are available in detail in Ref. [121].
The results of the probabilistic embodied carbon assessments carried out in this paper for AACMs are overlapped to the scheme in Figure 12 and used for comparison, as well as for validation against the established rating for cement-based concrete. Note that for consistent comparisons, the mean cylinder compressive strength from the AACM dataset was converted into characteristic compressive strength by accounting for a standard deviation of 8 MPa. Considering the baseline case at the boundary between rating F/G, mixes that contain CEM I cement have a greater embodied carbon than AACM by a factor of around 2 for low concrete grades (C12/15), and by a factor around 4 for high-strength concrete grades (C70/85). As indicated by the figure, the AACMs are located within B–E bands. Lower-strength AACMs are closer to the CEM I benchmark and spread through all four mentioned bands, whilst higher-strength AACMs are largely located between B and C bands. This indicates the suitability of the adoption AACMs for higher-strength concrete.
Embodied carbon assessments were carried out in this study to evaluate different AACMs and understand their environmental sustainability. It was observed that the activator is the main contributor, due to energy-intensive production, particularly as natural gas is the primary energy source for sodium silicate manufacturing [31]. Using alternative energy sources like biomass combustion could further reduce the environmental impact of sodium silicate. Agricultural waste can be converted into biogas, which can then be used as an energy source in the production of energy-intensive materials. Waste-derived activators may substitute for commercial activators. Further research into the environmental impact and durability of alternative activators, as well as their availability, is essential to promote the industrial-scale use of AACMs. Due to their technical attributes, AACMs may be considered specialised materials and could serve as an alternative to other types of low-carbon concrete.
As noted in the introduction, alternative binders are commercially available, such as FA and GGBS. These have been widely adopted in AACMs, but their availability is threatened by declining coal production and the rise of recycled steel, respectively. Binders produced from animal wastes, red mud, and other by-products also exist. Additionally, materials like nickel or lithium slag [126,127], silica fume or residue [128,129], municipal solid waste [130], waste glass [129], rice husk ash [131], pumice [132], volcanic tuff or ash [133], kaolin and metakaolin [134], and various mine tailings [135,136] were adopted as alternative binders in conventional concrete and AACMs. Future research should focus on alternative binders with global availability, requiring tailored LCAs using location-specific LCIs, as outlined in this study.
The results of this study, and their applicability to broader contexts beyond the ranges considered, are constrained by the adopted Life Cycle Assessment (LCA) methodology and data scope. While focusing on embodied carbon (modules A1-A3), the study excludes emissions from transport to construction sites and end-of-life processes, limiting its relevance to complete life-cycle stages. Transport-related uncertainty for raw materials, although addressed through literature-derived ranges, is restricted to the assumptions of those studies. The reliance on published data introduces inconsistencies in mix design procedures, curing methods, and functional unit definitions. Furthermore, the multicriteria evaluation equally weights environmental and mechanical performance, potentially oversimplifying the trade-offs between sustainability and durability. These limitations, along with the relatively narrow focus on Global Warming Potential (GWP), reflect broader challenges in LCA of concrete, which often overlooks other impact categories and regional variability in sourcing and production. The embodied carbon values and their relationship with concrete properties remain confined to the dataset, necessitating further analysis for applicability outside the studied ranges.

4. Concluding Remarks

This study assessed the environmental impact of alkali-activated concrete materials (AACMs) as an alternative to conventional concrete through a probabilistic embodied carbon assessment of 580 mixes. Binder and activator types, mix parameters, and relationships between mechanical properties were analysed using a cradle-to-gate approach with region-specific life-cycle inventory and uncertainty quantification. Multicriteria assessments identified optimal mixes, and results were benchmarked against existing classifications for conventional concrete. The main results are outlined below.
AACM emissions vary from 41 to 261 kgCO2eq/m3, with activators contributing the most (3–198 kgCO2eq/m3) due to energy-intensive production. Transport-related uncertainties could shift emissions by ±38% compared to the mean values. The embodied carbon distribution is primarily influenced by the activator. Superplasticisers, although used in lesser amounts, significantly contribute due to their synthetic nature and energy-intensive production. Aggregates contribute less due to minimal processing and transportation energy. Finally, the binders (e.g., FA, GGBS, MK) follow due to their attribution as wastes with low embodied carbon.
Increasing the activator-to-binder (A/B) ratio raises embodied carbon emissions due to the higher activator content. While larger A/B ratios enhance early-age strength, excessive activators, such as sodium silicate, degrade durability by breaking down high-modulus raw materials. Generally, a higher W/B ratio decreases the embodied carbon. However, within the common range of 0.2 to 0.5, the embodied carbon emissions are largely constant with increasing W/B.
A slight decline is observed between compressive strength and embodied carbon, with strengths varying between 11 MPa and 72.9 MPa for blended binders. Despite large strength variations, AACMs exhibit a narrow range of embodied carbon compared to conventional concrete. High-strength AACMs can achieve up to four times lower emissions than conventional concrete, making them suitable for sustainable high-strength applications, although benefits are reduced for lower strengths.

Author Contributions

N.A.: Methodology, Formal analysis, Investigation, Writing—Original Draft; N.G.-T.: Conceptualisation, Writing—Review and Editing; B.X.: Conceptualisation, Writing—Review and Editing; D.V.B.: Conceptualisation, Methodology, Formal analysis, Investigation, Supervision, Writing—Review and Editing. All authors have read and agreed to the published version of the manuscript.

Funding

This research received no external funding.

Institutional Review Board Statement

Not applicable.

Informed Consent Statement

Not applicable.

Data Availability Statement

Data will be made available on request.

Conflicts of Interest

The authors declare that they have no known competing commercial interests or personal relationships that could have appeared to influence the work reported in this paper.

References

  1. Yang, K.H.; Jung, Y.B.; Cho, M.S.; Tae, S.H. Effect of supplementary cementitious materials on reduction of CO2 emissions from concrete. J. Clean. Prod. 2015, 103, 774–783. [Google Scholar] [CrossRef]
  2. Yu, Y.; Zhao, X.; Xie, T.; Wang, X. Eco-, economic-and mechanical-efficiencies of using precast rejects as coarse aggregates in self-compacting concrete. Case Stud. Constr. Mater. 2022, 17, e01591. [Google Scholar] [CrossRef]
  3. Witte, A.; Garg, N. Quantifying the global warming potential of low carbon concrete mixes: Comparison of existing life cycle analysis tools. Case Stud. Constr. Mater. 2024, 20, e02832. [Google Scholar] [CrossRef]
  4. Oh, D.Y.; Noguchi, T.; Kitagaki, R.; Park, W.J. CO2 emission reduction by reuse of building material waste in the Japanese cement industry. Renew. Sustain. Energy Rev. 2014, 38, 796–810. [Google Scholar] [CrossRef]
  5. Kirthika, S.K.; Singh, S.K.; Chourasia, A. Alternative fine aggregates in production of sustainable concrete—A review. J. Clean. Prod. 2020, 268, 122089. [Google Scholar]
  6. Xia, B.; Ding, T.; Xiao, J. Life cycle assessment of concrete structures with reuse and recycling strategies: A novel framework and case study. Waste Manag. 2020, 105, 268–278. [Google Scholar] [CrossRef]
  7. Cucchiella, F.; D’Adamo, I.; Gastaldi, M. Sustainable management of waste-to-energy facilities. Renew. Sustain. Energy Rev. 2014, 33, 719–728. [Google Scholar] [CrossRef]
  8. Flower, D.J.; Sanjayan, J.G. Green house gas emissions due to concrete manufacture. Int. J. Life Cycle Assess. 2007, 12, 282–288. [Google Scholar] [CrossRef]
  9. Küpfer, C.; Bastien-Masse, M.; Fivet, C. Reuse of concrete components in new construction projects: Critical review of 77 circular precedents. J. Clean. Prod. 2023, 383, 135235. [Google Scholar] [CrossRef]
  10. Garcia-Troncoso, N.; Bompa, D.V.; de la Fuente, A. Reuse Potential Evaluation Procedures for Reinforced Concrete Elements from Large Panel System Buildings: A Systematic Review, Framework and Repurpose Scenarios; Technical Report; University of Surrey: Guildford, UK, 2024. [Google Scholar]
  11. Sabău, M.; Bompa, D.V.; Silva, L.F. Comparative carbon emission assessments of recycled and natural aggregate concrete: Environmental influence of cement content. Geosci. Front. 2021, 12, 101235. [Google Scholar] [CrossRef]
  12. Thorne, J.; Bompa, D.V.; Funari, M.F.; Garcia-Troncoso, N. Environmental impact evaluation of low-carbon concrete incorporating fly ash and limestone. Clean. Mater. 2024, 12, 100242. [Google Scholar] [CrossRef]
  13. Finkbeiner, M.; Inaba, A.; Tan, R.; Christiansen, K.; Klüppel, H.J. The new international standards for life cycle assessment: ISO 14040 and ISO 14044. Int. J. Life Cycle Assess. 2006, 11, 80–85. [Google Scholar] [CrossRef]
  14. Lee, J.; Lee, T.; Jeong, J.; Jeong, J. Mix design optimization and environmental impact assessment of low-carbon materials containing alkali-activated slag and high CaO fly ash. Constr. Build. Mater. 2021, 267, 120932. [Google Scholar] [CrossRef]
  15. Bianco, I.; Tomos, B.A.D.; Vinai, R. Analysis of the environmental impacts of alkali-activated concrete produced with waste glass-derived silicate activator—A LCA study. J. Clean. Prod. 2021, 316, 128383. [Google Scholar] [CrossRef]
  16. Elzeadani, M.; Bompa, D.V.; Elghazouli, A.Y. Experimental assessment and constitutive modelling of rubberised one-part alkali-activated concrete. Constr. Build. Mater. 2022, 353, 129161. [Google Scholar] [CrossRef]
  17. Komnitsas, K.; Soultana, A.; Bartzas, G. Marble waste valorization through alkali activation. Minerals 2021, 11, 46. [Google Scholar] [CrossRef]
  18. Bernal, S.A.; Rodríguez, E.D.; Kirchheim, A.P.; Provis, J.L. Management and valorisation of wastes through use in producing alkali-activated cement materials. J. Chem. Technol. Biotechnol. 2016, 91, 2365–2388. [Google Scholar] [CrossRef]
  19. Elzeadani, M.; Bompa, D.V.; Elghazouli, A.Y. Compressive and splitting tensile impact properties of rubberised one-part alkali-activated concrete. J. Build. Eng. 2023, 71, 106596. [Google Scholar] [CrossRef]
  20. Onyelowe, K.C.; Kontoni, D.P.N. A critical review of rheological models in self-compacting concrete for sustainable structures. Sci. Rep. 2023, 13, 21296. [Google Scholar] [CrossRef]
  21. Shahbaz, M.; Behfarnia, K. Thermal strength of the alkali-activated slag concrete. AUT J. Civ. Eng. 2020, 4, 303–314. [Google Scholar]
  22. Geraldo, R.H.; Ouellet-Plamondon, C.M.; Muianga, E.A.; Camarini, G. Alkali-activated binder containing wastes: A study with rice husk ash and red ceramic. Cerâmica 2017, 63, 44–51. [Google Scholar] [CrossRef]
  23. Zhang, R.; Li, F.; Zhou, S.; Su, Y.; Liu, D.; Niu, Q. Alkali activators with different cations turning volcanic ash into eco-friendly geopolymers. Proc. Inst. Civ. Eng.-Eng. Sustain. 2024, 177, 111–124. [Google Scholar] [CrossRef]
  24. Zhang, B.; He, P.; Poon, C.S. An innovative way to enhance the high temperature properties of alkali activated cement mortars prepared by using glass powder as precursor. Mater. Struct. 2021, 54, 160. [Google Scholar] [CrossRef]
  25. Komkova, A.; Habert, G. Optimal supply chain networks for waste materials used in alkali-activated concrete fostering circular economy. Resour. Conserv. Recycl. 2023, 193, 106949. [Google Scholar] [CrossRef]
  26. Mitoulis, S.A.; Bompa, D.V.; Argyroudis, S. Sustainability and climate resilience metrics and trade-offs in transport infrastructure asset recovery. Transp. Res. Part D Transp. Environ. 2023, 121, 103800. [Google Scholar] [CrossRef]
  27. Kamazani, M.A.; Dixit, M.K. Multi-objective optimization of embodied and operational energy and carbon emission of a building envelope. J. Clean. Prod. 2023, 428, 139510. [Google Scholar] [CrossRef]
  28. Echenagucia, T.M.; Moroseos, T.; Meek, C. On the tradeoffs between embodied and operational carbon in building envelope design: The impact of local climates and energy grids. Energy Build. 2023, 278, 112589. [Google Scholar] [CrossRef]
  29. Wang, S.; Xia, P.; Chen, K.; Gong, F.; Wang, H.; Wang, Q.; Zhao, Y.; Jin, W. Prediction and optimization model of sustainable concrete properties using machine learning, deep learning and swarm intelligence: A review. J. Build. Eng. 2023, 80, 108065. [Google Scholar] [CrossRef]
  30. Bompa, D.V.; Xu, B.; Corbu, O. Evaluation of one-part slag–fly-ash alkali-activated mortars incorporating waste glass powder. J. Mater. Civ. Eng. 2022, 34, 05022001. [Google Scholar] [CrossRef]
  31. Zhang, C.; Bompa, D.V.; Biswal, S.; Wang, Y. Performance of one-part alkali-activated materials incorporating fly ash and slag. In Proceedings of the 15th fib International PhD Symposium in Civil Engineering, Budapest, Hungary, 28–30 August 2024. [Google Scholar]
  32. Marvila, M.T.; de Azevedo, A.R.G.; Júnior, J.A.T.L.; Vieira, C.M.F. Activated alkali cement based on blast furnace slag: Effect of curing type and concentration of Na20. J. Mater. Res. Technol. 2023, 23, 4551–4565. [Google Scholar] [CrossRef]
  33. Shah, I.H.; Miller, S.A.; Jiang, D.; Myers, R.J. Cement substitution with secondary materials can reduce annual global CO2 emissions by up to 1.3 gigatons. Nat. Commun. 2022, 13, 5758. [Google Scholar] [CrossRef]
  34. Palomo, A.; Maltseva, O.; Garcia-Lodeiro, I.; Fernández-Jiménez, A. Portland versus alkaline cement: Continuity or clean break:“A key decision for global sustainability”. Front. Chem. 2021, 9, 705475. [Google Scholar] [CrossRef] [PubMed]
  35. Batista, R.P.; Trindade, A.C.C.; Borges, P.H.; Silva, F.D.A. Silica fume as precursor in the development of sustainable and high-performance MK-based alkali-activated materials reinforced with short PVA fibers. Front. Mater. 2019, 6, 77. [Google Scholar] [CrossRef]
  36. Salas, D.A.; Ramirez, A.D.; Ulloa, N.; Baykara, H.; Boero, A.J. Life cycle assessment of geopolymer concrete. Constr. Build. Mater. 2018, 190, 170–177. [Google Scholar] [CrossRef]
  37. Teh, S.H.; Wiedmann, T.; Castel, A.; de Burgh, J. Hybrid life cycle assessment of greenhouse gas emissions from cement, concrete and geopolymer concrete in Australia. J. Clean. Prod. 2017, 152, 312–320. [Google Scholar] [CrossRef]
  38. Shi, X.; Zhang, C.; Liang, Y.; Luo, J.; Wang, X.; Feng, Y.; Li, Y.; Wang, Q.; Abomohra, A.E.F. Life cycle assessment and impact correlation analysis of fly ash geopolymer concrete. Materials 2021, 14, 7375. [Google Scholar] [CrossRef] [PubMed]
  39. EN 15978; Sustainability of Construction Works. Assessment Of Environmental Performance of Buildings. CEN: Brussels, Belgium, 2011.
  40. Fernando, S.; Gunasekara, C.; Law, D.W.; Nasvi, M.C.M.; Setunge, S.; Dissanayake, R. Life cycle assessment and cost analysis of fly ash–rice husk ash blended alkali-activated concrete. J. Environ. Manag. 2021, 295, 113140. [Google Scholar] [CrossRef] [PubMed]
  41. Miettinen, P.; Hämäläinen, R.P. How to benefit from decision analysis in environmental life cycle assessment (LCA). Eur. J. Oper. Res. 1997, 102, 279–294. [Google Scholar] [CrossRef]
  42. Pacana, A.; Siwiec, D.; Bednárová, L.; Petrovský, J. Improving the Process of Product Design in a Phase of Life Cycle Assessment (LCA). Processes 2023, 11, 2579. [Google Scholar] [CrossRef]
  43. García-Troncoso, N.; Hidalgo-Astudillo, S.; Tello-Ayala, K.; Vanegas-Alman, N.; Bompa, D.V. Preparation and performance of sugarcane bagasse ash pavement repair mortars. Case Stud. Constr. Mater. 2023, 19, e02563. [Google Scholar] [CrossRef]
  44. Zheng, J.; Canarini, A.; Fujii, K.; Mmari, W.N.; Kilasara, M.M.; Funakawa, S. Cropland intensification mediates the radiative balance of greenhouse gas emissions and soil carbon sequestration in maize systems of sub-Saharan Africa. Glob. Change Biol. 2023, 29, 1514–1529. [Google Scholar] [CrossRef]
  45. Lieder, M.; Rashid, A. Towards circular economy implementation: A comprehensive review in context of manufacturing industry. J. Clean. Prod. 2016, 115, 36–51. [Google Scholar] [CrossRef]
  46. Fang, G.; Ho, W.K.; Tu, W.; Zhang, M. Workability and mechanical properties of alkali-activated fly ash-slag concrete cured at ambient temperature. Constr. Build. Mater. 2018, 172, 476–487. [Google Scholar] [CrossRef]
  47. Das, S.K.; Shrivastava, S. Siliceous fly ash and blast furnace slag based geopolymer concrete under ambient temperature curing condition. Struct. Concr. 2021, 22, E341–E351. [Google Scholar] [CrossRef]
  48. Pham, T.T.; Nguyen, N.L.; Nguyen, T.T.; Nguyen, T.T.; Pham, T.H. Effects of superplasticizer and water–binder ratio on mechanical properties of one-part alkali-activated geopolymer concrete. Buildings 2023, 13, 1835. [Google Scholar] [CrossRef]
  49. Xie, J.; Wang, J.; Rao, R.; Wang, C.; Fang, C. Effects of combined usage of GGBS and fly ash on workability and mechanical properties of alkali activated geopolymer concrete with recycled aggregate. Compos. Part B Eng. 2019, 164, 179–190. [Google Scholar] [CrossRef]
  50. Waqas, R.M.; Butt, F.; Zhu, X.; Jiang, T.; Tufail, R.F. A comprehensive study on the factors affecting the workability and mechanical properties of ambient cured fly ash and slag based geopolymer concrete. Appl. Sci. 2021, 11, 8722. [Google Scholar] [CrossRef]
  51. Komkova, A.; Habert, G. Environmental impact assessment of alkali-activated materials: Examining impacts of variability in constituent production processes and transportation. Constr. Build. Mater. 2023, 363, 129032. [Google Scholar] [CrossRef]
  52. Haruna, S.; Mohammed, B.S.; Wahab, M.M.A.; Liew, M.S. Effect of paste aggregate ratio and curing methods on the performance of one-part alkali-activated concrete. Constr. Build. Mater. 2020, 261, 120024. [Google Scholar] [CrossRef]
  53. Abhilash, P.; Sashidhar, C.; Reddy, I.R. Strength properties of Fly ash and GGBS based Geo-polymer Concrete. Int. J. Chem. Tech. Res. 2016, 9, 350–356. [Google Scholar]
  54. Aliabdo, A.A.; Abd Elmoaty, M.; Salem, H.A. Effect of cement addition, solution resting time and curing characteristics on fly ash based geopolymer concrete performance. Constr. Build. Mater. 2016, 123, 581–593. [Google Scholar] [CrossRef]
  55. Adam, A. Strength and Durability Properties of Alkali Activated Slag and Fly Ash-Based Geopolymer Concrete. Ph.D. Thesis, RMIT University, Melbourne, Australia, 2009. [Google Scholar]
  56. Barnard, R. Mechanical Properties of Fly Ash/Slag Based Geopolymer Concrete with the Addition of Macro Fibres. Master’s Thesis, Stellenbosch University, Stellenbosch, South Africa, 2014. [Google Scholar]
  57. Behfarnia, K.; Shojaci, M.; Mohebi, R. Compressive strength and flexural strength of alkali-activated slag concrete designed by Taguchi method. Asian J. Civ. Eng. 2015, 4, 505–513. [Google Scholar]
  58. Bernal, S.A.; De Gutiérrez, R.M.; Provis, J.L. Engineering and durability properties of concretes based on alkali-activated granulated blast furnace slag/metakaolin blends. Constr. Build. Mater. 2012, 33, 99–108. [Google Scholar] [CrossRef]
  59. Chi, M. Effects of dosage of alkali-activated solution and curing conditions on the properties and durability of alkali-activated slag concrete. Constr. Build. Mater. 2012, 35, 240–245. [Google Scholar] [CrossRef]
  60. Deb, P.S. Durability of Fly Ash Based Geopolymer Concrete. Master’s Thesis, Curtin University, Perth, Australia, 2013. [Google Scholar]
  61. Hadi, M.N.; Zhang, H.; Parkinson, S. Optimum mix design of geopolymer pastes and concretes cured in ambient condition based on compressive strength, setting time and workability. J. Build. Eng. 2019, 23, 301–313. [Google Scholar] [CrossRef]
  62. Jawahar, J.G.; Mounika, G. Strength properties of fly ash and GGBS based geopolymer concrete. Asian J. Civ. Eng. 2016, 17, 127–135. [Google Scholar]
  63. Kar, A.; Halabe, U.B.; Ray, I.; Unnikrishnan, A. Nondestructive characterizations of alkali activated fly ash and/or slag concrete. Eur. Sci. J. 2013, 9, 52–74. [Google Scholar]
  64. Kusbiantoro, A.; Nuruddin, M.F.; Shafiq, N.; Qazi, S.A. The effect of microwave incinerated rice husk ash on the compressive and bond strength of fly ash based geopolymer concrete. Constr. Build. Mater. 2012, 36, 695–703. [Google Scholar] [CrossRef]
  65. Lavanya, G.; Jegan, J. Evaluation of relationship between split tensile strength and compressive strength for geopolymer concrete of varying grades and molarity. Int. J. Appl. Eng. Res. 2015, 10, 35523–35527. [Google Scholar]
  66. Lee, N.K.; Lee, H.K. Setting and mechanical properties of alkali-activated fly ash/slag concrete manufactured at room temperature. Constr. Build. Mater. 2013, 47, 1201–1209. [Google Scholar] [CrossRef]
  67. Mallikarjuna Rao, G.; Gunneswara Rao, T.D. A quantitative method of approach in designing the mix proportions of fly ash and GGBS-based geopolymer concrete. Aust. J. Civ. Eng. 2018, 16, 53–63. [Google Scholar] [CrossRef]
  68. Muthadhi, A.; Vanjinathan, J.; Durai, D. Experimental investigations on geo polymer concrete based on class C fly ash. Indian J. Sci. Technol. 2016, 9, 1–5. [Google Scholar] [CrossRef]
  69. Nath, P.; Sarker, P.K. Effect of GGBFS on setting, workability and early strength properties of fly ash geopolymer concrete cured in ambient condition. Constr. Build. Mater. 2014, 66, 163–171. [Google Scholar] [CrossRef]
  70. Nath, P.; Sarker, P.K. Use of OPC to improve setting and early strength properties of low calcium fly ash geopolymer concrete cured at room temperature. Cem. Concr. Compos. 2015, 55, 205–214. [Google Scholar] [CrossRef]
  71. Noushini, A.; Aslani, F.; Castel, A.; Gilbert, R.I.; Uy, B.; Foster, S. Compressive stress-strain model for low-calcium fly ash-based geopolymer and heat-cured Portland cement concrete. Cem. Concr. Compos. 2016, 73, 136–146. [Google Scholar] [CrossRef]
  72. Pan, Z.; Sanjayan, J.G.; Rangan, B.V. Fracture properties of geopolymer paste and concrete. Mag. Concr. Res. 2011, 63, 763–771. [Google Scholar] [CrossRef]
  73. Parthiban, K.; Saravanarajamohan, K.; Shobana, S.; Bhaskar, A.A. Effect of replacement of slag on the mechanical properties of fly ash based geopolymer concrete. Int. J. Eng. Technol. 2013, 5, 2555–2559. [Google Scholar]
  74. Phoo-Ngernkham, T.; Phiangphimai, C.; Damrongwiriyanupap, N.; Hanjitsuwan, S.; Thumrongvut, J.; Chindaprasirt, P. A mix design procedure for alkali-activated high-calcium fly ash concrete cured at ambient temperature. Adv. Mater. Sci. Eng. 2018, 2018, 2460403. [Google Scholar] [CrossRef]
  75. Rafeet, A.; Vinai, R.; Soutsos, M.; Sha, W. Guidelines for mix proportioning of fly ash/GGBS based alkali activated concretes. Constr. Build. Mater. 2017, 147, 130–142. [Google Scholar] [CrossRef]
  76. Kumar, S. Development and determination of mechanical properties of fly ash and slag blended geopolymer concrete. Int. J. Sci. Eng. Res. 2013, 4. Available online: https://www.ijser.org/researchpaper/Development-and-Determination-of-Mechanical-properties-of-fly-ash-and-slag-blended-geo-polymer-concrete.pdf (accessed on 10 December 2024).
  77. Topark-Ngarm, P.; Chindaprasirt, P.; Sata, V. Setting time, strength, and bond of high-calcium fly ash geopolymer concrete. J. Mater. Civ. Eng. 2015, 27, 04014198. [Google Scholar] [CrossRef]
  78. Vignesh, P.; Vivek, K. An experimental investigation on strength parameters of flyash based geopolymer concrete with GGBS. Int. Res. J. Eng. Technol. 2015, 2, 135–142. [Google Scholar]
  79. Vinai, R.; Rafeet, A.; Soutsos, M.; Sha, W. The role of water content and paste proportion on physico-mechanical properties of alkali activated fly ash–ggbs concrete. J. Sustain. Metall. 2016, 2, 51–61. [Google Scholar] [CrossRef]
  80. Wardhono, A.; Gunasekara, C.; Law, D.W.; Setunge, S. Comparison of long term performance between alkali activated slag and fly ash geopolymer concretes. Constr. Build. Mater. 2017, 143, 272–279. [Google Scholar] [CrossRef]
  81. Xie, T.; Ozbakkaloglu, T. Behavior of low-calcium fly and bottom ash-based geopolymer concrete cured at ambient temperature. Ceram. Int. 2015, 41, 5945–5958. [Google Scholar] [CrossRef]
  82. Hongen, Z.; Feng, J.; Qingyuan, W.; Ling, T.; Xiaoshuang, S. Influence of Cement on Properties of Fly-Ash-Based Concrete. ACI Mater. J. 2017, 114, 745–753. [Google Scholar] [CrossRef]
  83. Hongen, Z.; Ling, T.; Xiaoshuang, S.; Wang, Q. Influence of curing condition on compressive strength of low-calcium y ash-based geopolymer concrete. J. Residuals Sci. Technol. 2017, 14, 1544. [Google Scholar] [CrossRef] [PubMed]
  84. Xie, T.; Visintin, P.; Zhao, X.; Gravina, R. Mix design and mechanical properties of geopolymer and alkali activated concrete: Review of the state-of-the-art and the development of a new unified approach. Constr. Build. Mater. 2020, 256, 119380. [Google Scholar] [CrossRef]
  85. Ding, Y.; Shi, C.J.; Li, N. Fracture properties of slag/fly ash-based geopolymer concrete cured in ambient temperature. Constr. Build. Mater. 2018, 190, 787–795. [Google Scholar] [CrossRef]
  86. Yang, K.H.; Song, J.K.; Song, K.I. Assessment of CO2 reduction of alkali-activated concrete. J. Clean. Prod. 2013, 39, 265–272. [Google Scholar] [CrossRef]
  87. Elzeadani, M.; Bompa, D.V.; Elghazouli, A.Y. One part alkali activated materials: A state-of-the-art review. J. Build. Eng. 2022, 57, 104871. [Google Scholar] [CrossRef]
  88. EN 1992-1-1:2023; Eurocode 2. Design of Concrete Structures. General Rules and Rules for Buildings, Bridges and Civil Engineering Structures. European Committee for Standardisation: Brussels, Belgium, 2023.
  89. Li, C.; Jiang, L.; Li, S. Effect of limestone powder addition on threshold chloride concentration for steel corrosion in reinforced concrete. Cem. Concr. Res. 2020, 131, 106018. [Google Scholar] [CrossRef]
  90. Sun, B.; Ye, G.; De Schutter, G. A review: Reaction mechanism and strength of slag and fly ash-based alkali-activated materials. Constr. Build. Mater. 2022, 326, 126843. [Google Scholar] [CrossRef]
  91. Rao, A.K.; Kumar, D.R. Effect of various alkaline binder ratio on geopolymer concrete under ambient curing condition. Mater. Today Proc. 2020, 27, 1768–1773. [Google Scholar]
  92. Ouellet-Plamondon, C.; Habert, G. Life cycle assessment (LCA) of alkali-activated cements and concretes. In Handbook of Alkali-Activated Cements, Mortars and Concretes; Woodhead Publishing: Sawston, UK, 2015; pp. 663–686. [Google Scholar]
  93. Finnveden, G.; Hauschild, M.Z.; Ekvall, T.; Guinée, J.; Heijungs, R.; Hellweg, S.; Koehler, A.; Pennington, D.; Suh, S. Recent developments in life cycle assessment. J. Environ. Manag. 2009, 91, 1–21. [Google Scholar] [CrossRef] [PubMed]
  94. Visintin, P.; Xie, T.; Bennett, B. A large-scale life-cycle assessment of recycled aggregate concrete: The influence of functional unit, emissions allocation and carbon dioxide uptake. J. Clean. Prod. 2020, 248, 119243. [Google Scholar] [CrossRef]
  95. Xing, W.; Tam, V.W.; Le, K.N.; Butera, A.; Hao, J.L.; Wang, J. Effects of mix design and functional unit on life cycle assessment of recycled aggregate concrete: Evidence from CO2 concrete. Constr. Build. Mater. 2022, 348, 128712. [Google Scholar] [CrossRef]
  96. Ma, C.; Long, G.; Shi, Y.; Xie, Y. Preparation of cleaner one-part geopolymer by investigating different types of commercial sodium metasilicate in China. J. Clean. Prod. 2018, 201, 636–647. [Google Scholar] [CrossRef]
  97. Panesar, D.K. Supplementary cementing materials. In Developments in the Formulation and Reinforcement of Concrete; Woodhead Publishing: Sawston, UK, 2019; pp. 55–85. [Google Scholar]
  98. Hammond, G.; Jones, C.; Lowrie, E.F.; Tse, P. Embodied carbon. In The Inventory of Carbon and Energy (ICE); Version (2.0); Building Services Research & Information Association: Berkshire, UK, 2011. [Google Scholar]
  99. Guo, S.; Ma, C.; Long, G.; Xie, Y. Cleaner one-part geopolymer prepared by introducing fly ash sinking spherical beads: Properties and geopolymerization mechanism. J. Clean. Prod. 2019, 219, 686–697. [Google Scholar] [CrossRef]
  100. Black, L. Low clinker cement as a sustainable construction material. Sustain. Constr. Mater. 2016, 415–457. In Sustainability of Construction Materials, 2nd ed.; Woodhead Publishing Series in Civil and Structural Engineering; Elsevier: Amsterdam, The Netherlands, 2016; pp. 415–457. [Google Scholar] [CrossRef]
  101. Wang, X. CO2 and Cost-Based Optimum Design of Sustainable Metakaolin-Modified Concrete. J. Renew. Mater. 2022, 10, 2431–2450. [Google Scholar] [CrossRef]
  102. Setiawan, A.A.; Hardjasaputra, H.; Soegiarso, R. Embodied carbon dioxide of fly ash based geopolymer concrete. In IOP Conference Series: Earth and Environmental Science; IOP Publishing: Bristol, UK, 2023; Volume 1195. [Google Scholar]
  103. IPCC. ipcc-nggi. 1996. Available online: https://www.ipcc-nggip.iges.or.jp/public/gl/guidelin/ch2ref2.pdf (accessed on 5 June 2024).
  104. European Federation of Concrete Admixture Associations. Environmental Declaration Superplasticizing Admixtures—2002, EFCA. Available online: http://www.efca.info/admixtures/environmental-and-sustainability-aspects/environmental-product-declarations-epd/ (accessed on 10 December 2024).
  105. Ferroglobe Silica Fume. An Environmental Product Declaration. ASTM International. 2024. Available online: https://pcr-epd.s3.us-east-2.amazonaws.com/1107.EPD_Ferroglobe_Silica_Fume.pdf (accessed on 10 December 2024).
  106. Bundesförderung für Energie- und Ressourceneffizienz in der Wirtschaft—Zuschuss. Informationsblatt CO2-Faktoren. 2023. Available online: https://www.bafa.de/SharedDocs/Downloads/DE/Energie/eew_infoblatt_co2_faktoren_2023.pdf?__blob=publicationFile&v=5 (accessed on 10 December 2024).
  107. Richardson, S.; Hyde, K.; Connaughton, J. Uncertainty assessment of comparative design stage embodied carbon assessments. In Embodied Carbon in Buildings; Pomponi, F., De Wolf, C., Moncaster, A., Eds.; Springer: Cham, Switzerland, 2018. [Google Scholar] [CrossRef]
  108. Keyhani, M.; Bahadori-Jahromi, A.; Mylona, A.; Godfrey, P. Discrepancy in Embodied Carbon Calculations for Concrete Materials. In Proceedings of the Euro-Mediterranean Conference for Environmental Integration (EMCEI-23), Cosenza, Italy, 2–5 October 2023. [Google Scholar]
  109. Pomponi, F.; Moncaster, A. Scrutinising embodied carbon in buildings: The next performance gap made manifest. Renew. Sustain. Energy Rev. 2018, 81, 2431–2442. [Google Scholar] [CrossRef]
  110. DeRousseau, M.A.; Arehart, J.H.; Kasprzyk, J.R.; Srubar, W.V., III. Statistical variation in the embodied carbon of concrete mixtures. J. Clean. Prod. 2020, 275, 123088. [Google Scholar] [CrossRef]
  111. Pomponi, F.; D’Amico, B.; Moncaster, A.M. A method to facilitate uncertainty analysis in LCAs of buildings. Energies 2017, 10, 524. [Google Scholar] [CrossRef]
  112. Vafaei, N.; Ribeiro, R.A.; Camarinha-Matos, L.M. Normalization techniques for multi-criteria decision making analytical hierarchy process case study. In Technological Innovation for Cyber-Physical Systems, Proceedings of the 7th IFIP WG 5.5/SOCOLNET Advanced Doctoral Conference on Computing, Electrical and Industrial Systems, DoCEIS 2016, Costa de Caparica, Portugal, 11–13 April 2016; Proceedings 7; Springer International Publishing: Berlin/Heidelberg, Germany, 2016; pp. 261–269. [Google Scholar]
  113. Frattini, D.; Occhicone, A.; Ferone, C.; Cioffi, R. Fibre-reinforced geopolymer concretes for sensible heat thermal energy storage: Simulations and environmental impact. Materials 2021, 14, 414. [Google Scholar] [CrossRef] [PubMed]
  114. Turner, L.K.; Collins, F.G. Carbon dioxide equivalent (CO2-e) emissions: A comparison between geopolymer and OPC cement concrete. Constr. Build. Mater. 2013, 43, 125–130. [Google Scholar] [CrossRef]
  115. Jiang, M.; Chen, X.; Rajabipour, F.; Hendrickson, C.T. Comparative life cycle assessment of conventional, glass powder, and alkali-activated slag concrete and mortar. J. Infrastruct. Syst. 2014, 20, 04014020. [Google Scholar] [CrossRef]
  116. Hammad, N.; El-Nemr, A.; Hasan, H.E.D. The performance of fiber GGBS based alkali-activated concrete. J. Build. Eng. 2021, 42, 102464. [Google Scholar] [CrossRef]
  117. Hammad, N.; ElNemr, A.M.; Hassan, H.E.D. Flexural performance of reinforced Alkali-activated concrete beams incorporating steel and structural Macro synthetic polypropylene fiber. Constr. Build. Mater. 2022, 324, 126634. [Google Scholar] [CrossRef]
  118. Van Deventer, J.S.; Provis, J.L.; Duxson, P. Technical and commercial progress in the adoption of geopolymer cement. Miner. Eng. 2012, 29, 89–104. [Google Scholar] [CrossRef]
  119. Palomo, A.; Grutzeck, M.W.; Blanco, M.T. Alkali-activated fly ashes: A cement for the future. Cem. Concr. Res. 1999, 29, 1323–1329. [Google Scholar] [CrossRef]
  120. Atabey, İ.İ.; Karahan, O.; Bilim, C.; Atiş, C.D. The influence of activator type and quantity on the transport properties of class F fly ash geopolymer. Constr. Build. Mater. 2020, 264, 120268. [Google Scholar] [CrossRef]
  121. Ove Arup &; Partners Limited. Embodied Carbon Classification Scheme for Concrete. Arup. Online. 2023. Available online: https://www.arup.com/globalassets/downloads/insights/e/embodied-carbon-classification-scheme-for-concrete/embodied-carbon-classification-scheme-for-concrete-report.pdf (accessed on 10 December 2024).
  122. Circular Ecology. ICE Database v3. 2024. Available online: https://circularecology.com/news/ice-database-v3-launched (accessed on 10 December 2024).
  123. Institution of Civil Engineers. Low Carbon Concrete Routemap—Setting the Agenda for a Path to Net Zero. 2023. Available online: https://www.ice.org.uk/media/q12jkljj/low-carbon-concrete-routemap.pdf (accessed on 10 December 2024).
  124. OneClick LCA. LCA CEM I. 2023. Available online: https://oneclicklca.com (accessed on 10 December 2024).
  125. Thilakarathna, P.S.M.; Seo, S.; Baduge, K.K.; Lee, H.; Mendis, P.; Foliente, G. Embodied carbon analysis and benchmarking emissions of high and ultra-high strength concrete using machine learning algorithms. J. Clean. Prod. 2020, 262, 121281. [Google Scholar] [CrossRef]
  126. Xu, L.; Wang, X.; Guan, C.; Wu, W.; Zhang, L. The Effect of Activators on the Mechanical Properties and Microstructure of Alkali-Activated Nickel Slag. Adv. Civ. Eng. 2020, 2020, 1764108. [Google Scholar] [CrossRef]
  127. Wang, X.; Wu, W.; Zhang, L.; Fu, L.; Li, X. Preparation of one-part alkali-activated nickel slag binder using an optimal ball milling process. Constr. Build. Mater. 2022, 322, 125902. [Google Scholar] [CrossRef]
  128. Gluth, G.J.G.; Lehmann, C.; Rübner, K.; Kühne, H.C. Geopolymerization of a silica residue from waste treatment of chlorosilane production. Mater. Struct. 2013, 46, 1291–1298. [Google Scholar] [CrossRef]
  129. Li, L.; Lu, J.X.; Zhang, B.; Poon, C.S. Rheology behavior of one-part alkali activated slag/glass powder (AASG) pastes. Constr. Build. Mater. 2020, 258, 120381. [Google Scholar] [CrossRef]
  130. Ye, N.; Chen, Y.; Yang, J.; Liang, S.; Hu, Y.; Xiao, B.; Huang, Q.; Shi, Y.; Hu, J.; Wu, X. Co-disposal of MSWI fly ash and Bayer red mud using an one-part geopolymeric system. J. Hazard. Mater. 2016, 318, 70–78. [Google Scholar] [CrossRef]
  131. Almalkawi, A.T.; Hamadna, S.; Soroushian, P. One-part alkali activated cement based volcanic pumice. Constr. Build. Mater. 2017, 152, 367–374. [Google Scholar] [CrossRef]
  132. Kadhim, A.; Sadique, M.; Al-Mufti, R.; Hashim, K. Long-term performance of novel high-calcium one-part alkali-activated cement developed from thermally activated lime kiln dust. J. Build. Eng. 2020, 32, 101766. [Google Scholar] [CrossRef]
  133. Çetintaş, R.; Soyer-Uzun, S. Relations between structural characteristics and compressive strength in volcanic ash based one–part geopolymer systems. J. Build. Eng. 2018, 20, 130–136. [Google Scholar] [CrossRef]
  134. Liew, Y.M.; Heah, C.Y.; Li, L.Y.; Jaya, N.A.; Abdullah, M.M.A.B.; Tan, S.J.; Hussin, K. Formation of one-part-mixing geopolymers and geopolymer ceramics from geopolymer powder. Constr. Build. Mater. 2017, 156, 9–18. [Google Scholar] [CrossRef]
  135. Luo, Y.; Bao, S.; Zhang, Y. Preparation of one-part geopolymeric precursors using vanadium tailing by thermal activation. J. Am. Ceram. Soc. 2020, 103, 779–783. [Google Scholar] [CrossRef]
  136. Chen, W.; Peng, R.; Straub, C.; Yuan, B. Promoting the performance of one-part alkali-activated slag using fine lead-zinc mine tailings. Constr. Build. Mater. 2020, 236, 117745. [Google Scholar] [CrossRef]
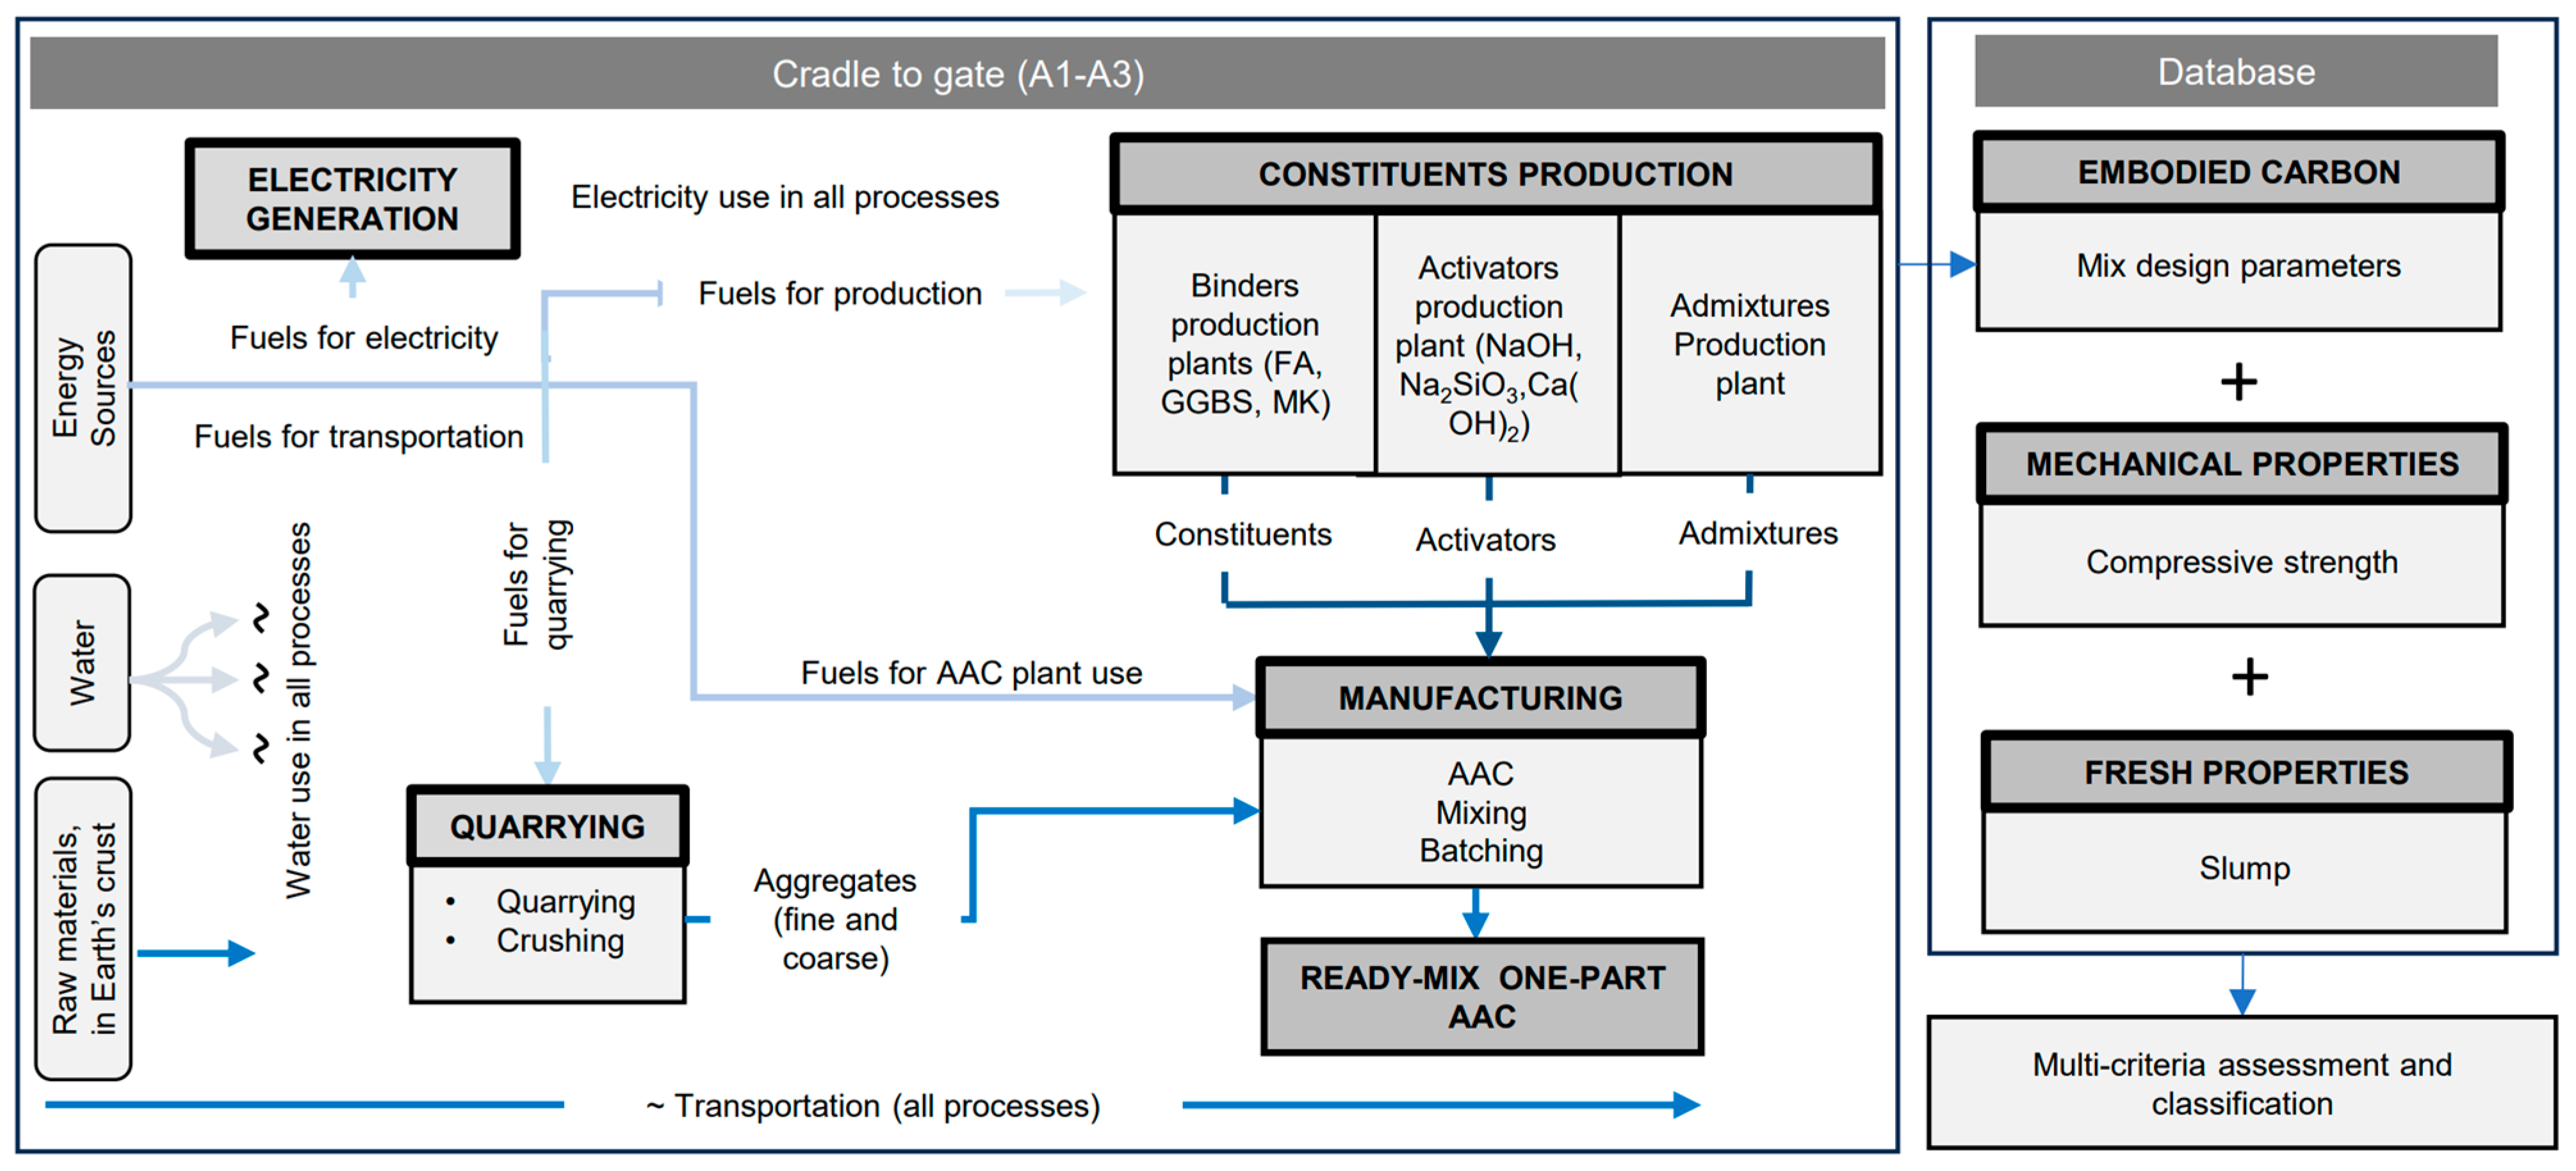
Figure 1. Methods flowchart.
Sustainability 17 00152 g001
Figure 2. Database details: number of mixes versus: (a) binder intensity, (b) compressive strength type, (c) binder type, (d) activator type.
Sustainability 17 00152 g002
Figure 3. Relationship between binder intensity and compressive strength.
Sustainability 17 00152 g003
Figure 4. Relationship between embodied carbon and binder intensity.
Sustainability 17 00152 g004
Figure 5. Histograms for embodied carbon assessments: (a) mean embodied carbon, (b) 95% confidence interval upper, (c) 95% confidence interval lower.
Sustainability 17 00152 g005
Figure 6. Distribution of embodied carbon per mix constituents.
Sustainability 17 00152 g006
Figure 7. Relationship between the A/B ratio and embodied carbon.
Sustainability 17 00152 g007
Figure 8. Relationship between the W/B ratio and embodied carbon.
Sustainability 17 00152 g008
Figure 9. Relationship between the compressive strength and embodied carbon.
Sustainability 17 00152 g009
Figure 10. Relationship between slump and embodied carbon.
Sustainability 17 00152 g010
Figure 11. Multicriteria index/score for mixes from (a) Pham et al. (2023) [48], (b) Xie et al., (2019) [49], (c) Waqas et al. (2021) [50], (d) Fang et al. (2018) [46].
Sustainability 17 00152 g011
Figure 12. Comparison between embodied carbon and compressive strength for cement concrete and AACMs [122,125].
Sustainability 17 00152 g012
Table 1. Life cycle inventory.
Materials (kg/m3)Carbon Factors (kgCO2eq/kg)Reference
Ca(OH)20.76[103]
Na2SiO31.514[102]
NaOH0.68[103]
Superplasticiser2.388[104]
Micro silica0.028[105]
Borax1.520[106]
OPC0.912[98]
GGBS0.0416[98]
FA0.004[98]
MK0.40[101]
Water0.000344[98]
Coarse Aggregates0.01577[98]
Fine Aggregates0.00747[98]
Disclaimer/Publisher’s Note: The statements, opinions and data contained in all publications are solely those of the individual author(s) and contributor(s) and not of MDPI and/or the editor(s). MDPI and/or the editor(s) disclaim responsibility for any injury to people or property resulting from any ideas, methods, instructions or products referred to in the content.