Article

Analysis of Resource Misallocation and Total Factor Productivity Losses in Green Agriculture: A Case Study of the North China Region

1
School of Environmental Studies, China University of Geosciences, Wuhan 430078, China
2
Yangzhuang Senior High School, Zhumadian 463900, China
3
The College of Geography and Environmental Science, Henan University, Kaifeng 475000, China
4
School of Resources & Environment and Tourism, Anyang Normal University, Anyang 455002, China
5
Hubei Key Laboratory of Yangtze Catchment Environmental Aquatic Science, China University of Geosciences, Wuhan 430078, China
*
Author to whom correspondence should be addressed.
Sustainability 2025, 17(1), 199; https://doi.org/10.3390/su17010199
Submission received: 7 October 2024 / Revised: 12 December 2024 / Accepted: 19 December 2024 / Published: 30 December 2024

Abstract

:
The inefficient allocation of resources in agricultural production not only affects the quality of agricultural development and the efficiency of resource utilization but also represents a pivotal issue that constrains the sustainable progress of agriculture. Considering the urgent societal need for the optimization and advancement of industries, investigating the issue of resource misallocation within agricultural production and its specific losses on AGTFP is profoundly important in advancing the pursuit of high-quality and sustainable agricultural development. This study employs the Cobb–Douglas function and the theory of price distortion to establish a model for quantifying losses in Agricultural Green Total Factor Productivity (AGTFP). Drawing on provincial panel data from North China spanning the years 2006 to 2022, we analyze the characteristics of resource allocation and the corresponding losses in AGTFP. The findings suggest that AGTFP in North China has been gradually rising, accompanied by notable regional disparities in both the level of AGTFP and its growth rate. Nevertheless, due to the varying effects of distorted agricultural input factors, there exists different resource misallocation across North China. Despite some improvement in resource misallocation, this improvement has not been significant. Consequently, there is a loss of AGTFP in the North China region. If resource misallocation is effectively addressed, AGTFP losses could be reduced by at least 29%. It is anticipated that over the course of the next decade, AGTFP will rise and resource misallocation and AGTFP losses will diminish slightly, and it is crucial to step up efforts to enhance resource allocation. By ensuring adequate agricultural funding, enhancing agricultural efficiency, and optimizing energy inputs, it is possible to mitigate resource misallocation, thereby effectively diminishing AGTFP losses and fostering the sustainable advancement of agriculture.

1. Introduction

Agriculture stands as a foundational industry that underpins human sustenance and national economic advancement, holding profound implications for social tranquility and national security. In 1987, the notion of sustainable development was introduced, prompting a focus on the green sustainable development of agriculture [1]. This generated a suite of green agricultural policies, encompassing environmental conservation [2], technological investments in agriculture [3], and energy conservation and emission reduction in agriculture [4]. Over the course of more than four decades of uninterrupted growth through reform and opening up, China has witnessed a marked increase in its total agricultural output value, achieving remarkable achievements. However, this growth has been accompanied by resource misallocations, such as water scarcity, land quality deterioration, and the exacerbation of agricultural non-point source pollution, alongside a range of environmental degradation phenomena [5,6,7,8]. These issues not only collectively pose a threat to but also simultaneously impact the quality of agricultural development, presenting challenges in the sustainable development of agriculture. Accordingly, the promotion of green and sustainable agricultural development has become a focal point of concern across all sectors of society.
Agricultural Total Factor Productivity (ATFP) encapsulates the comprehensive efficiency of agriculture when considering all influencing factors. It can mitigate the negative impact of diminishing returns to scale and objectively and comprehensively measure agricultural production efficiency, and it serves as a pivotal indicator for assessing agricultural sustainable development. A higher level of ATFP implies less reliance on resources and a stronger technological and sustainable orientation. Nevertheless, the evaluation of ATFP may be compromised due to its exclusive focus on expected outputs. To address this, by integrating environmental indicators into the evaluation framework, the improved Agricultural Green Total Factor Productivity (AGTFP) indicator not only assesses agricultural production efficiency but also accounts for environmental preservation and sustainability. This integration offers a more scientific and rational evaluation approach for sustainable development research.
The estimation of AGTFP predominantly relies on Data Envelopment Analysis (DEA) and Stochastic Frontier Analysis (SFA). The computational approach of the SFA model is intricate, necessitating the pre-specification of particular production function formats and error term distributions. In contrast, the DEA model is a non-parametric technique that provides enhanced maneuverability and adaptability. A substantial number of studies tend to favor the DEA approach [9]. Over time, the DEA model has undergone continuous iteration and enhancement. The three-stage SBM-DEA model has been employed to assess China’s provincial AGTFP, accounting for carbon emissions and non-point source pollution [10]. Two DEA models, the weight-corrected Russell model and the bounded adjustment model, have been proposed to measure and validate the stability of China’s AGTFP [11]. The Malmquist–Luenberger index, an extension of the DEA model, is also capable of measuring AGTFP with unexpected outputs [12,13]. The DEA and SFA models are primarily designed for the effective measurement of AGTFP but lack the capability to elucidate the origins of configuration distortions. Integrating the Hsieh and Klenow (HK) model with the price distortion theory effectively remedies this shortfall [14]. In accounting for undesirable outputs, the Hsieh and Klenow framework leverages the elasticity coefficients derived from the production function to estimate GTFP [15]. Furthermore, by combing the theory of price distortion, one can compute the factor price distortion coefficient [16]. Utilizing the GTFP and the price distortion coefficient, we can refine the quantification of the extent of resource misallocation and the associated losses in GTFP.
The research approaches for AGTFP are to explore of the spatiotemporal disparities and influencing factors of AGTFP across various regions. As indicated by relevant research findings, significant regional disparities in AGTFP are observed across different regions [17,18,19], with an overall trend of slow improvement. Moreover, some studies have analyzed the direction and intensity of the driving factors influencing AGTFP. The advancement of green technology plays a pivotal role in driving the growth of AGTFP [20,21]. Given the limited short-term effectiveness of technological progress and its dependence on financial support, technology capital investment is a crucial and long-term endeavor for AGTFP [22,23]. Published research results suggest that the integration of the digital economy with agricultural production can enhance agricultural informatization, resource sharing, and the precise management of production processes, significantly improving AGTFP [24,25,26]. Additionally, environmental governance policies [27,28], economic agglomeration [29] and resource misallocation reduction [30] can also exert positive impacts on AGTFP.
Resource misallocation is a pivotal factor influencing fluctuations in AGTFP. It signifies the discrepancy between actual and optimal resource allocation, predominantly driven by market imperfections and policy deficiencies [31,32,33]. This phenomenon is pervasive within the agricultural production cycle and, consequently, hampers the pursuit of high-quality agricultural development. Certain studies indicate that factor misallocation has a direct detrimental effect on AGTFP. For instance, in China, there is a pronounced misallocation between agricultural capital and land [34], with the negative impact on domestic AGTFP surpassing that of neighboring regions [35]. Several proposals have been put forth to alleviate resource misallocation through deliberate human interventions, thereby enhancing agricultural production efficiency. Among these measures, the leasing of agricultural land is particularly advantageous for facilitating the transfer of land to farmers with higher productivity, thereby reducing the misallocation of land resources, which contributes to an improvement in agricultural productivity [36]. An empirical study in the southern Jiangsu region of China revealed that a 1% increase in agricultural land leasing led to a 0.267% reduction in resource misallocation and a subsequent 1.087% increase in ATFP [30]. Additionally, the construction of highways has been instrumental in promoting the flow of agricultural production materials and advanced technologies, aiding in the enhancement of TFP in non-main production areas by reducing resource misallocation [37]. Furthermore, the adjustment of agricultural industrial structure [38], unrestricted movement of agricultural factors [39] and digital transformation [40] can also alleviate the phenomenon of resource misallocation, thereby improving agricultural production efficiency. However, the specific AGTFP losses incurred by resource misallocation have not been thoroughly examined in the existing research.
The scholarly inquiry into resource misallocation centers on its interplay with external factors. This research is predominantly categorized into two dimensions. One avenue of research focuses on elucidating the impact of resource misallocation. The explorations in this domain encompass different industries [41,42], the environment [43,44], energy utilization [45,46], and economic development [47,48]. Specifically, the misallocation of resources among farmers is identified as a pivotal factor in diminishing total agricultural productivity [41]. A study has revealed a negative correlation between the misallocation of enterprise maturity and the digital transformation of enterprises [42]. Furthermore, land resource misallocation exacerbates environmental pollution within regions and their vicinities [43,44], and it also exerts a substantial adverse effect on energy efficiency [45]. Moreover, the misallocation of research and development resources has contributed to an increase in energy intensity [46]. Resource misallocation is widely recognized as a barrier to socio-economic growth, as evidenced by its impact on the marine economy [47] and manufacturing industry Total Factor Productivity (TFP) [48]. The second strand of research delves into the examination of the drivers of resource misallocation. Scholars have probed into the influence of external factors on resource misallocation, such as environmental regulations [49], internet development [50,51,52], artificial intelligence [53], and the opening of high-speed railways [54], all of which can enhance resource allocation. It is observed that, in contrast to energy scarcity, environmental regulations can more effectively address the issue of energy surplus [49]. Moreover, with the rapid advancement of the internet, regional innovation capabilities have been bolstered, and industrial structures have been upgraded, thereby facilitating the reduction of resource misallocation in local and neighboring areas [50]. Concurrently, digital inclusive finance, shaped by financing constraints and technological innovation, has mitigated regional resource misallocation [51,52]. Additionally, artificial intelligence has ameliorated the problem of labor misallocation caused by an aging population [53]. Furthermore, the impact of high-speed rail openings on resource misallocation varies based on the size of different cities [54].
In summary, quite a lot research has been conducted on AGTFP, with the primary focus being on the examination of its spatiotemporal disparities and the influence factors. Currently, a limited number of studies have investigated the influence of resource misallocation on AGTFP. Moreover, scant research has been conducted to quantify the specific losses caused by resource misallocation and the impact on AGTFP. Amidst the successive establishment of global carbon emission reduction targets, the advancement of low-carbon agriculture has become an essential imperative. Energy stands as the primary substance contributing to carbon emissions. Agricultural energy misallocation suggests a low level of efficiency in its usage, resulting in energy wastage that hinders efforts to decrease carbon emissions. Furthermore, prior research quantifying AGTFP losses has often overlooked energy consumption as an undesirable output, thereby diminishing the objectivity and comprehensiveness of the findings. The North China region is a pivotal agricultural production area in China, with immense implications for the country’s overall development. Endowed with a distinctive geographical position and favorable climatic conditions, it is rich in arable land and is categorized as having a temperate monsoon climate. This singular blend of natural resources confers inherent benefits that spur agricultural advancement, propelling farming practices in harmony with global agricultural trends towards increased modernization and mechanization. Yet, despite these advantages, the North China region confronts specific challenges, including water scarcity, environmental pollution, and extreme climate conditions [55,56,57]. The misallocation of agricultural resources compounds these challenges, which severely constrain agricultural productivity and pose threats to social stability and food security. Consequently, investigating AGTFP losses and their underlying causes in North China holds significant practical value, as it aids in enhancing regional agricultural production efficiency and ensuring stable and secure food provision.
Therefore, melding the perfect competition model with the Hsieh and Klenow framework, we have selected the North China region as the subject of our investigation. Drawing from the perspectives of energy conservation, emission reduction, and the pursuit of low-carbon growth, we have refined the agricultural production function by incorporating an energy component in addition to the traditional capital and labor inputs. This approach enables us to elucidate the spatiotemporal dynamics of AGTFP. Subsequently, we combine price distortion calculation methods to establish an AGTFP loss model, which clarifies the issue of resource misallocation and the resulting specific AGTFP losses. Throughout the model’s construction, we have embedded energy conservation and emission reduction as critical elements within the framework of agricultural production, paying close attention to the patterns of energy usage in agriculture. Our objective is to delineate strategies for optimizing the distribution of capital, labor, and energy resources, thereby facilitating a shift towards low-carbon practices and enhancing the overall efficiency of agricultural production.

2. Material and Methods

2.1. Study Area

The North China region serves as a critical grain production hub within China, encompassing five provinces and cities: Beijing, Tianjin, Hebei, Shanxi, and Inner Mongolia (Figure 1). This region is primarily characterized by a temperate monsoon climate, featuring distinct four seasons and concurrent rainfall and heat. Among these, Beijing, Tianjin, and Hebei are characterized by flat terrain and relatively fertile soil. The southeastern Loess Plateau in Shanxi is conducive to cultivation, while Inner Mongolia boasts abundant grassland resources, which are advantageous for the development of animal husbandry. Drawing from the data disseminated by the China Statistical Bureau and the Ministry of Water Resources, we have summarized the key challenges confronting agricultural development within the North China region. The cultivated land area in North China accounts for approximately 25% of the country’s total, with a high demand for agricultural water. However, water resources are relatively scarce, comprising only 5% of the national total. In spring, with rapid temperature increases, evaporation is pronounced, while precipitation is limited, and rainstorms are frequent in summer, particularly in low-lying areas with inadequate drainage, leading to drought in spring, waterlogging in summer, and salinization. As of the end of 2022, the total population stood at 1.68 × 10⁸ people, and the agricultural output value reached CNY 1.50 × 10⁴ billion, an increase of 180% from 2006. The proportion of agricultural fossil energy consumption was 58%, signifying significant environmental pressure.
In summary, despite its agricultural production advantages, the North China region faces escalating natural environmental pressures, including water scarcity, environmental pollution, and extreme weather [58,59,60], which present formidable challenges to agricultural production.

2.2. Theoretical Framework

This investigation commences by embracing the framework of the perfect competition model and employs the Hsieh and Klenow model to fashion an agricultural production function that incorporates energy elements. This enhanced function is utilized to compute the factor elasticity coefficients and AGTFP. The perfect competition model represents an idealized economic model, assuming the absence of any market force interference. This implies that producers efficiently allocate resources in accordance with the supply and demand dynamics reflected in market pricing. Within this model, it is conventionally posited that the constant returns to scale, such that expanding the scale of production does not alter the marginal cost per unit produced.
Subsequently, the study applies the theory of factor price distortion to examine instances where resource prices diverge from their marginal costs—a deviation often resultant from market failures, policy interventions, or other extraneous factors. This analysis yields the factor price distortion coefficient, shedding light on the actual misalignment of resources in real-world allocation. Finally, we construct an AGTFP loss model to compare real-world resource allocation against the ideal, thereby quantifying the AGTFP loss attributable to resource misallocation. This is shown in Figure 2.

2.3. Agricultural Production Function

Under the assumption of a perfectly competitive and unified agricultural product market within region i, j provinces ( j = 1 , 2 , , N , N representing the number of provinces in region i) collaborate in the production of identical agricultural products. With the continuous advancement of agricultural mechanization in North China [61,62], the contribution of energy factors to agricultural production has gradually increased [63]. Hence, this research further considers energy inputs alongside the conventional capital, labor, and land inputs in the formulation of the agricultural production function.
Multivariate collinearity tests were conducted on the input factors, and the robustness of the results was verified. Firstly, Stata 16.0 software was employed to conduct the multivariate collinearity analysis, which yielded the VIF values for the input factors (Table 1). The results indicate that the VIF values for labor, energy, and land are all above 10, indicating the presence of significant multivariate collinearity that could compromise the accuracy of the research findings. Notably, the land’s VIF value stands at 27.76, substantially surpassing the values for the other factors, suggesting that land exhibits a particularly acute multicollinearity problem. Secondly, a robustness test was carried out by modifying the sample size. As illustrated in Table 1, when the study period was changed from 2006–2022 to 2006–2019, the elastic coefficients for capital, labor, and energy were 0.16, 0.38, and 0.57, respectively, all of which were statistically significant at the 1% level. Conversely, the elastic coefficient for land was not significant. This implies that the study’s conclusions with a reduced sample size are not robust, suggesting that the model may lack stability. The land factor was disregarded, with the VIF values for capital, labor, and energy all falling below 10, indicating the absence of substantial multivariate collinearity among the input factors. Furthermore, upon narrowing the research timeframe to 2006–2019, the elasticity coefficients for capital, labor, and energy were found to be 0.16, 0.36, and 0.55, respectively, all of which are statistically significant at the 1% confidence level. These results suggest that our research conclusions remain valid, even after modifying the study sample.
Consequently, this study focuses on the input factors of capital (Kij), labor (Lij), and energy (Eij). The agricultural production function in this study is formulated in the Cobb–Douglas form [64,65], as depicted by
Y i j = A i j × K i j α i × L i j β i × E i j ω i
where Y i j denotes the total agricultural output value of province j within region i. A i j represents the AGTFP of province j within region i. α i , β i , and ω i are the elasticity coefficients of the three agricultural input factors—capital, labor, and energy—within region i and province j, respectively. α i + β i + ω i = 1 aligns with the assumption of constant returns to scale.

2.4. Factor Price Distortion

The formula for assessing the distortion of factors such as capital, labor, and energy is as follows [22,66]:
γ K i j = K i j K i / s i j α i j α i ;   γ L i j = L i j L i / s i j β i j β i ;   γ E i j = E i j E i / s i j ω i j ω i
τ K i j = 1 γ K i j 1 ;   τ L i j = 1 γ L i j 1 ;   τ E i j = 1 γ E i j 1
where γ K i j , γ L i j , and γ E i j correspondingly represent the distortion coefficients of capital, labor, and energy prices, respectively. s i j is the proportion of agricultural output in province j of region i relative to the total output in region i. α i = j = 1 n s i j α i j , β i = j = 1 n s i j β i j , ω i = j = 1 n s i j ω i j denotes the weighted contributions of capital, labor, and energy, respectively. τ K i j , τ L i j , and τ E i j signify the distortions of capital, labor, and energy, respectively. When these values exceed zero, they indicate an insufficient allocation of resources; conversely, values below zero signify excess allocation. The absolute values of these coefficients are directly proportional to the degree of factor misallocation.

2.5. The AGTFP Loss Model

In the presence of resource misallocation, the AGTFP is [49,67]:
A i = j = 1 N A i j D I ¯ i D I i j σ 1 1 σ 1
D I i j = ( 1 + τ K i j ) α i j ( 1 + τ E i j ) ω i j ( 1 + τ L i j ) β i j
D I ¯ i = ( 1 + μ ¯ K i L i ) α i j ( 1 + μ ¯ E i L i ) ω i j ( 1 + μ ¯ L i )
where D I i j is the misallocation index of resources in j province within region i. D I ¯ i is the misallocation index of resources in region i. σ is the substitution elasticity of agricultural output, with a value range of 3–10. To obtain a more conservative calculation result, referring to the research of Hsieh and Klenow [68], it will be set to three. Among them,
1 1 + μ ¯ K i L i = j = 1 N ( 1 + τ L i j ) ( 1 + τ K i j ) L i j L i ;   1 1 + μ ¯ E i L i = j = 1 N ( 1 + τ L i j ) ( 1 + τ E i j ) L i j L i ;   1 + μ ¯ L i = j = 1 N ( 1 + τ L i j ) L i j L i
As a benchmark, when resource misallocation is absent, the AGTFP for region i is
A i ¯ = j = 1 N A i j σ 1 1 σ 1
The potential for enhancing agricultural output upon the eradication of resource misallocation in region i is
G T F P A i l o s s = 1 A i A ¯ i
When G T F P A i l o s s = 0 , the allocation of agricultural resources in region i achieves the optimal level. Conversely, when G T F P A i l o s s 0 , province i deviates from the optimal allocation of agricultural resources. The larger G T F P A i l o s s is, the greater the losses incurred.

2.6. Data Sources and Preprocessing

To quantify the AGTFP losses attributable to resource misallocation, it is imperative to ascertain agricultural output, input factors, and their respective elasticity coefficients. Agricultural output is quantified by the aggregate agricultural output value, with data drawn from the China Rural Statistical Yearbook (2003–2023). Capital input is measured in terms of the stock of agricultural fixed capital, which is determined using the perpetual inventory method [23,69]. This involves the selection of agricultural fixed assets investment (both rural and urban), the agricultural GDP index, and depreciation rate data. The rural fixed assets investment is sourced from the China Rural Statistical Yearbook (2003–2023), while the urban fixed assets investment and agricultural GDP index are obtained from the China Statistical Yearbook (2003–2023). The depreciation rate is based on the summary of depreciation rates compiled by Wu et al. [70].
Labor input is represented by the number of primary industry employees, which is sourced from the statistical yearbooks of various provinces and cities from 2003 to 2020, as well as the China Statistical Yearbook (2021–2023). The energy input is expressed by agricultural energy consumption, which derived from the China Energy Statistical Yearbook (2003–2023). The elasticity coefficients of the factors are determined, and the agricultural production function is preprocessed by taking the logarithm of both sides of equation (1), subsequently establishing provincial panel data for Ordinary Least Squares (OLS) regression analysis. The results are statistically significant at the 1% level, and the coefficients are normalized to sum to 1, adhering to the constraint of unchanged agricultural scale returns. As depicted in Table 2, the elasticity coefficients for capital, labor, and energy are 0.3, 0.26, and 0.61, respectively, indicating that in the agricultural production process, the importance of energy and labor factors exceeds that of capital factors.

3. Results

3.1. Agricultural Green Total Factor Productivity

Having ascertained the elasticity coefficients for capital, labor, and energy in this study, Formula (1) was employed to calculate the AGTFP for the provinces and cities under the jurisdiction of North China. Subsequently, linear fitting was conducted on the data. The analysis revealed that the coefficient of determination (R2) was within the range of 0.7 to 1.0, indicating a satisfactory fit. Consequently, the evolution trend and linear fitting line of AGTFP were plotted (Figure 3) to elucidate the temporal characteristics of AGTFP. Moreover, based on the annual average value and growth rate of AGTFP, the spatial disparities and the rate of change of AGTFP were determined.
Subsequently, utilizing the agricultural input–output data from North China (Table 3), this study delves into the underlying causes for the spatiotemporal variations in AGTFP. Specifically, from 2006 to 2022, the agricultural output value in Beijing decreased by only 0.7%, whereas the growth rates of agricultural output value in the other four provinces and cities were all positive. This observation suggests that a reduction in input factors correlates with an improvement in resource utilization. Conversely, an increase in input factors is associated with a decline in resource utilization, which is a predominant factor influencing the dynamic shifts in AGTFP. Regarding spatial disparities, substantial differences in agricultural output values are evident among different provinces and cities. For instance, in the process of agricultural production, Hebei and Beijing exhibit differences in the allocation of capital, labor, and energy. Hebei’s annual averages are as follows: capital at CNY 37.5 × 10⁸, labor at 1314.0 × 104 individuals, and energy at 356.7 × 10⁴ t. In contrast, Beijing’s averages are CNY 23.4 × 10⁸ for capital, 49.9 × 10⁴ individuals for labor, and 53.4 × 10⁴ t for energy. Concerning the unit input–output efficiency, Hebei’s annual averages are 155.2 for capital, CNY 4.4 × 10⁴ per person for labor, and CNY 15.5 × 10⁴ per ton for energy. Beijing’s corresponding averages are 14.1 for capital, CNY 6.9 × 10⁴ per person for labor, and CNY 6.8 × 10⁴ per ton for energy. These data underscore the disparities in efficiency between the two regions, with Hebei exhibiting higher unit input–output efficiency for capital and energy compared to Beijing, while Beijing holds an advantage in labor efficiency over Hebei. Consequently, the spatial discrepancies in AGTFP cannot be solely attributed to the quantity of input factors.
As depicted in Figure 3, the overall AGTFP of various provinces and cities in North China has shown an upward trend, signifying enhanced efficiency in agricultural production and a rise in the level of sustainable development. For instance, the AGTFP in Hebei Province increased from 9.12 in 2006 to 27.79 in 2022, with a linear fitting line slope of 0.77, suggesting a consistently improving level of sustainable agricultural development and promising prospects. Despite this positive trend, the AGTFP in various provinces and cities experienced a declining trend during the research period, primarily attributed to a decrease in the output efficiency per unit of input factors. This phenomenon underscores the issue of irrational factor input in the agricultural development process. Fortunately, the duration of this decrease was relatively brief. The years of decline were Beijing in 2007 and 2014–2016; Tianjin in 2007 and 2017; Hebei in 2011, 2015, and 2017; Shanxi in 2008 and 2016–2017; and Inner Mongolia in 2009, 2014–2015, and 2017, signifying the resilience and rapid recovery capacity of the agricultural production system. Taking Beijing as an example, in 2007, the AGTFP in Beijing decreased by 1.2% year-on-year, primarily due to a 4.6% increase in energy input. From 2014 to 2016, it decreased from 8.39 to 7.69, attributed to the requirement for agricultural production to consume more input factors to sustain the original yield.
The regional disparities and growth rates of AGTFP in the North China region are substantial. As illustrated in Figure 4, the AGTFP, from highest to lowest, is as follows: Hebei, Inner Mongolia, Tianjin, Beijing, and Shanxi, with average annual values of 14.89, 9.36, 8.47, 7.42, and 6.79, respectively. Hebei Province boasts the highest AGTFP, which is attributed to the efficient utilization of energy in the local agricultural production process. Under similar agricultural output value conditions, energy consumption in Hebei is notably lower than in other provinces and cities. Additionally, Hebei Province exhibits a rapid growth rate of 204.9% in AGTFP, driven by a 176.6% increase in the agricultural output value and a 49.9% decrease in capital investment, along with improvements in labor productivity. Inner Mongolia’s high AGTFP is a result of the judicious utilization of local energy resources and the swift reduction in reliance on capital in agricultural production, leading to a substantial increase in AGTFP with a growth rate of 263.0%. Tianjin’s AGTFP is relatively high, predominantly driven by high levels of agricultural labor productivity. However, a 47.4% increase in local energy consumption has resulted in the slowest improvement rate of AGTFP, with a growth rate of only 108.1%. Beijing’s AGTFP is relatively low, with agricultural production constrained by limited effective land resources, necessitating increased fixed capital investment in agriculture. Moreover, the gradual rise in agricultural energy consumption has also contributed to a sluggish growth rate of AGTFP. Shanxi, under the dual suppression of agricultural labor productivity and energy utilization, exhibits the lowest AGTFP. Nevertheless, with a 331.6% increase in agricultural output value, capital consumption decreased by 47.5%. This dynamic illustrates the fastest increase in AGTFP.
Overall, Hebei’s agricultural sector has demonstrated efficient energy usage and a rising return on capital, which collectively pave the way for a more optimized use of resources. Furthermore, the substantial increase in AGTFP in Hebei and Inner Mongolia reflects technological advancements and enhanced productivity, marking an important manifestation in the journey towards agricultural modernization. In contrast, the relatively lower AGTFP in Beijing and Shanxi provinces is challenged by resource limitations and escalating energy needs. To address these disparities, it is imperative to develop tailored strategies that align with the provincial AGTFP dynamics within the North China region, thereby promoting a more balanced and comprehensive advancement of agriculture.

3.2. Distortion Coefficient of Input Factors

This study is grounded in agricultural input–output data and input factor elasticity coefficients for various provinces in North China from 2006 to 2022. Formulas (2) and (3) are employed to quantify the distortions of capital, labor, and energy factors. Subsequently, utilizing Matlab R2021a software, the Mann–Kendall (MK) trend test is conducted to ascertain the UF value of input factor distortion. As evidenced in Table 4, there are substantial discrepancies in the distortions of agricultural input factors among different provinces and cities.
In Beijing, the degree of misallocation between capital and labor is the most pronounced, while the degree of energy misallocation is relatively modest. The annual average distortions of capital, labor, and energy in agricultural production input factors are −0.85, 0.82, and −0.27, respectively. The degree of capital distortion has diminished from −0.76 in 2006 to −0.93 in 2022, exacerbating the issue of excessive capital allocation. Its UF value shifted from zero to negative between 2006 and 2022, marking the onset of capital surplus growth that can result in wasteful capital investment and diminished production efficiency. Post-2008, it fell outside the confidence interval and continued to decline, signifying a significant and sustained increase in capital surplus. The degree of labor distortion and energy distortion evolved from 1.62 and −0.37 in 2006 to 0.24 and −0.34 in 2022, respectively. Following 2006, the UF value of labor distortion remained negative, indicating a gradual alleviation of labor shortages. The UF value of energy distortion remained positive, with energy surpluses gradually diminishing. It exited the confidence intervals in 2008 and 2010, respectively, reflecting a significant improvement trend in labor shortages and energy surpluses, and the overall direction of resource utilization was positive. Such developments contribute to enhanced agricultural production efficiency and lower energy usage, which is of profound importance for the modernization and sustainability of agriculture.
In Tianjin, the degree of capital misallocation is relatively low, while the degree of labor misallocation is high and the degree of energy misallocation is relatively low. The annual average distortions of capital, labor, and energy are 0.12, 0.65, and −0.38, respectively. Throughout the research period, the distortion of capital in Tianjin decreased from 0.57 to −0.06, with its UF value remaining below zero post-2006, suggesting the onset of improvements in capital insufficient alleviation. In 2009, it fell outside the confidence interval and continued to decline, indicating a significant and strengthening downward trend in capital shortages. This suggests an enhancement in the rationality of capital allocation, albeit with a slight capital over-allocation. However, the degree of labor distortion initially decreased and then increased, declining from 0.95 to 0.86 from 2006 to 2016. Its UF value continued to decrease from 0 to −2.72 from 2006 to 2013, signifying a significant and increasing downward trend in labor shortages. Although its UF value was less than zero from 2013 to 2016, its absolute value gradually decreased, indicating that the downward trend of labor shortages was slowing down. Subsequently, the degree of labor distortion gradually increased to 1.65 in 2022. From 2017 to 2022, the UF value continued to rise from 0 to 1.65, indicating that the phenomenon of insufficient labor distribution gradually intensified, with 2017 as the turning point, which could negatively affect agricultural production, particularly as labor demand intensifies. The degree of energy distortion decreased from −0.20 in 2006 to −0.59 in 2022, a reduction of 199%. Its UF value decreased from 0 to −1.51 from 2006 to 2017. Although the trend of energy surpluses is increasing, it is not significant. In 2018, its UF value was below −1.96 and continued to decline, indicating a significant upward trend in energy surpluses and an increasingly unreasonable energy allocation. The intensified trend of energy surplus could result in wasteful energy use and corresponding environmental challenges (e.g., air pollution, ecological degradation) and is not conducive to the sustainable use of energy resources.
In Hebei, the degree of capital misallocation is high, the degree of labor misallocation is the lowest, and the degree of energy misallocation is the highest. The distortions of capital, labor, and energy have consistently been positive, with average annual values of 0.43, 0.06, and 0.68, respectively. The degree of capital distortion, from 2006 to 2008, was 0.47, 0.50, and 0.48, with UF values of 0, 1, and 0.51, respectively. This indicates an upward trend in capital insufficiency during the same period, with a deceleration in the growth rate in 2008. Subsequently, the fluctuation in capital distortion decreased to 0.39 in 2022, and its UF value turned negative and continued to decline, suggesting an improvement in the capital shortage issue. In 2014 and 2018–2022, the UF value was below the critical value of −1.96, indicating a significant improvement in capital distortion. The degree of labor distortion fluctuated from 0.06 in 2006 to 0.08 in 2021—an increase of 27.7%. Its UF value alternates between positive and negative and rapidly rose to 0.65 in 2022, indicating that the magnitude of changes in labor shortage is substantial and unpredictable. Throughout the research period, the energy distortion and its UF value fluctuated from 1.02 and 0 to 0.68 and −1.90, respectively, suggesting a decreasing trend in energy shortage, which became pronounced over time and effectively mitigated the issue of insufficient energy allocation. It can be observed that the issues of insufficient capital and energy allocation are gradually improving, which is advantageous for boosting agricultural production efficiency. Nevertheless, attention needs to be paid to evolve the dynamics of labor allocation to diminish labor distortion and alleviate its limiting impact on agricultural progress.
In Shanxi, the degree of capital and labor misallocation is relatively low, whereas the degree of energy misallocation is relatively high. The annual average distortions of capital, labor, and energy are 0.22, −0.44, and −0.40, respectively. The growth rate of capital distortion is as high as 1491%. From 2006 to 2008, it was −0.03, −0.14, and −0.11, respectively, with UF values of 0, −1, and −0.52. Despite the downward trend in capital surplus, the growth rate has decelerated. In 2009, the degree of capital distortion and its UF value turned positive and continued to rise, indicating a shift from excess to insufficient capital allocation. Concurrently, it displayed a gradually increasing and pronounced upward trend, suggesting that while capital allocation is relatively reasonable, its rationality has rapidly diminished. The labor distortion and the energy distortion has consistently been negative, changing from −0.53 and −0.65 in 2006 to −0.38 and −0.39 in 2022, respectively. The UF value of labor distortion has fluctuated between positive and negative, exhibiting an unstable trend. In recent years, it rapidly decreased to 1.07 in 2022, indicating that the overall labor shortage phenomenon intensified. The UF value of the energy distortion degree has been greater than zero (except in 2008), and the energy surplus has generally shown a downward trend. From 2011 to 2022, the confidence interval was broken, indicating a significant downward trend. This suggests that energy allocation is gradually becoming more rational. The alleviation of energy surplus in Shanxi can catalyze sustainable agricultural advancement, yet it remains need to mitigate the adverse effects of misallocation of capital and labor on agricultural productivity.
Inner Mongolia exhibits the lowest degree of capital and energy misallocation, with a relatively lower degree of labor distortion. The annual averages of capital, labor, and energy distortions are 0.05, 0.18, and −0.23, respectively. The degree of capital distortion and its UF value have markedly escalated from −0.11 and 0 in 2006 to 0.21 and 4.78 in 2022, respectively. Following 2012, the degree of capital distortion exceeded zero, indicating a transition from excess to insufficient capital allocation. After effectively resolving the issue of capital surplus, the phenomenon of capital shortage has resurfaced, manifesting an increasingly pronounced upward trend. Efforts should be directed towards improving capital investment, seeking to minimize capital wastage while circumventing the constraints imposed by capital shortage on agricultural production. During the research period, the degree of labor distortion was positive, with a growth rate of 10.4%. Since 2006, the UF value has consistently exceeded zero, surpassing the critical value of 1.96 from 2019 to 2022, signifying an escalating upward trend in labor shortage and a gradual intensification of the problem of inadequate labor allocation. The issue of inadequate labor allocation is gradually exacerbating, complicating agricultural structural adjustments and impeding the advance of agricultural modernization. In contrast, the energy distortion degree is negative, ranging from −0.18 to −0.35 from 2006 to 2017, with the UF value shifting from 0 to −2.33. This period witnessed a gradual rise in energy surplus. Despite the UF value being above −1.96 from 2017 to 2020, the absolute value diminished, indicating a deceleration in the upward trend of energy surplus. the UF values were to 0.36 and 0.66 in 2021–2022, suggesting a nascent improvement in the energy surplus phenomenon suggesting an improvement in the overall energy surplus trend. This development is advantageous for reducing energy consumption costs and enhancing agricultural production efficiency.

3.3. Misallocation Degree of Agricultural Resources

To address the issue of distortion in input factors, which assume negative values, and to preclude any potential numerical direction interference from affecting our computational outcomes, this investigation adopts the methodologies proposed in previous studies [52,71,72]. Specifically, we have implemented an absolute value transformation on the input factor distortion. Utilizing Equations (5) and (6), we computed the extent of agricultural resource misallocation for North China and its constituent provinces over the period 2006 to 2022 (presented in Table 5). Subsequently, we generated MK trend diagrams (Figure 5).
The existence of agricultural resource misallocation in North China has slightly improved over time. Table 5 reveals that the average annual agricultural resource misallocation index for North China is 0.934, with a decline rate of −0.6%. While there has been an enhancement in allocation efficiency, there remains potential for further advancement. Between 2006 and 2008, the index decreased from 0.96 to 0.91, and the UF value exhibited a continuous decline from 0 to −1.57, signifying a gradual reduction in the degree of agricultural resource misallocation. Subsequently, there was a temporary fluctuation, peaking at 0.19 in 2011, with the UF value shifting from zero to a positive value but slightly decreasing. This pattern suggests that, although the level of agricultural resource misallocation increased, the rate of this increase showed a weakening trend. From 2011 to 2022, the index further declined from 0.19 to −1.15, with the UF value turning negative and continuing its downward trajectory. Throughout the study period, the UF value consistently remained within the confidence interval, indicating that the improvement effect of agricultural resource misallocation was not notably significant. This reflects the inefficient use of agricultural resources, resulting in unnecessary resource wastage and increased production expenses. Such practices are detrimental to the advancement of sustainable agricultural development.
When examining the spatial differentiation characteristics, the agricultural resource misallocation among provinces in North China is observed to follow a descending order: Beijing > Hebei > Tianjin > Shanxi > Inner Mongolia. The respective average annual misallocation indices are 1.461, 1.461, 1.406, 1.390, and 1.196. The severe resource misallocation in Beijing can be attributed to the disproportionate distribution of local capital and labor, with average annual distortions of −0.85 and 0.82, respectively. This indicates that Beijing’s resource allocation imposes constraints on the agricultural economy, thereby diminishing agricultural production efficiency. Hebei province experiences a relatively high degree of resource misallocation, primarily due to the inadequate allocation of capital and energy, with average annual distortions of 0.43 and 0.68, respectively. This suggests that Hebei has considerable scope for enhancing its resource allocation, and such optimization could stimulate growth in agricultural development. In contrast, Tianjin and Shanxi exhibit a relatively lower degree of resource misallocation, which is correlated with their more efficient energy allocation. The average annual energy distortion is as low as −0.38 and −0.40, respectively. This underscores the beneficial impact of effective energy allocation on the enhancement of agricultural benefits. Inner Mongolia has the least resource misallocation, with an average annual capital distortion of merely 0.05, indicating an overall improvement in the level of resource allocation. This is critically important for the sustained growth of Inner Mongolia’s agricultural economy.
When analyzing the dynamic changes in agricultural resource misallocation among provinces and cities in North China, three patterns emerge: fluctuating decline, smooth change, and a trend of initial decline followed by an increase. This reflects the adjustment and optimization process of resource allocation efficiency in different provinces. Beijing, Hebei, and Shanxi exhibit a fluctuating downward trend. Between 2006 and 2022, the agricultural resource misallocation index for these regions decreased from 1.68, 1.64, and 1.52 to 1.37, 1.46, and 1.38, respectively. The corresponding UF values were predominantly negative and continued to decline, indicating a progressively strengthening downward trend in agricultural resource misallocation that has positively influenced agricultural output. This is attributed to an 85% reduction in labor distortion in Beijing and a 33% and 40% decrease in energy distortion in Hebei and Shanxi, respectively, which have enhanced labor productivity and energy utilization levels, facilitating the gradual rectification of the irrational distribution of agricultural resources and boosting agricultural production efficiency. Tianjin follows an initial decline followed by an increase trend. Influenced by energy utilization in agricultural production, the agricultural resource misallocation index decreased from 1.41 in 2006 to 1.37 in 2015. The UF value declined from 0 to −2.44 between 2006 and 2011, signifying a continuous reduction in agricultural resource misallocation. Although the UF value remained negative from 2011 to 2015, it increased gradually, indicating a weakening downward trend. After 2016, as a turning point (UF = 0), the agricultural resource misallocation index and its UF value rose to 1.57 and 2.97 in 2022, respectively, reflecting a distinct upward trend in the degree of misallocation and a gradual decline in allocation efficiency, which challenges agricultural development. Inner Mongolia exhibits a smooth change trend, with the growth rate of agricultural resource misallocation was 0.3%, and its UF value was generally within the confidence interval. This suggests the improvement of agricultural resource misallocation was modest, suggests, which is not conducive to the long-term agricultural economy and its sustainable development.

3.4. AGTFP Loss and Sensitivity Text in North China

Building upon the comprehension of AGTFP, input factor distortion, and resource misallocation in North China, this investigation integrates an AGTFP loss model to quantify the GTFP loss in the region. Furthermore, MK trend testing was employed to determine the UF value associated with AGTFP loss. Subsequently, sensitivity analyses were conducted by varying the inputs of capital, labor, and energy to corroborate the findings of this study.
North China experiences losses in AGTFP, and these losses show a trend of decline. As depicted in Figure 6, the AGTFP loss in North China over the study period ranged between 0.29 and 0.38, indicating that resource allocation has not achieved optimality. Consequently, if rational resource allocation were attained, eliminating the misallocation in agricultural production, the AGTFP in North China could potentially increase by at least 29%. Such a development would spur increases in both agricultural yield and productivity. From 2006 to 2021, the AGTFP loss fluctuated from 0.35 to 0.30, representing an approximate decrease of 19%. This suggests an overall increase in the rationality of agricultural resource allocation, which has led to a decrease in the occurrence of resource wastage and a reduction in AGTFP losses and promoted sustainable agricultural development.
The progression of AGTFP losses in North China can be divided into four stages. Initially, there was a brief upsurge (2006–2008), with losses fluctuating between 0.35 and 0.37 and the UF value increasing from 0 to 0.52. This increase in AGTFP loss was associated with a decline in the level of agricultural resource allocation, leading to an increase in production costs and limited improvement in agricultural production efficiency. For instance, from 2006 to 2008, Inner Mongolia experienced a surplus in labor allocation, with a distortion increase of 101%, leading to a reduction in labor productivity. Similarly, Tianjin faced insufficient energy allocation, with a distortion decrease of 35%, resulting in lower energy utilization levels, both of which constrained the growth of agricultural benefits.
The second stage was characterized by a gradual decline (2008–2014), with losses decreasing from 0.37 to 0.33 (a mere 11% decrease), indicating a reduction in AGTFP losses. The UF value turned negative after 2008 and reached −0.21 in 2014. Although the UF value was below zero, its absolute value decreased, suggesting a diminishing trend in AGTFP losses, albeit with a weakening momentum, which can slowly contribute to the improvement of agricultural production efficiency. This was primarily due to more reasonable resource allocation in various provinces in North China (excluding Inner Mongolia) in 2009, leading to a relatively rapid decrease in AGTFP losses, with a year-on-year reduction of 20%. However, after 2009, the rationality of resource allocation waned, causing a slowdown in the downward trend of AGTFP losses.
The third stage witnessed a steep increase (2014–2019), with the UF value turned positive, accompanied by a sustained increase in AGTFP losses. This was attributed to the progressive decline in the allocation level of input factors in Tianjin, Shanxi, and Inner Mongolia, which undermined the efficiency of resource allocation in North China. For example, the energy distortion degree in Tianjin decreased from −0.29 to −0.56 in 2014–2019, and the capital distortion degree in Inner Mongolia continuously increased from 0.03 to 0.15, with insufficient resource allocation limiting agricultural development. In the fourth stage (2019–2022), the AGTFP loss declined from 0.33 to 0.29, with a growth rate of −9%. This was primarily due to the rapid improvement in the level of agricultural resource allocation in various provinces in North China, providing impetus for the growth of the agricultural economy and promoting efficient and sustainable agricultural development.
In conclusion, although the evolution trend of AGTFP loss in North China does not directly correlate with the dynamics of resource misallocation in the region, the AGTFP loss model reveals that it is influenced by two primary factors: the degree of resource misallocation in North China and its constituent provinces.
To further delineate specific strategies for improvement, sensitivity experiments were conducted. These experiments involved adjustments to factor allocation as follows: a 5% reduction in capital investment in Beijing from 2006 to 2022; a 5% decrease in Tianjin from 2018 to 2019 and 2022, with a 5% increase in other years; a 5% increase in Hebei from 2006 to 2022; a 5% decrease in Shanxi from 2006 to 2008 followed by a 5% increase from 2009 to 2022; and a 5% decrease in Inner Mongolia from 2006 to 2011 followed by a 5% increase from 2012 to 2022. Over the study period, Shanxi experienced an annual decrease of 5% in labor input, while other provinces in North China increased by 5%, and the annual energy input in all provinces and cities except Hebei was reduced by 5%, with Hebei experiencing a 5% increase.
The resulting changes in AGTFP for Beijing, Tianjin, Hebei, Shanxi, and Inner Mongolia were recorded as sensitivity tests 1, 2, 3, 4, and 5, respectively, with comparisons made between the pre- and post-adjustment AGTFP. As illustrated in Figure 6, Tianjin’s AGTFP exhibited an upward trend from 2006 to 2019, accompanied by a decrease in AGTFP losses in 2020 and 2021, with respective reductions of −0.06 and −0.13. This can be attributed to the capital distortion of 0.004 during the same period, which approximated reasonable allocation. Tianjin in 2022 and Hebei in 2021 registered a decrease in AGFP, which is attributed to insufficient adjustments in the experimental treatment of input factors, resulting in the absence of an upward trend in AGTFP. The AGTFP of other provinces also showed yearly improvements, corroborating the earlier analysis of agricultural factor allocation.

3.5. Predictive Analysis

Given the modest sample size employed in this study, the GM (1,1) model is well-suited for predictive analysis. Moreover, the reliability of the GM (1,1) model’s predictions diminishes with longer forecast horizons. Consequently, this study leveraged the findings from 2006 to 2022 to forecast the AGTFP, the extent of resource misallocation, and the AGTFP losses in the North China region for the subsequent decade (as depicted in Figure 7). The outcomes of the residual tests predominantly fell below 20%, suggesting that the model’s predictive performance is good.
In the North China region, there has been a consistent rise in AGTFP, a general downward trend in resource misallocation, and a gradual reduction in AGTFP losses. As depicted in Figure 7, from 2023 to 2032, the AGTFP across different provinces and cities in the North China region is projected to experience varying levels of improvement. For instance, the AGTFP in Tianjin is anticipated to grow by 52% over the next decade. Concurrently, the resource misallocation index in the region is expected to decrease by 2%, indicating a slight alleviation of the issue of irrational resource allocation. From a provincial standpoint, with the exception of Tianjin, where the agricultural resource misallocation index has been on the rise, leading to a growing trend of resource misallocation, the agricultural resource misallocation index in other provinces has been consistently declining, suggesting an uptick in resource allocation efficiency. Furthermore, due to the improvement in the rationality of resource allocation, the AGTFP loss in the North China region has gradually decreased from 0.29 in 2022 to 0.28—a 4% reduction. It is worth noting that over the course of a decade, the misallocation of resources and the loss of AGTFP have exhibited only a slight downward trend.

4. Discussion

4.1. Comparison of Results

The principal objective of this research is to precisely quantify the losses in AGTFP attributable to resource misallocation, expanding upon previous investigations into the spatiotemporal variations of AGTFP and the direction and magnitude of the effects of such misallocation. Our focus on the North China region is deliberate, recognizing its distinctive natural endowments that favor agricultural growth and its strategic role as a major grain-producing hub. The agricultural practices in this area mirror the general shift towards modernization, yet they are not immune to the challenges of resource misallocation and environmental contamination that are widespread across other regions. Consequently, we proceed on the premise of a perfect competitive agricultural market, and by synthesizing the computational outcomes of the Hsieh and Klenow model with the principles of price distortion theory, we have developed a model to quantify the losses in AGTFP. This model is designed to primarily assess the AGTFP levels and the extent of resource misallocation within the North China region, while also accounting for the specific AGTFP losses incurred due to such misallocation. Of note is the significant enhancement of AGTFP in the North China region, marked by distinct variations in growth rates and overall performance across its provinces and cities. Despite the marginal easing of resource misallocation, the reduction of AGTFP losses in this region is projected to be a challenging endeavor in the immediate future.
Our initial discovery reveals that the AGTFP in the North China region exhibits an overall upward trend, marked by pronounced regional disparities. This observation is in consonance with the findings on China’s provincial AGTFP by Liu et al. [64] and Yang et al. [18]. Furthermore, this result offers validation to the conclusions regarding corn GTFP across China’s top 20 corn-producing provinces, as established by Deng et al. [12]. Significantly, agricultural resources exhibit different degrees of misallocation, with no clear trend of mitigation emerging overall. This result is consistent with the research of Adamopoulos et al. [34] and Li et al. [73]. A subset of studies has been dedicated to examining the direction and intensity of the influence that resource misallocation exerts on agricultural production efficiency [30,35]. In our study, we further quantified the specific AGTFP loss that caused by the misallocation of agricultural resources. The findings of this study reveal that the AGTFP loss within the North China region falls within a significant range of 29% to 38%, and the observed decline trend is not markedly significant. Additionally, between the years 2023 and 2032, there will be a mere 1% reduction in the loss of AGTFP. Consequently, there is an imperative need to refine resource allocation strategies continuously. This is intended to accelerate the reduction of losses in AGTFP, which is crucial for fostering the sustainable advancement of agriculture.

4.2. Theoretical Contribution

This research has made some contributions to existing theories concerning the judicious exploitation of agricultural resources and the pursuit of sustainable agricultural development. A pivotal contribution is the integration of energy as an undesirable output into the agricultural production function, enabling the quantification of AGTFP levels and the severity of resource misallocation. Building upon this, the study meticulously quantifies the specific losses in AGTFP resulting from resource misallocation. Simultaneously, this study found resource misallocation to be an important factor impacting the AGTFP. Building upon prior research, this study delves into the specific AGTFP losses resulting from resource misallocation in the North China region from both theoretical and empirical standpoints. Throughout the quantification process, the study integrates agricultural energy consumption into the research framework, thereby bolstering the scientificalness and precision of the findings. Our analysis revealed that AGTFP in the North China region exhibits notable regional disparities, with an overall slow uptick. Nevertheless, the improvement effect of resource misallocation is not pronounced. Consequently, AGTFP losses in this region continues to rise at a rapid pace. If efforts to enhance resource allocation and mitigate misallocation are not intensified alongside the pursuit of higher AGTFP, the potential for AGTFP loss to rise is considerable. Such a scenario would present agriculture with a more daunting set of challenges for sustainable development.

4.3. Limitations and Future Prospects

This study conducted a quantitative examination of the misallocation of agricultural resources within the North China region and its subsequent impact on AGTFP loss. However, the research is subject to certain limitations: Firstly, efforts should be made to extend the exploration to the AGTFP loss attributable to agricultural resource misallocation in additional regions. Our analysis, which constructs an agricultural production function by integrating the perfectly competitive model with the HK model, is specifically tailored to the North China region. Applying this model directly to other areas might result in the elasticity coefficients lacking statistical significance. Consequently, future research should refine input factors based on the unique characteristics of each region to guarantee that the calculated results are robust and significant. In the second instance, this investigation has been conducted with a macroscopic lens, focusing on the provincial level. Subsequent research endeavors also should be directed towards assessing the misallocation of resources and its consequent impact on AGTFP loss at more micro levels, including cities and counties. Finally, our scholarly work has been conducted within the confines of the perfectly competitive model, thereby neglecting the distortions introduced by market power—such as economic monopolies and product differentiation. This approach represents a simplification of the research methodology. In addition, to guarantee the robustness and precision of our regression outcomes, we have elected to exclude the land indicator, which exhibited severe multicollinearity. Consequently, it is imperative that future iterations of the model account for market distortions, incorporate additional control variables, conduct potential endogeneity examinations, and assess the influence of land input metrics. This approach will enable our findings to align more closely with the realities of the agricultural sector.

5. Conclusions and Policy Recommendations

5.1. Conclusions

To quantify the extent of resource misallocation in the North China region and its implications for AGTFP losses, this investigation incorporates three key indicators—capital, labor, and energy—into the foundational Cobb–Douglas function. Furthermore, it integrates a methodology for calculating factor price distortion to construct a comprehensive AGTFP loss model. Utilizing this model, the study computes the AGTFP for various provinces in North China over the period from 2006 to 2022, along with the associated AGTFP losses attributable to resource misallocation. Furthermore, the GM (1,1) model is employed to forecast the trends in AGTFP, resource misallocation, and AGTFP losses for the North China region spanning the years 2023 to 2032. The following conclusions are drawn:
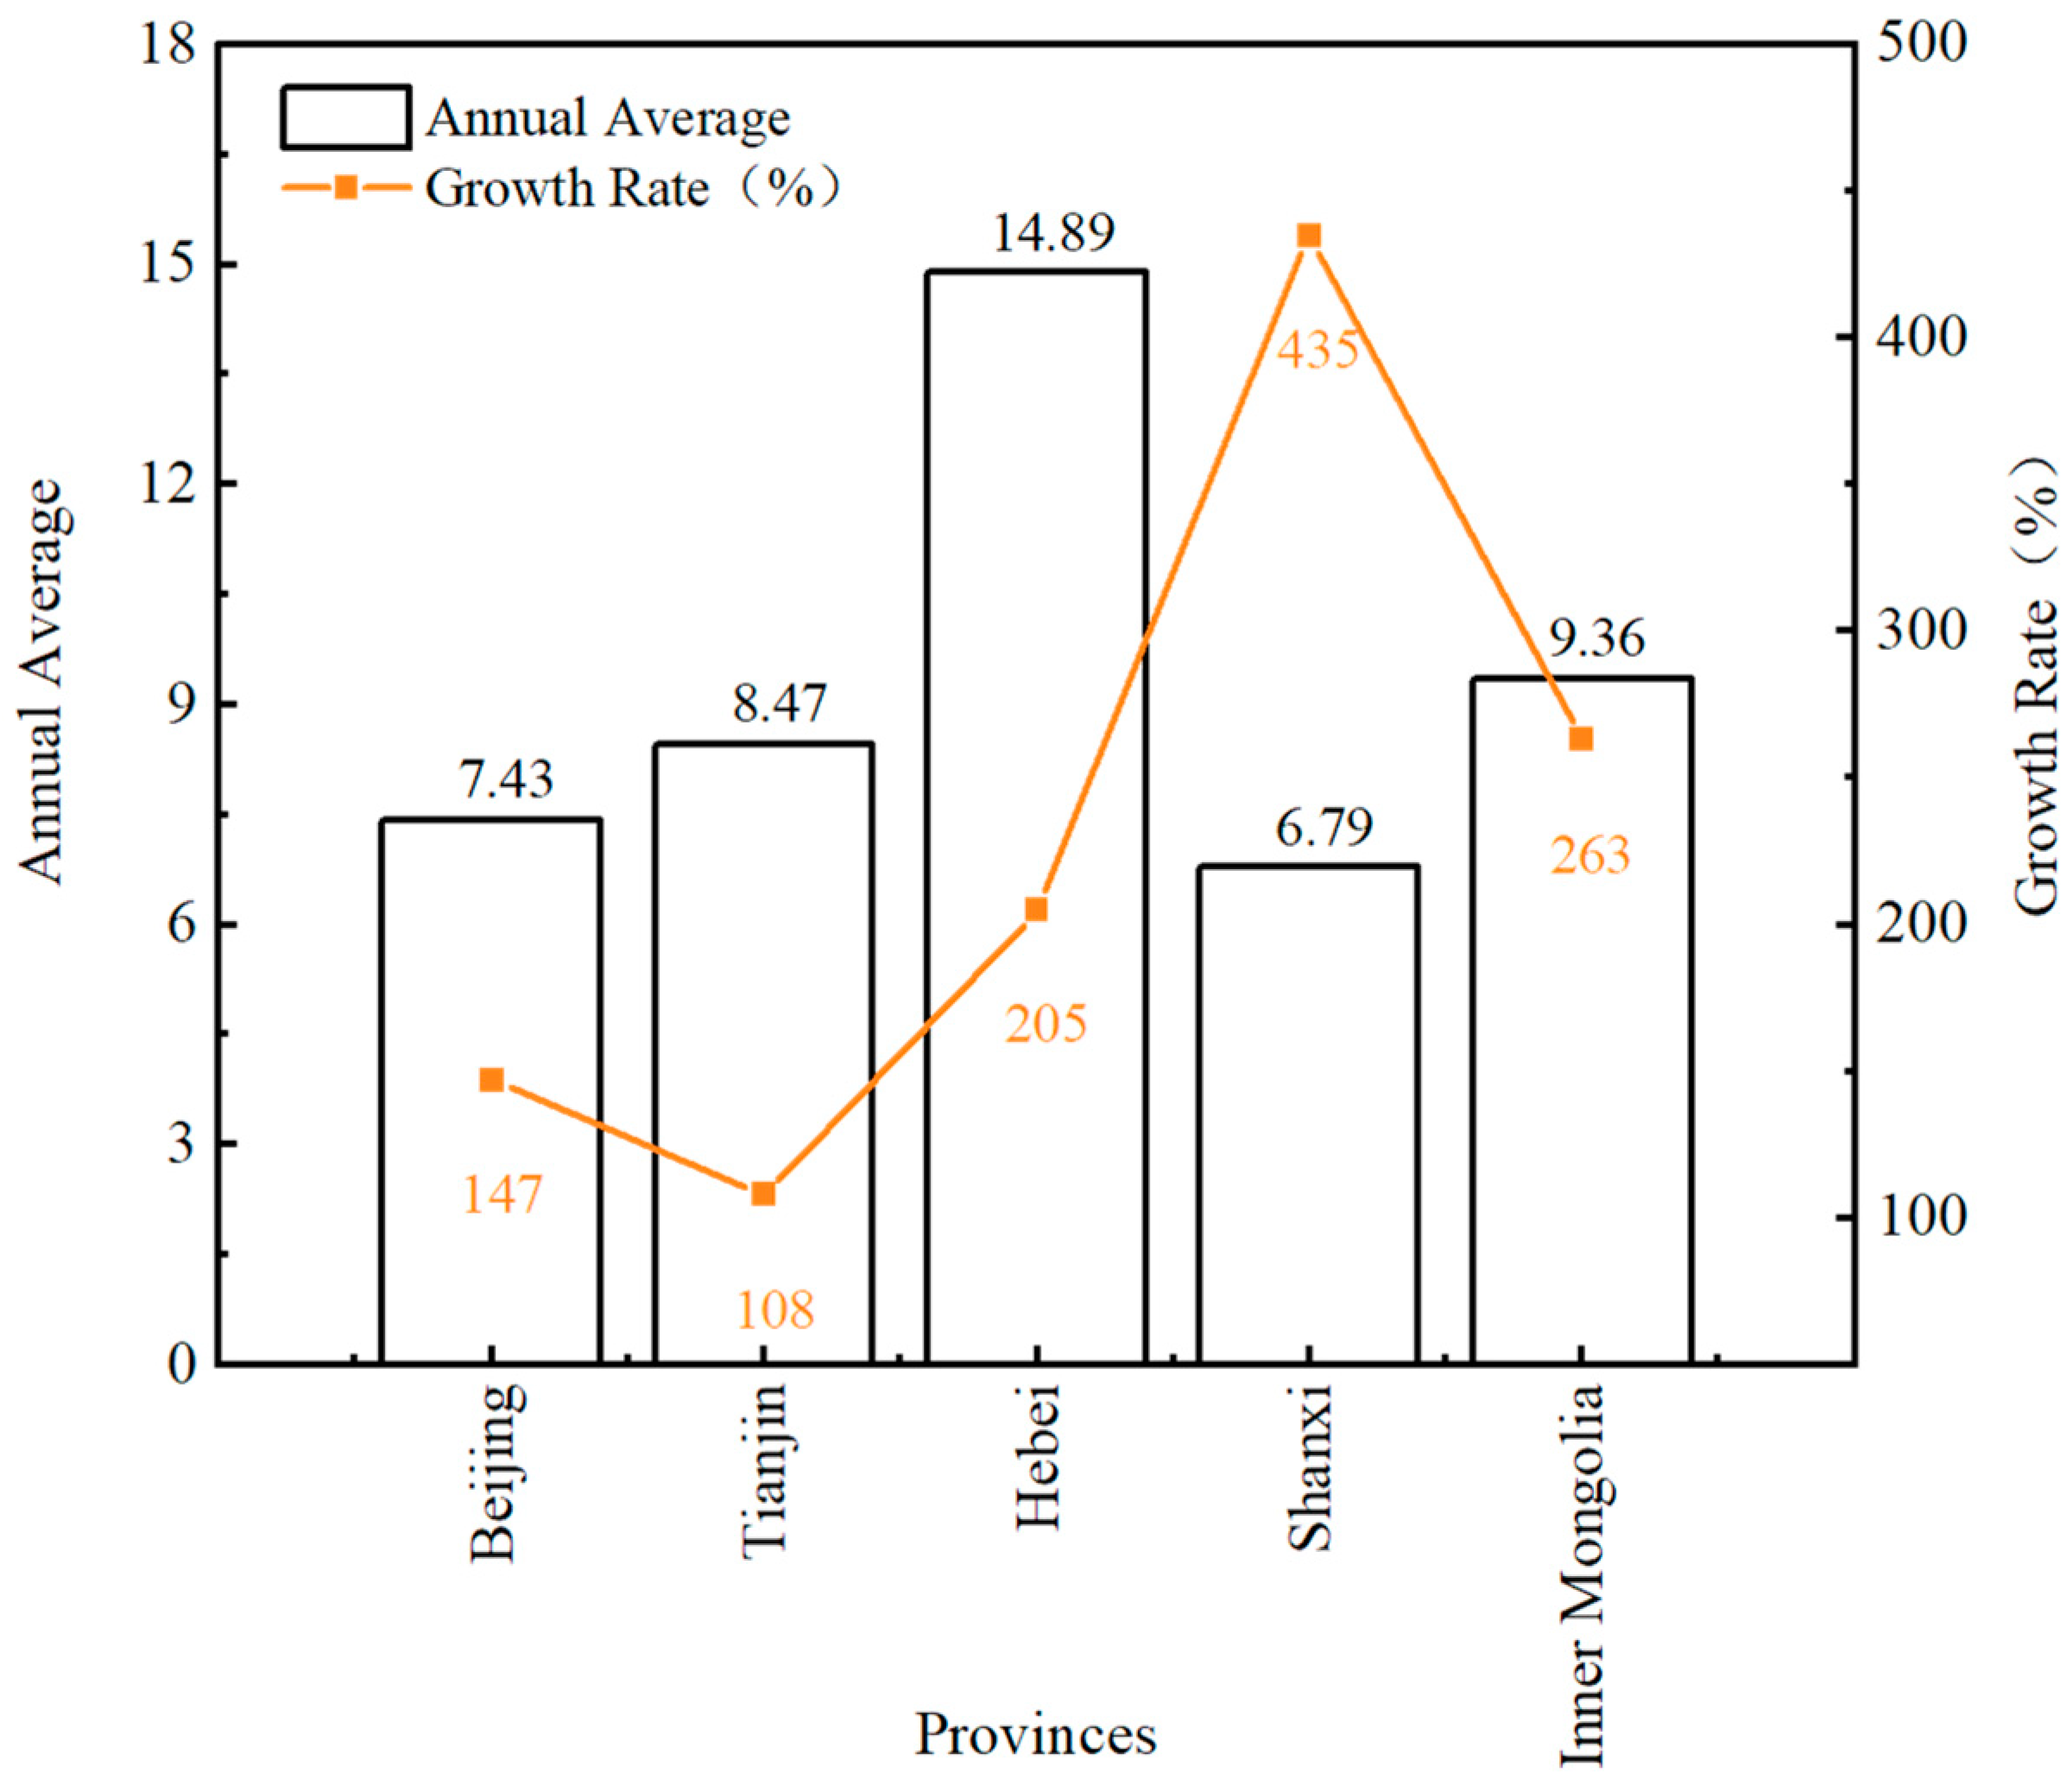
  • The AGTFP across North China exhibits an upward trend, with different effectiveness in advancing sustainable agricultural practices among the provinces. The descending order of growth rate is Shanxi, Inner Mongolia, Hebei, Beijing, and Tianjin. The enhancing AGTFP is predominantly attributed to the phenomenon where the growth in agricultural output value is inversely related to the level of investment, such that lower investment corresponds to a more pronounced increase in AGTFP. Furthermore, closing the resource utilization gap is of paramount importance for the enduring sustainability of agriculture. Variations in resource utilization efficiency among the provinces contribute to substantial regional disparities in AGTFP. The annual average AGTFP, from highest to lowest, is as follows: Hebei, Inner Mongolia, Tianjin, Beijing, and Shanxi.
  • The North China region needs to advance the optimization of resource allocation to align with the imperatives of sustainable agricultural development. With respect to capital distortion, Beijing exhibits the highest levels, which are worsening over time. Hebei also registers high levels but is experiencing a continuous decline. Shanxi, on the other hand, has lower levels yet demonstrates a clear trend of deterioration. Tianjin has relatively low levels and is showing continuous improvement, while Inner Mongolia has the lowest levels but is experiencing a gradual increase. In terms of labor distortion, Beijing and Shanxi have the highest and relatively high levels, respectively, which suggest room for further improvement. Tianjin also has relatively high labor distortion, whereas Hebei and Inner Mongolia are relatively low, with Inner Mongolia showing a long-term exacerbation. Regarding energy distortion, Hebei has the highest levels, which are gradually decreasing. Shanxi also has high levels, Inner Mongolia has the lowest, and Beijing has the lowest levels with trends of continuous improvement. Tianjin has relatively low energy distortion, but in recent years, it has displayed an increasingly unreasonable trend.
  • The misallocation of agricultural resources in North China is influenced by the level and change rate in resource allocation, manifesting a distinct spatiotemporal differentiation pattern. Temporally, there is an overall declining trend, with the provinces exhibiting three patterns: fluctuating decline, fluctuating rise, and initial decline followed by an increase. Spatially, the pattern is characterized by a gradient from highest to lowest, with Beijing at the top, followed by Hebei, Tianjin, Shanxi, and Inner Mongolia.
  • With an optimized allocation of agricultural production factors, the AGTFP in North China could potentially realize an additional increase of 29% to 38%, with substantial significance for sustainable agricultural development. Dynamically, AGTFP losses in the region slightly declined. Moreover, projections indicate that during the coming ten-year period, due to the minimal alleviation of resource misallocation, the reduction in AGTFP loss in the North China region will not be significant.

5.2. Policy Recommendations

(1)
To enhance the rationality of capital investment and advance agricultural modernization, it is imperative to address capital misallocation, which intensifies AGTFP losses. Adequate and judicious financial support is pivotal to the realization of agricultural modernization, encompassing objectives such as ensuring the quality of agricultural products, harnessing the economic value of agricultural heritage resources, and meeting market demands for diverse agricultural offerings. The phenomenon of capital surplus is particularly pronounced in Beijing, escalating in severity. The allocation of capital in Inner Mongolia and Shanxi is transitioning from surplus to shortfall, with the shortage becoming increasingly pronounced. Consequently, it is incumbent upon policymakers to prioritize the optimization of agricultural capital utilization in Beijing. Concurrently, capital investment in Inner Mongolia and Shanxi should be proactively adjusted to minimize the squandering of resources in agricultural activities, while also preventing the issue of restricted agricultural production due to insufficient capital.
(2)
To alleviate barriers to labor mobility and enhance labor productivity, it is crucial to address the constraints that limit agricultural employment opportunities, leading to diminished economic returns. The prevalent trend of rural populations seeking employment outside of agriculture has exacerbated issues such as agricultural labor shortages and the abandonment of farmlands. Strategies such as attracting high-tech talent and fostering new professional farmers can bolster the expansion of agricultural employment opportunities and foster economies of scale. In North China, the allocation of labor across various provinces is inadequate, with Beijing experiencing the most severe misallocation and Tianjin ranking second, with the issue becoming increasingly pronounced in recent years. Labor shortages in Hebei and Inner Mongolia have surged rapidly. Consequently, it is imperative to augment agricultural benefits and employment opportunities, prioritize addressing labor shortages in Beijing and Tianjin, and proactively mitigate labor misallocation challenges in Hebei and Inner Mongolia.
(3)
To optimize the energy consumption structure and enhance energy utilization levels, it is essential to recognize the evolving trend of increased energy input as agricultural mechanization advances. This transition can be effectively managed through research and development and the introduction and application of clean energy sources, thereby reducing reliance on traditional energy forms such as coal. This approach is pivotal for achieving sustainable agricultural development. In Hebei Province, the allocation of energy is inadequate, leading to the highest degree of misallocation, which has been escalating in recent years. Conversely, Tianjin has an excessive allocation of energy, with this issue rapidly intensifying. By strategically adjusting energy inputs—increasing in Hebei and decreasing in Tianjin—the current state of unreasonable energy utilization can be ameliorated.

Author Contributions

L.C. Conceptualization, Methodology, Formal analysis, Software, Investigation, Data curation, Writing—original draft, Editing. H.S. Methodology, Data curation, Investigation. S.Z. Methodology, Data curation, Writing—review and editing. S.J. Article embellishment, Conceptualization, Formal analysis. X.Z. Software operation, Formal analysis. J.C. Supervision, Writing—review and editing, Formal analysis, Methodology, Software operation, Funding acquisition, Project administration. All authors have read and agreed to the published version of the manuscript.

Funding

This research was funded by the National Key Research and Development Program of China, grant number 2022YFC3703705, and the Hubei International Science and Technology Cooperation Project, grant number 2024EHA041.

Institutional Review Board Statement

Not applicable.

Informed Consent Statement

Not applicable.

Data Availability Statement

Data will be made available on request.

Conflicts of Interest

The authors declare that they have no known competing financial interests or personal relationships that could have appeared to influence the work reported in this paper.

References

  1. Wang, W.; Li, K.; Liu, Y.; Lian, J.; Hong, S. A system dynamics model analysis for policy impacts on green agriculture development: A case of the Sichuan Tibetan Area. J. Clean. Prod. 2022, 371, 133562. [Google Scholar] [CrossRef]
  2. Baylis, K.; Peplow, S.; Rausser, G.; Simon, L. Agri-environmental policies in the EU and United States: A comparison. Ecol. Econ. 2008, 65, 753–764. [Google Scholar] [CrossRef]
  3. Otsuka, K.; Kijima, Y. Technology policies for a green revolution and agricultural transformation in Africa. J. Afr. Econ. 2010, 19 (Suppl. S2), ii60–ii76. [Google Scholar] [CrossRef]
  4. Du, Y.; Liu, H.; Huang, H.; Li, X. The carbon emission reduction effect of agricultural policy—Evidence from China. J. Clean. Prod. 2023, 406, 137005. [Google Scholar] [CrossRef]
  5. Sun, B.; Zhang, L.; Yang, L.; Zhang, F.; Norse, D.; Zhu, Z. Agricultural non-point source pollution in China: Causes and mitigation measures. Ambio 2012, 41, 370–379. [Google Scholar] [CrossRef] [PubMed]
  6. Wang, S.; Wang, Y.; Wang, Y.; Wang, Z. Assessment of influencing factors on non-point source pollution critical source areas in an agricultural watershed. Ecol. Indic. 2022, 141, 109084. [Google Scholar] [CrossRef]
  7. Xue, J.; Wang, Q.; Zhang, M. A review of non-point source water pollution modeling for the urban–rural transitional areas of China: Research status and prospect. Sci. Total Environ. 2022, 826, 154146. [Google Scholar] [CrossRef]
  8. Lu, Y.; Jenkins, A.; Ferrier, R.C.; Bailey, M.; Gordon, I.J.; Song, S.; Huang, J.; Jia, S.; Zhang, F.; Liu, X.; et al. Addressing China’s grand challenge of achieving food security while ensuring environmental sustainability. Sci. Adv. 2015, 1, e1400039. [Google Scholar] [CrossRef]
  9. Ye, F.; Yang, Z.; Yu, M.; Watson, S.; Lovell, A. Can market-oriented reform of agricultural subsidies promote the growth of agricultural green total factor productivity? Empirical evidence from maize in China. Agriculture 2023, 13, 251. [Google Scholar] [CrossRef]
  10. Chen, Y.; Miao, J.; Zhu, Z. Measuring green total factor productivity of China’s agricultural sector: A three-stage SBM-DEA model with non-point source pollution and CO2 emissions. J. Clean. Prod. 2021, 318, 128543. [Google Scholar] [CrossRef]
  11. Huang, X.; Feng, C.; Qin, J.; Wang, X.; Zhang, T. Measuring China’s agricultural green total factor productivity and its drivers during 1998–2019. Sci. Total Environ. 2022, 829, 154477. [Google Scholar] [CrossRef]
  12. Deng, H.; Zheng, W.; Shen, Z.; Streimikiene, D. Does fiscal expenditure promote green agricultural productivity gains: An investigation on corn production. Appl. Energy 2023, 334, 120666. [Google Scholar] [CrossRef]
  13. Zhong, S.; Li, Y.; Li, J.; Yang, H. Measurement of total factor productivity of green agriculture in China: Analysis of the regional differences based on China. PLoS ONE 2021, 16, e0257239. [Google Scholar] [CrossRef]
  14. Ruzic, D.; Ho, S.J. Returns to Scale, Productivity, Measurement, and Trends in US Manufacturing Misallocation. Rev. Econ. Stat. 2023, 105, 1287–1303. [Google Scholar] [CrossRef]
  15. Zhang, Q.; Dong, W.; Wen, C.; Li, T. Study on factors affecting corn yield based on the Cobb-Douglas production function. Agric. Water Manag. 2020, 228, 105869. [Google Scholar] [CrossRef]
  16. Yao, S.; Xie, R.; Han, F.; Zhang, Q. Labor market distortion and air pollution: An empirical analysis based on spatial effect modeling. J. Environ. Manag. 2023, 337, 117743. [Google Scholar] [CrossRef] [PubMed]
  17. Liu, S.; Lei, P.; Li, X.; Li, Y. A nonseparable undesirable output modified three-stage data envelopment analysis application for evaluation of agricultural green total factor productivity in China. Sci. Total Environ. 2022, 838, 155947. [Google Scholar] [CrossRef]
  18. Yang, Y.; Ma, H.; Wu, G. Agricultural green total factor productivity under the distortion of the factor market in China. Sustainability 2022, 14, 9309. [Google Scholar] [CrossRef]
  19. Zhou, X.; Chen, T.; Zhang, B. Research on the impact of digital agriculture development on agricultural green total factor productivity. Land 2023, 12, 195. [Google Scholar] [CrossRef]
  20. Shi, X.; Li, L. Green total factor productivity and its decomposition of Chinese manufacturing based on the MML index: 2003–2015. J. Clean. Prod. 2019, 222, 998–1008. [Google Scholar] [CrossRef]
  21. Wang, H.; Cui, H.; Zhao, Q. Effect of green technology innovation on green total factor productivity in China: Evidence from spatial durbin model analysis. J. Clean. Prod. 2021, 288, 125624. [Google Scholar] [CrossRef]
  22. Hu, S.; Lu, S.; Zhou, H. Public investment, environmental regulation, and the sustainable development of agriculture in China based on the decomposition of green total factor productivity. Sustainability 2023, 15, 1123. [Google Scholar] [CrossRef]
  23. Huang, J.; Cai, X.; Huang, S.; Tian, S.; Lei, H. Technological factors and total factor productivity in China: Evidence based on a panel threshold model. China Econ. Rev. 2019, 54, 271–285. [Google Scholar] [CrossRef]
  24. Jia, X. Digital economy, factor allocation, and sustainable agricultural development: The perspective of labor and capital mis-allocation. Sustainability 2023, 15, 4418. [Google Scholar] [CrossRef]
  25. Shen, Y.; Guo, X.; Zhang, X. Digital financial inclusion, land transfer, and agricultural green total factor productivity. Sustainability 2023, 15, 6436. [Google Scholar] [CrossRef]
  26. Gao, Q.; Cheng, C.; Sun, G.; Li, J. The impact of digital inclusive finance on agricultural green total factor productivity: Evidence from China. Front. Ecol. Evol. 2022, 10, 905644. [Google Scholar] [CrossRef]
  27. Tang, M.; Cao, A.; Guo, L.; Li, H. Improving agricultural green total factor productivity in China: Do environmental governance and green low-carbon policies matter? Environ. Sci. Pollut. Res. 2023, 30, 52906–52922. [Google Scholar] [CrossRef] [PubMed]
  28. Yu, Z.; Mao, S.; Lin, Q. Has China’s carbon emissions trading pilot policy improved agricultural green total factor productivity? Agriculture 2022, 12, 1444. [Google Scholar] [CrossRef]
  29. Wang, F.; Wang, H.; Liu, C.; Xiong, L.; Kong, F. Does economic agglomeration improve agricultural green total factor productivity? Evidence from China’s Yangtze river delta. Sci. Prog. 2022, 105, 00368504221135460. [Google Scholar] [CrossRef]
  30. Zhang, X.; Hu, L.; Yu, X. Farmland Leasing, misallocation Reduction, and agricultural total factor Productivity: Insights from rice production in China. Food Policy 2023, 119, 102518. [Google Scholar] [CrossRef]
  31. Muñoz, D.R.; Cabrales, A.; Sanchez, A. Central Banks and Climate Change (Part 2). Can Central Banks Intervene Now? And How? Arguments of “Opportunity” and “Suitability”. Bus. Financ. Law Rev. 2022, 6, 260. [Google Scholar]
  32. Markovits, R.S. The Causes and Policy Significance of Pareto Resource misallocation: A Checklist for Micro-Economic Policy Analysis. Stanf. Law Rev. 1975, 28, 1. [Google Scholar] [CrossRef]
  33. Shenoy, A. Market failures and misallocation. J. Dev. Econ. 2017, 128, 65–80. [Google Scholar] [CrossRef]
  34. Adamopoulos, T.; Brandt, L.; Leight, J.; Restuccia, D. Misallocation, selection, and productivity: A quantitative analysis with panel data from China. Econometrica 2022, 90, 1261–1282. [Google Scholar] [CrossRef]
  35. Lei, S.; Yang, X.; Qin, J. Does agricultural factor misallocation hinder agricultural green production efficiency? Evidence from China. Sci. Total Environ. 2023, 891, 164466. [Google Scholar] [CrossRef] [PubMed]
  36. Chari, A.; Liu, E.M.; Wang, S.Y.; Wang, Y. Property rights, land misallocation, and agricultural efficiency in China. Rev. Econ. Stud. 2021, 88, 1831–1862. [Google Scholar] [CrossRef]
  37. Zhou, Z.; Duan, J.; Geng, S.; Li, R. The role of highway construction in influencing agricultural green total factor productivity in China: Agricultural industry structure transformation perspective. Front. Sustain. Food Syst. 2024, 7, 1315201. [Google Scholar] [CrossRef]
  38. Hong, M.; Tian, M.; Wang, J. Digital inclusive finance, agricultural industrial structure optimization and agricultural green total factor productivity. Sustainability 2022, 14, 11450. [Google Scholar] [CrossRef]
  39. Chen, X.; Song, Z.; Deng, H. Land market distortion and agricultural green total factor productivity: Provincial-level evidence from China. Econ. Res.-Ekon. Istraživanja 2023, 36, 2158482. [Google Scholar] [CrossRef]
  40. Jiang, W.; Li, J. Digital Transformation and Its Effect on Resource Allocation Efficiency and Productivity in Chinese Corpo-rations. Technol. Soc. 2024, 102638. [Google Scholar] [CrossRef]
  41. Wei, C.; Li, C.Z. Resource misallocation in Chinese manufacturing enterprises: Evidence from firm-level data. J. Clean. Prod. 2017, 142, 837–845. [Google Scholar] [CrossRef]
  42. Hu, Y.; Che, D.; Wu, F.; Chang, X. Corporate maturity misallocation and enterprise digital transformation: Evidence from China. Financ. Res. Lett. 2023, 53, 103677. [Google Scholar] [CrossRef]
  43. Du, W.; Li, M. The impact of land resource misallocation and land marketization on pollution emissions of industrial enterprises in China. J. Environ. Manag. 2021, 299, 113565. [Google Scholar] [CrossRef]
  44. Zhang, M.; Tan, S.; Pan, Z.; Hao, D.; Zhang, X.; Chen, Z. The spatial spillover effect and nonlinear relationship analysis between land resource misallocation and environmental pollution: Evidence from China. J. Environ. Manag. 2022, 321, 115873. [Google Scholar] [CrossRef] [PubMed]
  45. Zhou, D.; Hu, Y.; Sun, Q.; Xie, D. Land resource misallocation and energy efficiency: Evidence from 243 cities in China. Energy Policy 2023, 183, 113800. [Google Scholar] [CrossRef]
  46. Cheng, C.; Zhou, H.; Yan, X.; Xin, F.; Zhou, Q.; Qian, C.; Guo, L. Research and development factor misallocation, production losses, and energy efficiency: A study on Chinese regional economies. J. Clean. Prod. 2024, 449, 141718. [Google Scholar] [CrossRef]
  47. Sun, C.; Liang, Z.; Zhai, X.; Wang, L. Obstacles to the development of China’s marine economy: Total factor productivity loss from resource mismatch. Ocean. Coast. Manag. 2024, 249, 107009. [Google Scholar] [CrossRef]
  48. Zhang, S.; Luo, J.; Huang, D.H.; Xu, J. Market distortion, factor misallocation, and efficiency loss in manufacturing enterprises. J. Bus. Res. 2023, 154, 113290. [Google Scholar] [CrossRef]
  49. Xu, J.; Qin, Y.; Xiao, D.; Li, R.; Zhang, H. The impact of industrial land misallocation on carbon emissions in resource-based cities under environmental regulatory constraints—Evidence from China. Environ. Sci. Pollut. Res. 2024, 31, 56860–56862. [Google Scholar] [CrossRef]
  50. Wu, H.; Hao, Y.; Ren, S.; Yang, X.; Xie, G. Does internet development improve green total factor energy efficiency? Evidence from China. Energy Policy 2021, 153, 112247. [Google Scholar] [CrossRef]
  51. Hong, X.; Chen, Q.; Wang, N. The impact of digital inclusive finance on the agricultural factor misallocation of agriculture-related enterprises. Financ. Res. Lett. 2024, 59, 104774. [Google Scholar] [CrossRef]
  52. Gu, B.; Liu, J.; Ji, Q. The effect of social sphere digitalization on green total factor productivity in China: Evidence from a dynamic spatial Durbin model. J. Environ. Manag. 2022, 320, 115946. [Google Scholar] [CrossRef] [PubMed]
  53. Zhang, Q.; Su, T.; Zhou, Z. Population aging, artificial intelligence and misallocation of labor resources: Evidence from China. Appl. Econ. 2024, 1–14. [Google Scholar] [CrossRef]
  54. Fang, J.; Fu, F.; Zhang, X.; Yao, S.; Ou, J. Impact of high-speed rail on the misallocation of labor and industry allocations: Evidence from Chinese cities in 2000–2019. J. Asian Econ. 2024, 92, 101744. [Google Scholar] [CrossRef]
  55. Ma, T.; Sun, S.; Fu, G.; Hall, J.W.; Ni, Y.; He, L.; Yi, J.; Zhao, N.; Du, Y.; Pe, T.; et al. Pollution exacerbates China’s water scarcity and its regional inequality. Nat. Commun. 2020, 11, 650. [Google Scholar] [CrossRef] [PubMed]
  56. Cui, X.; Wang, X.; Liu, B. The characteristics of heavy metal pollution in surface dust in Tangshan, a heavily industrialized city in North China, and an assessment of associated health risks. J. Geochem. Explor. 2020, 210, 106432. [Google Scholar] [CrossRef]
  57. Zhang, G.; Zeng, G.; Li, C.; Yang, X. Impact of PDO and AMO on interdecadal variability in extreme high temperatures in North China over the most recent 40-year period. Clim. Dyn. 2020, 54, 3003–3020. [Google Scholar] [CrossRef]
  58. Avila, A.F.D.; Evenson, R.E. Total Factor Productivity Growth in Agriculture: The Role of Technological Capital. In Handbook of Agricultural Economics; Elsevier: Amsterdam, The Netherlands, 2010; Volume 4, pp. 3769–3822. [Google Scholar]
  59. Zhou, Y. Vulnerability and Adaptation to Climate Change in North China: The Water Sector in Tianjin; Hamburg University and Centre for Marine and Atmosphere Science, Research Unit Sustainability and Global Change: Hamburg, Germany, 2004. [Google Scholar]
  60. Piao, S.; Ciais, P.; Huang, Y.; Shen, Z.; Peng, S.; Li, J.; Zhou, L.; Liu, H.; Ma, Y.; Ding, Y.; et al. The impacts of climate change on water resources and agriculture in China. Nature 2010, 467, 43–51. [Google Scholar] [CrossRef]
  61. Pokki, H.; Virtanen, J.; Karvinen, S. Comparison of economic analysis with financial analysis of fisheries: Application of the per-petual inventory method to the Finnish fishing fleet. Mar. Policy 2018, 95, 239–247. [Google Scholar] [CrossRef]
  62. Zhang, J. Estimation of China’s provincial capital stock (1952–2004) with applications. J. Chin. Econ. Bus. Stud. 2008, 6, 177–196. [Google Scholar] [CrossRef]
  63. Wang, Y.; Liu, Y. Measurement and Analysis of the Contribution of Agriculture Agglomeration to the Industry Growth. Sci. Agric. Sin. 2012, 45, 3197–3202. [Google Scholar]
  64. Liu, Y.; Heerink, N.; Li, F.; Shi, X. Do agricultural machinery services promote village farmland rental markets? Theory and evidence from a case study in the North China plain. Land Use Policy 2022, 122, 106388. [Google Scholar] [CrossRef]
  65. Wang, Y.; Jiang, J.; Wang, D.; You, X. Can Mechanization Promote Green Agricultural Production? An Empirical Analysis of Maize Production in China. Sustainability 2022, 15, 1. [Google Scholar] [CrossRef]
  66. Nabuurs, G.J.; Delacote, P.; Ellison, D.; Hanewinkel, M.; Lindner, M.; Nesbit, M.; Ollikainen, M.; Savaresi, A. A New Role for Forests and the Forest Sector in the EU Post-2020 Climate Targets; European Forest Institute: Joensuu, Finland, 2015. [Google Scholar]
  67. Long, L.K. Analyzing technical inefficiency and production risk in aquaculture—The stochastic frontier production function with double heteroskedasticity. Aquac. Econ. Manag. 2024, 28, 681–703. [Google Scholar] [CrossRef]
  68. Hsieh, C.T.; Klenow, P.J. Misallocation and manufacturing TFP in China and India. Q. J. Econ. 2009, 124, 1403–1448. [Google Scholar] [CrossRef]
  69. Yang, M.; Yang, F.; Sun, C. Factor market distortion correction, resource reallocation and potential productivity gains: An empirical study on China’s heavy industry sector. Energy Econ. 2018, 69, 270–279. [Google Scholar] [CrossRef]
  70. Wu, Y. The Role of Productivity in China’s Growth: New Estimates. China Econ. Q. 2008, 7, 827–842. [Google Scholar] [CrossRef]
  71. Tan, R.; Lin, B.; Liu, X. Impacts of eliminating the factor distortions on energy efficiency—A focus on China’s secondary industry. Energy 2019, 183, 693–701. [Google Scholar] [CrossRef]
  72. Kong, Q.; Chen, A.; Wong, Z.; Peng, D. Factor price distortion, efficiency loss and enterprises’ outward foreign direct investment. Int. Rev. Financ. Anal. 2021, 78, 101912. [Google Scholar] [CrossRef]
  73. Li, X.; Zhou, S.; Chen, H. Assessing the Effect of Factor Misallocation on Grain Green Production Capacity: A Case Study of Prefecture-Level Cities in Heilongjiang Province. Agriculture 2024, 14, 1395. [Google Scholar] [CrossRef]
Figure 1. Digital Elevation Model (DEM) and land cover classification map of North China. (Data from: Geospatial Data Cloud and annual China Land Cover Dataset, CLCD).
Sustainability 17 00199 g001
Figure 2. Theoretical framework of the research.
Sustainability 17 00199 g002
Figure 3. Agricultural Green Total Factor Productivity and linear fitting trends in provinces under the North China region, 2006–2022.
Sustainability 17 00199 g003
Figure 4. Annual average and growth rate of Agricultural Green Total Factor Productivity in North China region.
Sustainability 17 00199 g004
Figure 5. Mann–Kendall trend test for the degree of resource misallocation in the North China region.
Sustainability 17 00199 g005
Figure 6. Mann–Kendall trend test and sensitivity analysis outcomes for Agricultural Green Total Factor Productivity loss in North China, 2006–2022.
Sustainability 17 00199 g006
Figure 7. AGTFP, resource allocation inefficiency index, and AGTFP losses in the North China region for the period 2023–2032.
Sustainability 17 00199 g007
Table 1. VIF values and elastic coefficients of agricultural input factors.
CategoryInput FactorsElasticity FactorsVIF
2006–20222006–20192006–2022
(1)K0.19 ***0.16 ***27.8
L0.010.38 **16.1
E0.170.57 ***15.3
M0.50 ***−0.031.5
(2)K0.14 ***0.16 ***8.9
L0.29 ***0.36 ***7.9
E0.66 ***0.55 ***1.4
Note: ***, ** indicate significance at the 1%, 5% levels, respectively.
Table 2. Normalized factor of elasticity.
Input FactorsCapitalLaborEnergy
Elasticity Factors0.130.260.61
P > |t|0.0090.0060.000
Table 3. Agricultural input–output variables by province and municipality in North China, 2006–2022.
ProvincesClassificationAgricultural Output Value (CNY 108)Agricultural Fixed Capital Stock
(CNY 108)
Workers in the Primary Sector (104 pp)Agricultural Energy Consumption (104 t)
BeijingAnnual Average326.623.449.953.4
Growth Rate−0.6%−42.4%−58.5%−63.2%
TianjinAnnual Average389.13.663.671.5
Growth Rate92.4%−44.9%−59.3%47.4%
HebeiAnnual Average5294.137.51314.0356.7
Growth Rate177.6%−49.9%−46.2%29.3%
ShanxiAnnual Average1346.810.7609.5246.7
Growth Rate331.6%−47.5%−35.3%−2.7%
Inner MongoliaAnnual Average2562.424.2548.8373.9
Growth Rate297.5%−49.9%−22.3%50.4%
Table 4. Distortion and uncertainty factor (UF) values of agricultural production input factors in provinces under the jurisdiction of the North China region.
Input FactorsProvincesDistortionUF
2006201120162022Growth
Rate
Annual Average2006201120162022
CapitalBeijing−0.76−0.83−0.87−0.93−23%−0.850.00−2.82−4.28−5.60
Tianjin0.570.090.21−0.06−111%0.120.00−2.82−1.95−4.03
Hebei0.470.430.450.39−17%0.430.00−1.32−1.32−3.63
Shanxi−0.030.240.260.361263%0.220.00−1.322.574.12
Inner Mongolia−0.110.000.030.21298%0.050.00−1.323.194.78
LaborBeijing1.620.900.670.24−85%0.820.00−2.82−3.04−4.77
Tianjin0.950.480.860.83−13%0.660.00−2.82−0.231.65
Hebei0.060.050.080.0828%0.070.00−1.320.700.66
Shanxi0.530.420.44−0.38−28%−0.440.000.93−0.081.07
Inner Mongolia0.120.190.160.1410%0.180.000.560.390.17
EnergyBeijing−0.37−0.25−0.20−0.349%−0.270.002.443.191.40
Tianjin−0.20−0.30−0.28−0.38199%−0.380.00−0.94−1.01−3.63
Hebei1.020.600.560.68−33%0.680.00−1.32−2.88−1.90
Shanxi−0.65−0.37−0.31−0.3940%−0.390.002.073.502.06
Inner Mongolia−0.18−0.28−0.31−0.1623%−0.160.00−1.32−1.950.66
Table 5. Agricultural resource misallocation index in North China and its subordinate provinces, 2006–2022.
RegionsEvolution TrendGrowth RateAnnual Average
North ChinaSustainability 17 00199 i001Fluctuation decline−0.6%0.934
BeijingSustainability 17 00199 i002Fluctuation decline−18%1.461
TianjinSustainability 17 00199 i003First falling-then rising11%1.406
HebeiSustainability 17 00199 i004Fluctuation decline−11%1.461
ShanxiSustainability 17 00199 i005Fluctuation decline−9%1.390
Inner MongoliaSustainability 17 00199 i006Smooth change0.3%1.196
Disclaimer/Publisher’s Note: The statements, opinions and data contained in all publications are solely those of the individual author(s) and contributor(s) and not of MDPI and/or the editor(s). MDPI and/or the editor(s) disclaim responsibility for any injury to people or property resulting from any ideas, methods, instructions or products referred to in the content.

