Abstract
The present research examined the “production–living–ecological space” (“PLES”) by using land use data, the ecological and environmental quality index model, growth and reduction based on the spectrum, the center of gravity migration model, and the optimal parameter geoprobe model to further evaluate adjustments to ecological quality and the driving mechanisms. The findings indicate that (1) spanning the years 2000–2020, the production space and living area in Panjin increased to 2093 km2 and 380 km2 respectively, and the ecological area of forest land and water area showed a decreasing trend. (2) The center of gravity of the urban living space and the industrial and mining production space shifted significantly. (3) The negative effect of the contribution rate was of greater value than the positive effect. Thus, it can be concluded that the negative effect of “PLES” is greater than the positive one. (4) The results for this region showed that the mean annual temperature was the strongest explanation for the spatial variation in natural factors, and that social factors such as population density also had a strong effect, so an interaction analysis was carried out to analyze the interaction between the two factors, which showed that the relationship between mean annual temperature and density of population had the strongest explanatory power.
1. Introduction
The report on “production–living–ecological space (“PLES”)” [1,2] and its general requirements [3,4] were first proposed in the report of the 18th National Congress of the Communist Party of China, which states that the national territory is the carrier of ecological civilization and that every inch of it must be taken care of. “PLES” is an important means to optimize the national territory’s spatial layout and rationalize the development and use of resources. National land is the carrier of ecological civilization construction, and every inch of it must be cherished. The spatial planning of 12 municipalities in Liaoning Province supports the construction of ’six places’ in Liaoning in the new era—a strategic support place, a source of technological innovation, a new highland for the advanced manufacturing industry, a pioneering place for agricultural development, a demonstration place for the integrated development of culture, sports, and tourism as well as a hub for openness and cooperation in Northeast Asia. The plan puts forward the development vision of building “five Panjin” (i.e., ecological green Panjin, petrochemical energy Panjin, open hub Panjin, exquisite and happy Panjin, and reform and innovation Panjin). Due to the growth of China’s building land, the encroachment of farmland, etc., since the reform and opening-up, the divergence within production, ecological, and living spaces has become more pronounced, indicating a trend of uncoordinated development while also contributing to a number of sustainability and environmental problems. For territorial planning and ecologically sustainable construction, it is crucial to research the changes in the “PLES” and how they affect the ecological value.
Although the concept of “PLES” is not explicitly mentioned in Western countries, the idea of “PLES” has been reflected in the land use planning of many countries such as the “linear city”, “organic evacuation theory”, “urban growth boundary”, “garden city”, “green belt control”, and so on. The “PLES” planning has a certain reference value. In 1882, the Spanish engineer Arturo Soria Mata proposed the theory of the linear city, in which the city develops along a high-speed, high-capacity axis that connects existing “point cities” and from there spreads out to form a network of cities spread over a vast countryside [5]. After this, a professor of planning history at Columbia University in the United States based a large amount of literature on the global development of a linear city comb [6], while other scholars have added several historical data on the planning of a ribbon city [7,8]. There are some scholars who widely advocate the concept of the linear city [9]. In the 1940s, some scholars even proposed the concept of ribbon industrial cities, which was an upgrade of the ribbon city theory [10]. British academics proposed the notion of a garden city near the end of the 1800s when they published their monographs, and the following year, that is, described the establishment of the field city association to carry out a variety of activities, and at the same time, attract countries around the world to establish their field city associations [11]. In the United States, the idea of a garden city has promoted the development of suburban residential areas, but also gave birth to neighborhood units, wide acres of cities, and other urban planning ideas and regional planning movements [12]. In 1958, the U.S. government put forward the theory of “urban growth boundary”, the production, living and ecology space for a specific division [13].
Chinese scholars’ investigations on “PLES” have focused on the concept and theoretical basis regarding “PLES” such as classification and identification, functional evaluation, land use transformation, the ecological environment effect, development of spatial and temporal patterns and driving factors, and spatial optimization. For example, using socio-economic data from the National Land Survey, we explored the dynamics of “PLES” and its drivers by applying overlay analysis, spatial autocorrelation analysis, kernel density analysis, and center of gravity migration and detector [14], while the transfer matrix, standard deviation ellipse, kernel density analysis, spatial measurement model were used to explore the emergence of the spatial pattern of the national territory and the driving mechanism [15]. To analyze the land use process of change and the gradient differentiation characteristics of the “PLES”, techniques like change mapping, land transfer matrix, topographic position, and distribution index have been used [16]. The ecological environment has always been a hot topic in the academic world, but only a few studies have analyzed the ecological environment effect by using the ecological environment quality index based on the standpoint of “PLES”. For example, the evolution of land use function features and its impact on the biological environment can be studied using the transfer matrix and other techniques [17]. These papers offer helpful references for this research as well as an empirical basis for examining the dynamics of land use varying over time and space. Nevertheless, describing the mechanisms of reaction between the ecological environment and the evolution of “PLES” is also essential. Thus, to give Panjin a point of reference, this study further investigated the driving causes and connects the emergence of “PLES” with ecological repercussions.
Panjin City, Liaoning Province, is a typical ecological city. Around the 1990s, due to oil and gas exploration in the Liaohe Estuary and the boom in offshore mudflat aquaculture, a large area of natural wetland vegetation in Panjin was destroyed, and the coastal wetland ecosystems were also seriously damaged. Therefore, the study of Panjin has a certain research depth, and this study adopted a transfer matrix, growth and reduction based on the geo-spectrum, and other techniques to analyze the change of “PLES” and the ecological environment effects between 2000 and 2020. This study will help to improve the case study of the ecological impacts of “PLES” in coastal cities and will serve as a foundation and point for the coordinated improvement, environmental protection, and optimization of each region.
2. Methods and Materials
2.1. Study Area
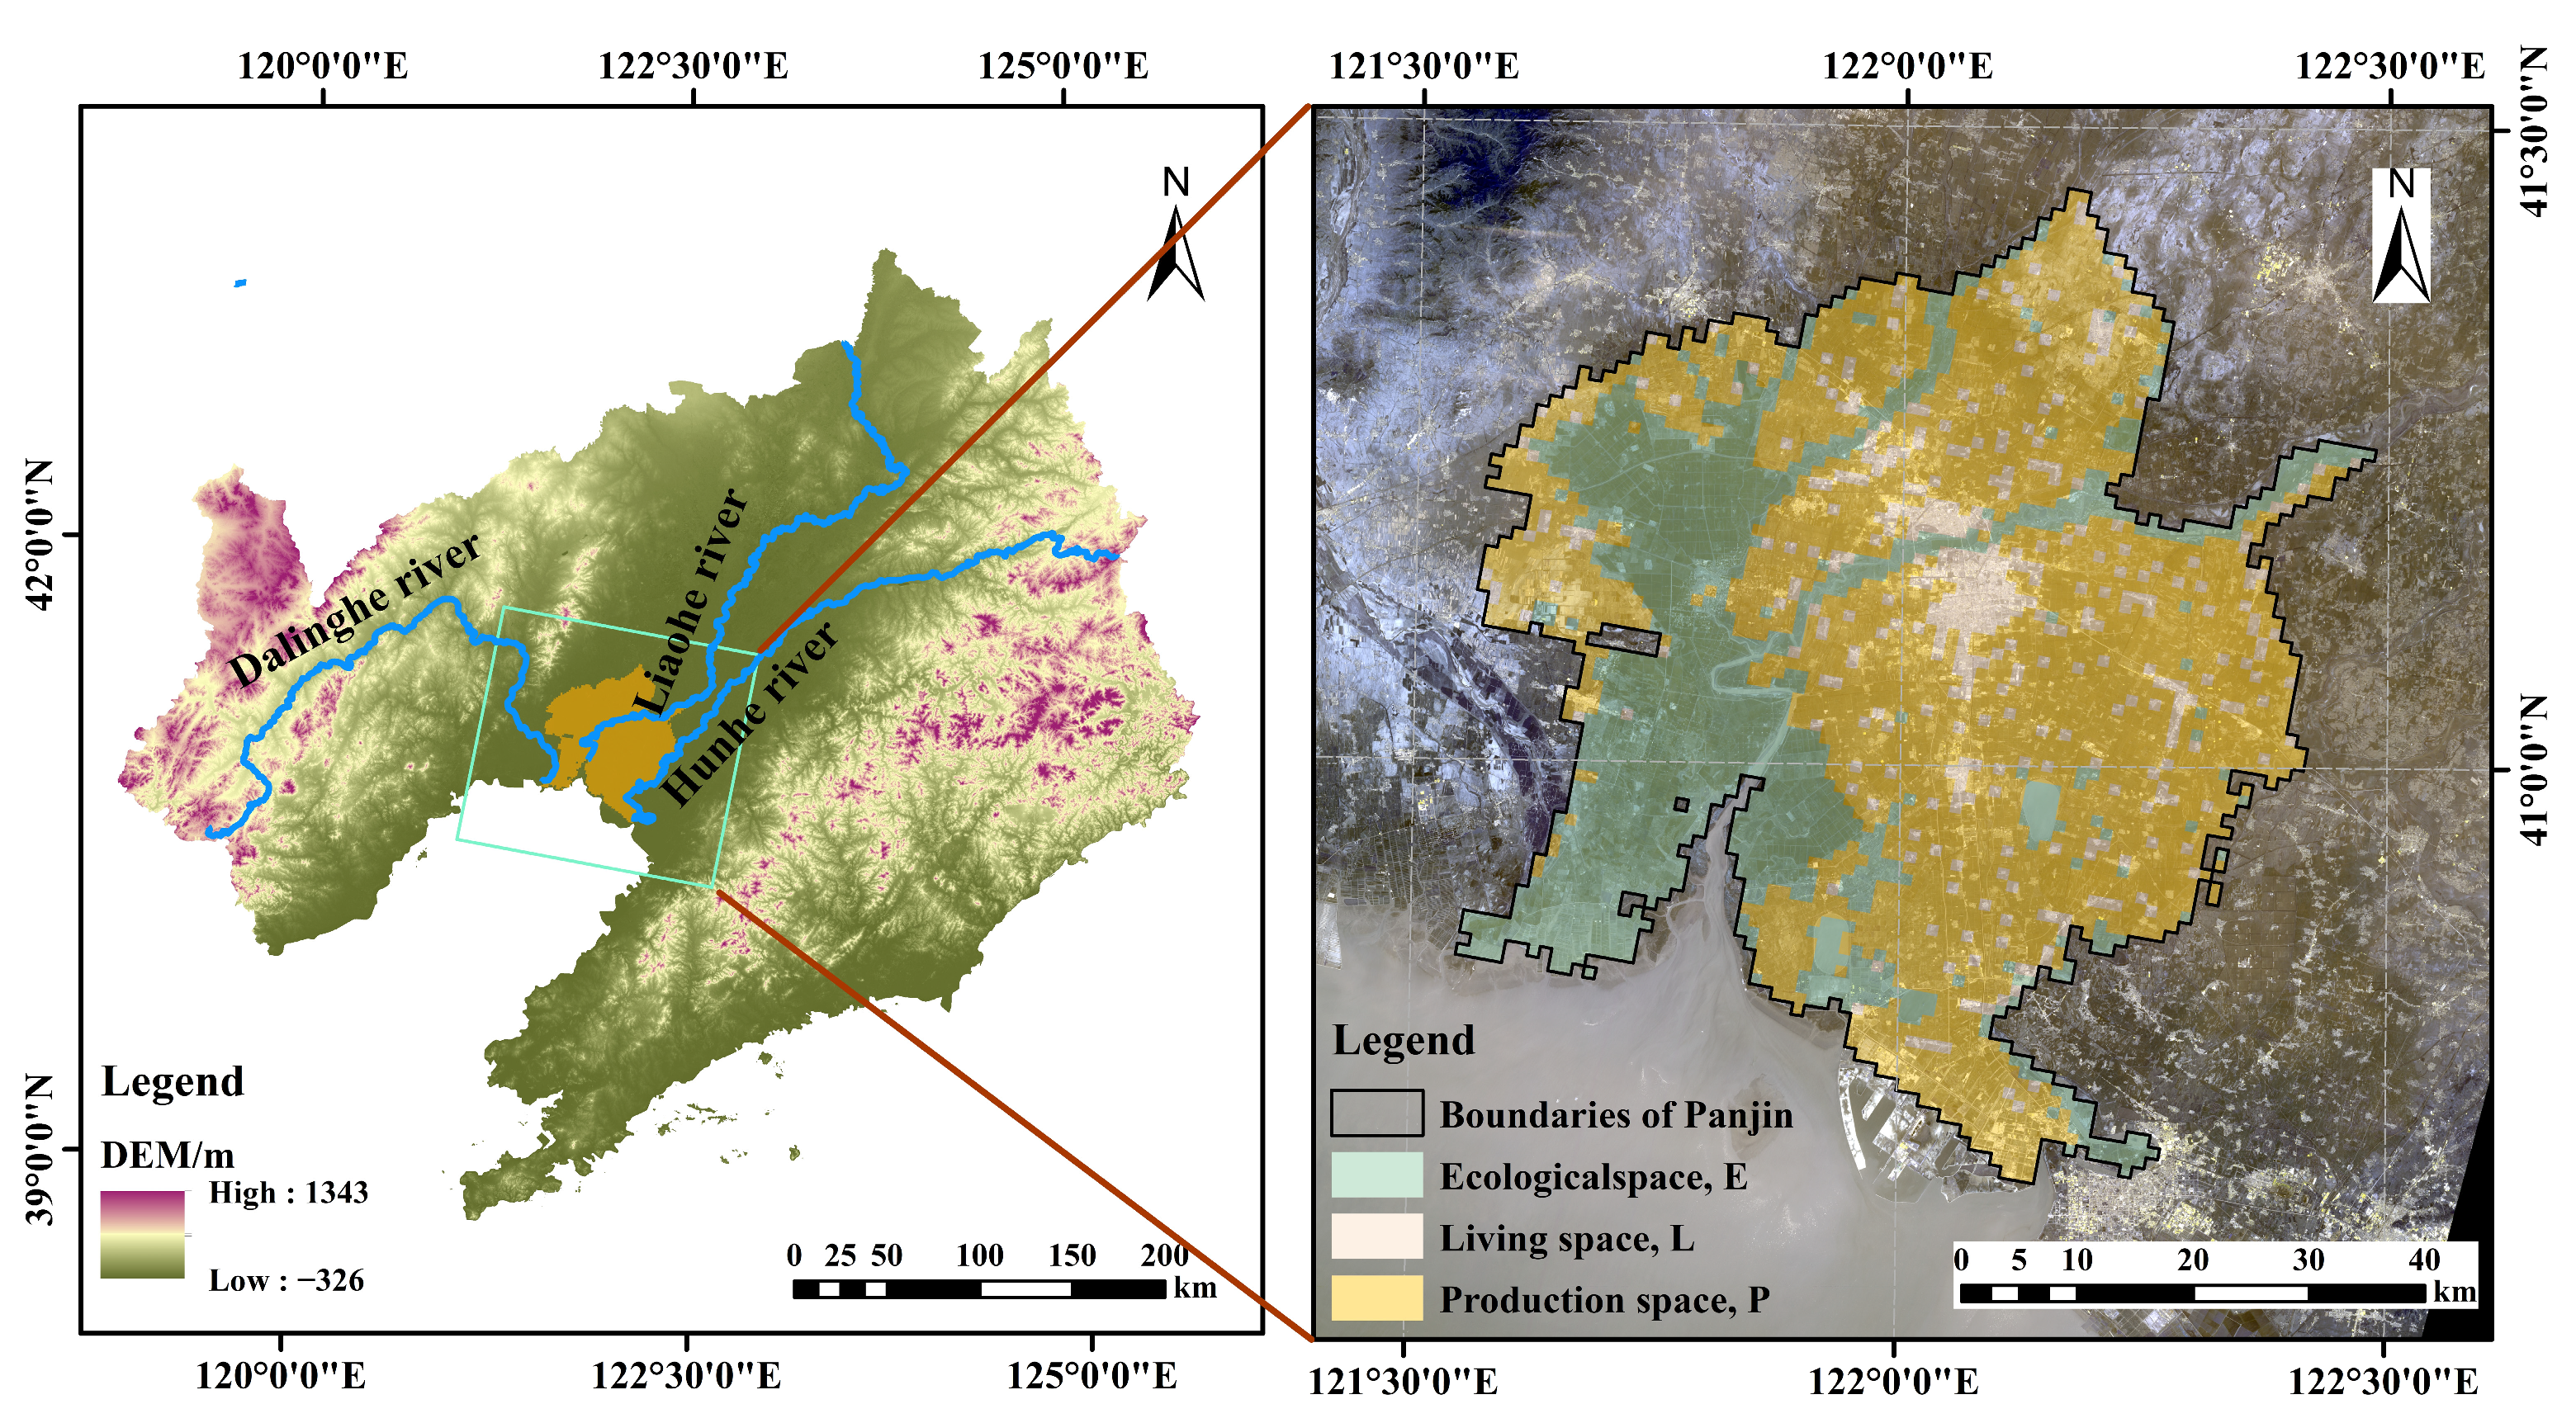
Panjin is situated in the geographic heart of the Liaohe Delta in the southwest of Liaoning, with Anshan to the east and northeast. It is divided from Liaodong Bay on the shore of the Bohai Sea to the south, from Jinzhou, which is a district to the west and northwest, and from Yingkou to the southeast corner by the Daliao River. The geographical coordinates are between 40°39′N–41°27N′ and 121°25′E–122°31′E. Panjin is located in the northern temperate zone and has a warm temperate continental semi-humid monsoon climate. Figure 1 shows Panjin’s geographic location map.
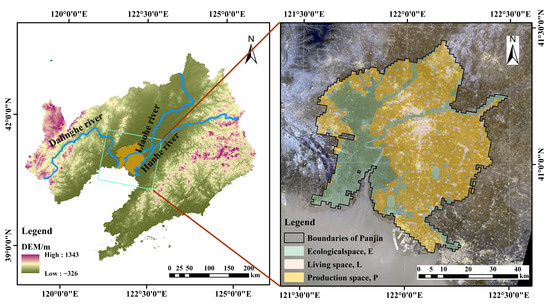
Figure 1.
Geographic location map of Panjin.
2.2. Data Processing
The information utilized in the current paper can be seen in Table 1. The years downloaded were all from 2000 to 2020, and mainly from Geospatial Data Cloud, Open Street Map, etc.

Table 1.
Data source.
2.3. Methodology
2.3.1. Classification of “PLES” and Land Space Function Assignment
The land use data were divided into production space, living space, and ecological space according to the different needs of human beings. Referring to related studies [20,21] and combining with the actual situation of the study area, the ecological environment quality index table of Panjin area was constructed, as shown in Table 2.
Table 2.
Classification of “PLES” and land space function assignment.
2.3.2. Transfer Matrix
The transition between various land types is reflected in the land use type transfer matrix [22], which can realize the functional transformation of land use in different scenarios. Its expression is:
where, is the area before the transfer, is the area after the transfer, and n is the number of land use categories.
2.3.3. Dynamic Attitude
The dynamic attitude index reflects the drastic degree of conversion between different lands at each stage in the geographic area, which can be divided into single and comprehensive land use dynamic indices [23]. The expression is:
where K is the dynamic attitude in the period t1 − t2, and , is the area in this period.
Comprehensive land use dynamics indicate general trends in land change [24]. The formula is as follows:
where S is the integrated land use dynamics in a given time period, is the category i land area at the start, is the area of category i and converted to category j, and T is the length of the study.
2.3.4. Ecological Environment Quality Index Model
This model can characterize the regional ecological environment quality status and its expression is:
The environmental quality index for time t is denoted by , is the area of land use type i in period t, is the environmental quality index of type i, the total study area is denoted by , while the variety of kinds of land use is denoted by n.
2.3.5. Ecological Contribution Rate
The effect of each land class conversion on the quality of the local ecosystem standard can be seen in the ecological contribution rate [25]. Its expression is:
where , is the ecological environment quality index that the land use type has at the opening and conclusion of the change, LA is the area of the changed land, and TA is the total area.
2.3.6. Center of Gravity Migration Model
The features, migration distance, and direction of different land use categories during the process of entering and leaving the country within a specific time frame can be objectively described using the model [26] with the following formula:
where and are the coordinates of the migration center, is the area of the i unit in the time period, and are the coordinates of the geometric center of the i, and n is the total amount of units in the study area.
2.3.7. Geographical Detector Model
The discretization of spatial data and the appropriate application of probes on the geographic scale were used, and better outcomes may be obtained by choosing the discretization method for spatial data and the number of classifications according to the q-value’s magnitude [27,28]. In this work, multiple classification methods and several classification intervals were used in the OPGD model to attain the optimal spatial discretization of the driving factor, with the following formula:
where q is the “PLES” influencing factors’ explanation power index, where a larger value indicates that the factor plays a stronger role in the process of formation and development of the pattern of the “PLES”, and the opposite is weaker; L is the influential code; and N stand for the stratum h and the number of units, respectively; and are the variances.
3. Results and Discussion
3.1. Examination of the Ecological Impact of the Evolution of the “PLES”
3.1.1. Ecological Environment Quality Index
As shown in Table 3, in 2000, 2010, and 2020, the ecological environment quality index of Panjin area was determined to be 0.3688,0.3702, and 0.3576, respectively. Panjin’s ecological environment was generally comparatively stable. The index from 2000 to 2020 showed an upward trend, suggesting that Panjin’s ecological environment quality improved during this decade. From 2010 to 2020, however, the index showed a downward trend, suggesting that Panjin had experienced some ecological damage during this decade.
Table 3.
Eco-environmental quality index of “PLES” in Panjin.
3.1.2. Analysis of Ecological Contribution Rate
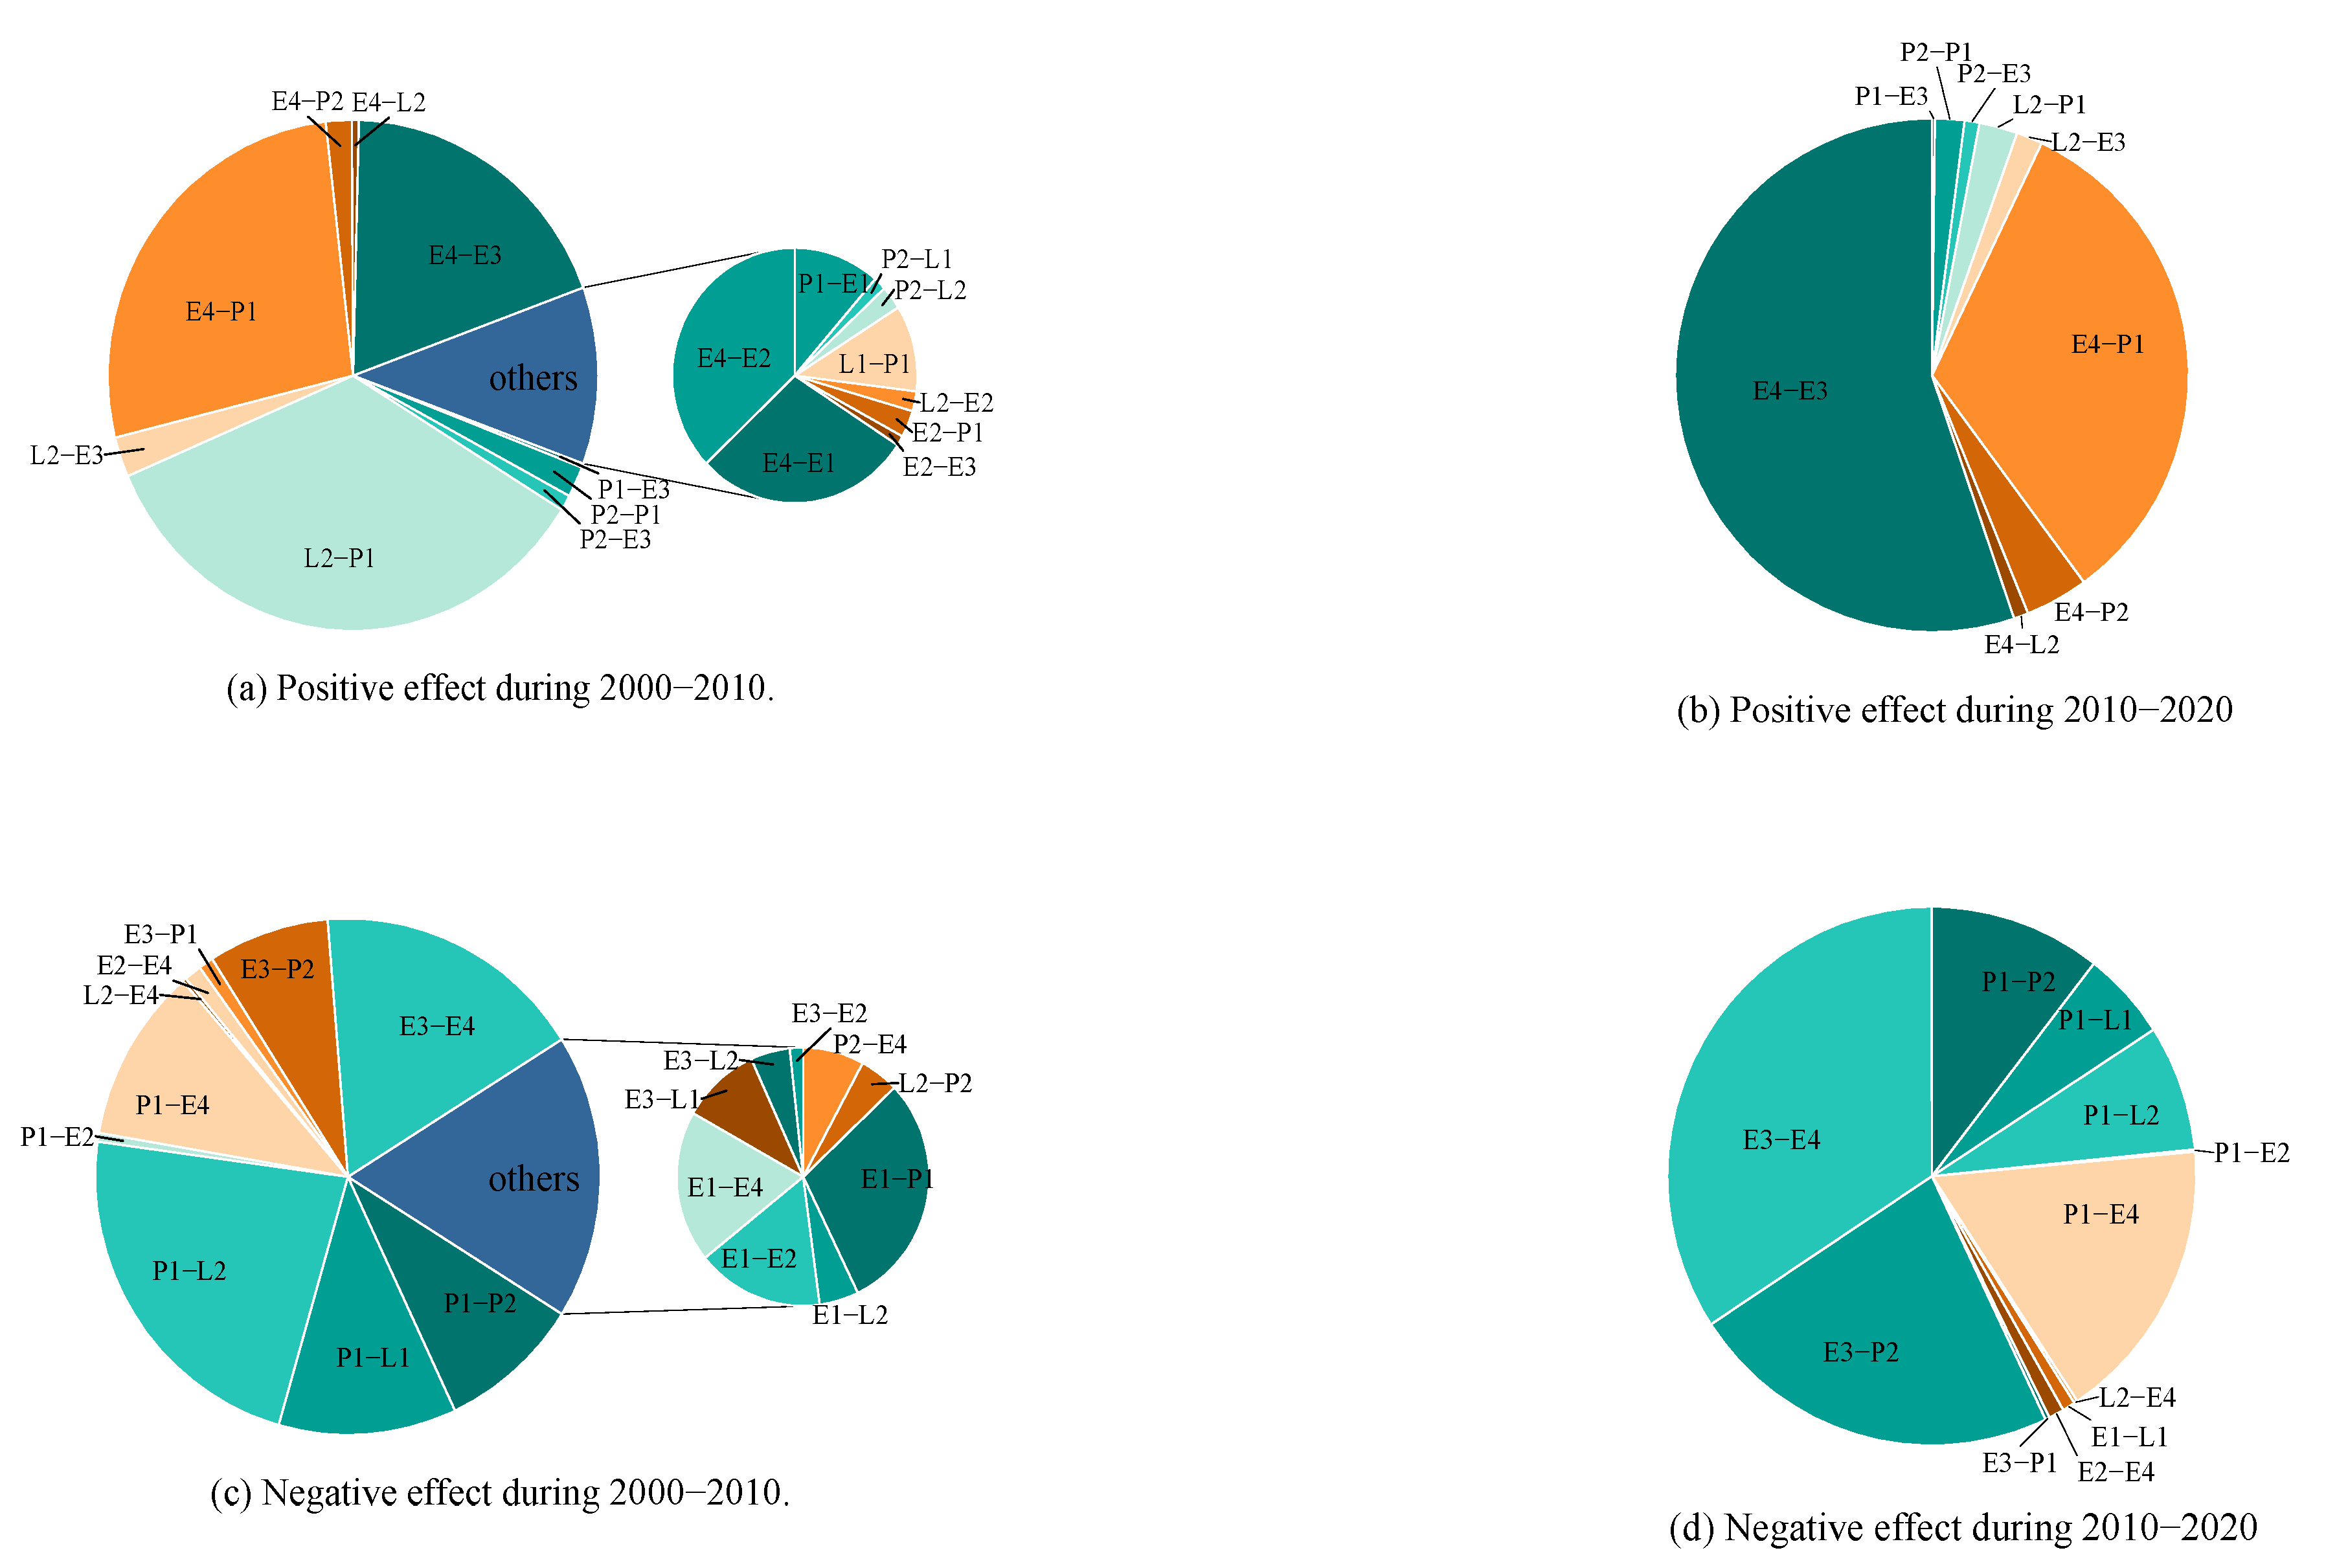
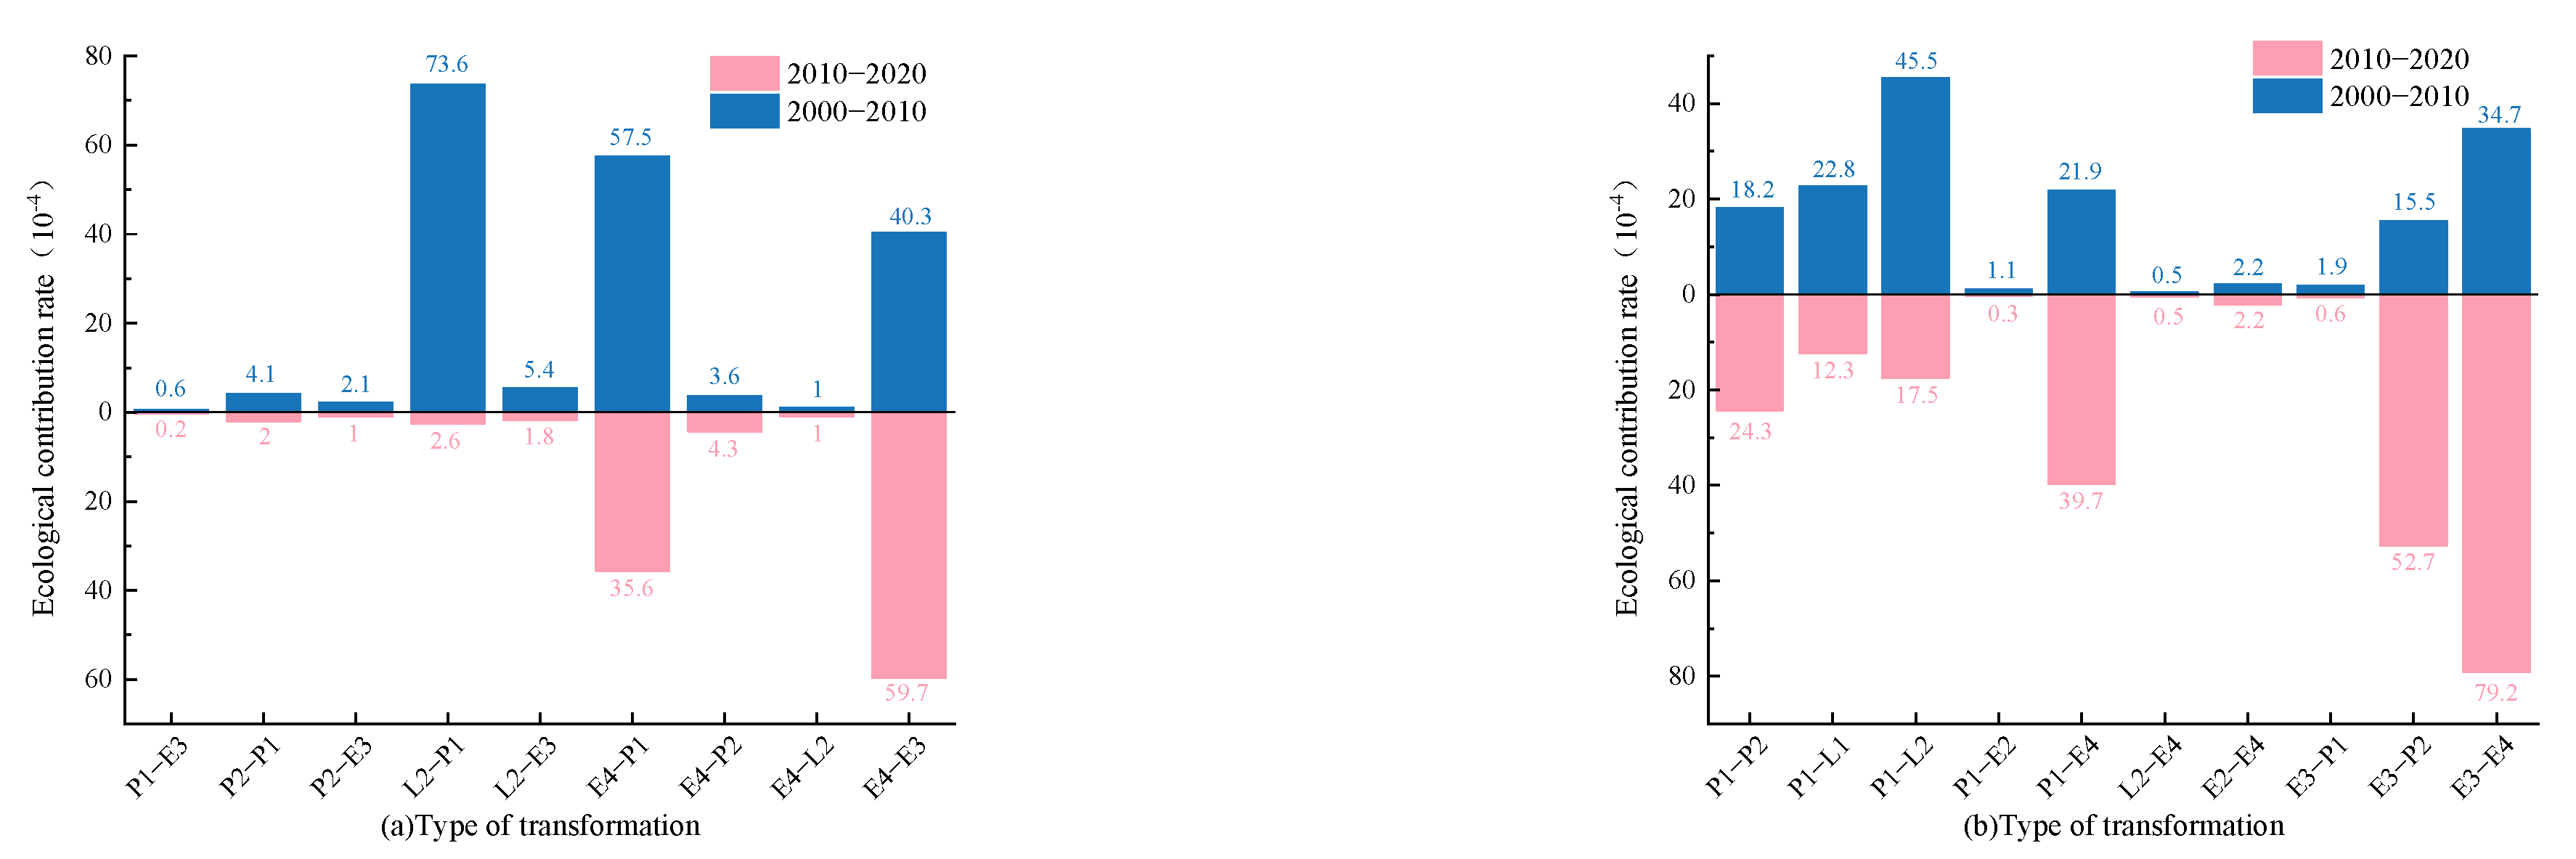
We assessed how the modification of each “PLES” category would affect the ecosystem’s quality, categorizing its effects as positive and negative, and figuring out how the three phases of the research area’s primary categories changed and how much each phase contributed. The calculated results are in Appendix A, and the results show that during the period from 2000 to 2020, the conversion of E4 into P, L2, and E3 was where the positive impacts were most noticeable. In the period 2000–2020, the negative effect mainly manifested in the degradation of agricultural production areas of rice fields and dry lands, the degradation of swamps and habitats, etc.
The “PLES” that showed either positive or negative effects from 2000 to 2020 is organized in Appendix A, and the results presented in Appendix A demonstrate that the value of the contribution rate in the negative effect was greater than the value in the positive effect. Consequently, it can be concluded that the negative effect of “PLES” was greater than the positive effect (Figure 2).
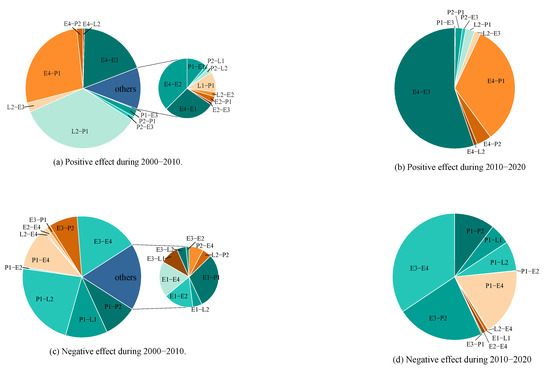
Figure 2.
Ecological contribution rate from 2000 to 2020: positive and negative effects.
The types of “PLES” that showed both positive and negative effects were mapped for 2000–2020 (Figure 3).

Figure 3.
Contribution of “PLES” showing both positive effects and negative effects.
3.2. Analysis of the Spatial and Temporal Evolution of the “PLES”
3.2.1. Evolution of the Spatial Pattern of the “PLES”
As shown in Figure 4, in the ecological space, E1 showed a decreasing trend, E2 showed an upward–downward pattern, E3 showed a declining pattern, and E4 showed a decreasing–increasing trend. Overall, the ecological space showed a downward tendency and decreased to 1145 km2 by 2020, while the production space showed an increasing trend and increased to 2093 km2 in 2020. A minor portion of the living space was dispersed as dots close to the production space, while the majority of the living space was placed in clusters in the top and middle portions of the land. By 2020, it had grown to 380 km2.
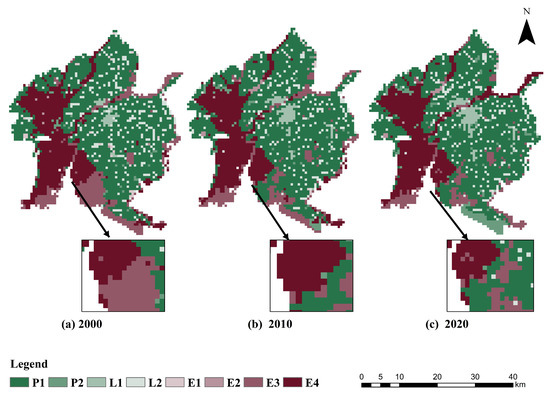
Figure 4.
Panjin’s “PLES” spatial pattern between 2000 and 2020.
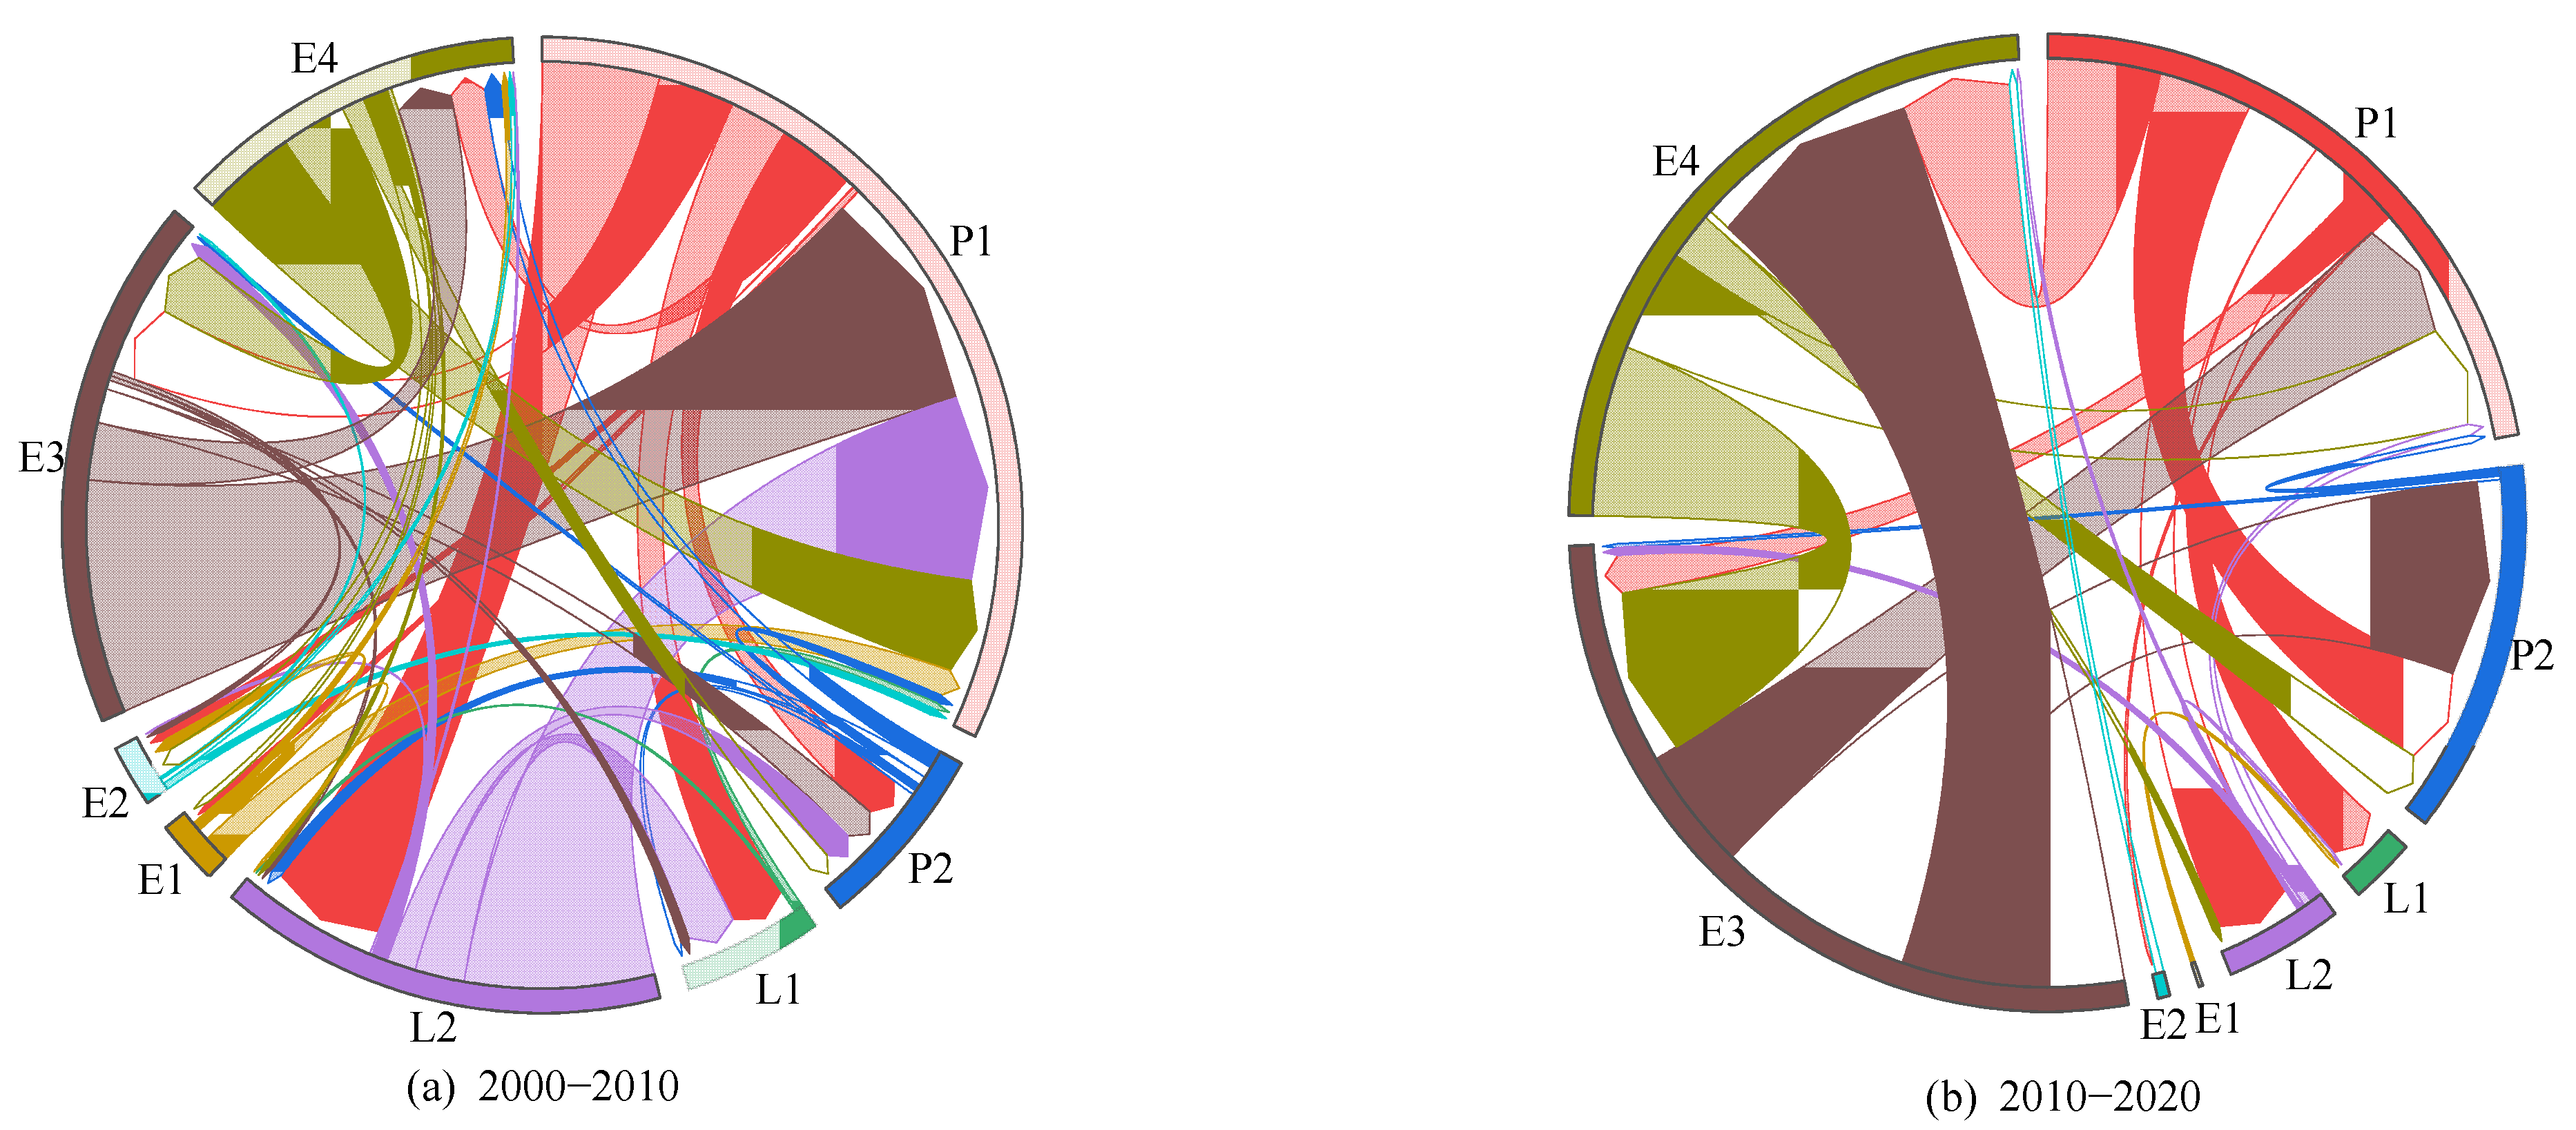
Transfer Matrix Analysis
During the period 2000–2010, P1 and E3 were transferred to an area of 153 km2 and 150 km2, respectively; P2 was mainly converted into E4 (8 km2) and L2 (5 km2), occupying 36.3636% and 22.7273% of the area transferred out, respectively; E3 was mainly converted into P1 (102 km2), occupying 68.0000% of the transferred area; E4 was mainly converted into P1 (42 km2), occupying 44.6809% of the converted area.
Between 2010 and 2020, E3 was transferred out the most, mainly to E4 (57 km2), P2 (51 km2), and P1 (31 km2), which accounted for 41.0072%, 36.6906%, and 22.3022% of the transferred area, respectively, with E3 being transferred to E4 in the most prominent area. E4 was mainly transferred to E3 (43 km2) and P1 (26 km2), occupying 51.8072% and 31.3253% of the transferred area, respectively, with the smallest area transferred to L2, which was 2 km2, and L2 was transferred to P1 (3 km2) and E3 (2 km2).
From Table 4 and Figure 5, the following results can be obtained: there were some differences in the total transfers into and out of the “PLES”, revealing its instability. P1 had frequent transfers to and from the “PLES”, with a transfer area of 153 km2, representing 26.5165% of the total transfer area; E3 was the second most frequent, with an area of 150 km2, representing 25.9965% of the total transfer area; L1 had only 0.6932% of the transfers. Therefore, it can be concluded, in descending order, that P1 > E3 > L2 > E4 > P2 > E1 > E2 > L1. By 2020, the area of other “PLES” in Panjin that had been transferred to P1 was as high as 250 km2, accounting for 43.3276% of the total amount of transfer, followed by E3, accounting for 12.4783% of the total amount of transfer, which was mainly due to the local work of “withdrawing from sea-enclosure farming and restoring coastal wetlands”. This work was launched in 2015, and in August 2018, Panjin further promoted the work of ‘withdrawing from sea-enclosure farming and restoring coastal wetlands’. By May 2020, Panjin had carried out an 11-day special enforcement operation on “withdrawing from enclosure farming and restoring the original state of the sea area”, withdrawing 574 farming households and 62,900 acres of farming area. So far, the total area of aquaculture in Panjin has been cleared and leveled to 85,900 mu, but in general, the area transferred out of E3 was larger than the area transferred into E3 from other “PLES”, and the area transferred into E3, so it can be concluded that P1 > E3 > L2 > P2 > L1 = E4 > E2 > E1.
Table 4.
Conversion matrix of different spaces in Panjin from 2000 to 2020 (km2).

Figure 5.
Chord diagram of “PLES” in Panjin from 2000 to 2020.
Changing Attitudes to “PLES” Dynamics
The single dynamic attitude is shown in Table 5. According to the calculation, the comprehensive dynamic attitude in 2000–2010 was 0.7974%, and the comprehensive dynamic attitude in 2010–2020 was 0. 4602%. From the overall point of view, from 2000 to 2020, it was generally more stable, and from the analysis of the single dynamic attitude, from 2000 to 2010, the L2, E1, and E3, E4 were all negative values, and from 2010 to 2020, E1 and E3 were also negative values. Therefore, from an overall perspective, the area of E3 decreased, which means that the watershed of Panjin continued to decrease between 2000 and 2020.
Table 5.
Change of land area in “PLES” in Panjin from 2000 to 2020.
3.2.2. Evolution of the “PLES” Structure
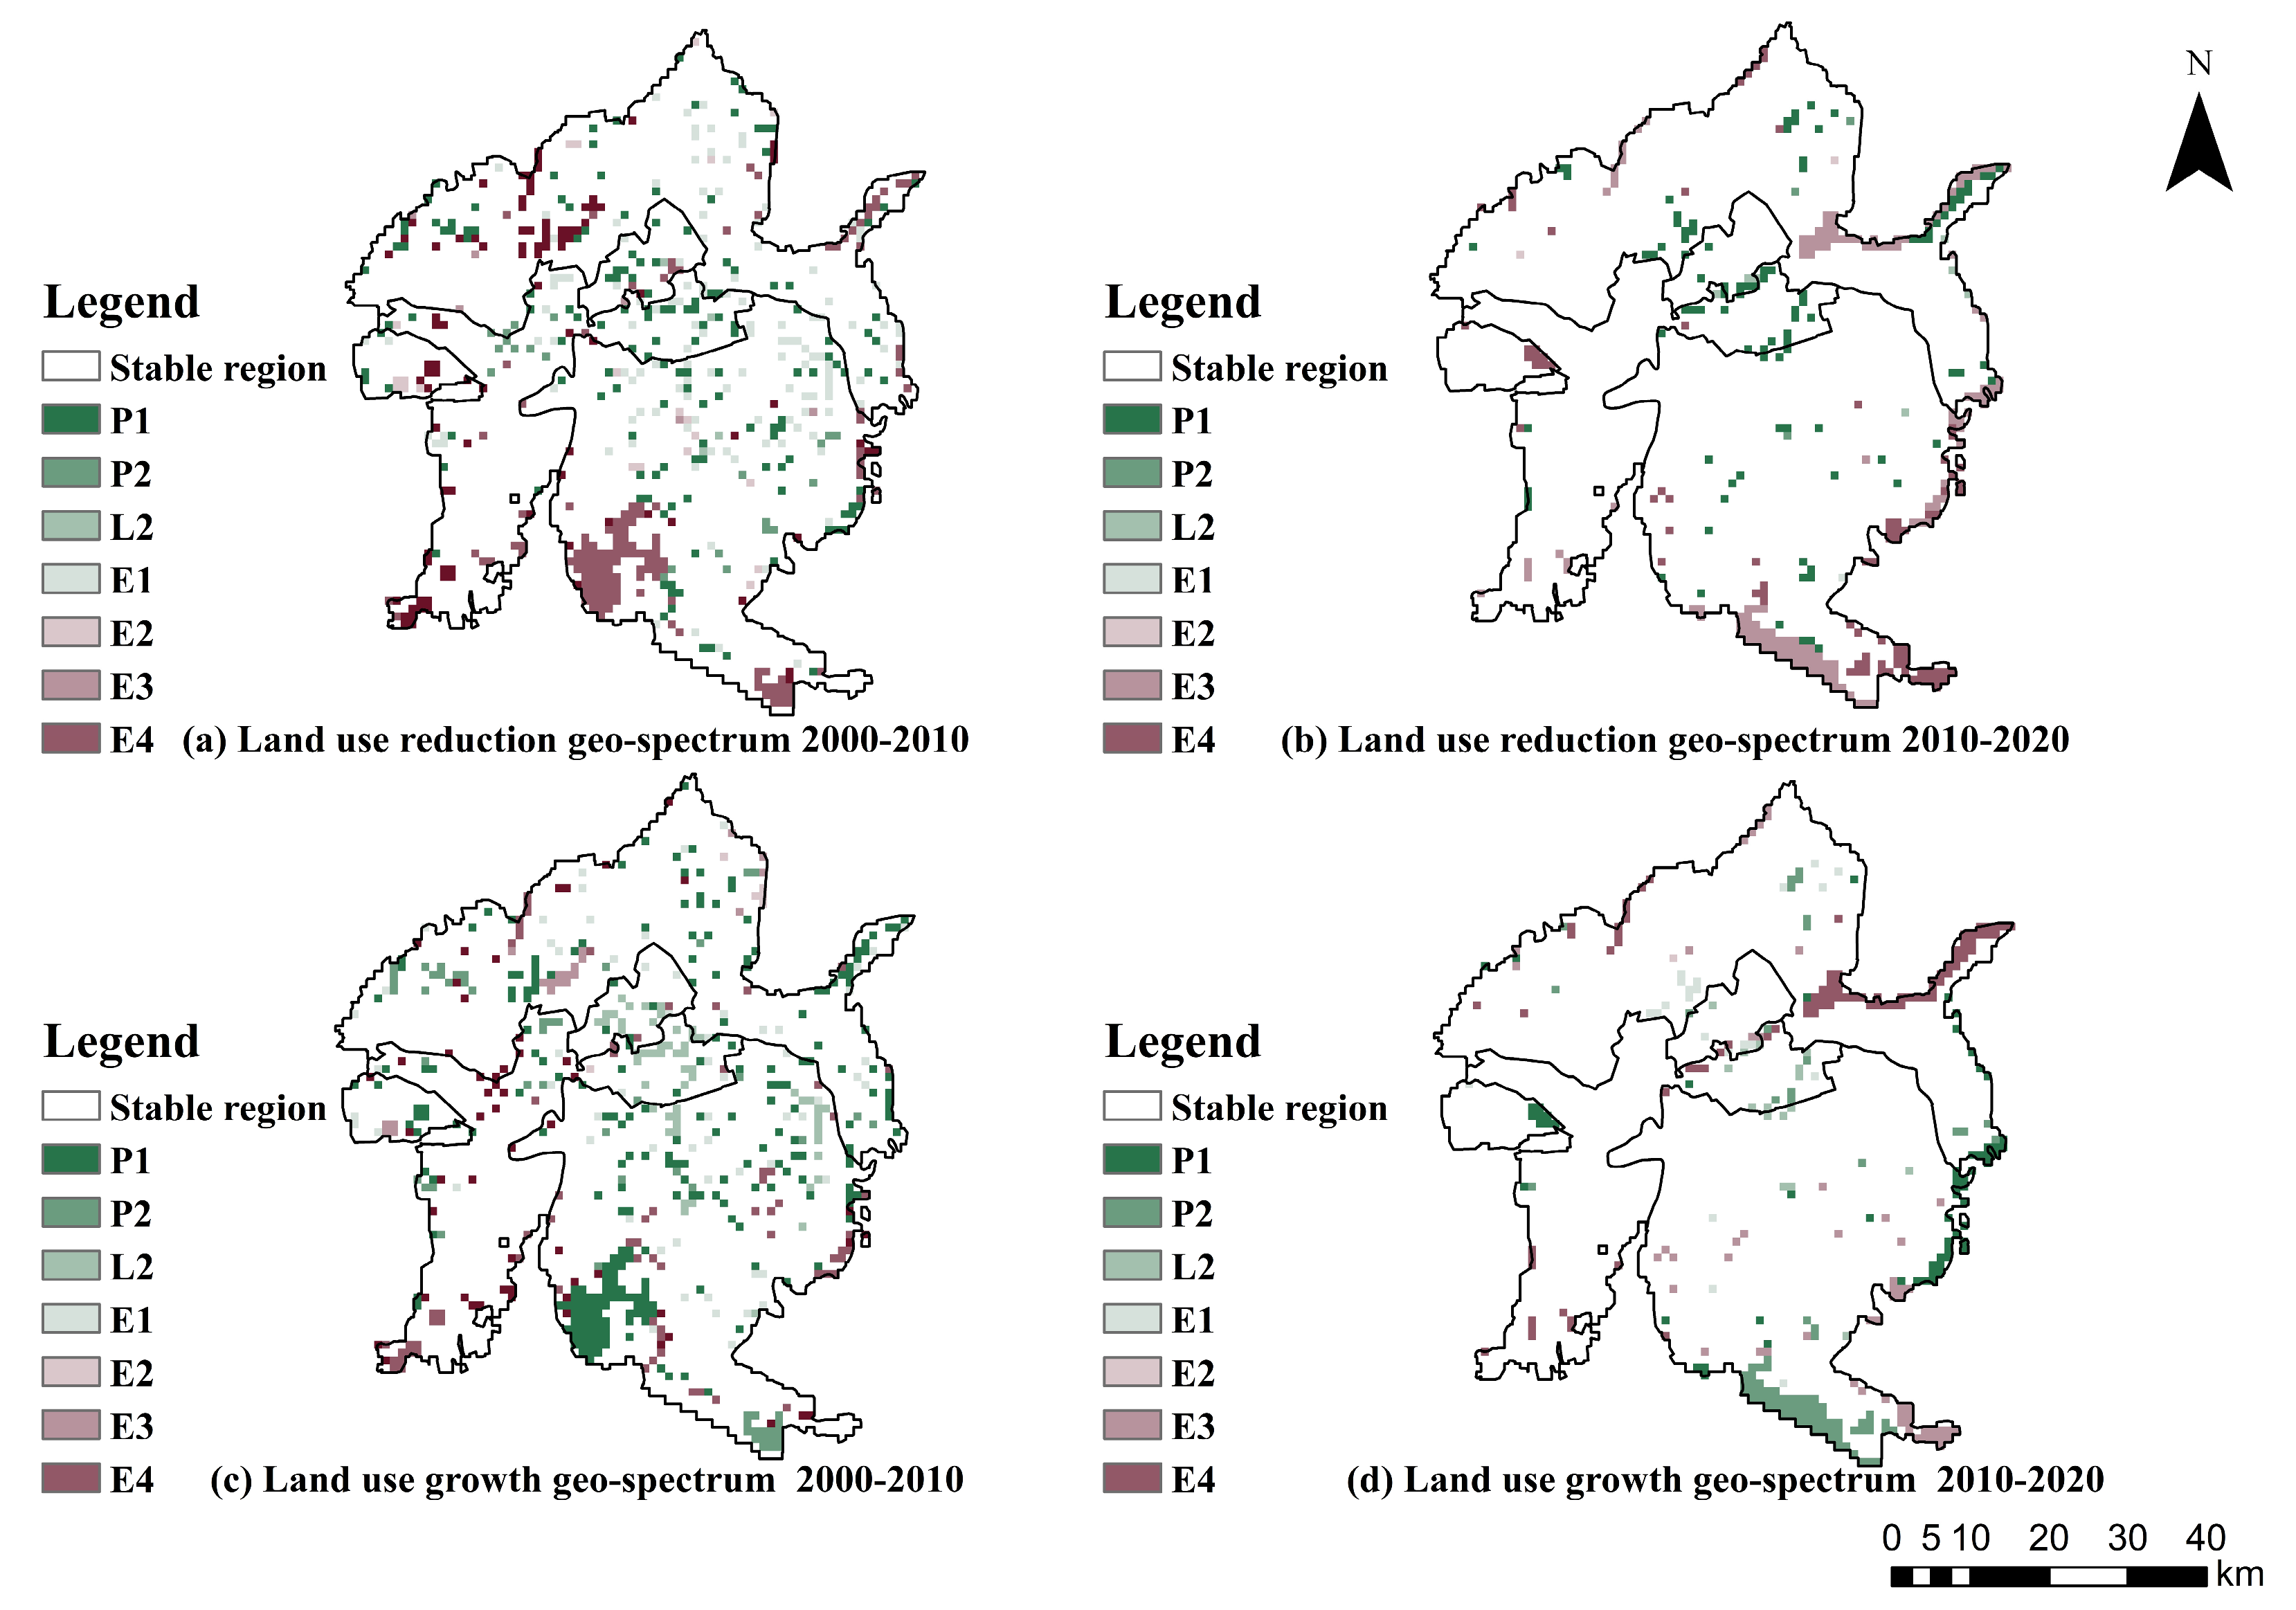
“PLES” Growth and Reduction Based on the Geo-Spectrum
The growth and reduction based on the geo-spectrum were calculated based on the transfer-in matrix, where a transfer from one type of space to another means that the space transferred to is shown as an up-trend, while the space transferred from is shown as a down-trend, so upward and downward mapping was used to further analyze the spatial expansion, with separate spatial representations of transfers into and out of each land use type over multiple periods. Figure 6 and Table 6 show that between 2000 and 2010, the upward trend of P1 was the strongest, with a transfer-in area of up to 250 km2, mainly scattered in Panjin, and during 2010–2020, the upward trend of E4 was the strongest, with a transfer-in area of 89 km2, mainly distributed near the river. In 2000–2010, the downward trend of both P1 and E3 was stronger, with 153 km2 and 150 km2, respectively, and in 2010–2020, E3 has the strongest downward trend, up to 139 km2. In the period 2000–2020, as a whole, in 2020, the decline in P1 had improved compared with the previous period, mainly because the state attaches great importance to food security and the protection of cultivated land, regards cultivated land as the lifeblood of food production, and will implement the most stringent system of cultivated land protection to protect cultivated land as it does the giant panda. China emphasized that by the end of 2020, the 1.8 billion mu of arable land that make up the red line should be properly protected, thus preventing illegal use changes, “zero tolerance” for the illegal occupation of arable land, and resolutely curbing the “de-farming” of arable land.
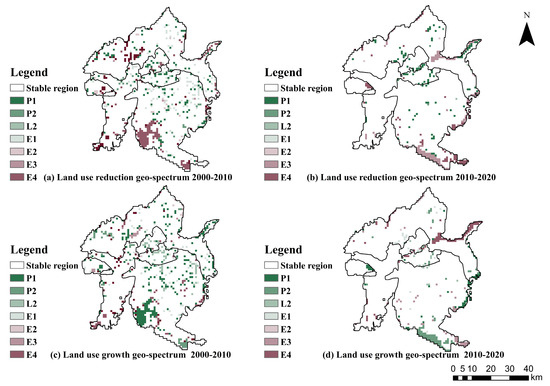
Figure 6.
“PLES” growth and reduction based on the geo-spectrum in Panjin from 2000 to 2020.
Table 6.
“PLES” change in Panjin from 2000 to 2020 (km2).
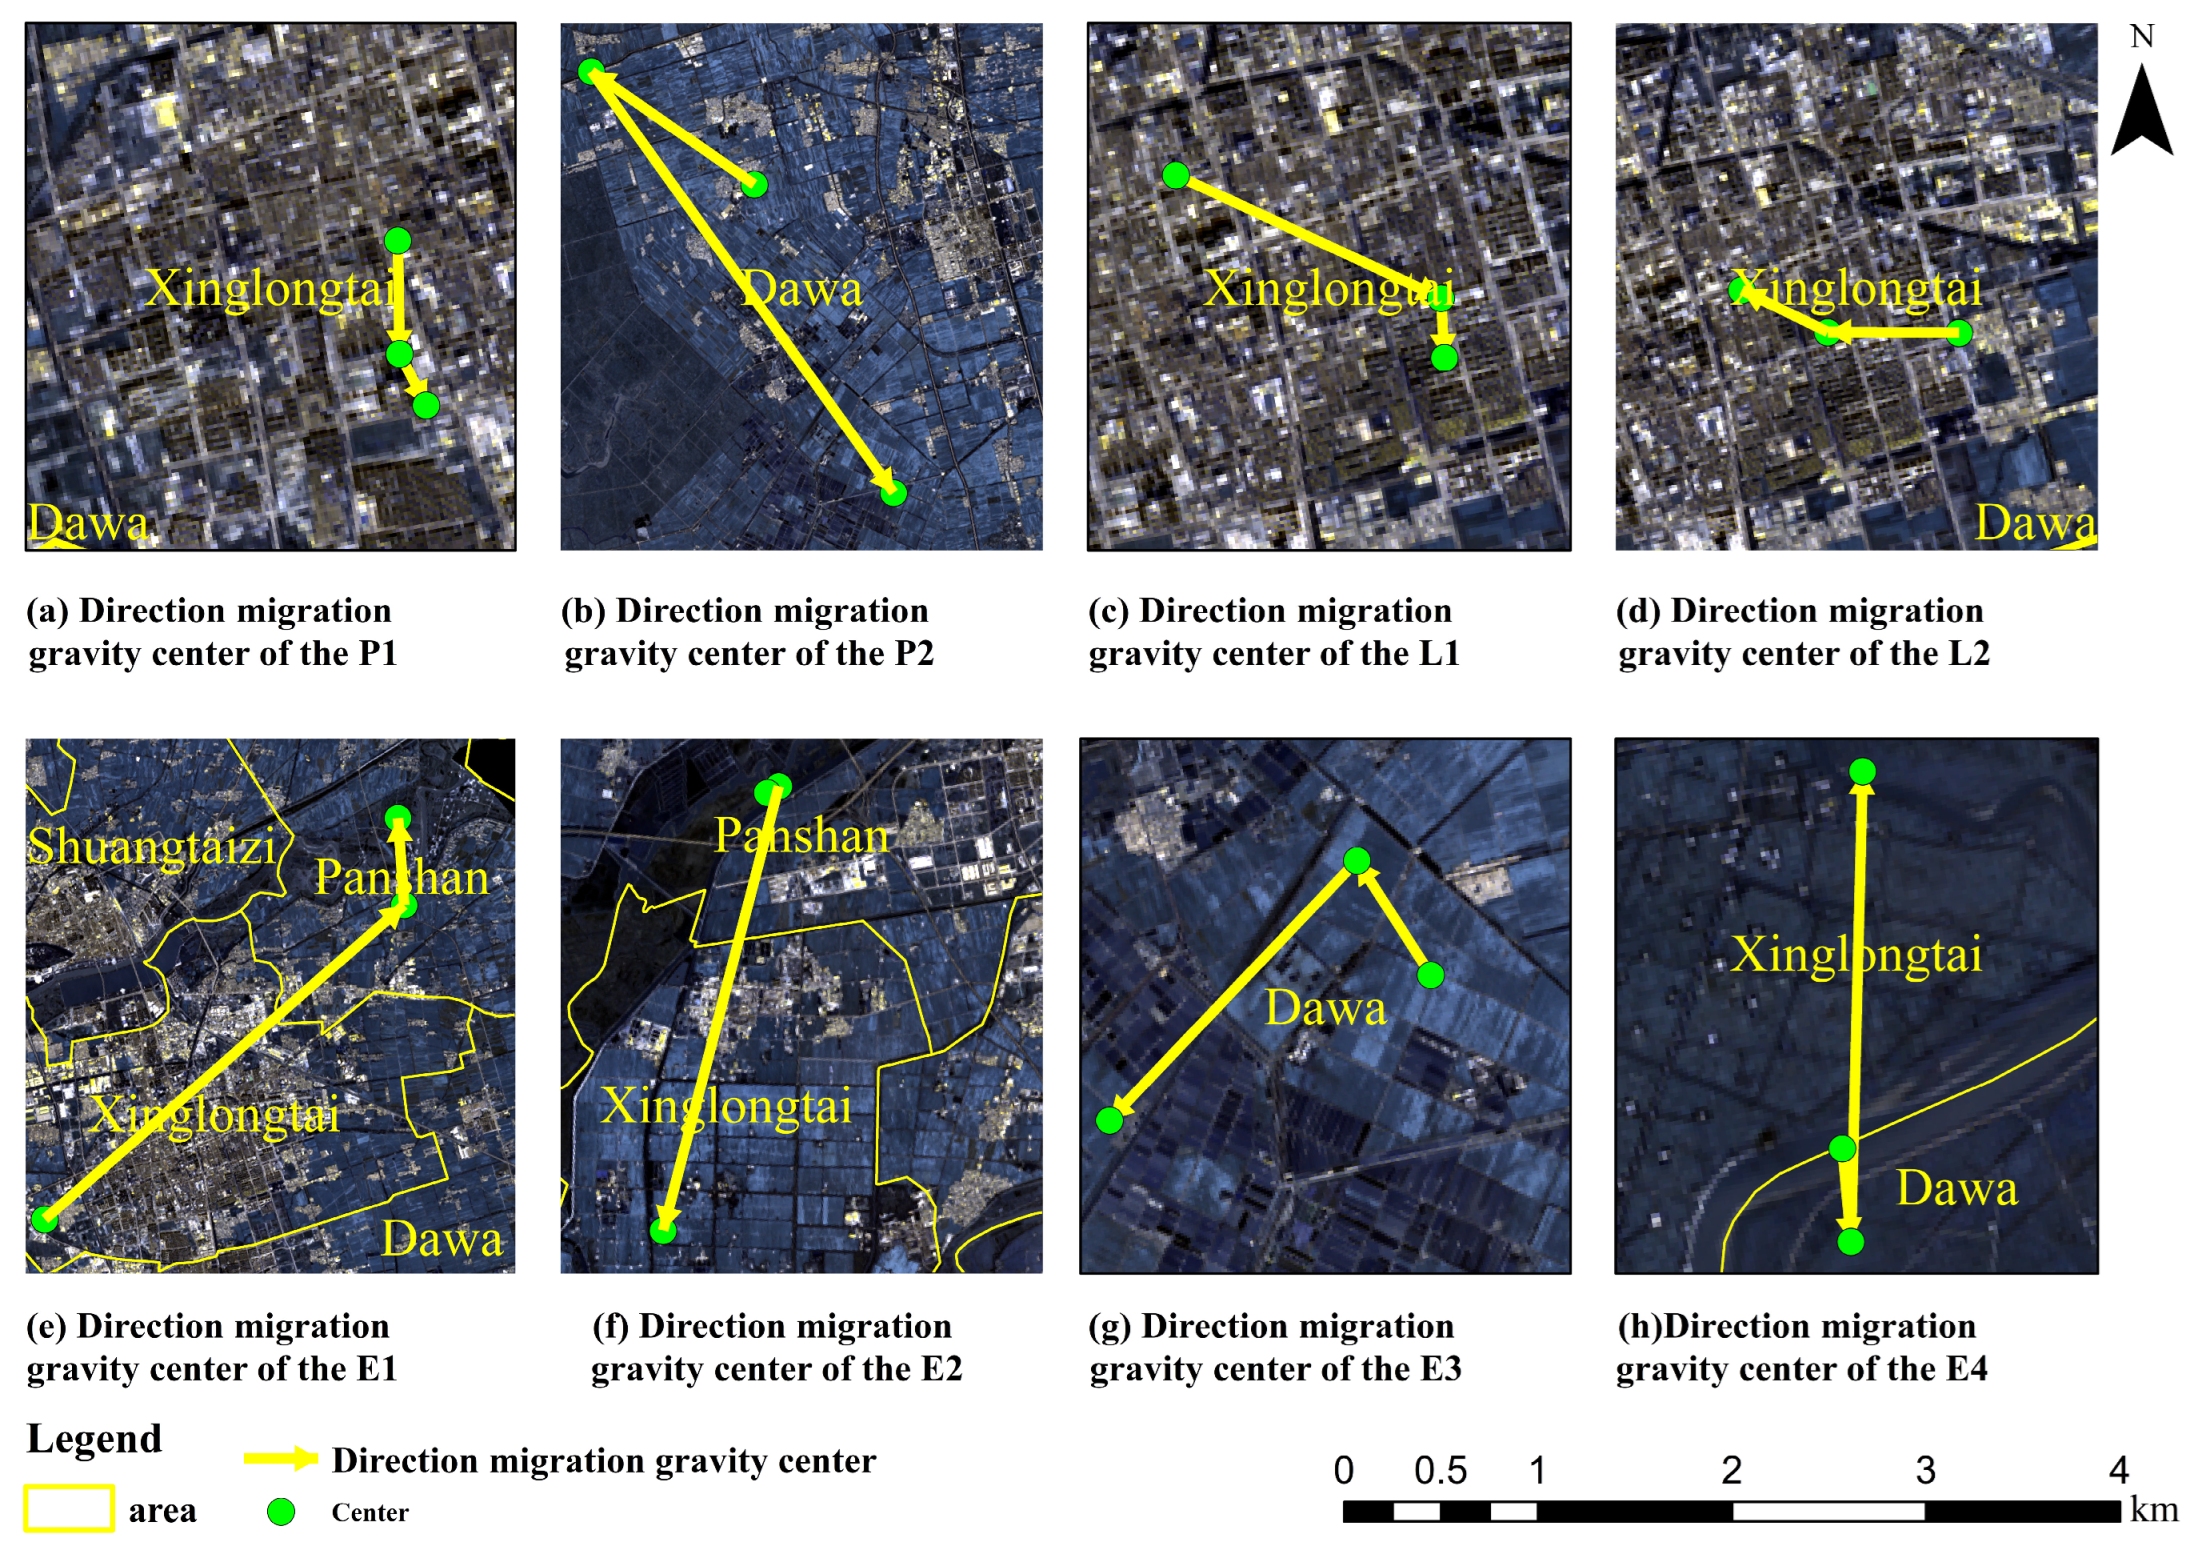
3.2.3. Characteristics of the Evolution of the Center of Gravity of the “PLES”
The spatial trajectories of various “PLES” were specified using center of gravity migration models. As shown in Figure 7, this is most obviously in E4, E1, and E2. Between 2000 and 2020, the center of gravity of E3 and P2 was concentrated in the Dawa District of Panjin; L1 was concentrated in the Xinglongtai District of Panjin; E4 shifted from the Dawa District to the Xinglongtai District; E1 shifted from Xinglongtai District to Panshan County; and E2 shifted from Panshan County to Xinglongtai District.
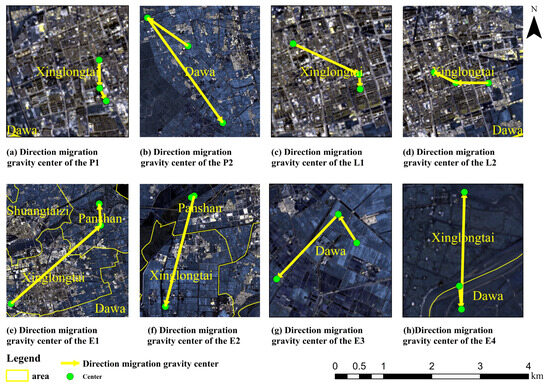
Figure 7.
Direction migration gravity center of the “PLES” in Panjin.
The Dawa District, rich in oil and natural gas reserves, is the main producing area of the Liaohe oil field, located in Dawa District, Panjin. The Panjin Lingang Economic and Technological Development Zone was established in 2010, and the development zone focuses on the development of grain and oil biotechnology, new material products, equipment manufacturing, and fine chemicals. By taking the opportunity to expand the development of the high-end petrochemical industry in Liaoning Province, the strategic advantage of the Panjin National Petrochemical Industry Base has been fully exploited. As P2 is concentrated in the Dawa District and there has been a downward development trend, the Panjin Lingang Economic and Technological Development Zone is located in the south of Dawa District. Panshan County is rich in forest resources, and in around 2000, Panshan County Forestry was established. In Panshan County, the forest area is about 16,000 acres, and the Panshan Forest Park is located in Panshan County, where the total area is a whopping 2443 acres with a wide variety of tree species totaling around 500,000 trees, showing that Panshan County is predominantly forested. On the other hand, Xinglongtai District has added 10.7 hectares of new green space, 4.5 hectares of replenished green space, and three new pocket parks, so the center of gravity of E2 has shifted to Xinglongtai District. Both urban and rural areas are concentrated in Xinglongtai District, which has a total area of 194 square kilometers including 88.8 square kilometers of construction land, 91.3 square kilometers of arable land, and has 7 major companies and institutions. In 2010, Dawa’s basic competitiveness ranked among the top 100 counties (cities) in the country. Due to its convenient transport links and as a hub between Liaonan, Liaoxi, and Liaozhong, L1 is concentrated in Xinglontai, but still has a tendency to develop toward Dawa. The reed swamp belongs to unused land, which belongs to the scope of E4, and the reed swamps in Panjin are concentrated in Dawa and Xinglontai. in 2019, Xinglongtai District established the Panjin Reed Sea Dingxiang Tourism Resort, which is the world’s first, largest reed swamp bed due to long-term human protection and good reed swamp growth, so the center of gravity of E4 has shifted to Xinglongtai District.
3.3. Analysis of the Drivers of “PLES”
For “PLES” changes, land use changes are mainly analyzed before further analyzing “PLES” changes, which are mainly influenced by environmental as well as anthropogenic factors. Finally, a geoprobe analysis was conduced with the single dynamic attitude of “PLES” as the dependent variable.
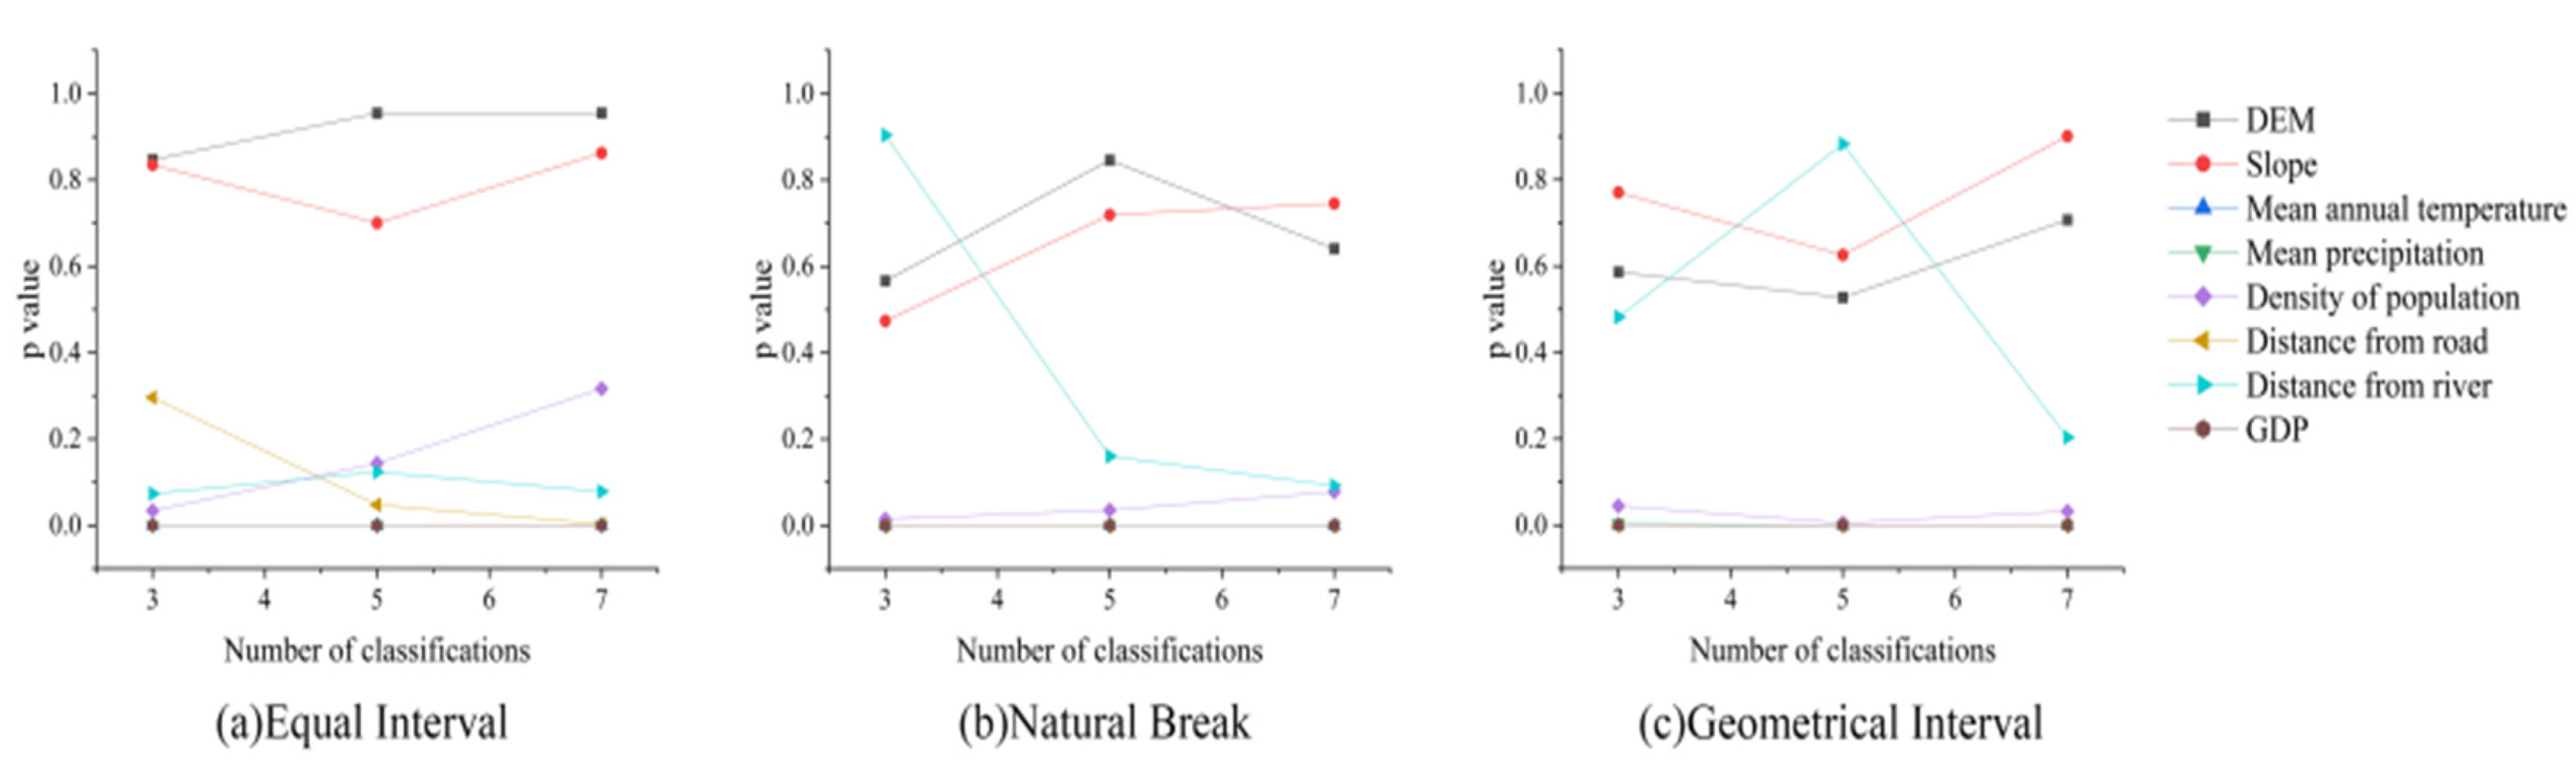
3.3.1. Parameter Optimal Classification Method Selection
In this paper, different classification methods and different categories were applied to each impact factor for a comparative analysis, and finally, a suitable classification method and the number of categories. The classification methods included equal interval, natural breaks (Jenks), and geometrical interval, and the number of categories was three, five, and seven. The comparison of the different results is shown in Figure 8, which shows that the best result was achieved when applying the geometrical interval method to classify five categories. Therefore, the classification method selected in this paper was the geometrical interval method and the number of categories was five.
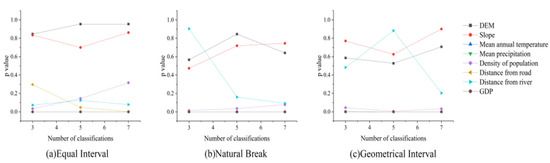
Figure 8.
Different classification methods.
3.3.2. Factor Detection Analysis
Table 7 indicates that the p-value and q-value of the various factors varied, and the factors with a strong significance on the evolution of the “PLES” included the average annual temperature, average annual precipitation, population density, distance from roads, and GDP. It also demonstrates that the evolution of the “PLES” was influenced by both natural and socioeconomic causes. The average annual temperature had the biggest influence on how the “PLES” evolved, primarily because temperature changes impact human living conditions and quality of life while also encouraging urbanization and affecting crops in the production area. In the event of persistently extreme weather, these changes will also result in the evolution of industry and the sustainability of the ecology. Elevation, slope, and distance to water sources had a small impact on the development of the “PLES”, mainly because Panjin is located in the Liao-Zhong Plain, so the elevation of the city does not fluctuate much, and the slope will not change if the elevation remains the same all year round, so the impact is small. The main rivers that flow through Panjin are the Liao River and the Hun River. The Liao River is one of the seven major rivers in China, and the Hun River is also known as the Little Liao River, so the main river bodies and tributaries of the two will not change too much over time, so the influence of distance from the river is also small.
Table 7.
Findings from identifying the “PLES” evolving elements.
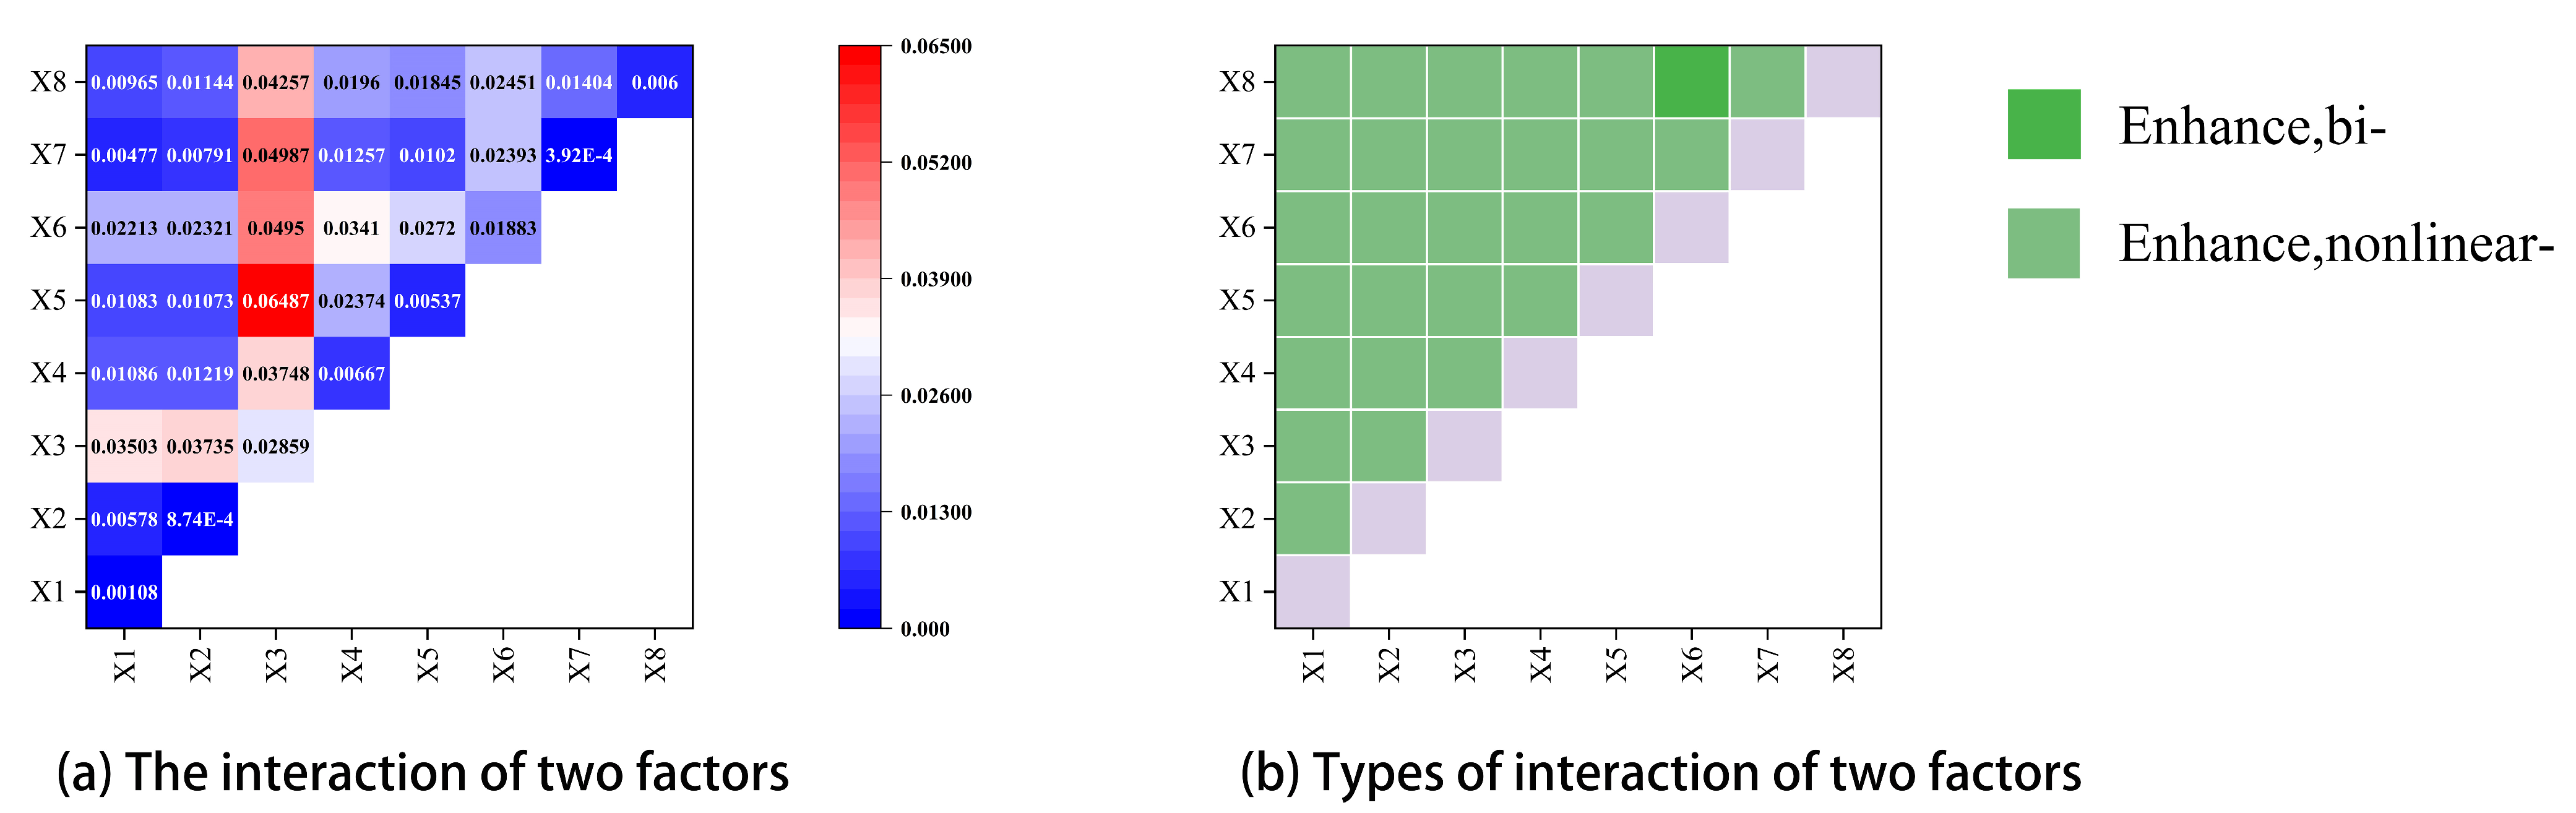
3.3.3. Analysis of Factor Interaction Detection
Since the various influencing factors were combined, geodetectors were applied to conduct an interaction analysis to analyze the interaction of two factors. As shown in Figure 9, the result of every two-factor interaction is an enhancement of influence, mainly nonlinear enhancement (i.e., the intersection of the two influences is greater than the sum of their influences). Only the interaction of distance from the road and GDP was a two-factor enhancement (i.e., the result of the intersection of the two influences is greater than the maximum of their values). The relatively strongest explanatory power was seen for the interaction of mean annual temperature with other factors, and the strongest for the interaction of mean annual temperature with population density.
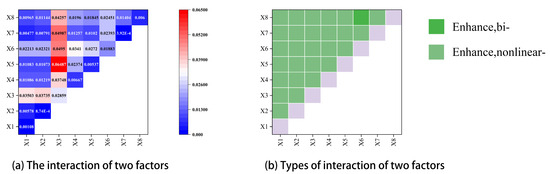
Figure 9.
Factor interaction detection analysis.
3.4. Discussion
This paper’s primary goal was to examine how the “PLES” worldview had changed in Panjin, further analyze the ecological changes based on its changes, and finally, study the factors affecting the changes. In this paper, compared to the previous transfer matrix only approach to studying land change, the area transferred into or out of the transfer matrix was used for growth and reduction based on the geo-spectrum, and the two were combined to observe the expansion of the “PLES”. This study’s findings are intended to offer recommendations for future zoning optimization and land change analysis from the standpoint of the “PLES”. The study’s findings indicate that between 2000 and 2020, Panjin’s ecological environment’s quality somewhat deteriorated, and it is necessary to find the reasons for this and to strengthen the protection of the ecological environment. According to the “PLES” perspective, the living space exhibits a steadily increasing trend, which fuels the expansion of production space and causes the ecological space to be squeezed to exist. After analyzing the driving factors with a geodetic detector, it was found that Panjin is located in the plains, and the terrain does not change much throughout the year, so natural factors such as elevation, slope, and river play a very small role in influencing its evolution, and the strongest explanatory power for the spatial evolution of the natural factors was the average annual temperature, which is also consistent with previous studies [29,30]. In addition, socio-economic factors also had some influence on spatial evolution, such as distance from the road, which had the second highest explanatory power. Therefore, it is necessary to analyze the combination of natural and socio-economic factors to make reasonable optimization suggestions such as building green belts on both sides of the road. In studies from the perspective of “PLES” including those focusing on the evolution of “PLES” and the ecological value of “PLES”, only the study of the “PLES” itself is considered [31,32], which neglects the study of the driving factors of the evolution of “PLES”. The mechanisms guiding the evolution of the Panjin “PLES” are explained in this research, which also takes into account the impact of natural and socioeconomic variables to provide a basis for future urban planning and the rational use of national resources. However, although the hotspot of current research on “PLES” is to combine analysis to provide different zoning rationalization suggestions for future urban development [33,34], the text did not involve this aspect, so it is necessary to quantitatively express and put forward targeted suggestions in subsequent research. The research data in this paper had a low resolution, generally 1 km, so subsequent research could try to obtain high-precision data.
4. Conclusions
This study examined the spatial and temporal evolution of “PLES” and the changes in ecological quality in Panjin from 2000 to 2020 using the ecological environment quality index model, growth and reduction based on the geo-spectrum, the center of gravity migration model, and optimal parameters-based geographical detector model, and the particular findings are as follows:
- (1)
- In terms of the evolution of the “PLES” pattern, by 2020 the production and living spaces will continue to increase to 2093 km2 and 380 km2 respectively, while the ecological space will show a general downward trend and decrease to 1145 km2. Further analysis according to the change in the area shows that the center of gravity of P2, L1, E3, and E2 is shifting southwards, while the center of gravity of E1 is shifting northwards, mainly due to the establishment of protected areas by relevant enterprises to protect a certain resource, the demand for education, the desire for a good job and the response to the local demand for environmental protection.
- (2)
- From the development of the pattern of “PLES”, it can be seen that the ecological space area is decreasing, and then the ecological effect of “PLES” is studied by using the ecological environment quality index as well as the ecological contribution rate method, and from 2000 through 2020, the index shows a general declining pattern, and the value of the ecological contribution rate of the negative effect is larger than the value of the positive effect, so the ecological condition of Panjin is getting worse, so Panjin should strengthen the scientific planning and ecological environment management of “PLES” to enhance the ecological surroundings quality of Panjin.
- (3)
- Natural and social factors work together to form and develop the “PLES”, and the results of geographic exploration indicate that, of the natural factors, the annual average temperature has the biggest impact on the development of the “PLES”. The use of geographic probes to analyze the interaction of the two factors also reveals that the ultimate outcome of each factor’s interaction with the other is an increase in the influence of the two factors, The final result gives the strongest explanatory power in the two-factor interaction, as mean annual temperature interacts with the density of population. Overall, the mean annual temperature and density of the population are the key factors affecting the ecological environment in Panjin, therefore, ecological protection zones should be created and population patterns should be optimized in order to reduce the impact of humanity activity on the environment.
Author Contributions
Conceptualization, Q.C.; Methodology, Y.L. and Q.C.; Software, X.L. and Y.L.; Validation, T.W.; Formal analysis, Q.C.; Investigation, Y.L.; Resources, Q.C.; Data curation, Y.L. and Q.C.; Writing—original draft, Y.L. and X.L.; Writing—review and editing, Q.C. and T.W.; Visualization, Y.L.; Funding Acquisition, Q.C.; Supervision, Q.C. and T.W. All authors have read and agreed to the published version of the manuscript.
Funding
This research was supported by the National Natural Science Foundation of China (No. 31570706).
Informed Consent Statement
All authors have read, understood, and have complied as applicable with the statement on “Ethical responsibilities of Authors” as found in the Instructions for Authors and are aware that with minor exceptions, no changes can be made to authorship once the paper is submitted.
Data Availability Statement
All data analyzed in the research are presented in the paper, and all can be used to provide appropriate references.
Conflicts of Interest
The authors declare no conflicts of interest.
Appendix A
Table A1.
Ecological contribution rate: positive effect during 2000–2010.
Table A1.
Ecological contribution rate: positive effect during 2000–2010.
| Period | Type of Transformation | Conversion Area/km2 | Ecological Contribution Rate (10−4) | Percentage of Contribution Rate (%) |
|---|---|---|---|---|
| 2000–2010 | P1−E1 | 3 | 2.7 | 1.27% |
| P1−E3 | 34 | 0.6 | 0.28% | |
| P2−P1 | 4 | 4.1 | 1.94% | |
| P2−L1 | 3 | 0.4 | 0.19% | |
| P2−L2 | 5 | 0.7 | 0.33% | |
| P2−E3 | 2 | 2.1 | 0.99% | |
| L1−P1 | 3 | 2.6 | 1.23% | |
| L2−P1 | 84 | 73.6 | 34.73% | |
| L2−E2 | 1 | 0.6 | 0.28% | |
| L2−E3 | 6 | 5.4 | 2.55% | |
| E2−P1 | 3 | 0.8 | 0.38% | |
| E2−E3 | 1 | 0.3 | 0.14% | |
| E4−P1 | 42 | 57.5 | 27.14% | |
| E4−P2 | 10 | 3.6 | 1.70% | |
| E4−L2 | 2 | 1 | 0.47% | |
| E4−E1 | 3 | 6.8 | 3.21% | |
| E4−E2 | 8 | 8.8 | 4.15% | |
| E4−E3 | 29 | 40.3 | 19.02% | |
| sum | 211.9 | 100.00% |
Table A2.
Ecological contribution rate: positive effect during 2010–2020.
Table A2.
Ecological contribution rate: positive effect during 2010–2020.
| Period | Type of Transformation | Conversion Area/km2 | Ecological Contribution Rate (10−4) | Percentage of Contribution Rate (%) |
|---|---|---|---|---|
| 2010–2020 | P1−E3 | 10 | 0.2 | 0.19% |
| P2−P1 | 2 | 2 | 1.85% | |
| P2−E3 | 1 | 1 | 0.92% | |
| L2−P1 | 3 | 2.6 | 2.40% | |
| L2−E3 | 2 | 1.8 | 1.66% | |
| E4−P1 | 26 | 35.6 | 32.90% | |
| E4−P2 | 12 | 4.3 | 3.97% | |
| E4−L2 | 2 | 1 | 0.92% | |
| E4−E3 | 43 | 59.7 | 55.18% | |
| sum | 108.2 | 100.00% |
Table A3.
Ecological contribution rate: negative effect during 2000–2010.
Table A3.
Ecological contribution rate: negative effect during 2000–2010.
| Period | Type of Transformation | Conversion Area/km2 | Ecological Contribution Rate (10−4) | Percentage of Contribution Rate (%) |
|---|---|---|---|---|
| 2000–2010 | P1−P2 | 18 | 18.2 | 9.10% |
| P1−L1 | 26 | 22.8 | 11.40% | |
| P1−L2 | 52 | 45.5 | 22.75% | |
| P1−E2 | 4 | 1.1 | 0.55% | |
| P1−E4 | 16 | 21.9 | 10.95% | |
| P2−E4 | 8 | 2.8 | 1.40% | |
| L2−P2 | 13 | 1.8 | 0.90% | |
| L2−E4 | 1 | 0.5 | 0.25% | |
| E1−P1 | 12 | 10.7 | 5.35% | |
| E1−L2 | 1 | 1.8 | 0.90% | |
| E1−E2 | 5 | 5.8 | 2.90% | |
| E1−E4 | 3 | 6.8 | 3.40% | |
| E2−E4 | 2 | 2.2 | 1.10% | |
| E3−P1 | 102 | 1.9 | 0.95% | |
| E3−P2 | 15 | 15.5 | 7.75% | |
| E3−L1 | 4 | 3.6 | 1.80% | |
| E3−L2 | 2 | 1.8 | 0.90% | |
| E3−E2 | 2 | 0.6 | 0.30% | |
| E3−E4 | 25 | 34.7 | 17.35% | |
| sum | 200 | 100.00% |
Table A4.
Ecological contribution rate: negative effect during 2010–2020.
Table A4.
Ecological contribution rate: negative effect during 2010–2020.
| Period | Type of Transformation | Conversion Area/km2 | Ecological Contribution Rate (10−4) | Percentage of Contribution Rate (%) |
|---|---|---|---|---|
| 2010−2020 | P1−P2 | 24 | 24.3 | 10.52% |
| P1−L1 | 14 | 12.3 | 5.32% | |
| P1−L2 | 20 | 17.5 | 7.57% | |
| P1−E2 | 1 | 0.3 | 0.13% | |
| P1−E4 | 29 | 39.7 | 17.18% | |
| L2−E4 | 1 | 0.5 | 0.22% | |
| E1−L1 | 1 | 1.8 | 0.78% | |
| E2−E4 | 2 | 2.2 | 0.95% | |
| E3−P1 | 31 | 0.6 | 0.26% | |
| E3−P2 | 51 | 52.7 | 22.80% | |
| E3−E4 | 57 | 79.2 | 34.27% | |
| Sum | 231.1 | 100.00% |
References
- Fu, J.C.; Zhang, S.L. Functional assessment and coordination characteristics of production, living, Ecological Function—A Case Study of Henan Province, China. Int. J. Environ. Res. Public Health 2021, 18, 8051. [Google Scholar] [CrossRef] [PubMed]
- Tian, C.; Cheng, L.L.; Shao, Y.C. Characteristics of carbon metabolism efficiency and evolutionary patterns of urban tri-spatial carbon metabolism in the Beijing-Tianjin-Hebei region. Environ. Sci. 2024, 45, 1254–1264. [Google Scholar]
- Zhang, Y.L.; Luan, Q.L.; Xiong, C.S.; Liu, X. Evaluation of spatial heterogeneity and zoning of “production-living-ecological space” based on multi-source spatial data. J. Agric. Eng. 2021, 37, 214–223. [Google Scholar]
- Zhang, K.; Huang, C.H.; Wang, Z.Y.; Wu, J.Y.; Zeng, Z.Q.; Mu, J.J.; Yang, W.Y. Optimisation of the spatial pattern of Sansheng based on the DTTD-MCR-PLUS model—A case study of Changsha City. J. Ecol. 2022, 42, 9957–9970. [Google Scholar]
- Collins, G. The Ciudad Lineal of Madrid. J. Soc. Archit. Hist. 1959, 18, 38–53. [Google Scholar] [CrossRef]
- Collins, G. Linear Planning throughout the World. J. Soc. Archit. Hist. 1959, 18, 74–93. [Google Scholar] [CrossRef]
- Lampygnani, V. Architecture and City Planning of the Twentieth Century; Van Nostrand Reinhold: New York, NY, USA, 1980; p. 256. [Google Scholar]
- Choay, F. The Modern City Planning in the 19th Century; Collin, G., Translator; George Braziller: New York, NY, USA, 1969; p. 128. [Google Scholar]
- Paszkowska-Kaczmarek, N. The Line—The Saudi-Arabian Linear City Concept as the Prototype of Future Cities. Archit. Artibus 2021, 13, 33–46. [Google Scholar]
- Batty, M. The Linear City: Illustrating the logic of spatial equilibrium. Comput. Urban Sci. 2022, 2, 8. [Google Scholar] [CrossRef]
- Ward, S. The Garden City: Past, Present and Future, 1st ed.; Routledge: London, UK, 1992; p. 240. [Google Scholar]
- Totaforti, S. The Garden City and the American Dream. J. Mediterr. Knowl. JMK 2020, 5, 125–140. [Google Scholar]
- Jun, M.J. The Effects of Portland’s Urban Growth Boundary on Housing Prices. J. Am. Plan. Assoc. 2006, 72, 239–243. [Google Scholar] [CrossRef]
- Xiong, H.X.; Min, J. Spatial dynamic evolution of typical mountainous triple life and its influencing factors—Taking Xiushan County of Chongqing as an example. Agric. Technol. 2024, 44, 75–82. [Google Scholar]
- Wei, C.; Wu, Z.; Ye, S.; Wei, X.Y.; Yang, S.F. Analysis on the evolution of land space pattern and driving force of city cluster in the middle reaches of the Yangtze River under the perspective of three zones. Yangtze River Basin Resour. Environ. 2024, 33, 1489–1503. [Google Scholar]
- Yang, S.H.; Li, L.; Ma, J.D.; Guo, W.X. Land use transition and gradient effect in Shanxi Province from 1990 to 2020 under the perspective of production-living-ecological space. Arid Zone Res. 2024, 41, 1249–1258. [Google Scholar]
- Ding, H.M.; Yang, C.X.; Li, X.; Lv, Z.Q.; Zuo, Y.Y. Evolution of land use functions and their ecological and environmental effects in traditional agricultural areas of the plateau. Soil Water Conserv. Res. 2022, 29, 399–407. [Google Scholar]
- Chen, J.; Gao, M.; Cheng, S.L.; Hou, W.X.; Song, M.L.; Liu, X.; Liu, Y. Global 1 km × 1 km gridded revised real gross domestic product and electricity consumption during 1992–2019 based on calibrated nighttime light data. Sci Data 2022, 9, 202. [Google Scholar] [CrossRef] [PubMed]
- Xu, L.X. China GDP spatial distribution kilometer grid dataset. Resource and Environmental Science Data Registration and Publication System. Chin. Acad. Sci. 2017, 10, 2017121102. [Google Scholar]
- Li, X.W.; Fang, C.L.; Huang, J.C.; Mao, H.Y. Urban land use change in Northwest China and its regional ecological and environmental effects—A case study of Hexi area in Gansu. Quat. Res. 2003, 3, 280–290. [Google Scholar]
- Yang, Q.K.; Duan, X.J.; Wang, L.; Jin, Z.F. Land use transformation and ecological and environmental effects based on “production-living-ecological space”—A case study of the core area of the Yangtze River Delta. Geoscience 2018, 38, 97–106. [Google Scholar]
- He, Q.Z.; Xie, D.T.; Wang, S.; Yan, J.Z.; Chen, L. Land use transformation and ecological environmental effects in Beibei District, Chongqing. Res. Soil Water Conserv. 2019, 26, 290–296. [Google Scholar]
- Cheng, J.; Cheng, J.M.; Wu, J.X.; Xu, Y.T. Land use change and ecosystem service function change in the Yangtze River Basin from 2000 to 2010. Yangtze River Basin Resour. Environ. 2017, 26, 894–901. [Google Scholar]
- Jing, L.; Li, M. Coupling relationship between land use change and ecological environment in Yanchi County. China Soil Water Conserv. Sci. 2020, 18, 19–25. [Google Scholar]
- Yin, G.L.; Shao, J.A.; Guo, Y.; Dang, Y.F.; Xu, X.L. Study on land use change and its ecological environment response in the core area of the South-to-North Water Diversion Centre. J. Geo-Inf. Sci. 2017, 19, 59–69. [Google Scholar]
- Chen, W.X.; Li, J.F.; Zeng, J.; Ran, D.; Yang, B. Spatial heterogeneity and formation mechanism of ecological and environmental effects of land use change in China. Geogr. Res. 2019, 38, 2173–2187. [Google Scholar]
- Wang, J.F.; Xu, C.D. Geoprobes: Principles and perspectives. J. Geogr. 2017, 72, 116–134. [Google Scholar]
- Song, Y.Z.; Wang, J.F.; Ge, Y.; Xu, C.D. An optimal parameters-based geographical detector model enhances geographic characteristics of explanatory variables for spatial heterogeneity analysis: Cases with different types of spatial data. GISci. Remote. Sens. 2020, 57, 593–610. [Google Scholar] [CrossRef]
- Zhao, Y.J.; Wang, B.F.; Zhang, D.W.; Sun, L.L.; Zhao, N.; Xin, M.Y.; Niu, L.L.; Zhang, L. Effects of agrometeorological conditions on rice growth in Panjin, Liaoning. Agric. Eng. Technol. 2019, 39, 92. [Google Scholar]
- Li, C.L.; Zhou, G.S.; Zhou, M.Z.; Zhou, L.; Liu, J. Net ecosystem productivity of Panjin reed wetland and its influencing factors from 1971 to 2020. J. Appl. Ecol. 2023, 34, 1331–1340. [Google Scholar]
- Yang, R.; Deng, W.B. Analysis of land use transformation and ecological environment effect in Urumqi city under the perspective of production-living-ecological space. Sci. Technol. Eng. 2024, 24, 5742–5752. [Google Scholar]
- Wang, L.; Xiong, C.S.; Tian, Y.; Zhou, B.X. Evaluation of spatial functional heterogeneity, spatial and temporal evolution, and zonal regulation of production-living-ecological space in China. J. Agric. Eng. 2024, 40, 265–275. [Google Scholar]
- Li, L.; Bai, Y.; Yang, X.; Gao, Z.; Qiao, F.; Liang, J.; Zhang, C. A Low-Carbon Land Use Management Framework Based on Urban Carbon Metabolism: A Case of a Typical Coal Resource-Based City in China. Sustainability 2022, 14, 13854. [Google Scholar] [CrossRef]
- Zou, L.L.; Liu, Y.S.; Wang, J.Y.; Yang, Y.Y. An analysis of land use conflict potentials based on ecological-production-living function in the southeast coastal area of China. Ecol. Indic. 2021, 122, 107297. [Google Scholar] [CrossRef]

Disclaimer/Publisher’s Note: The statements, opinions and data contained in all publications are solely those of the individual author(s) and contributor(s) and not of MDPI and/or the editor(s). MDPI and/or the editor(s) disclaim responsibility for any injury to people or property resulting from any ideas, methods, instructions or products referred to in the content. |
© 2024 by the authors. Licensee MDPI, Basel, Switzerland. This article is an open access article distributed under the terms and conditions of the Creative Commons Attribution (CC BY) license (https://creativecommons.org/licenses/by/4.0/).