Article

How Does the Urban Built Environment Affect the Accessibility of Public Electric-Vehicle Charging Stations? A Perspective on Spatial Heterogeneity and a Non-Linear Relationship

School of Architecture and Urban Planning, Kunming University of Science and Technology, Kunming 650500, China
*
Authors to whom correspondence should be addressed.
Sustainability 2025, 17(1), 86; https://doi.org/10.3390/su17010086
Submission received: 18 November 2024 / Revised: 22 December 2024 / Accepted: 25 December 2024 / Published: 26 December 2024
(This article belongs to the Topic Sustainable Built Environment, 2nd Volume)

Abstract

:
The deployment of electric vehicle charging stations (EVCSs) is crucial for the large-scale adoption of electric vehicles and the sustainable energy development of global cities. However, existing research on the spatial distribution of EVCSs has provided limited analysis of spatial equity from the perspective of supply–demand relationships. Furthermore, studies examining the influence of the built environment on EVCS accessibility are scarce, and often rely on single methods and perspectives. To explore the spatial characteristics of EVCS accessibility and its influencing factors, using multi-source urban spatial data, this study initially employs the Gaussian two-step floating catchment area (G2SFCA) method to measure and analyze the spatial distribution characteristics of EVCS accessibility in Guangzhou, China, with consideration of supply–demand relationships. Subsequently, it integrates the MGWR and random forest (RF) models to comprehensively investigate the impact mechanism of the built environment on EVCS accessibility from the perspectives of spatial heterogeneity and non-linear relationship. The results show that the EVCS accessibility exhibits a “ higher in the west and lower in the east, with extreme core concentration” distribution pattern, and has significant spatial autocorrelation. The built-environment variables exhibit different scale effects and spatial non-stationarity, with widespread non-linear effects. Among them, the auto service, distance to regional center, and distance to subway station play important roles in influencing EVCS accessibility. These findings offer important guidance for the efficient and equitable layout of EVCSs in high-density cities.

1. Introduction

Amid the rapid growth of population and urban expansion, energy conservation and emission reduction have become critical issues for global urban sustainability. Electric vehicles (EVs), with their significant advantages in zero tailpipe emissions and high energy efficiency, have seen rapid development and widespread adoption over the past decade. They have emerged as a key solution for alleviating energy shortages and promoting carbon neutrality in recent years [1]. In 2023, global EV sales approached 14 million, marking a 35% increase from 2022 and six times the sales figure of 2018 [2]. To meet growing charging demands, electric vehicle charging stations (EVCSs) have also expanded rapidly as essential infrastructure in urban areas [3], with the number of EVCSs increasing by more than 40% in 2023 compared to the previous year [2]. Although home charging remains the most common method, ensuring effective coverage and equitable distribution of EVCSs is still crucial for the large-scale adoption of electric vehicles. This is particularly important in high-density cities, where private chargers often cannot meet the increasing demand for EV charging in densely populated, high-rise areas [4].
In recent years, the efficient layout of EVCSs from a spatial analysis perspective has become a significant topic in fields such as urban planning, geography, and transportation. On one hand, existing studies have primarily focused on identifying potential spatial patterns of EVCS layouts and optimizing site selection [5,6]. However, such research, which primarily centers on charging demand and location optimization, often overlooks the spatial equity of urban residents’ access to service facilities. In recent years, studies on the layout of EVCSs based on accessibility have effectively highlighted the equity of residents’ access to service facilities at regional or city-wide levels. Among these, a limited number of studies have employed the two-step floating catchment area (2SFCA) method and its variations to account for both charging behavior demands and the service capacity of facilities [7,8]; on the other hand, investigating the factors influencing the unequal distribution of EVCSs has been identified as a critical component of effective facility layout planning. These factors often revolve around socioeconomic conditions (e.g., income, population, ethnicity [9,10]), with only a few studies addressing built-environment characteristics (e.g., service facilities, transportation conditions [10,11]). Furthermore, although global linear regression and spatial regression methods have been employed in recent years to explore the key factors influencing EVCS layouts [7,12,13], the spatial scale variations and non-linear patterns of these influences remain largely unexplored.
Therefore, this study uses the Gaussian two-step floating catchment area (G2SFCA) method to measure the EVCS accessibility in Guangzhou, China. It also employs MGWR and random forest models to examine the spatial heterogeneity and non-linear effects of built-environment factors on accessibility. The objectives of this study are as follows: (1) to identify the geographic distribution patterns and spatial heterogeneity of EVCS accessibility. (2) To systematically investigate the underlying mechanisms through which the urban built environment influences EVCS accessibility, from the perspectives of spatial heterogeneity and a non-linear relationship, by combining the MGWR model with the interpretable machine learning model. (3) To propose policy recommendations and strategies for the efficient and equitable layout of EVCSs in high-density cities, based on a multi-perspective analysis of the built-environment’s influence on EVCS accessibility.
The structure of this study is as follows: Section 2 reviews the literature on the spatial deployment of EVCS and its influencing factors. Section 3 describes the data and methods employed in the study. Section 4 displays the empirical results. Section 5 discusses the findings. Finally, Section 6 concludes and offers policy recommendations.

2. Literature Review

Based on considerations of charging demand and location optimization in EVCS planning [5,6], current research focuses on two aspects. The first is to reveal the potential spatial patterns of facility layout, including charging-based assessments and planning [6,12], spatial characteristics of station coverage density and charging capacity [10,11,14,15], and the spatiotemporal distribution of charging demand [13,16]. The second is to optimize the layout of EVCSs based on charging data, to improve accessibility for electric vehicle users, including location optimization of EVCS [17,18,19], and multi-criteria decision-making for site selection [18,20,21]. However, existing research mainly focuses on current charging demand and activities. This approach, which merely increases the number of charging stations to improve the layout, is inadequate to ensure the efficient and equitable promotion of charging infrastructure [22]. Particularly, there is a lack of consideration for spatial equity in residents’ access to public facilities, which is an important criterion for evaluating the quality of facility layout [23]. For example, Nicholas et al. [24] found that electric vehicle users tend to prioritize proximity over the best predictive location when selecting charging facilities.
Accessibility, defined as the ease with which individuals can reach activity locations [25], has been widely used in urban transportation to assess the equity of residents’ access to public facilities at different locations within a city [22,25]. Generally, there are four common methods for measuring the accessibility of service facilities: gravity-based, opportunity-based, utility-based, and spatiotemporal measurement [22]. Among these, the opportunity-based method calculates the number of opportunities to reach sources from a designated location within fixed travel times and distances [26]. It has been widely adopted in planning practice and policy-making, due to its interpretability and comparability. In the few existing studies on the accessibility of charging infrastructure in recent years, most have primarily focused on China [7,22,27], Europe [8,28], and the United States [29,30,31,32], which are the top three countries (regions) globally in terms of charging infrastructure distribution [2]. Based on the content of these studies, they can be divided into two aspects, according to scale differences. On one hand, some research measures the unequal distribution of charging infrastructure across regions, such as between countries or within domestic regional differences, as well as the urban–rural divide [14,28,30]. On the other hand, some studies focus on measuring facility inequality within cities, often using communities or census tracts as the basic unit of analysis [7,22,27,29]. Within cities, considering the competition between units and the supply capacity of facilities, population density and the number of chargers (or charging capacity) are used to represent the demand and supply levels of charging behavior. In terms of research methodologies, the two-step floating catchment area (2SFCA) model, the Gaussian-based two-step floating catchment area (G2SFCA) model, and the least-cost path algorithm have been utilized in recent years to examine spatial differences in EVCS accessibility [7,8,27,29,30,33]. Among these methods, the 2SFCA model and its improved variants account for regional competition and the supply capacity of service facilities, often using population density and service capacity metrics (e.g., number of charger, station charging capacity, and number of vehicle turnover) to represent the demand and supply levels of charging behavior [7,8,33].
As research advances, the exploration of the impact of socioeconomic characteristics and the urban built environment on the unequal distribution of public charging infrastructure has proven to be a key component in the effective layout of facilities. Socioeconomic attributes, which reflect individual differences, are commonly employed to assess social inequalities in the distribution of charging infrastructure [15], including household income [7,9], education level [7], race [9], population density [10,27], and land prices [10]. However, socioeconomic characteristics only provide an objective reflection of demographic features and are insufficient to directly guide urban spatial adjustments and interventions to optimize the spatial allocation of facilities. Therefore, considering the complex elements involved in measuring the spatial layout of EVCSs, subsequent analyses extend to the quantification of the built-environment and transportation characteristics. Generally, charging behavior, as an activity-based service within the city, results in variations in users’ access activities due to the distribution of urban activity facilities [10]. Several studies have investigated the impact of land-use facilities, such as residential, employment, and recreational facilities, on the distribution of EVCSs, based on the spatial distribution of Points of Interest (POIs) [10,13,15]. Moreover, other research has analyzed the influence of construction activity levels and transportation conditions, such as building density [11] and distance to highways [29,34].
Spatial regression models have been used to explore key factors influencing the layout of EVCSs. For example, the spatial lag model (SLM) and spatial error model (SEM) have been employed to investigate the relationship between the built environment and charging demand [12,13]. However, these spatial econometric models, as global regression models, examine the global scale impact of variables based on the linear distribution trend of sample values, which limits their ability to capture spatial variations. Therefore, considering that the effects of environmental variables may exhibit spatial differences, the geographically weighted regression (GWR), as a local model for investigating spatial non-stationarity, has been used to reveal the spatial distribution of regression parameters within regions [7,29]. However, while the GWR model compensates for the lack of spatial heterogeneity in global regression models, its fixed “bandwidth” setting may overlook the spatial-heterogeneity scale differences among variables, leading to estimation errors [35]. In this context, the multiscale geographically weighted regression (MGWR), as an improved version of GWR, optimizes the bandwidth for each variable, allowing for a more comprehensive consideration of spatial variation in the relationships between variables [35,36]. With the continuous advancement of machine learning technologies in recent years, the use of machine learning models to reveal the non-linear effects of environmental factors has increased in urban spatial studies. For instance, Zhang et al. [8] used the XGBoost model to explore the determinants of EVCS accessibility. Compared with traditional global regression models and spatial analysis models (GWR, MGWR), interpretable machine learning models can better capture the complex non-linear relationships between independent and dependent variables. Therefore, from the perspective of non-linear relationships and spatial heterogeneity, these models provide a more scientific and comprehensive way to reveal the complex influence relationships and spatial mechanisms of variables [37].
As mentioned above, while existing studies have explored the spatial layout patterns of EVCSs, several limitations remain: (1) in terms of research content, although some studies have begun to use accessibility to assess the layout characteristics of EVCS, the measurement of the unequal distribution remains insufficient from the perspective of supply and demand relationships. Furthermore, current research seldom addresses the potential built-environment factors that contribute to the differential distribution of EVCSs. (2) In terms of research methods, existing studies mainly adopt traditional global linear regression models and spatial analysis models (such as GWR) to reveal the singular impact relationships or spatial scale effects of various factors on EVCS accessibility. However, these models are limited in capturing the spatial scale differences and non-linear patterns in the impact of variables on EVCS accessibility.

3. Materials and Methods

3.1. Study Framework

The four-step workflow in this study is shown in Figure 1. (1) We integrated EVCS static data, population data, and road network data, utilizing ArcMap 10.8.1 to process and analyze the EVCS accessibility and its spatial distribution characteristics in Guangzhou, China. (2) We employed ArcMap 10.8.1 to process and analyze road network data, urban point of interest data (POI), and building footprint data, quantifying the built environment characteristics of 2139 grid units within the study area. (3) We utilized linear regression and the MGWR model to examine the relationship between the built environment and EVCS accessibility, revealing the spatial heterogeneity of the environmental variables’ effects. (4) We investigated the non-linear relationship between built-environment factors and EVCS accessibility using partial dependence plots based on the RF Model, and performed a joint analysis of the built-environment’s potential mechanisms influencing EVCS accessibility, accounting for spatial heterogeneity.

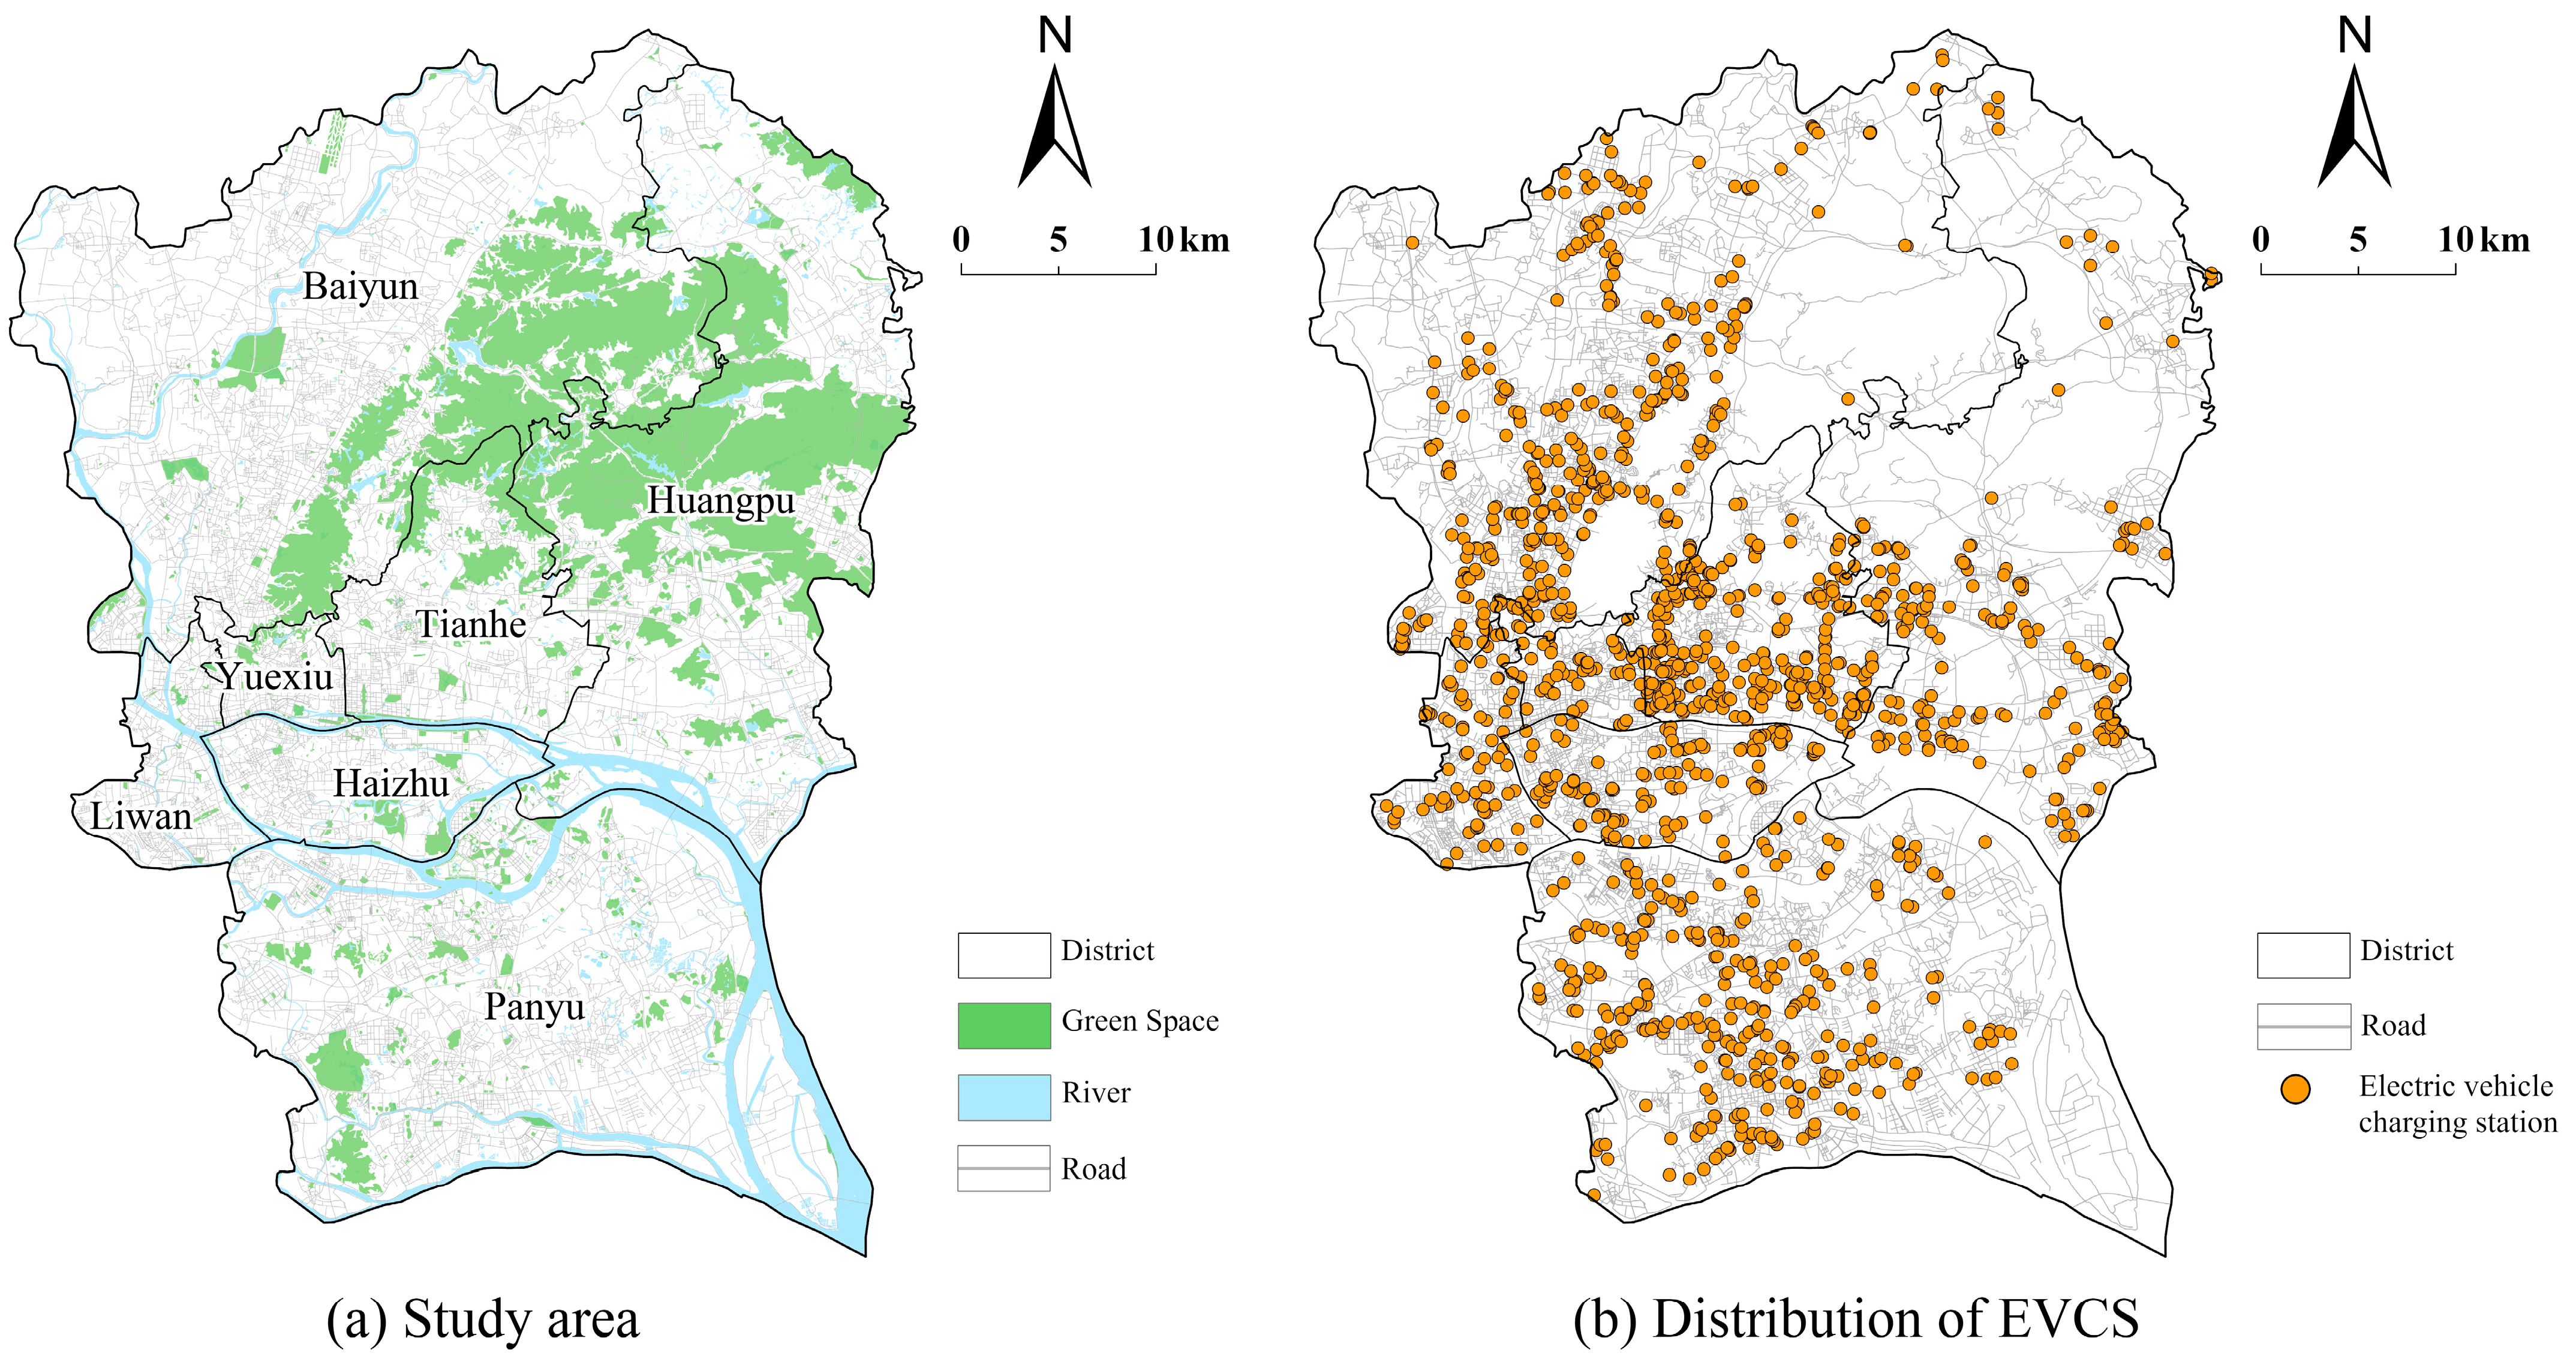
3.2. Study Area and Data

As an important central city in South China, Guangzhou governs 11 districts, with a permanent population of approximately 18.8 million in 2023 [38]. By June 2022, Guangzhou had more than 76,300 public and private charging piles and 350,000 electric vehicles [39], and had implemented several policies to actively support the development of supercharging facilities and the layout of public charging networks [39]. Notably, to effectively build the “Supercharging Capital”, Guangzhou plans to establish approximately 1000 superfast charging stations by 2024, as emphasized in the “Guangzhou Three-Year Action Plan for Accelerating the Construction of Electric Vehicle Charging Infrastructure (2022–2024)” [39]. This study focuses on the seven core districts of Guangzhou (Figure 2). These seven districts form the center of the city’s social, economic, and industrial development and are key areas for regional public service facilities. Among them, Liwan, Yuexiu, and Haizhu are traditional city centers, while Tianhe is an emerging functional urban core area. Panyu, Huangpu, and Baiyun are important modern industrial hubs. This study uses a “1 km × 1 km” grid as the basic analytical unit, which is commonly used in big data-based urban studies and accessibility measurement of facilities [40]. Following the delineation of the study area, a total of 2139 grid cells were obtained.
The data used in this study primarily consists of the following five categories: (1) the EVCS static data were obtained from the Amap (https://lbs.amap.com/) in June 2022. Firstly, Python 3.6 was employed to access the server’s open ports and retrieve EVCS site data, including fields such as latitude and longitude coordinates, charging station names, etc. Secondly, by combining the basic information of the charging stations published by Amap, the number of chargers at each site was manually entered into the ArcGIS 10.8. After removing invalid data (such as missing charger numbers or abnormal operational status), a total of 1369 EVCSs were obtained (Figure 1), with a total of 25,292 chargers (21,838 fast chargers and 3454 slow chargers). (2) Road network data were obtained from OpenStreetMap (https://www.openstreetmap.org/). The road network data were processed using ArcMap 10.8.1, including clipping, cleaning, and topological adjustments, with interruptions at intersections. (3) Population data were obtained from the National Earth System Science Data Center (https://www.geodata.cn) [41]. They were derived from the seventh national population census at the county and township levels in China, providing an updated population grid with a 100 m resolution, effectively capturing the spatial distribution of the resident population in urban areas. (4) Building-footprint data were obtained from the Zenodo database [42], which offers global building height information, comprising both outlines and height attributes of buildings. (5) Points of Interest (POI) data were obtained from the Amap (https://lbs.amap.com/) in June 2022.

3.3. Variables

3.3.1. Dependent Variables

This study employs the G2SFCA method to measure the EVCS accessibility in Guangzhou from the perspective of supply and demand relationships. Compared to merely reflecting the layout patterns of urban public charging infrastructure through the spatial distribution, measuring EVCS accessibility has two key advantages. Firstly, by considering the interaction between charging demand and the supply of charging facilities, this method offers a more thorough representation of the convenience with which urban residents can access services across different regions, which is crucial for the efficient and equitable layout of EVCSs. Secondly, the distance decay based on the Gaussian function accounts for the maximum distance at which residents can access service facilities, enabling a more precise assessment of the regional variations in access to car charging services across different regions [7,43].

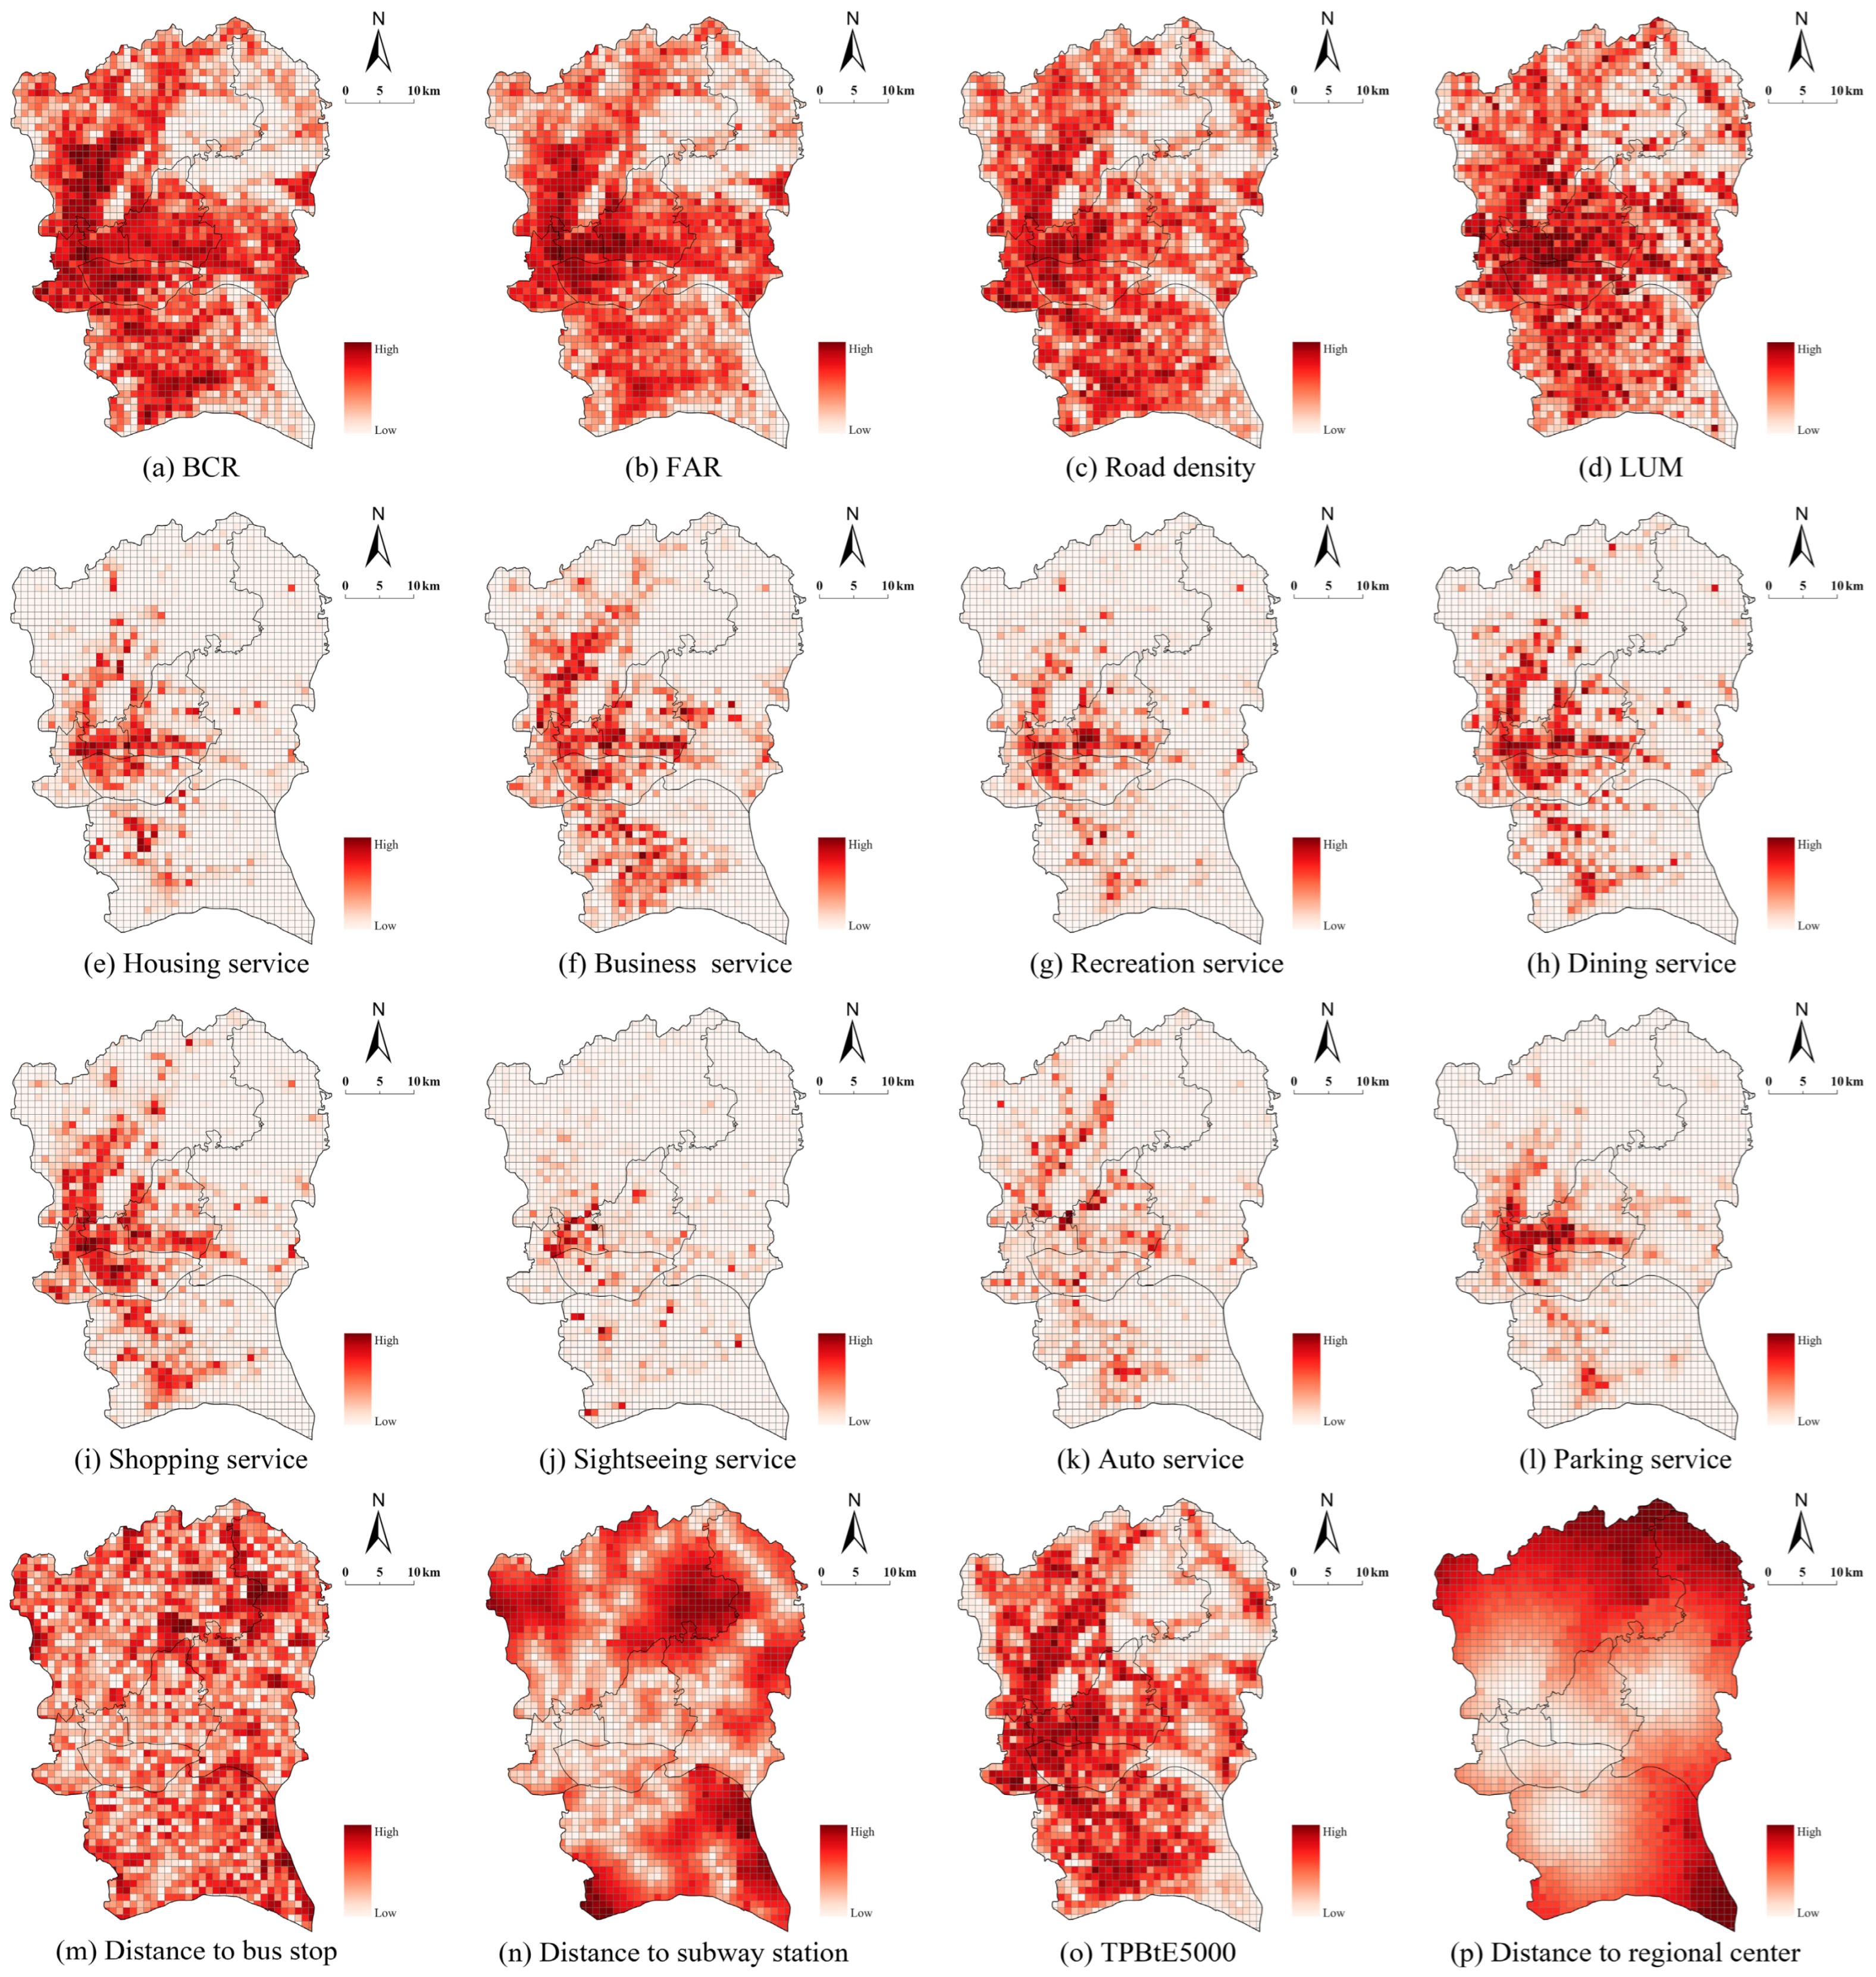
3.3.2. Independent Variables

Based on the focus of this study and prior research findings, and with reference to the widely used “5Ds” framework of the built environment, we selected a total of 16 urban built-environment variables from five aspects that may influence EVCS accessibility [10,11,13,15]. Descriptive statistics for each indicator are shown in Table 1, and spatial visualization features are presented in Figure 3.
Density is measured by the building coverage ratio (BCR), floor area ratio (FAR), and road density. The BCR and FAR reflect the intensity of construction activities within the grid unit. The calculation methods for both are shown in Formulas (1) and (2). The road density reflects the connectivity of streets within the grid unit, which underpins the accessibility of service facilities for electric vehicles.
B C R = i = 1 n m i S
F A R = i = 1 n m i × f i S
where i refers to a building within the grid unit; m i refers to the footprint area of the i -th building; f i refers to the number of floors of the i -th building; and   S refers to the area of the grid unit.
Diversity is measured by land-use mix (LUM), reflecting the land-use composition of each grid. We counted the number of first-level POI categories in each grid and employed location entropy to quantify diversity [44].
L U M = j = 1 A p i j ln p i j
where p i j refers to the proportion of the j -th type of POI within unit i relative to the total number of POIs in the unit; A refers to the number of POI types in the unit.
Land use is measured by eight facility types related to the density of charging service infrastructure. These include (1) housing service; (2) business service; (3) recreation service; (4) dining service; (5) shopping service; (6) sightseeing service; (7) auto service; and (8) parking service. Specifically, type (1) and (2) reflect areas which are essential for long-duration charging events during daytime and night-time. Type (3–6) reflect charging locations based on non-essential activities related to daily leisure and consumption. Furthermore, considering the policy advocated by Guangzhou to integrate the layout of charging facilities with other service infrastructures, we have specifically included two categories of facilities: auto service and parking service.
Distance to transit is measured by the distance to bus stop and subway station, which were determined using the tool of “Find Closest Facilities” in ArcMap 10.8.1. These two indicators were included because public transportation accessibility may influence residents’ decisions to drive, and affect the layout of service facilities.
Destination accessibility is measured by TPBtE5000 and distance to regional center. TPBtE5000 is analyzed using the spatial design network analysis (sDNA) [45], which reflects the likelihood that a road segment is traversed by traffic within a fixed radius [46]. A higher value indicates a higher probability of traffic flow passing through the road segment. Considering the driving comfort distance for electric vehicle users [47,48], a search radius of 5000 m is set. Additionally, the distance to regional center reflects the spatial characteristics of the study units, which was determined using the tool of “Find Closest Facilities” in ArcMap 10.8.1.

3.4. Method

3.4.1. Gaussian Two-Step Floating Catchment Area (G2SFCA)

As an improved model of the traditional two-step floating catchment area (2SFCA) method, the G2SFCA method has gradually been applied to the accessibility assessment of travel behavior, service facilities, and green spaces [49,50,51]. Compared to the 2SFCA, G2SFCA incorporates a distance decay function in its formula, providing a more precise representation of how service facility accessibility varies with distance decay, thus making its evaluation results more reliable [43]. The calculation process of the G2SFCA method includes two steps, as follows:
Step 1: Calculate the supply–demand ratio for EVCS location j :
R j = S j k d j , k d 0 p k H d j , k , d 0
where S j refers to the capacity of EVCS location j . Considering the differences in charging capacity and rate between fast-charging and slow-charging stations, this study assumes that one fast charger can serve 48 EVs per day, while one slow charger can serve 4 EVs [8]. Therefore, the charging capacity of each EVCS is the total capacity of all chargers within that facility. R j refers to the supply–demand ratio for EVCS location j within the search threshold; p k refers to the charging demand (indicated by the population density of location k ); d j , k refers to the distance between EVCS location j and demand location k . In this study, d 0 refers to the maximum travel distance for a demand point to reach an EVCS, set to 5 km in this study, which is the commonly accepted comfortable commuting distance for urban residents in China. Additionally, research indicates that residents consider a travel time of 10 min to a charging station acceptable [47], while the average driving speed on urban roads in Guangzhou on weekdays in 2022 was 32.81 km/h [48]. Notably, unlike most studies that measure the straight-line distance between supply and demand points, this study calculates network distance using the tool of “Find Closest Facilities”, providing a more accurate reflection of residents’ route choices when driving. H d j , k , d 0 refers to the Gaussian function considering distance impedance, with the following formula:
H d j , k , d 0 = e 1 2 × d j , k d 0 2 e 1 2 , d j , k d 0 1 e 1 2 0 , d j , k > d 0
Step 2: Calculate the accessibility of the neighborhood population at location k :
A k = j d j , k d 0 R j H d j , k , d 0
where A k refers to the accessibility values for location k . R j is the supply–demand ratio within the search area of step 1.

3.4.2. Multiscale Geographically Weighted Regression (MGWR)

The MGWR model improves upon the classic geographically weighted regression (GWR) model by overcoming the limitation of using a uniform bandwidth for all variables [35,36]. The model allows different bandwidths to be assigned to each variable, thereby reflecting varying spatial scale effects. Specifically, the smaller the bandwidth selected for a variable, the smaller its impact on the overall spatial scale, indicating a stronger spatial heterogeneity [36]. The calculation formula is as follows:
y i = j = 1 k β b w j u i , v i x i j + ε i
where x i j refers to the j -th predictor variable; u i , v i refers to the centroid coordinates of the grid unit; β b w j refers to the bandwidth of the regression coefficient for the j -th variable; and ε i refers to the residual term. This study employs MGWR 2.2 for model computations and ArcMap 10.8.1 for visualization analysis.

3.4.3. Random Forest Model

The random forest (RF) model, introduced by Leo Breiman in 2001, is a machine learning algorithm based on decision trees [52]. It employs bootstrap resampling to select a subset of samples from the original dataset to build decision trees, and then combines multiple decision trees to perform classification or regression tasks. In the case of random forest regression (RFR), the model assumes the training set is independently drawn from the distribution of random vectors Y and X, and outputs the average prediction of k regression trees. Its advantage lies in its ability to model the complex non-linear relationships between independent and dependent variables [53,54].

4. Results

4.1. Spatial Differences of EVCS Accessibility

4.1.1. Spatial Distribution Characteristics

Overall, the EVCS accessibility in Guangzhou exhibits a spatial distribution trend of “higher in the west and lower in the east”, with distinct high-value clusters forming in the northern, central, and southern parts of the study area (Figure 4). Additionally, the “Hot Spot Analysis” tool in ArcMap was employed to identify spatial clustering patterns with statistically significant high values (hot spots) and low values (cold spots) (Figure 4) [55]. We found that the hot spots primarily occur in northern Baiyun, the junction of central Tianhe and Huangpu, and southern Panyu. The cold spots are mostly clustered in the eastern fringe of the study area, further confirming the spatial distribution characteristics mentioned above.
Specifically, three distinct high-value core clusters have formed within the study aera: (1) Northern core: including the Airport Economic Zone (near Baiyun International Airport), Baiyun Lake Digital Technology City in central Baiyun, and the old urban center of Baiyun. (2) Central core: Including the Guangzhou East Railway Station area in western Tianhe, Guangzhou International Financial City in southeastern Tianhe, Tianhe Smart City in eastern Tianhe, and Huangpu Science City in western Huangpu. (3) Southern core: including the Guangzhou South Railway Station area and the Changlong-Wanbo area in western Panyu. Unlike the central and northern regions, where high accessibility values are relatively contiguous, the Guangzhou South Railway Station area in the southern part is more isolated from surrounding areas, resulting in localized “islands” of lower accessibility. Overall, the high-value areas of EVCS accessibility correlate with industrial spatial structure and the core areas of key industry development in Guangzhou (such as business, exhibitions, economy headquarters, and technology innovation centers).
In contrast, the urban fringe areas to the north, east, and south, especially along the Maofeng mountain range in the north and the suburban areas in southeastern part of Panyu, exhibit notably lower accessibility (including null-value areas). Curiously, the traditional urban center of Guangzhou (the junction and surrounding areas of Liwan, Haizhu, and Yuexiu) shows generally lower accessibility compared to other nearby urban center areas. One possible reason is that the traditional central area, due to long-term high-density construction activities, has placed strain on land-use resources, limiting the space available for new infrastructure services (such as EVCSs). Additionally, the traffic congestion caused by high population density has driven residents to rely more on the highly developed public transportation network for short-distance travel rather than private car use. To some extent, this has diminished the willingness of residents to purchase electric vehicles and their demand for charging facilities.

4.1.2. Spatial Clustering Characteristics

In order to explore the spatial clustering characteristics of EVCS accessibility, we conducted a global spatial autocorrelation analysis. The results show that the Moran’s I value for the EVCS accessibility in Guangzhou is as high as 0.860, which passes a significance test at the 1% level. This indicates that the distribution of EVCS accessibility is not random, but rather exhibits positive spatial dependence and clustering effects. Further visualization of the spatial clustering characteristics of EV accessibility was conducted using the local spatial autocorrelation methods (Figure 5). The results show that the EVCS accessibility exhibits a clear spatial imbalance, with distinct local clustering of “high–high” and “low–low” associations. Specifically, 13.6% of the grid units show high accessibility in the region, thereby influencing the high accessibility of surrounding areas, such as the Guangzhou South Railway Station area, Guangzhou International Financial City, and the Airport Economic Zone. Meanwhile, 22.2% of the grid units show low accessibility in the region, thereby reducing the accessibility of surrounding areas, such as the Guangzhou International Port area in northwestern Baiyun, Guangzhou Knowledge City area in northern Huangpu, and Lianhuawan area in southern Panyu.

4.2. The Results of MGWR

4.2.1. Spatial Autocorrelation of Built Environment

Firstly, spatial autocorrelation analysis was conducted on the 16 variables. The results indicate that each variable exhibits clear clustering patterns, which is suitable for the subsequent construction of the MGWR model (Table 2). Specifically, the distance to regional center and subway station, and population density show significant spatial clustering. Secondly, we employed ordinary least squares (OLS) regression to check for multicollinearity among the independent variables. The results show that the variance inflation factor (VIF) values for BCR, FAR, and dining service exceed 7.5, indicating the presence of multicollinearity. These three variables were excluded from further analysis. Finally, the remaining 13 variables were retained for the subsequent model development.

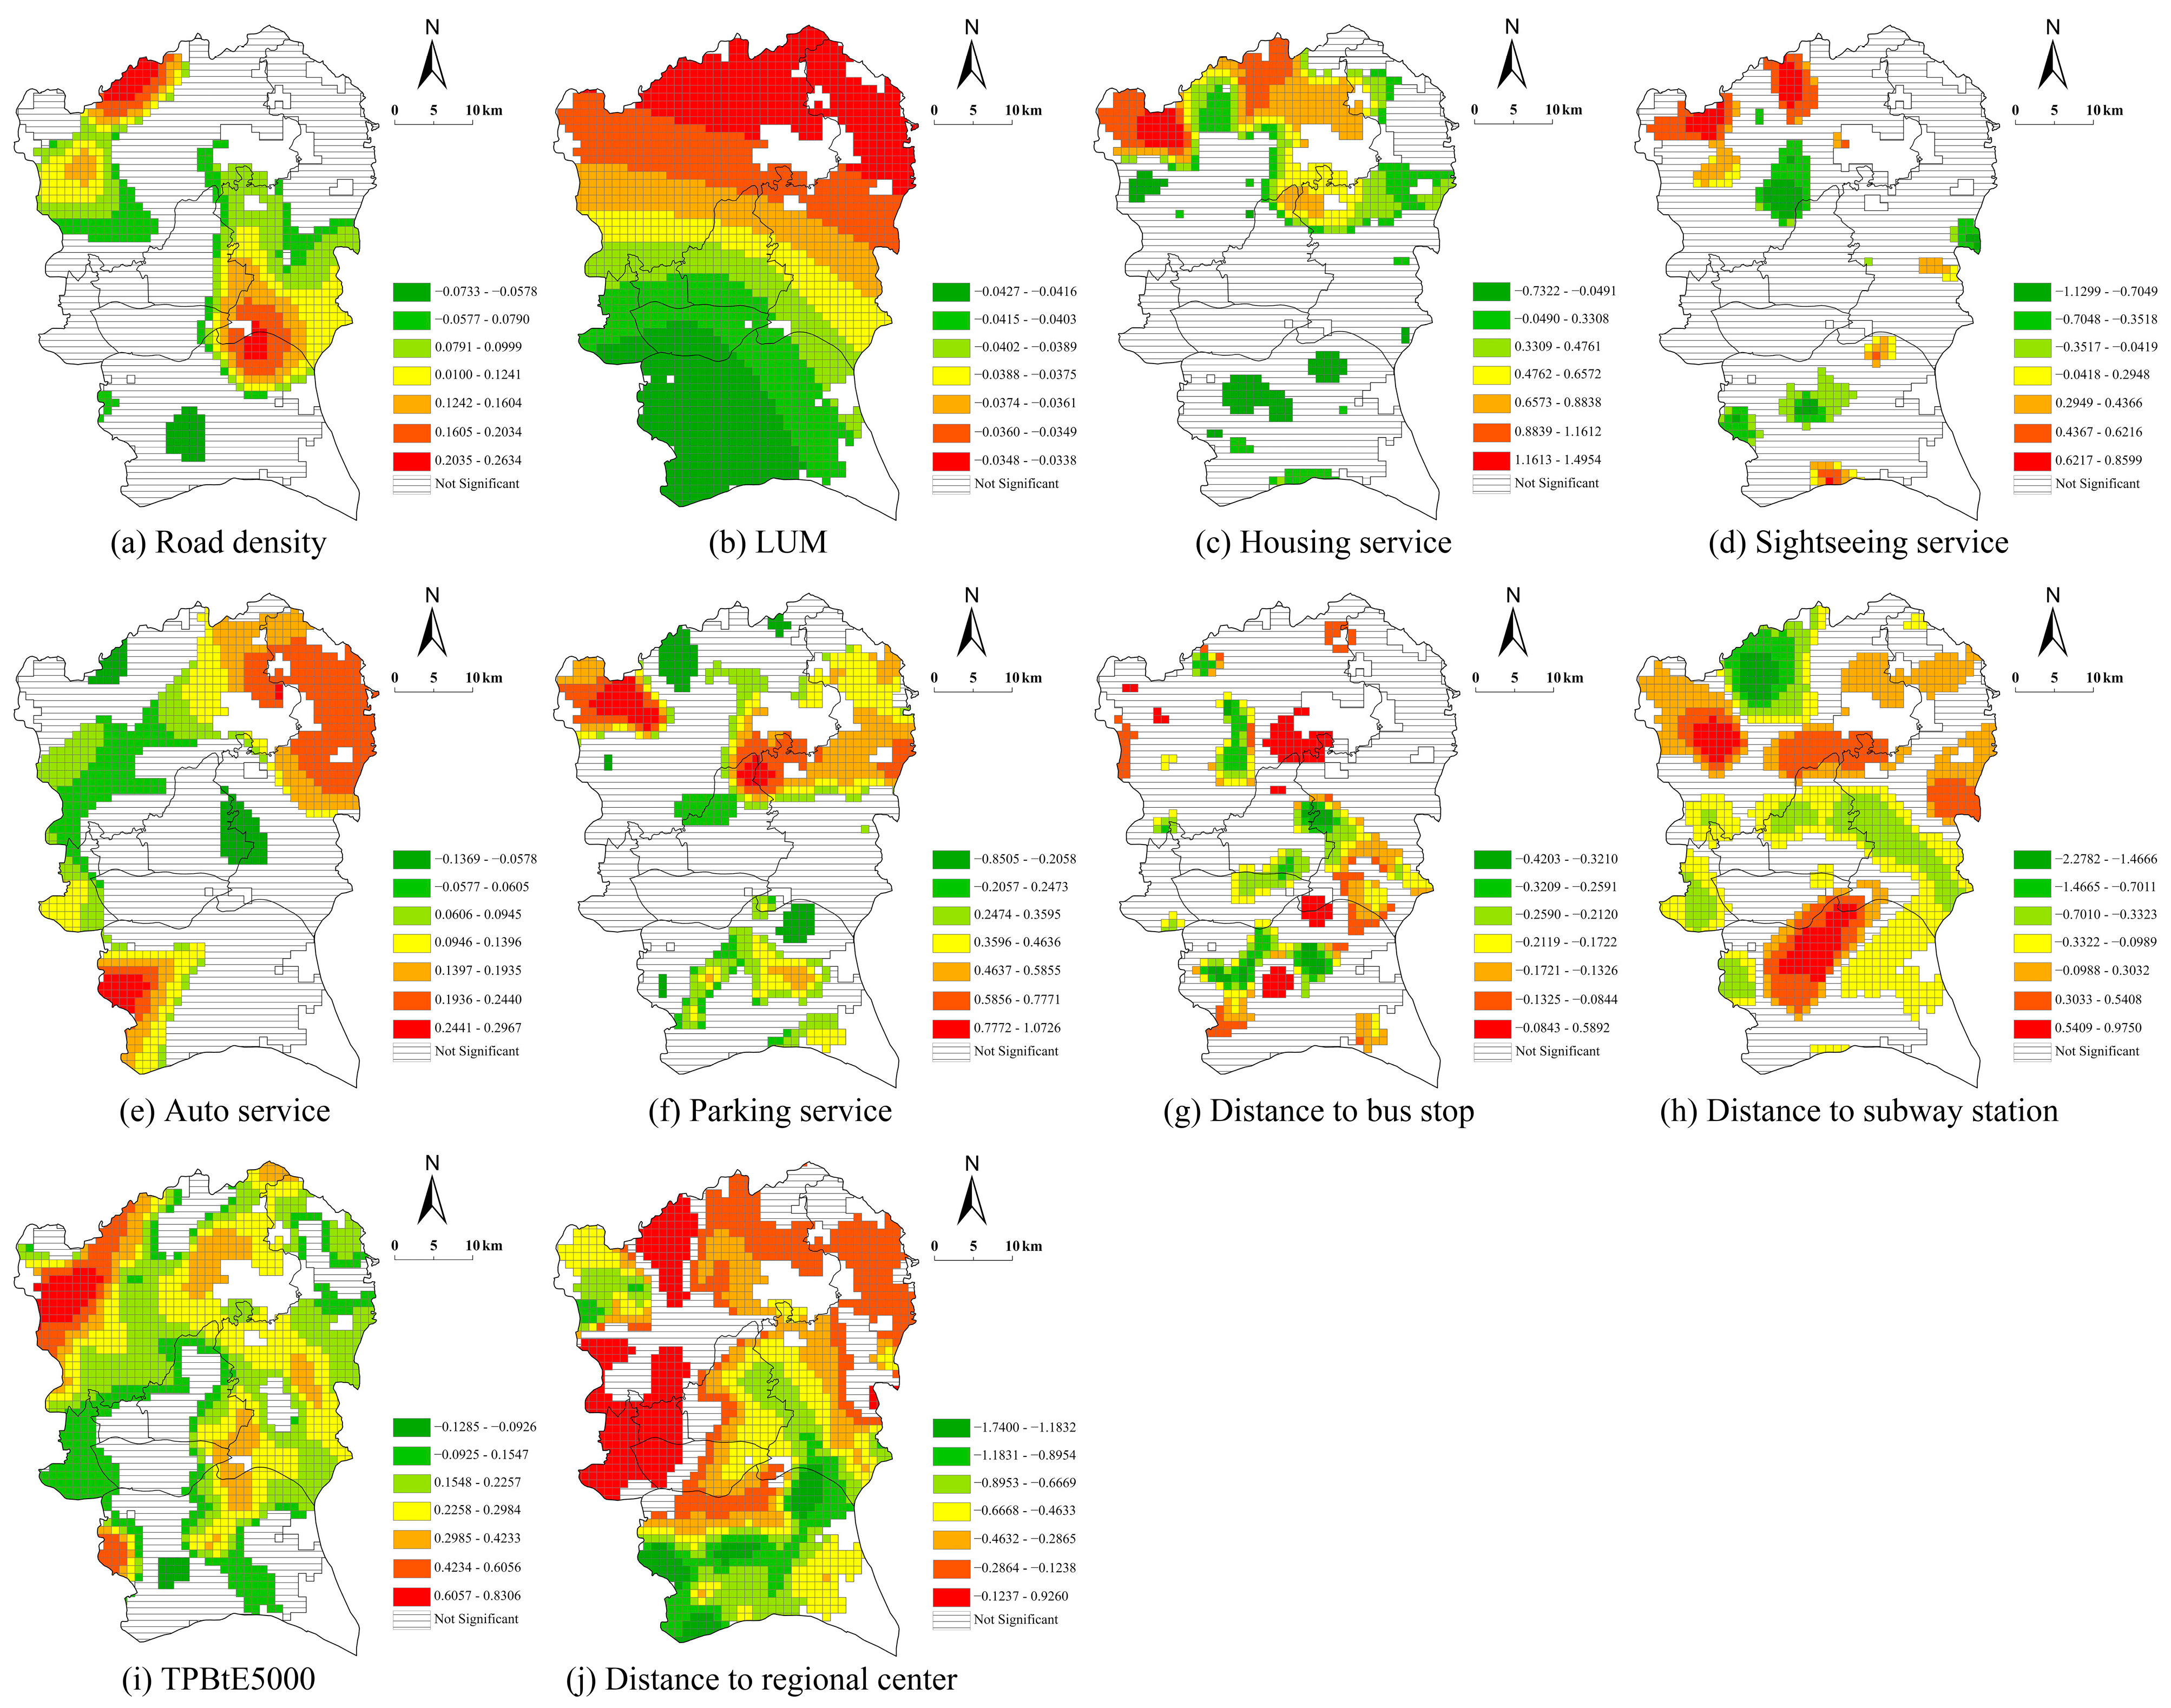
4.2.2. Analysis of Spatial Heterogeneity of Variables Influencing EVCS Accessibility

To validate the applicability of MGWR in this study, four indicators were employed to evaluate the fitting results of the OLS, GWR, and MGWR models: AIC, AICC, R2, and Adj. R2. Regarding the AIC and AICC, smaller indicators indicate better model performance, while R2 and Adj. R2 are the opposite. The evaluation results of the three models are shown in Table 3. Firstly, compared to GWR and MGWR, OLS has lower R2 and Adj. R2, while exhibiting higher AIC and AICC values. This indicates that the OLS model is less effective in explaining the spatial non-stationarity between the built environment and EVCS accessibility, indicating its limitations. Secondly, compared to GWR, MGWR outperforms across all four evaluation indicators. The possible reason is that GWR assigns the same bandwidth to all independent variables, neglecting the varying degrees of influence at different scales, which can still introduce errors in the model’s regression coefficients. Finally, based on the analysis results, we conclude that the MGWR model provides a better overall explanation than both OLS and GWR, effectively revealing the spatial heterogeneity effects of built-environment variables on EVCS accessibility.
Table 4 displays the regression results of the MGWR model, including “Bw” (Bandwidth), “Sig UNITs” (the number of gird units when p ≤ 0.05), “+” (the number of positive coefficients in Sig UNITs), “−” (the number of negative coefficients in Sig UNITs), and parameter estimates. Firstly, the Bw results show that the influence of built environment on EVCS accessibility exhibits a spatially heterogeneous effect. Specifically, the Bw for LUM is 1890, indicating a global scale, meaning that its regression coefficient changes steadily across space. However, the scales for other variables are all under 200 (representing 10.6% of the total samples), indicating that their influence on EVCS accessibility shows clear spatial heterogeneity. Secondly, the results for Sig UNITs show that the local parameters for business service, recreation service [10], and shopping service are not significant. This indicates that the distribution of short-duration consumption spaces (e.g., dining, recreation, and other facilities) exerts minimal influence on the planning and construction of EVCS. Further visualization of the Sig UNITs among the remaining independent variables is shown in Figure 6. It can be observed that the influence of each variable on EVCS accessibility displays distinct spatial variation, with some variables showing differentiated effects in space (both positive and negative impacts are present).
Although the analysis of the MGWR model explores the spatial differences in the impact of built-environment variables on EVCS accessibility, it has limitations in explaining the underlying mechanisms of these spatial differences (e.g., the marginal effects of variables). To address these shortcomings, it is essential to incorporate the interpretable machine learning model to further investigate the non-linear relationships between the built environment and EVCS accessibility, as well as the interaction mechanisms between variables, while also considering spatial heterogeneity for a joint analysis.

4.3. The Results of the RF Model

4.3.1. Model Performance

To assess the suitability of the RF model for this study, we trained and tested five commonly used machine learning models. Considering existing research, we evaluated the performance of the multiple models by comparing RMSE, MAE, and R2 [54,56]. Regarding the RMSE and MAE, smaller indicators indicate better model performance, while R2 is the opposite. The six machine learning models were constructed in Python 3.6, Jupyter Notebook 5.7.10. The “train_test_split” module was used to randomly allocate 70% of the analytical samples as the training set for model development, while the remaining 30% served as the test set to evaluate model performance. As shown in Table 5, compared to the other five models, the RF model has smaller RMSE and MAE values, as well as higher R2. Overall, the RF model demonstrated high adaptability and excellent predictive performance, making it effective for uncovering the complex non-linear relationships between the built environment and EVCS accessibility.
To optimize the model and avoid issues of underfitting and overfitting, based on previous study [54], after model selection, two key hyperparameters of the RF model were fine-tuned. The search ranges for these hyperparameters are as follows: max_depth ranging from 10 to 100 (step size of 100) and n_estimators ranging from 100 to 1000 (step size of 100). Grid SearchCV from Scikit-learn is used for grid search and five-fold cross-validation to evaluate 100 possible hyperparameter combinations and determine the optimal set that delivers the best model performance: max_depth is set to 30, and n_estimators is set to 800.

4.3.2. Relative Importance of Built Environment

Figure 7 displays the relative importance and ranking of the built-environment variables influencing EVCS accessibility. The auto service, distance to regional center and subway station are the three most important variables affecting EVCS accessibility, with relative importance percentages of 21.2%, 16.5%, and 9.8%, respectively. The results suggest that the supply capacity of automobile service facilities within the region plays a significant role in the fair and efficient layout of EVCSs, and indicates that areas with good centrality and subway accessibility tend to prioritize and concentrate EVCS layouts. However, the shopping, recreation, and sightseeing service have the lowest relative importance percentages. This validates the regression results of the MGWR model, indicating that shopping and recreation facilities did not show a significant impact on EVCS accessibility. Furthermore, while sightseeing service has the lowest relative importance among the independent variables, it still has a local impact in the MGWR model. Therefore, the influence of each variable on EVCS accessibility will be jointly analyzed, incorporating the regression results from the MGWR model.

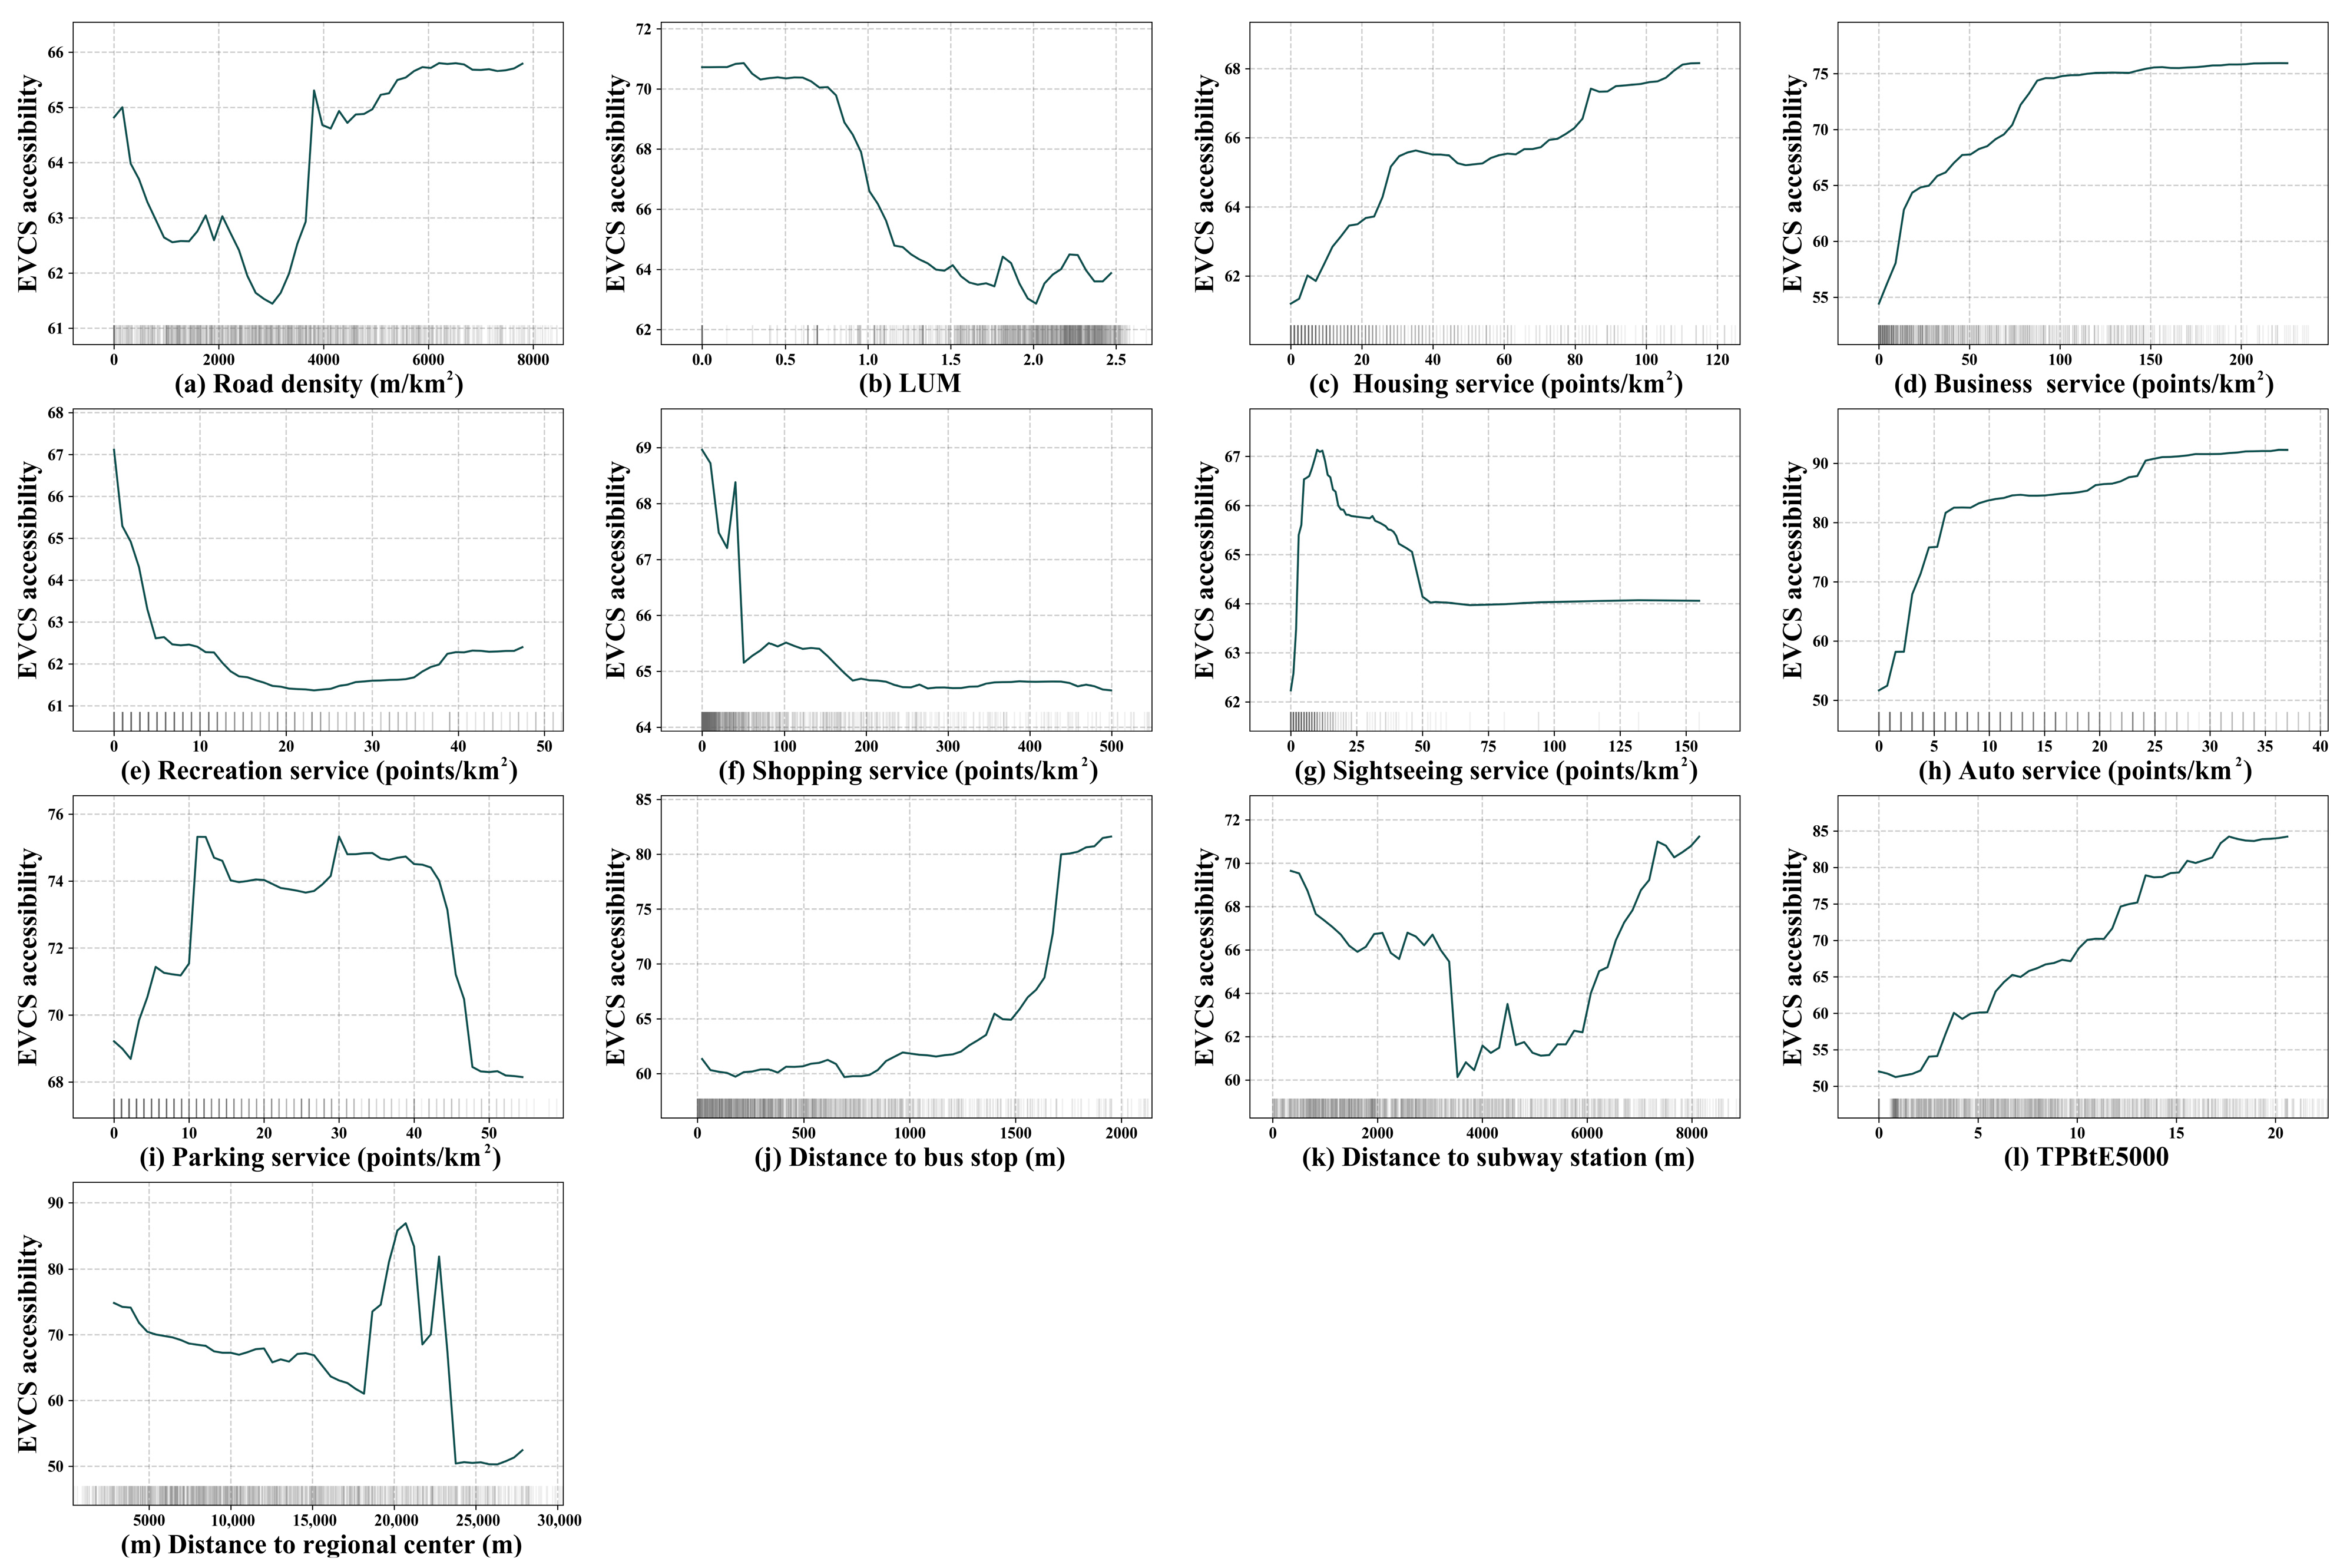
4.3.3. Joint Analysis of Spatial Heterogeneity and Non-Linear Relationship

Partial Dependence Plots (PDPs) can effectively illustrate the complex relationships between the built environment and EVCS accessibility. As shown in Figure 8, there is a clear non-linear relationship between various built-environment variables and EVCS accessibility, with some variables also showing threshold effects. This result further confirms the variable-effect differences observed in the MGWR model. The following analysis will combine the results of the MGWR model to analyze the non-linear relationships and spatial heterogeneity effects between the top 10 most significant variables and EVCS accessibility.
(1)
Density
The road density generally leads to a “decrease–increase” trend in EVCS accessibility, with a threshold at approximately 3000 m/km2. In areas with low road density, charging demand for long-distance travel leads to the deployment of EVCS near high-level roads (e.g., expressways, main urban roads) [29,34]. As a result, when residents have limited route choices for driving, the layout of facilities cannot effectively serve surrounding areas. As road density increases, on one hand, residents have more route options to access service facilities. On the other hand, EVCS also have more flexible spatial distribution. Regarding spatial heterogeneity (Figure 6), the significant negative effect is distributed in the Shiqiao area in central Panyu, while the positive effect is most pronounced in the Guangzhou University Town in the northeastern part of Panyu, southern Huangpu, Baiyun Lake Digital Technology City, and the Airport Economic Zone.
(2)
Diversity
When LUM is between 0.7 and 1.5, EVCS accessibility decreases significantly. However, the change is generally smooth for most samples. The possible reason is that transitional zones (neither purely residential nor purely employment) are often constrained by limited land resources and increased traffic demand, making it difficult for EVCS deployment to meet the surge in charging demand effectively. In contrast, single-function zones (with relatively fixed travel demand) and mixed-use urban areas (with more complete service facilities) have a more balanced supply–demand relationship, which explains why EVCS accessibility does not show significant differences in these areas. Regarding spatial heterogeneity (Figure 6), the significant negative impact increases gradually from north to south, confirming the smooth impact observed in most samples within the previously mentioned non-linear relationship.
(3)
Land use
Among the four variables related to land use, firstly, the housing, business, and auto service all have a positive impact on EVCS accessibility, with business and auto service showing significant threshold effects. Specifically, the EVCS accessibility remains stable when business service exceeds approximately 80 per/km2, and auto service exceeds approximately 24 per/km2. This result indicates the complementary spatial layout of residential and employment areas, which enhances daily commuting and increases the demand for charging, thereby promoting EVCS construction. Furthermore, the strong positive impact of auto service on EVCS accessibility highlights the high prevalence of car travel in the region, which provides potential customers for the EVCS layout. Additionally, this may be due to the combined layout of the two types of facilities, which saves urban land while offering users a diverse and professional one-stop automotive service (e.g., car maintenance, sales, fueling, etc.), thus jointly promoting the willingness to purchase an electric vehicle and the demand for charging. In terms of spatial heterogeneity (Figure 6), the significant positive effects of housing service are locally distributed in low-density residential areas, such as the northern part of Baiyun and central part of Huangpu. The positive impact of auto service is locally distributed in Liwan, southwestern Panyu, northern Huangpu, and areas around Baiyun Lake Digital Technology City and ZhongluotanTown in Baiyun. Notably, the impact of business service does not show significant spatial heterogeneity. This may be attributed to the interaction effects between the business service and other variables, which makes this influence more readily captured by the machine learning model.
Secondly, the parking service generally leads to an “ increase–gradual change–decrease” trend in EVCS accessibility, with two thresholds at approximately 12 and 30 per/km2. Adequate parking lots, which serve as hotspots for charging demand, help encourage residents’ travel and enhance the convenience of service facilities. However, excessively high facility density, on one hand, occupies space that could otherwise be used for other service facilities (e.g., EVCS). On the other hand, it may lead to more private chargers, which could affect the layout and utilization of EVCS. In terms of spatial heterogeneity (Figure 6), the significant positive impact is distributed in central Panyu, northern Huangpu, northern Tianhe, and northeastern Baiyun, while the negative impact is locally distributed in the Guangzhou University Town, and Airport Economic Zone.
(4)
Distance to transit
Among the two variables related to destination accessibility, the EVCS accessibility gradually changes when distance to bus stop is less than 1 km, which is the predicted characteristic for most of the samples. However, the accessibility sharply increases when distance to bus stop is beyond 1 km. The results suggest that good public transportation accessibility in the region has, to some extent, influenced residents’ travel decisions, thereby dispersing the willingness to use EVs. The distance to subway station generally leads to a “decrease–increase” trend in EVCS accessibility, with a threshold at approximately 3.8 km. Areas surrounding subway stations, serving as major transportation hubs with high pedestrian traffic, are frequently prioritized for EVCS deployment to support public transit demands, such as electric buses. This result is similar to existing studies [12]. However, as the distance to station increases (including bus stop and subway station), residents’ daily commuting decisions are more likely to incorporate “public + private” transportation or driving. This, in turn, increases the willingness to use electric vehicles and guides the layout of EVCSs, thereby increasing the demand for electric vehicle charging. In terms of spatial heterogeneity (Figure 6), the distance to bus stop shows a significant negative impact, which is more dispersed in the western part of Panyu, the junction of Haizhu and Tianhe, and the old urban center of Baiyun. The significant negative impact of the distance to subway station is mainly distributed in Liwan, Guangzhou South Railway Station area, the southern part of Guangzhou University Town, the northern part of Tianhe, the southern part of Huangpu, and the Airport Economic Zone. The positive impact is primarily distributed in the Wanbo area and Guangzhou University Town, the western part of Baiyun, and the eastern part of Huangpu.
(5)
Destination accessibility
Among the two variables related to destination accessibility, firstly, TPBtA5000 generally has a positive effect on EVCS accessibility. On one hand, a well-developed road network enhances residents’ spatial accessibility to various facilities. On the other hand, the clustering of population activities and construction activities attracts the layout of service facilities, thereby increasing the supply level of charging infrastructure in the area. In terms of spatial heterogeneity (Figure 6), this positive effect shows an increasing trend from the urban center to the peripheral areas, with high values concentrated in sub-core areas such as Guangzhou South Railway Station area, Huangpu Science City, and Guangzhou International Port area.
Secondly, the distance to regional center generally leads to a “decrease–increase–decrease” trend in EVCS accessibility, with two thresholds at approximately 1.8 km and 2.1 km. Similar to proximity to public transportation, although urban core areas typically have a complete infrastructure layout, the high-density population distribution and intensive construction activities negatively impact the supply of facilities and residents’ willingness to drive. In contrast, sub-core areas, due to the convenience of facilities in core areas and shifts in residents’ travel preferences, see an increase in EVCS accessibility. However, as the location becomes increasingly distant, the economic inefficiency of facility layout and the limitations of spatial accessibility result in a decrease in EVCS accessibility. In terms of spatial heterogeneity (Figure 6), the negative impact is primarily distributed in Panyu, Huangpu, Tianhe, eastern Haizhu, and northern Baiyun, whereas the positive impact is more dispersed in traditional urban center areas, such as Liwan and Yuexiu.

5. Discussion

This study utilizes EVCS static data and multi-source urban spatial data and applies the Gaussian-based two-step floating catchment area (G2SFCA) method to investigate the spatial distribution characteristics of EVCS accessibility. Subsequently, the MGWR and RF models are applied to analyze the spatial heterogeneity and non-linear effects of the built environment on EVCS accessibility. Theoretically, this study advances the methodological and technical framework for investigating the relationship between EVCS accessibility and the built environment, providing a valuable reference for comparable case studies. Practically, it offers actionable recommendations for policymakers and urban planners on EVCS siting and optimized layout strategies in the context of high-density urban development. This study produces several notable findings.
Firstly, the integrated use of MGWR and RF models effectively demonstrates the spatial heterogeneity and non-linear effects of the built environment on EVCS accessibility. Although previous studies have employed MGWR, GWR models, or machine learning methods to examine environmental factors influencing EVCS spatial distribution [8,10,29], this study, to the best of our knowledge, is the first to integrate spatial heterogeneity and non-linear effects into a joint-analysis framework. Notably, similar integrated analytical approaches have been utilized in studies examining the built environment and residents’ active travel behaviors (e.g., running, cycling) [57,58]. Secondly, although limited studies have investigated the relationship between built environment factors and EVCS accessibility, findings from related research either align with or contradict the results of this study. For example, previous studies have found that EVCSs are more commonly located near higher-grade roads [29,34]. We observed that areas with low-density road networks also exhibit higher EVCS accessibility. This could be because transportation in such areas often depends on higher-grade roads. Previous studies have shown that areas near subway stations experience higher charging demands [12]. However, concerning EVCS accessibility, the positive effect of distance to subway station is observed only within a specific range (e.g., within 3.8 km in this study). Similarly, previous studies found no significant relationship between gas station density and EVCS spatial distribution [10]. In contrast, this study identified a significant relationship between auto service (including gas and refueling stations) and EVCS accessibility, which may be attributed to Guangzhou’s policy advocating the co-location of charging facilities with auto service.
However, due to constraints in data availability and the scope of the case study area, this study has two notable limitations. Firstly, it relies exclusively on static data derived from the spatial locations of charging stations, which do not adequately capture the spatiotemporal dynamics of charging behaviors and individual preferences. Recently, dynamic datasets, such as EV trajectory data and order data, have been employed to better reflect the spatiotemporal characteristics of charging behaviors, preferences, and driving distances across different vehicle types [13]. These datasets have been applied in studies focused on charging demand prediction and charging-facility-layout optimization. Secondly, while this study examined the spatial heterogeneity and nonlinear effects of built-environment factors on EVCS accessibility, it is limited to a single case study conducted within a specific region. Such differences among regions and cities (e.g., urban and rural areas, or regions with varying levels of economic development) may influence the robustness and transferability of the identified environmental factors. Therefore, future study should incorporate EV dynamic data to investigate the spatiotemporal characteristics of urban charging behaviors across various vehicle types (including extended-range EVs [59]). Additionally, cross-city comparative studies should be conducted to improve the generalizability and robustness of the findings.

6. Conclusions

This study employs the G2SFCA method to examine the spatial distribution features and heterogeneity effects of EVCS in Guangzhou in terms of accessibility. Additionally, it employs the MGWR and RF model to investigate the underlying mechanisms by which urban built-environment factors affect EVCS accessibility, emphasizing spatial heterogeneity and nonlinearity. This study enriched the research methods, perspectives, and framework related to urban built environments and EVCS accessibility. Furthermore, by investigating the spatial differences and non-linear effects of the built environment on EVCS accessibility, this study offered valuable insights for environmental interventions and planning regulations that promote energy sustainability in high-density cities, while also providing a reference for the energy industry layout in Smart Cities.
The findings reveal that (1) the EVCS accessibility in Guangzhou exhibits an imbalanced distribution of “higher in the west and lower in the east, with extreme core concentration “, displaying spatial heterogeneity. Specifically, residents in northern Baiyun, the intersection of central Tianhe and Huangpu, and southern Panyu have better access to EVCS, while residents in the northern, eastern, and southern peripheral areas face greater difficulty in accessing EVCSs. Additionally, local regions exhibit “high–high” and “low–low” clustering patterns in EVCS accessibility, representing 13.2% and 22.2%, respectively. (2) The influence of various built-environment factors on EVCS accessibility shows widespread spatial heterogeneity. Among the selected 13 regression variables, 10 variables have significant effects on EVCS accessibility, and their influence exhibits differentiated local distribution patterns in space. (3) The influence of various built-environment factors on EVCS accessibility generally follows a non-linear relationship, with some variables showing threshold effects. Firstly, the auto service is established as the most important factor affecting EVCS accessibility. Secondly, some variables, such as road density and distance to subway station and regional center, exhibit multi-directional relationships with EVCS accessibility.
Based on the findings and existing research, this study provides several policy recommendations for the efficient and equitable layout of EVCSs in different areas of high-density cities.
Firstly, prioritize the joint-layout model of “auto service + EVCS”. Our study finds that automotive service facilities have a significant positive impact on EVCS accessibility, and their relative importance is the highest (21.2%). In high-density urban construction areas, the relative scarcity of land resources increases both the cost and difficulty of implementing EVCS layouts. Therefore, a feasible solution for policymakers and planners is to promote the joint layout of EVCS with existing, highly accessible service facilities, including gas stations, charging stations, auto 4S stores, parking lots, and other automotive-related facilities. For example, the “Guangzhou Three-Year Action Plan for Accelerating the Construction of Electric Vehicle Charging Infrastructure (2022–2024)” clearly points out that gas (and charging) stations and parking lots should be equipped with public charging facilities.
Secondly, determine locations for new EVCS construction by considering the diverse demands across regions. Our study finds that areas both too close to and too far from the city center and subway stations show improved EVCS accessibility. Therefore, considering the charging demand of the population and the supply level of service facilities, the site selection for new EVCS should prioritize urban core areas, locations near subway stations (within 3.8 km), and sub-core areas situated farther from the city center. On one hand, areas around the city center or subway stations typically have highly concentrated urban-construction activities, and the high population density in these areas leads to a more concentrated demand for EVCS. On the other hand, in non-central areas, as the advantages of proximity decrease and public transportation time costs rise, residents tend to rely more on private cars for transportation. Therefore, increasing the deployment of EVCS can effectively enhance the supply capacity and spatial coverage of charging facilities, especially in areas with high road connectivity and road network density (over 3 km).
Thirdly, adopt flexible land-use policies and reasonably plan the layout of charging facilities in specific functional zones. Our study finds that an excessively high degree of LUM actually hinders the EVCS accessibility. Therefore, policymakers and urban planners should avoid concentrating EVCS deployment too heavily in areas with high land-use mix. These areas typically have more diverse travel activities, which leads to competition among different modes of transportation and traffic congestion, thus exacerbating the imbalance between supply and demand. Additionally, the concentration of certain functional facilities in an area, such as residential and employment service facilities, can effectively increase EVCS accessibility. Therefore, it is advisable to encourage the deployment of EVCS in areas with such functional concentrations, as these facilities are common high-frequency locations for long-duration charging events for electric vehicle users.

Author Contributions

Conceptualization, J.S. and Z.X.; data curation J.S. and C.B.; formal analysis, Z.X. and P.B.; methodology, J.S. and C.B.; funding acquisition, Z.X. and P.B.; writing—original draft preparation, J.S.; writing—revising, editing, J.S., Z.X. and P.B. All authors have read and agreed to the published version of the manuscript.

Funding

This research was funded by the Social Science Planning and Social Think Tank Project of Yunnan Province (grant number: SHZK2023336), the Basic Research Special Program—General Project of Science and Technology Department of Yunnan Province (grant number: 202201AT070792), and the Humanities and Social Sciences Cultivation Project of Kunming University of Science and Technology (grant number: SKPYYB202408).

Institutional Review Board Statement

Not applicable.

Informed Consent Statement

Not applicable.

Data Availability Statement

The data presented in this study are available on request from the corresponding authors, because they are part of an ongoing study.

Conflicts of Interest

The authors declare no conflicts of interest.

References

  1. Wang, J.; Xu, C.; Pauleit, S.; Kindler, A.; Banzhaf, E. Spatial patterns of urban green infrastructure for equity: A novel exploration. J. Clean. Prod. 2019, 238, 117858. [Google Scholar] [CrossRef]
  2. Global EV Outlook 2024. Available online: https://www.iea.org/reports/global-ev-outlook-2024 (accessed on 11 October 2024).
  3. Funke, S.Á.; Sprei, F.; Gnann, T.; Plötz, P. How much charging infrastructure do electric vehicles need? A review of the evidence and international comparison. Transp. Res. Part D Transp. Environ. 2019, 77, 224–242. [Google Scholar] [CrossRef]
  4. Liu, J. Electric vehicle charging infrastructure assignment and power grid impacts assessment in Beijing. Energy Policy 2012, 51, 544–557. [Google Scholar] [CrossRef]
  5. Patil, P.; Kazemzadeh, K.; Bansal, P. Integration of charging behavior into infrastructure planning and management of electric vehicles: A systematic review and framework. Sustain. Cities Soc. 2023, 88, 104265. [Google Scholar] [CrossRef]
  6. Zhang, Y.; Zhang, Q.; Farnoosh, A.; Chen, S.; Li, Y. GIS-based multi-objective particle swarm optimization of charging stations for electric vehicles. Energy 2019, 169, 844–853. [Google Scholar] [CrossRef]
  7. Peng, Z.; Wang, M.W.H.; Yang, X.; Chen, A.; Zhuge, C. An analytical framework for assessing equitable access to public electric vehicle chargers. Transp. Res. Part D Transp. Environ. 2024, 126, 103990. [Google Scholar] [CrossRef]
  8. Zhang, Y.; Kamargianni, M.; Cheng, L.; De Vos, J.; Cao, M. Evaluating the accessibility of on-street household electric vehicle charging stations in London: Policy insights from equity analysis across emission zones. Energy Policy 2024, 195, 114375. [Google Scholar] [CrossRef]
  9. Hsu, C.W.; Fingerman, K. Public electric vehicle charger access disparities across race and income in California. Transp. Policy 2021, 100, 59–67. [Google Scholar] [CrossRef]
  10. Ma, R.; Huang, A.; Cui, H.; Yu, R.; Peng, X. Spatial heterogeneity analysis on distribution of intra-city public electric vehicle charging points based on multi-scale geographically weighted regression. Travel Behav. Soc. 2024, 35, 100725. [Google Scholar] [CrossRef]
  11. Roy, A.; Law, M. Examining spatial disparities in electric vehicle charging station placements using machine learning. Sustain. Cities Soc. 2022, 83, 103978. [Google Scholar] [CrossRef]
  12. Kang, J.; Kong, H.; Lin, Z.; Dang, A. Mapping the dynamics of electric vehicle charging demand within Beijing’s spatial structure. Sustain. Cities Soc. 2022, 76, 103507. [Google Scholar] [CrossRef]
  13. Shuai, C.; Zhang, X.; Ouyang, X.; Liu, K.; Yang, Y. Research on charging demands of commercial electric vehicles based on Voronoi diagram and spatial econometrics model: An empirical study in Chongqing China. Sustain. Cities Soc. 2024, 105, 105335. [Google Scholar] [CrossRef]
  14. Pemberton, S.; Nobajas, A.; Waller, R. Rapid charging provision, multiplicity and battery electric vehicle (BEV) mobility in the UK. J. Transp. Geogr. 2021, 95, 103137. [Google Scholar] [CrossRef]
  15. Machado, C.A.S.; Takiya, H.; Yamamura, C.L.K.; Quintanilha, J.A.; Berssaneti, F.T. Placement of infrastructure for urban electromobility: A sustainable approach. Sustainability 2020, 12, 6324. [Google Scholar] [CrossRef]
  16. Yi, T.; Zhang, C.; Lin, T.; Liu, J. Research on the spatial-temporal distribution of electric vehicle charging load demand: A case study in China. J. Clean. Prod. 2020, 242, 118457. [Google Scholar] [CrossRef]
  17. Pan, L.; Yao, E.; Yang, Y.; Zhang, R. A location model for electric vehicle (EV) public charging stations based on drivers’ existing activities. Sustain. Cities Soc. 2020, 59, 102192. [Google Scholar] [CrossRef]
  18. Bilsel, M.; Kilic, H.S.; Kalender, Z.T.; Tuzkaya, G. Multi-objective model for electric vehicle charging station location selection problem for a sustainable transportation infrastructure. Comput. Ind. Eng. 2024, 198, 110695. [Google Scholar] [CrossRef]
  19. Wu, T.; Fainman, E.; Maïzi, Y.; Shu, J.; Li, Y. Allocate electric vehicles’ public charging stations with charging demand uncertainty. Transp. Res. Part D Transp. Environ. 2024, 130, 104178. [Google Scholar] [CrossRef]
  20. Algafri, M.; Alghazi, A.; Almoghathawi, Y.; Saleh, H.; Al-Shareef, K. Smart City Charging Station allocation for electric vehicles using analytic hierarchy process and multiobjective goal-programming. Appl. Energy 2024, 372, 123775. [Google Scholar] [CrossRef]
  21. Razeghi, M.; Roghani Araghi, A.; Naseri, A.; Yousefi, H. Strategic deployment of GIS-optimized solar charging stations for electric vehicles: A multi-criteria decision-making approach. Energy Convers. Manag. X 2024, 24, 100712. [Google Scholar] [CrossRef]
  22. Li, G.; Luo, T.; Song, Y. Spatial equity analysis of urban public services for electric vehicle charging—Implications of Chinese cities. Sustain. Cities Soc. 2022, 76, 103519. [Google Scholar] [CrossRef]
  23. Chen, Y.; Yu, P.; Li, Z.; Wang, J.; Chen, Y. Equity measurement of urban green space environment based on SDG11—A case study of Wuhan city central area. Geogr. Geo-Inf. Sci. 2021, 37, 81–89. [Google Scholar]
  24. Nicholas, M.; Tal, G.; Ji, W. Lessons from in-use Fast Charging Data: Why are Drivers Staying Close to Home. Available online: https://itspubs.ucdavis.edu/download_pdf.php?id=2699 (accessed on 12 October 2024).
  25. Tahmasbi, B.; Mansourianfar, M.H.; Haghshenas, H.; Kim, I. Multimodal accessibility-based equity assessment of urban public facilities distribution. Sustain. Cities Soc. 2019, 49, 101633. [Google Scholar] [CrossRef]
  26. Kelobonye, K.; McCarney, G.; Xia, J.; Swapan, M.S.H.; Mao, F.; Zhou, H. Relative accessibility analysis for key land uses: A spatial equity perspective. J. Transp. Geogr. 2019, 75, 82–93. [Google Scholar] [CrossRef]
  27. Cai, Y.; Zhang, J.; Gu, Q.; Wang, C. An analytical framework for assessing equity of access to public electric vehicle charging stations: The case of Shanghai. Sustainability 2024, 16, 6196. [Google Scholar] [CrossRef]
  28. Falchetta, G.; Noussan, M. Electric vehicle charging network in Europe: An accessibility and deployment trends analysis. Transp. Res. Part D Transp. Environ. 2021, 94, 102813. [Google Scholar] [CrossRef]
  29. Esmaili, A.; Oshanreh, M.M.; Naderian, S.; MacKenzie, D.; Chen, C. Assessing the spatial distributions of public electric vehicle charging stations with emphasis on equity considerations in King County, Washington. Sustain. Cities Soc. 2024, 107, 105409. [Google Scholar] [CrossRef]
  30. Carlton, G.J.; Sultana, S. Electric vehicle charging equity and accessibility: A comprehensive United States policy analysis. Transp. Res. Part D Transp. Environ. 2024, 129, 104123. [Google Scholar] [CrossRef]
  31. Gazmeh, H.; Guo, Y.; Qian, X. Understanding the opportunity-centric accessibility for public charging infrastructure. Transp. Res. Part D Transp. Environ. 2024, 131, 104222. [Google Scholar] [CrossRef]
  32. Carlton, G.J.; Sultana, S. Electric vehicle charging station accessibility and land use clustering: A case study of the Chicago region. J. Urban Mobil. 2022, 2, 100019. [Google Scholar] [CrossRef]
  33. Park, J.; Kang, J.-Y.; Goldberg, D.W.; Hammond, T.A. Leveraging temporal changes of spatial accessibility measurements for better policy implications: A case study of electric vehicle (EV) charging stations in Seoul, South Korea. Int. J. Geogr. Inf. Sci. 2022, 36, 1185–1204. [Google Scholar] [CrossRef]
  34. Khan, H.A.U.; Price, S.; Avraam, C.; Dvorkin, Y. Inequitable access to EV charging infrastructure. Electr. J. 2022, 35, 107096. [Google Scholar] [CrossRef]
  35. Oshan, T.M.; Li, Z.; Kang, W.; Wolf, L.J.; Fotheringham, A.S. mgwr: A python implementation of multiscale geographically weighted regression for investigating process spatial heterogeneity and scale. ISPRS Int. J. Geo-Inf. 2019, 8, 269. [Google Scholar] [CrossRef]
  36. Fotheringham, A.S.; Yang, W.; Kang, W. Multiscale geographically weighted regression (MGWR). Ann. Am. Assoc. Geogr. 2017, 107, 1247–1265. [Google Scholar] [CrossRef]
  37. Li, Z. Extracting spatial effects from machine learning model using local interpretation method: An example of SHAP and XGBoost. Comput. Environ. Urban Syst. 2022, 96, 101845. [Google Scholar] [CrossRef]
  38. 2023 Guangzhou National Economic and Social Development Statistical Bulletin. Available online: https://tjj.gz.gov.cn/stats_newtjyw/tjsj/tjgb/qstjgb/content/mpost_9567759.html (accessed on 12 October 2024).
  39. Guangzhou Three-Year Action Plan for Accelerating the Construction of Electric Vehicle Charging Infrastructure (2022–2024). Available online: https://gxj.gz.gov.cn/yw/zcjd/content/post_8587269.html (accessed on 12 October 2024).
  40. Weiss, D.J.; Nelson, A.; Gibson, H.S.; Temperley, W.; Peedell, S.; Lieber, A.; Hancher, M.; Poyart, E.; Belchior, S.; Fullman, N.; et al. A global map of travel time to cities to assess inequalities in accessibility in 2015. Nature 2018, 553, 333–336. [Google Scholar] [CrossRef]
  41. Chen, Y.; Xu, C.; Ge, Y.; Zhang, X.; Zhou, Y. A 100 m gridded population dataset of China’s seventh census using ensemble learning and big geospatial data. Earth Syst. Sci. Data 2024, 16, 3705–3718. [Google Scholar] [CrossRef]
  42. Che, Y.; Li, X.; Liu, X.; Wang, Y.; Liao, W.; Zheng, X.; Zhang, X.; Xu, X.; Shi, Q.; Zhu, J.; et al. 3D-GloBFP: The first global three-dimensional building footprint dataset. Earth Syst. Sci. Data Discuss. 2024, 16, 5357–5374. [Google Scholar] [CrossRef]
  43. Chen, X.; Jia, P. A comparative analysis of accessibility measures by the two-step floating catchment area (2SFCA) method. Int. J. Geogr. Inf. Sci. 2019, 33, 1739–1758. [Google Scholar] [CrossRef]
  44. Huang, X.; Lu, G.; Yin, J.; Tan, W. Non-linear associations between the built environment and the physical activity of children. Transp. Res. Part D Transp. Environ. 2021, 98, 102968. [Google Scholar] [CrossRef]
  45. Chiaradia, A.; Cooper, C.; Webster, C. sDNA a Software for Spatial Design Network Analysis, Specifications; Cardiff University: Cardiff, UK, 2012. [Google Scholar]
  46. MA, F. Spatial equity analysis of urban green space based on spatial design network analysis (sDNA): A case study of central Jinan, China. Sustain. Cities Soc. 2020, 60, 102256. [Google Scholar] [CrossRef]
  47. Zhuge, C.; Shao, C.; Li, X. A comparative study of en route refuelling behaviours of conventional and electric vehicles in Beijing, China. Sustainability 2019, 11, 3869. [Google Scholar] [CrossRef]
  48. 2022 Transportation Monthly Report. Available online: https://jtj.gz.gov.cn/jtzt/jtsj/jtysyb/index.html (accessed on 12 October 2024).
  49. Zhou, R.; Yu, Y.; Wang, Z.; Ke, L.; Zhao, J. How does shared mobility impact metro-based urban commercial travel accessibility and Equity? Transp. Res. Part D Transp. Environ. 2025, 138, 104523. [Google Scholar] [CrossRef]
  50. Tian, D.; Wang, J.; Xia, C.; Zhang, J.; Zhou, J.; Tian, Z.; Zhao, J.; Li, B.; Zhou, C. The relationship between green space accessibility by multiple travel modes and housing prices: A case study of Beijing. Cities 2024, 145, 104694. [Google Scholar] [CrossRef]
  51. Xia, Y.; Chen, H.; Zuo, C.; Zhang, N. The impact of traffic on equality of urban healthcare service accessibility: A case study in Wuhan, China. Sustain. Cities Soc. 2022, 86, 104130. [Google Scholar] [CrossRef]
  52. Breiman, L. Random Forests. Mach. Learn. 2001, 45, 5–32. [Google Scholar] [CrossRef]
  53. Jing, W.; Liu, J.; Qin, Z.; Mu, T.; Ge, Z.; Dong, Y. Evaluating and enhancing the applicability of thermal comfort indices in diverse outdoor environments using Bayesian and random forest regression. Energy Build. 2024, 324, 114858. [Google Scholar] [CrossRef]
  54. Liu, Y.; Li, Y.; Yang, W.; Hu, J. Exploring nonlinear effects of built environment on jogging behavior using random forest. Appl. Geogr. 2023, 156, 102990. [Google Scholar] [CrossRef]
  55. Alam, M.S.; Tabassum, N.J. Spatial pattern identification and crash severity analysis of road traffic crash hot spots in Ohio. Heliyon 2023, 9, e16303. [Google Scholar] [CrossRef]
  56. Fang, G.; Zhu, Y.; Zhang, J. Spatiotemporal evolution analysis of PM2.5 concentrations in central China Using the random forest algorithm. Sustainability 2024, 16, 8613. [Google Scholar] [CrossRef]
  57. Yan, Y.; Chen, Q. Spatial heterogeneity and nonlinearity study of bike-sharing to subway connections from the perspective of built environment. Sustain. Cities Soc. 2024, 114, 105766. [Google Scholar] [CrossRef]
  58. Yang, W.; Chen, H.; Li, J.; Guo, W.; Fei, J.; Li, Y.; He, J. How does visual environment affect outdoor jogging behavior? Insights from large-scale city images and GPS trajectories. Urban For. Urban Green. 2024, 95, 128291. [Google Scholar] [CrossRef]
  59. Xiao, B.; Ruan, J.; Yang, W.; Walker, P.D.; Zhang, N. A review of pivotal energy management strategies for extended range electric vehicles. Renew. Sustain. Energy Rev. 2021, 149, 111194. [Google Scholar] [CrossRef]
Figure 1. Framework.
Sustainability 17 00086 g001
Figure 2. Study area and distribution of EVCS.
Sustainability 17 00086 g002
Figure 3. Visualization of built environment elements.
Sustainability 17 00086 g003
Figure 4. Spatial distribution and hot- and cold-spot analysis of EVCS accessibility.
Sustainability 17 00086 g004
Figure 5. Local Moran’s I result of EVCS accessibility.
Sustainability 17 00086 g005
Figure 6. The spatial distributions of local coefficients.
Sustainability 17 00086 g006
Figure 7. Relative importance of variables.
Sustainability 17 00086 g007
Figure 8. The non-linear association between variables and EVCS accessibility.
Sustainability 17 00086 g008
Table 1. Description of variables.
Variable (Unit)DescriptionMean (Standard Deviation)
Density
BCRThe BCR within 1 km grid.0.11 (0.11)
FARThe FAR within 1 km grid.0.58 (0.65)
Road density (m/km2)The total length of roads within 1 km grid.2981.9 (2390.4)
Diversity
LUMThe location entropy within 1 km grid.1.68 (0.76)
Land use
Housing service (points/km2)The number of housing-related POIs within 1 km grid, including residences, hotels, etc.1.68 (0.76)
Business service (points/km2)The number of business-related POIs within 1 km grid, including companies, factories, etc.20.3 (49.1)
Recreation service (points/km2)The number of recreation-related POIs within 1 km grid, including sports, entertainment, leisure, and vacation facilities, etc.50.3 (77.6)
Dining service (points/km2)The number of dining-related POIs within 1 km grid, including Chinese restaurants, foreign restaurants, fast-food restaurants, coffee shops, etc.50.4 (103.5)
Shopping service (points/km2)The number of shopping-related POIs within 1 km grid, including shopping malls, supermarkets, comprehensive markets, specialty stores, etc.86.6 (188.5)
Sightseeing service (points/km2)The number of sightseeing-related POIs within 1 km grid, including parks, squares, scenic spots, etc.3.3 (9.2)
Auto service (points/km2)The number of auto-related POIs within 1 km grid, including gas stations, refueling stations, other energy stations, automobile maintenance/trading venues, etc.7.7 (17.7)
Parking service (points/km2)The number of parking-related POIs within 1 km grid, including dedicated parking lots, public parking lots, transfer parking lots, etc.10.3 (19.8)
Distance to transit
Distance to bus stop (m)The distance to the nearest bus stop.654.7 (733.3)
Distance to subway station (m)The distance to the nearest subway station.3670.1 (2882.5)
Destination accessibility
TPBtE5000The average TPBtE (R = 5000) within 1 km grid.7.4 (6.7)
Distance to regional center (m)The distance to the nearest regional center. We chose six representative regional centers within the study area, including the Pearl River New Town, Beijing Road Pedestrian Street, Shangxiajiu Pedestrian Street, Pazhou Convention and Exhibition Center, Baiyun New Town, Luogang-Wanda Business District, and Wanbo Business District.14,298.9 (8169.7)
Table 2. Tests of spatial autocorrelation and multicollinearity.
VariableSpatial AutocorrelationMulticollinearity
Moran’s IZ-Valuep-Value
BCR0.68540.039<0.0017.760
FAR0.73142.758<0.0019.728
Road density0.58033.944<0.0012.753
LUM0.48628.420<0.0012.150
Housing service 0.52731.158<0.0013.072
Business service0.56633.214<0.0012.830
Recreation service 0.60635.635<0.0016.945
Dining service0.54231.845<0.0018.270
Shopping service0.58134.276<0.0013.544
Sightseeing service 0.35321.087<0.0011.228
Auto service0.38423.237<0.0011.391
Parking service0.76444.847<0.0015.821
Distance to bus stop0.47928.067<0.0011.431
Distance to subway station0.89752.468<0.0011.387
TPBtE50000.62736.692<0.0012.239
Distance to regional center0.98757.710<0.0011.516
Table 3. Model comparison of fitting results.
MetricsAICAICCR2Adj. R2
OLS4850.6944852.9500.2500.245
GWR2110.8762667.2160.9050.861
MGWR772.2601160.6710.9490.930
Table 4. Parameter estimation using MGWR.
VariablesBwSig NETsParameter Estimates
Total+MeanSTDMinMedianMax
Road density174689660290.0520.06−0.0730.0410.263
LUM1890189101891−0.0380.003−0.043−0.038−0.034
Housing service 45579509700.1760.333−0.7320.0581.495
Business service 18900−0.0160−0.017−0.016−0.015
Recreation service 18900−0.0290−0.03−0.029−0.029
Shopping service 189000.0140.0010.0120.0140.016
Sightseeing service 432881571310.0070.242−1.13−0.0120.86
Auto service 182826763630.0610.09−0.1370.0510.297
Parking service45662599630.1570.267−0.850.0951.073
Distance to bus stop 4445668388−0.0610.109−0.42−0.0510.589
Distance to subway station431120506614−0.0480.38−2.278−0.0320.975
TPBtE50006313581344140.1920.145−0.1290.180.831
Distance to regional center 4315192651254−0.3360.436−1.74−0.2710.926
Table 5. Comparison results of machine learning models.
ModelRMSEMAER2
SVR43.99730.5400.131
RF37.16527.8450.380
GBDT37.42728.0150.371
XGBoost39.77329.1920.290
LightGBM37.85928.3260.357
Disclaimer/Publisher’s Note: The statements, opinions and data contained in all publications are solely those of the individual author(s) and contributor(s) and not of MDPI and/or the editor(s). MDPI and/or the editor(s) disclaim responsibility for any injury to people or property resulting from any ideas, methods, instructions or products referred to in the content.

