Abstract
Enhancing the efficiency of value co-creation among multiple stakeholders in manufacturing quality chains under digital transformation is an urgent management issue that needs to be addressed. Grounded in the resource-based view and dynamic capability perspective, this study employs a dynamic QCA method, using 81 manufacturing enterprises in Beijing from 2020 to 2023 as the research sample, to explore the configurational effects of resource–capability influencing factors on the overall efficiency of quality chain value co-creation, multi-value creation efficiency, and value conversion efficiency over time. The findings reveal that no single factor is necessary for achieving high overall efficiency or two-stage efficiency levels. However, the necessity of digital infrastructure development increases annually, demonstrating a temporal effect. Four distinct pathways drive high-quality chain value co-creation efficiency, which can be categorized as follows: (1) the resource utilization multi-capability driven model; (2) the multi-capability driven model; (3) the government support multi-capability driven model; and (4) the resource utilization capability driven model. The driving effect of multi-factor resource–capability combinations on enhancing value co-creation efficiency in certain medical manufacturing, chemical raw materials, and chemical product manufacturing sectors is limited.
1. Introduction
Over the past decade, China has prioritized extending, strengthening, and reinforcing industrial and supply chains to foster integrated quality development across upstream, midstream, and downstream manufacturing sectors [1]. A collaborative framework for quality enhancement has now taken shape, enabling synchronized progress at all levels of production [2]. At the 2024 Beijing Quality Chain Strengthening Conference, regulators emphasized that robust quality chains align with national economic priorities outlined in the Central Economic Work Conference and Government Work Report. Enhancing value co-creation efficiency within quality chains has been identified as a critical lever for advancing industrial competitiveness through standardized practices and next-generation productivity [3]. Traditional quality management frameworks struggle to address evolving consumer demands for customization and intelligent production systems in the digital era, limiting their capacity to drive breakthroughs in manufacturing innovation. On the one hand, the advancement of technologies such as cloud computing and artificial intelligence has significantly increased the importance of knowledge capital [4]. However, traditional quality management models focus primarily on the development of human resources, yet they inadequately address the evolving role of knowledge resources. On the other hand, traditional quality management emphasizes meeting predefined customer needs. In contrast, modern manufacturing enterprises leverage advanced analytical tools (e.g., big data and AI) to dynamically track shifts in customer preferences and achieve personalized product customization [5]. Finally, traditional quality management models establish systematic methodologies by formalizing processes through documentation and procedures. While these practices enhance efficiency in stable environments, they lack iterative mechanisms to adapt to market shifts or disruptions. Redundant process nodes further stifle innovation [6]. Intensified global competition compels firms to adopt agile, collaborative supply chain models. Organizations increasingly leverage networked partnerships to consolidate core competencies and resources, thereby amplifying competitive advantages. Industry 4.0 technologies empower end-users to actively co-create value within supply chains. The integration of big data with production systems enhances connectivity across organizational boundaries [7], enabling transparent quality coordination and dismantling traditional information silos. This study conceptualizes quality chains as 3D ecosystems centered on core enterprises. These systems synchronize human resources, equipment, and processes across internal departments and external suppliers, implementing end-to-end quality control from R&D to final product delivery.
Against the backdrop of intensifying global climate change and tightening resource constraints, the coordinated advancement of digital transformation in manufacturing and sustainable development goals (SDGs) has emerged as a shared focus for academia and industry [8]. As digital technologies deeply permeate industrial chains, how enterprises enhance value co-creation efficiency among stakeholders through dynamic resource–capability allocation holds significance not only for short-term economic gains but also for building environmentally friendly and socially inclusive sustainable manufacturing systems [9].
However, existing studies predominantly focus on digital transformation pathways for individual firms or static perspectives, lacking dynamic analysis of resource–capability synergy mechanisms in cross-organizational quality chains. They also fail to systematically elucidate the long-term impacts of multi-factor interactions on sustainable value creation. Field research reveals persistent challenges in Beijing’s manufacturing sector, including weak incentives for digital quality management adoption and unclear implementation roadmaps. Current scholarship predominantly examines consumer-centric value co-creation, with limited empirical analysis of how digital transformation amplifies quality-driven profitability. Grounded in the resource–capability framework, this study employs a configurational approach to identify the drivers of value co-creation efficiency in digitalized quality chains. Key contributions include the following: (1) developing a quality-centric analytical model for multi-agent value creation in digital ecosystems; and (2) proposing actionable solutions to efficiency bottlenecks in Beijing’s manufacturing sector, offering strategic insights for national industrial chain advancement.
The structure of this study is organized as follows: Section 2 synthesizes existing literature on quality chains, digital transformation, and value co-creation. Section 3 proposes a novel theoretical analysis framework. Section 4 details the methodological framework, including a shared-input network DEA model, single-case grounded theory analysis, and dynamic quantitative comparative analysis (QCA). It further specifies data sources, operationalization of outcome and antecedent variables, and data calibration procedures for configuration analysis. Section 5 conducts empirical analysis, including the necessity analysis of single conditions, the sufficiency analysis of condition configurations, and shows the intergroup results and intragroup results. Section 6 consolidates the study’s conclusions, provides actionable recommendations, and discusses limitations alongside future research directions.
2. Literature Review
2.1. Quality Chain Value Co-Creation
The quality chain concept, first introduced by Tom Troczynski, emphasizes process performance, measurement, and product characteristics in core enterprise production activities. It integrates feedback loops using statistical process control (SPC) and statistical process improvement (SPI) for these elements while aligning supplier capabilities with customer expectations through quality function deployment (QFD) [10]. Researchers have dismantled traditional “barriers” to quality management between upstream and downstream supply chain nodes. By integrating quality management bi-directionally across supply sources and demand endpoints, they propose a 3D model that strategically links internal quality loops (strategic, tactical, and operational) with supply chain coordination [11]. Unlike conventional quality control, the collaborative quality chain framework emphasizes global supply chain integration through systemic, procedural, and conceptual alignment. This approach addresses the “quality black box” in traditional supply chains by leveraging advanced management practices and technologies. Modern quality chain theory emphasizes networked enterprise alliances within supply chains. From the perspective of structural characteristics, traditional supply chain collaboration focuses on the uni-directional flow of materials, capital, and information between upstream and downstream enterprises [12]. In contrast, Industry 4.0-enabled alliances utilize digital technologies (e.g., blockchain, industrial IoT platforms) to establish networked collaboration structures. These emphasize real-time data sharing and joint decision-making among multi-node enterprises, breaking the physical boundaries of traditional supply chains and forming a quality-synergized network that spans the entire product lifecycle and incorporates all essential elements [13]. From the perspective of a driving mechanism, traditional supply chain quality management relies on contractual constraints and post-event traceability, which often leads to information silos and delayed responses [12]. In the digital transformation era, however, enterprises are compelled to adopt digital tools (e.g., digital twins, AI) for dynamic optimization. This includes integrating multi-source data to predict quality risks proactively, thereby shifting from reactive error correction to preventive quality control [14]. In view of value co-creation orientation, traditional supply chain collaboration prioritizes cost control and delivery efficiency, aiming to maximize profits for individual firms [15]. Modern multi-stakeholder partnerships, however, accelerate customized product iteration by integrating demand data from customers and suppliers. They enhance supply chain quality resilience through shared flexible resources (e.g., digital inspection tools, expert knowledge bases) and by optimizing members’ quality responsiveness and innovation capabilities [16,17].
As industries converge, service-dominant logic (SDL) extends value creation to dyadic and network relationships [18], fostering multi-stakeholder collaboration in a symbiotic ecosystem. Suppliers enhance system-wide capabilities through value co-creation, driving innovation and competitiveness for core enterprises [19,20]. This study integrates service-dominant logic into quality chain theory, extending traditional total quality management (TQM) to propose a value co-creation model for modern industrial ecosystems. Existing studies on multi-stakeholder value co-creation primarily focus on service sectors (e.g., tourism, platform-based firms), retail, media, and public governance [21]. In manufacturing, research on multi-stakeholder co-creation often examines consumer roles. For example, some studies based on the service-dominant logic, the ICT platform, and the ethical values-driven paradigm have shown that consumers’ ethical values and transcendent motivations play an important role in encouraging them to participate in co-creation activities [22]. At the meso-level, studies explore industrial clusters. For instance, research on manufacturing product–service integration examines cyclical dependencies and co-creation in demand-driven scenarios [23].
2.2. Digital Transformation and Quality Chain Value Co-Creation
While extensive research exists on the antecedents and economic outcomes of digital transformation, its definition remains contested in academia. Current conceptualizations generally position digital technologies as strategic enablers, emphasizing digital infrastructure as the technical foundation for transformative changes in individuals, organizational governance, business models, and value chains [24,25,26]. Scholars have proposed intelligent quality management theories for manufacturing based on the Quality 4.0 framework, integrating technological, operational, and value dimensions [27]. However, quantitative studies on the mechanisms linking digital transformation to quality management remain scarce, with most research focusing on digital empowerment’s impact on organizational performance [28]. For example, studies suggest that digital platform ecosystems enable resource co-management among diverse stakeholders [29]. First, digital platform ecosystems enable cross-organizational resource integration through data resource sharing. For instance, blockchain technology offers tamper-proof recording and real-time synchronization of core data (e.g., raw material quality and process parameters) among multiple stakeholders via distributed ledgers [30]. This ensures the credibility of data traceability and addresses cross-organizational data silos. Furthermore, digital platform ecosystems overcome the latency of traditional centralized decision-making by adopting mechanisms such as multi-agent systems and consensus algorithms [31]. These tools facilitate collaborative decision-making among multiple stakeholders, enabling dynamic resource optimization.
3. Theoretical Framework
The resource-based view (RBV) and dynamic capabilities perspective (DCP) provide complementary theoretical lenses for examining how digital transformation enhances value co-creation efficiency in quality chains. This study develops an integrated “resource–capability” framework grounded in RBV and DCP to identify the drivers of digital transformation, supported by case analyses of 81 manufacturing firms in Beijing.
3.1. Digital Resource Endowment
The RBV posits that resources are pivotal to organizational survival and the attainment of competitive advantages [32]. The heterogeneity of resource endowment and integration constitutes a core factor driving performance differences among organizations. At its essence, value co-creation theory emphasizes the interactive collaboration and resource integration between enterprises [19,20]. Centered on service-dominant logic, manufacturing enterprises must concurrently acquire external resources and internalize and effectively deploy existing ones to achieve value co-creation amidst the dual rigidity dilemma of “resources” and “routines” [33].
Within the digital economy context, heterogeneous digital investments in manufacturing enterprises significantly enhance corporate performance through improved management efficiency [34]. Such heterogeneous digital resources foster unique competitive advantages via complementary asset combinations [35]. Aligning with the RBV framework, these resources yield synergistic multiplier effects when they exhibit value, scarcity, inimitability, and irreplaceability. Illustrative examples include the integration of cloud computing hardware and AI algorithms, which reduces latency in real-time data processing [36]; the cognitive diversity inherent in executive teams’ heterogeneous expertise, which optimizes resource allocation and accelerates decision-making responsiveness [37]; cross-functional talents (e.g., business-savvy algorithm engineers), who elevate interdepartmental collaboration efficiency through knowledge spillover [38]; and cross-system data integration, which mitigates decision-making delays caused by information silos [39]. For traditional manufacturing firms pursuing internal transformation through digitization, the adoption of digital technologies and resources can revitalize conventional production capabilities and advance value co-creation within business networks [40]. Moreover, within enterprise ecosystems, fundamental shifts occur only when core enterprises prioritize their resource endowments [41]. From a macro perspective, digital investment further bolsters the stability of value chains in upstream manufacturing and non-technology-intensive industries [42]. In light of these considerations, this paper constructs the primary resource base conditions for digital transformation across the following two dimensions: exogenous resources and internal organizational resources.
As an exogenous resource, government support significantly enhances value creation across manufacturers, suppliers, consumer surplus, and total supply chain value [43,44]. The Manufacturing Excellence Quality Engineering Implementation Guidelines [45] issued by China’s Ministry of Industry and Information Technology and two other agencies emphasize accelerating digital transformation in quality management through the following:
- -
- Digitized R&D and design systems;
- -
- Intelligent production processes;
- -
- Lifecycle data governance frameworks;
- -
- Supply chain management optimization;
- -
- Quality data management institutionalization.
Through direct regulatory guidance the government enhances value co-creation efficiency across manufacturing quality chains by incentivizing collaborative innovation and resource integration. Government support enhances the competitiveness of the entire quality chain by stimulating innovation capabilities in anchor firms, which drives improvements in supply chain intelligence, operational efficiency, and management practices. Specifically, policy interventions targeting core enterprises accelerate digital innovation, enabling cost-effective transformations in value-creation processes. Such innovation facilitates multi-stakeholder value co-creation, thereby substantially elevating manufacturing performance [46,47].
Economic motivation theory posits that firms investing in digital resources achieve short-term operational efficiencies and value creation, thereby enhancing economic returns. More crucially, over the long term such digital investments enable core enterprises to gain institutional legitimacy in the eyes of stakeholders, which further improves economic performance in the digital era [48]. At the industry level, investments in digital capability development drive manufacturing value chain upgrading through the mediating role of total factor productivity. The positive effects are further amplified by deep supply chain collaboration. Thus, prioritizing digital infrastructure and fostering high-quality inter-firm coordination constitute foundational prerequisites for value chain advancement [49].
3.2. Digital Dynamic Capabilities
Compared with the resource-based view, the dynamic capability view challenges the rigidity of core competencies and emphasizes the systematic construction, integration, and reconfiguration of internal and external resources within dynamic market environments to enable firms to innovate products and processes [50]. In the digital age, dynamic capabilities that enable firms to identify, capture, and reconfigure digital opportunities can enhance the systemic networks formed by diverse stakeholders, including suppliers, facilitating collaborative value co-creation [29,51]. Thus, dynamic capabilities constitute a core mechanism driving digital transformation. This process is manifested through the following three key phases: leveraging environmental sensing capabilities to identify dynamic market shifts and evolving stakeholder expectations; digitizing operational modules (e.g., warehousing, production, logistics) and scaling transformations across the supply chain to enhance service quality; and establishing network effects to foster data-driven synergies among ecosystem partners [28,52]. Regarding dimensional categorization, Argote and Ren [53] identified the following three stages of dynamic capabilities in platform-based manufacturing firms developing collaborative ecosystems: accumulation (opportunity perception and resource patching), formation (opportunity exploration and resource orchestration), and empowerment (opportunity development and resource concerto). Grounded in cognitive behavioral theory, Lan et al. [54] conceptualized digital transformation capabilities through the three dimensions of digital perception, acquisition, and reconfiguration. Integrating organizational learning theory and knowledge-based perspectives, Chen [55] categorized dynamic capabilities in digital transformation strategies into the three dimensions of coordination integration, absorptive learning, and environmental adaptation, demonstrating empirically how digital transformation moderates corporate innovation performance. Synthesizing diverse conceptualizations, Chen et al. [56] posited that digital dynamic capabilities are operationalized through strategic reconfiguration and adaptation of technologies, resources, and processes to align with evolving digital environments. Building on Chen and Duchek’s [56,57] framework, this study categorizes digital dynamic capabilities into the three dimensions of perception, operationalization, and collaboration.
Digital perception capability necessitates that enterprises analyze the opportunities and risks embedded in the digital economy by synthesizing insights from emerging technologies, regulatory trends, and competitive dynamics [58]. Core enterprises interpret evolving regional policies and industrial standards, revise supplier evaluation criteria to align with regulatory shifts, and drive the development of comprehensive quality frameworks across supply chains to enhance systemic quality outcomes [59]. For instance, integrating carbon metrics into supplier assessments and co-creating green production standards with upstream–downstream partners ensures policy compliance [60]. Concurrently, real-time analysis of consumer usage data enables firms to expand quality metrics to encompass user experience, redefine quality paradigms, and rapidly recalibrate product designs to align supplier outputs with market expectations [61]. Empirical studies indicate that core enterprises leverage cross-border integration strategies to cultivate symbiotic resource dependencies with suppliers, transcending resource heterogeneity barriers. Through relational governance mechanisms, cross-border initiatives foster trust-based partnerships with suppliers, enabling firms to leverage market intelligence from supply chain networks and strengthen dynamic sensing capabilities [62]. When structural shifts occur among networked node enterprises, linkage-driven spillovers amplify coordination-integration efficiency across supply chains, optimize interorganizational information flows, and further enhance the enterprises’ perception of outside [63]. Thus, this study operationalizes digital perception capabilities by employing supplier integration as a quantitative proxy.
Digital collaboration capability encompasses the strategic integration of internal and external complementary resources—particularly digital knowledge and information—to dismantle data silos and enable cross-functional resource convergence [64]. Core enterprises develop transparent collaboration platforms to facilitate real-time data exchange with suppliers, synchronizing production metrics, quality reports, and operational updates for rapid issue resolution [65]. Leveraging blockchain technology they ensure data immutability to strengthen trust [66]. Furthermore, codifying tacit quality management expertise into standardized digital toolkits and disseminating these via cloud-based platforms empowers suppliers to absorb technical knowledge and enhance autonomous capabilities [67,68]. Digital collaboration capability is operationalized through intra- and inter-organizational information sharing. Internally, enhanced information accuracy and flow reduce operational redundancies, strengthen intra-organizational trust, and boost productivity, thereby enabling robust external collaboration [69]. Externally, digital technologies dissolve organizational boundaries, compress spatiotemporal knowledge gaps, and extend enterprise networks to accelerate cross-industry knowledge diffusion and technology co-creation. External information sharing mitigates transactional frictions across supply chains by resolving information asymmetry and curbing adverse selection, whilst also enhancing access to cutting-edge technologies and diverse innovations—catalyzing value co-creation among firms and stakeholders [70]. Empirical studies reveal persistent challenges, including fragmented production data and system interoperability gaps, despite significant prior investments in enterprise digitization [71]. Addressing these requires evolutionary architectural redesigns to unify distributed systems and enable multi-platform integration. Consequently, this study centers on the system integration and information sharing degree of enterprises across the quality chain.
In prior research scholars have positioned operational capabilities and dynamic capabilities as coexisting at equivalent hierarchical levels [72]. This study extends the conceptual framework of dynamic capabilities within the context of digitalization, identifying digital operational capabilities as a subordinate dimension of dynamic capabilities. Li et al. [73] examined virtual community platforms as their empirical context, defining digital operational capabilities as organizational competencies to manage and operate online communities through leveraging digital technologies. Broadly conceptualized, Li et al. [74] posited that digital operational capabilities manifest through digital management practices across the following two domains: internal daily business operations and post-product operational maintenance. Other scholars have broadened their analytical focus to encompass digital transformation across functional domains, including R&D design, production and manufacturing, and marketing services [75]. The 2023 guideline Opinions on the Implementation of the Excellent Quality Project in the Manufacturing Industry, issued by China’s Ministry of Industry and Information Technology [45], emphasizes that exemplary quality management capabilities entail the comprehensive, continuous, and systematic integration of digitalization across R&D design, production, manufacturing, quality assurance, and supply chain management, supported by digital, networked, and intelligent systems grounded in next-generation information technologies. This paper argues that digital operational capabilities, from an enterprise production and operations standpoint, are characterized by the synergistic and multiplier effects of digital elements to optimize resource allocation, reduce R&D and search costs, and enhance foundational capabilities in R&D, manufacturing, and procurement to elevate operational efficiency. By leveraging data and algorithms, enterprises optimize collaborative processes [76]. For instance, machine learning algorithms analyze multidimensional data—including supplier equipment utilization and defect distribution—to dynamically refine order allocation and production scheduling, transcending the constraints of traditional experiential decision-making [77]. Furthermore, through the development of flexible processes and consensus-based hierarchical structures within a unified system platform encompassing all operational facets, enterprises address emergent challenges while fostering organizational learning through iterative knowledge-sharing, culminating in operational best practices that significantly enhance efficiency [78].
Drawing upon resource-based and dynamic capability theories, and contextualized within quality chain system practices, this study categorizes the factors influencing quality chain value co-creation efficiency into resource-based factors and digital dynamic capabilities. Resource-based factors are delineated into the two following antecedent variables: exogenous and internal resources. Digital dynamic capabilities comprise the three following three antecedents: digital perception, operation, and collaboration capabilities. The analytical framework of this study is illustrated in Figure 1.
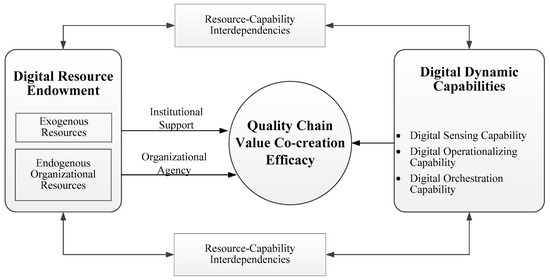
Figure 1.
Configurational analysis framework of “resource–capability” influencing factors.
4. Methods
4.1. Research Context
The shared-input two-stage network DEA model is a methodology for evaluating the relative efficiency of decision-making units (DMUs) that allocate input resources across sequential stages [79]. This framework comprises the following two distinct phases: the first generates intermediate outputs from shared inputs, while the second utilizes these intermediates for subsequent processing. In the initial stage, DMUs convert input resources into intermediate outputs, whilst the second stage applies these outputs to final production [80]. By decoupling these processes, the structure enables the precise measurement of stage-specific efficiency. Consequently, aligned with the operational dynamics of quality chains, this study adopts the shared-input network DEA model to assess value co-creation efficiency.
Case study research represents a well-established qualitative methodology, particularly suited to investigating ‘how’ research questions by leveraging causal evidence chains to dissect processes and mechanisms [81]. Through its emphasis on the contextualized exploration of complex management practices and the development of theoretical frameworks, case study analysis addresses underexplored phenomena. In applying network DEA to evaluate quality chain value co-creation efficiency, this study identifies the dimensional structure of intermediate variables, focusing on manufacturing quality chains led by core enterprises that achieve value co-creation via resource, information, and technology sharing, alongside collaborative partnerships. These research objectives align with Eisenhardt’s [81] framework for investigating ‘what’ and ‘how’ dynamics. Accordingly, the study employs a single-case design integrating grounded theory and coding analysis to operationalize intermediate variable dimensions.
The value co-creation of multiple actors within the chain structure represents an evolutionary outcome arising from the collective action and interaction of multiple factors. However, traditional QCA is constrained by theoretical and methodological limitations, primarily relying on cross-sectional data, and struggles to longitudinally examine temporal configuration effects [82]. Value co-creation in the quality chain hinges on continuous events occurring along a temporal axis, where static interface configurations alone are insufficient to explain the dynamic interplay between causality and temporal progression [83]. To address this, this study draws on the theoretical framework proposed by Roberto Garcia-Castro et al., employing R software (Version 4.4.1) to implement dynamic QCA. This approach measures the multi-stage and holistic value co-creation processes within Beijing’s manufacturing quality chain across years, examining intergroup, intragroup, and aggregate perspectives. By analyzing metrics such as consistency-adjusted distance [84], the temporal and case-specific dynamics of panel data for core manufacturing enterprises are rigorously characterized.
4.2. Data Collection
Data were derived from the 2024 Beijing Municipal Government Quality Management Award application survey, comprising 40 quantitative metrics and non-scale questionnaires (primarily multiple-choice items). The selection criteria for the Beijing Municipal Government Quality Management Award prioritize exemplary enterprises with robust quality management systems and demonstrable innovation outcomes [85]. Consequently, applicants typically possess an established foundation in digital transformation, marked by measurable progress, and exhibit heightened compliance awareness and proactive strategies to leverage competitive advantages [86]. These enterprises tend to exceed industry averages in quality management capabilities and resource allocation intensity [87], thereby reflecting the efficacy of policy-driven digital transformation and supplying high-fidelity data to evaluate action mechanisms within digital transformation frameworks. Furthermore, their transformation pathways hold substantial reference value for industry peers, particularly in exemplifying value co-creation through critical mechanisms like quality chain coordination and data-driven decision-making. In contrast, non-applicant enterprises are frequently restricted by constraints such as transformation costs and technical capacity, remaining in nascent or exploratory phases of digital transformation and manifesting underdeveloped digital transformation attributes. Consequently, their quality chain coordination models and data governance frameworks diverge markedly from those of applicants, undermining comparability across critical indicators such as value co-creation mechanisms and resource integration strategies. Moreover, non-applicant SMEs and traditional manufacturers often encounter compounded challenges, including limited supply chain influence and protracted digital input–output cycles [87]; however, these variables lie beyond the scope of the current research framework. Thus, the selected sample population is methodologically sound and representative, ensuring analytical rigor within the study’s defined parameters. The initial sample included 120 Beijing-based manufacturing firms (2020–2023 data). To mitigate outliers we (1) excluded firms established <3 years and (2) removed entities with >20% missing data. After excluding 39 incomplete cases, the final dataset contains 81 firms with 5508 annual indicators across four years.
This study employs Lenovo Group as a single-case subject to derive intermediate variable dimensions for measuring quality chain value co-creation efficiency. The principles of typicality and representativeness are demonstrated through the following three key considerations: First, since 2014, Lenovo has pioneered a smart quality ecosystem management model, enabling comprehensive, multi-tiered value co-creation. Through big data analytics, user needs and feedback are systematically captured, while intelligent systems facilitate process visualization and data-driven value enhancement. Resources and capabilities are extended across stakeholders to foster collaboration, supply chain quality upgrades, and industry-wide high-quality development, thereby advancing socio-ecological value co-creation. Second, as a quality chain core enterprise, Lenovo drives resource collaboration and optimization via intelligent quality management platforms and technologies, exemplifying manufacturing quality chain leadership. Third, Lenovo’s quality chain encompasses diverse, complex user segments and cross-regional, large-scale supply chain partners, reflecting a dynamic evolution of resource-sharing, information exchange, and diversified value creation. Aligning with service science theory, this progression forms a robust service ecosystem, rendering Lenovo a representative case for this research.
Guided by the principle of triangulation, data were categorized into primary and secondary sources, collected through a ‘quality’ lens and cross-validated to ensure reliability, thereby strengthening the study’s theoretical and practical validity. Primary data include field notes from Lenovo’s internal meetings on its intelligent quality ecosystem, covering five sessions between 19 March and 10 June 2021. A researcher documented proceedings and conducted preliminary analyses to support iterative theory development, aligning with Glaser and Strauss’s emphasis on concurrent data collection and analysis [88]. Secondary data were sourced from CNKI journals, theses, corporate websites, and consultancy reports. Together, these sources form an evidentiary triangle, ensuring methodological rigor and trustworthiness.
4.3. Measures and Calibration
4.3.1. Outcome Variable (Quality Chain Value Co-Creation Efficiency)
Drawing on the operational logic of quality chains, we conceptualize value co-creation as a two-phase process of (1) multi-stakeholder value generation and (2) economic value realization. A shared-input DEA efficiency model (Figure 2) is developed to measure interdependencies between these phases.
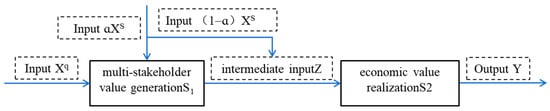
Figure 2.
Two-stage quality chain value co-creation process incorporating shared inputs.
The input indicators (X) labor (X11: headcount) and capital (X21: total assets) are adopted from Yu’s [89] framework. Given the short period (2020–2023), inflation adjustments are omitted. The output indicators (Y) for economic value realization are measured via return on equity (Y11: ROE) and return on assets (Y12: ROA), following established financial metrics [90]. The mediating variables (Z) are derived as follows: using three-tier coding analysis and triangulation [91], we derive measurement dimensions from Lenovo Group’s case data (primary/secondary sources in Table 1), ensuring validity through cross-verification. Open coding identified 2097 references, yielding the following three quality chain dimensions through axial coding:

Table 1.
Case study data sources.
(1) Internal horizontal integration (intra-departmental coordination): Lenovo advocates digitalization to enhance quality management by enabling efficient operational processes and data-driven decision-making. Guided by the principles of process integration, data standardization, and quality-driven business value, Lenovo employs mathematical analysis, machine learning, and operational modeling to develop intelligent solutions. The vertical value proposition, manifested as operational efficiency and scientific decision-making (C11), serves as the foundation of value co-creation. Underpinned by the PDCA (plan–do–check–act) framework, Lenovo’s management–executive layer has developed intelligent systems that utilize advanced data analytics to facilitate decision-making. Lenovo’s value co-creation framework mitigates collaboration inconsistencies via a resource-integration coordination mechanism [92], addressing decision-making inefficiencies stemming from fragmented stakeholder alignment.
Horizontal resource integration: Current literature on resource integration has shifted focus from constraints on resource origins to improving heterogeneous resource utilization and allocation capabilities [93]. This study measures horizontal resource integration in manufacturing enterprises through the following three dimensions: resource utilization capability, capital allocation efficiency, and resource heterogeneity [94,95,96]. Resource heterogeneity refers to differences in resource bundles, capability bundles, and core competency bundles among enterprises, which underpin competitive advantage [97]. This study identifies employee training in quality management as a core element for achieving multidimensional value creation in quality chains from a human capital perspective in the digital era [98]. Quality infrastructure development enhances technological innovation by strengthening R&D capabilities [99] and facilitates intelligent quality management. Thus, quality infrastructure investment is a critical resource for driving value co-creation in quality chains from a capital perspective. Drawing on Afrifa’s approach [100], this study employs a stochastic frontier analysis (SFA) model with a time-varying translog function to construct indicators for capital allocation efficiency. The specific metrics are detailed in Table 2. Internal resource utilization capability refers to employees’ ability to exploit and transform existing resources [101]. Berchicci [102] measures this capability through R&D capacity. Aligned with quality chain improvement and innovation, this study quantifies internal resource utilization using the number of new products or patents, which reflect quality innovation and R&D capability.
Table 2.
Efficiency evaluation index system for value co-creation in quality chains.
(2) Internal vertical integration (cross-departmental resource alignment): Lenovo’ s horizontal value co-creation process centers on the following two dimensions: (1) a value chain spanning machine learning-driven predictive analytics (F36), R&D data assurance (F32), production quality prevention (F35), order status visualization (F39), a 4D supplier evaluation framework (F33), digital audit systems (F34), and intelligent after-sales management (F31), aligned with the ‘research–production–sales–supply–service’ pathway. (2) Complementing this is market-centric intelligent analysis of customer demand dynamics (F37). As illustrated in Figure 3, core enterprises leverage market demand data as foundational resources, integrated with horizontal resource allocation across internal activity layers, equipping them to explore product potential value early in R&D. This capability enables product innovation in competitive markets (E21), enhances customer demand throughout the product lifecycle (E22), and addresses evolving customer needs during iterative upgrades (E23). Consequently, this process is fundamentally oriented toward unlocking latent value (E2).
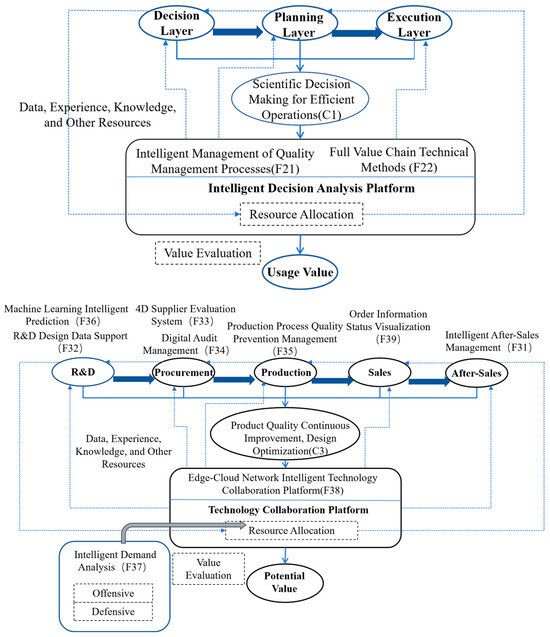
Figure 3.
Value co-creation process of internal quality chain based on “resource integration”.
Vertical resource integration: Vertical integration effectiveness manifests in cross-hierarchical management processes. Process integration is a critical activity for enhancing multi-value integration capabilities internally, with a focus on operational efficiency. This study measures internal process integration using process capital—reflecting operational efficiency and internal business workflows [103]. Aligned with quality chain dynamics, process capital is operationalized as the inverse ratio of quality management investment to net revenue.
(3) External axial integration (supplier collaboration): In this axis, Lenovo, as the core enterprise, extends its quality management resources and capabilities to foster multi-stakeholder collaboration (F11). This includes establishing an industry high-quality-and-green development alliance that delivers intelligent solutions for quality management, compliance standardization, and sustainable practices across the entire “research–production–supply–marketing–service” value chain (F13). Concurrently, Lenovo facilitates a quality experience-sharing platform to disseminate best practices and industry insights (F14). By positioning supply chain quality enhancement and industrial ecosystem advancement as core value propositions, Lenovo leverages supplier integration (e.g., with Supplier A/B) to co-create value. Through digital platforms enabling interconnected feedback mechanisms for production optimization, mutual resource dependencies emerge. This transforms suppliers from transactional contractors into strategic partners engaged in internal operations, ultimately enriching end-customer product experiences (Figure 4).
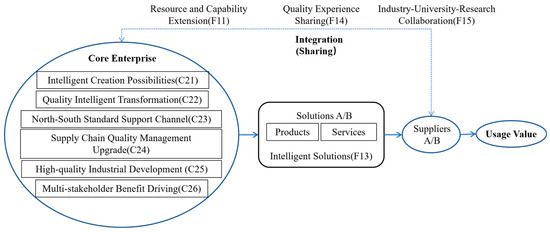
Figure 4.
Axial value co-creation based on “supplier integration”.
Axial external integration: External integration reflects the intensity of interactions between enterprises and stakeholders (e.g., customers and suppliers). The accounts payable turnover period, a key indicator of capital flow efficiency, directly reflects the timeliness of fund delivery between manufacturers and suppliers [104] and serves as a critical measure of capital flow management in supply chain partnerships [105]. This study evaluates supplier collaboration efficiency using accounts payable turnover rate, where a higher rate indicates faster capital recovery and stronger operational synergy [106].
This study adopts multi-value creation efficiency, value conversion efficiency, and overall efficiency as outcome variables for quality chain value co-creation. An evaluation index system is established, comprising 8 secondary and 12 tertiary indicators, as summarized in Table 2.
Using MATLAB (Version 9.5) to analyze the selected sample data and indicators, we derived the comprehensive efficiency, multi-value creation-phase efficiency, and value-transformation-phase efficiency for Beijing’s manufacturing sector during the 2020–2023 period (Table 3).
Table 3.
Quality chain value co-creation efficiency of Beijing’s manufacturing enterprises (2020–2023).
4.3.2. Condition Variables
Resource Endowment: Combined with the previous analysis of the impact of exogenous resources, which is mainly reflected in government support, the internal resource endowment mainly refers to the digital construction investment efforts of organization, and so this paper selected the amount of government financial support and digital construction investment as a measurement indicator, respectively.
Digital Dynamic Capabilities: According to the analytical framework, digital perception capability is operationalized as the degree of integration between core enterprises and their suppliers. This study employs the multiple-choice item “Supplier Management” from the 2023 Beijing Municipal Government Quality Award Survey. The item was developed based on scales established by Flynn [107], Yu [108], Lii [109], and colleagues. Responses are rated on a 1–5 scale based on linkage level, with scores aggregated to quantify enterprises’ digital perception capability. Digital collaboration capability, as defined in this framework, is measured by the extent of system integration and information sharing across the enterprise’s quality chain. For this purpose, the survey item “Digital Construction Status: Enterprise Establishes a Digital Information Platform to Integrate Multiple Systems and Enable Information Sharing” is utilized. This item adopts the scale developed by Zhao et al. [110], with responses scored from 1 to 4 (higher values indicating stronger capability). Digital operation capability is assessed through the extent of digital transformation in the enterprise’s production and operational processes. Accordingly, this study analyzes the “Digital Construction Status: Adoption of Digital and Intelligent Means” item from the same survey. The item draws on Adomako et al. [111], and identifies 10 key business processes (e.g., procurement management, design and development, production) where digital and intelligent means are applied. Each process receives a score of 1 (if implemented) or 0 (if not), and the total score is calculated by summing all values. Variable selection and statistical data are presented in Table 4.
Table 4.
Assignment table for variables of digital dynamic capabilities.
4.3.3. Calibration
Drawing on the direct calibration methodology by Fiss et al. [112], we standardized conditional and outcome variables using percentile anchors: 95th (full membership), 50th (crossover point), and 5th (full non-membership). To mitigate extreme-value bias, membership scores were trimmed at the 0.1% level (top/bottom 0.001 quantiles) [113]. Calibration outcomes are reported in Table 5.
Table 5.
Calibration of condition and outcome variables.
5. Results
5.1. Necessity Analysis of Individual Conditions
Necessary condition analysis is judged by a consistency level higher than 0.9, which means that the condition is considered necessary to constitute the outcome variable. In QCA panel data analysis, when the adjustment distance is less than 0.1 the aggregated consistency accuracy is high and can be used as a basis for judgment. However, when the adjustment distance is greater than 0.1, it is necessary for the researcher to further explore the necessity. The results of the analysis are shown in Table 6. The adjustment distance of the three conditional variables of digital collaboration capabilities, digital perception capabilities, and digital operation capabilities in the three phases is less than 0.1, and the aggregated consistency is less than 0.9, which indicates that these factors are not the necessary conditions for the outcome variables. However, government support and digital construction investment have intergroup adjustment distances greater than 0.1, which need to be further examined. By analyzing the intergroup consistency and coverage of the corresponding variables (as shown in Table 7), this study finds that none of the years in combinations 1 to 9 have a level of intergroup consistency greater than 0.9 and an intergroup coverage greater than 0.5, and therefore concludes that none of the conditions constitutes a necessary condition for the efficiency of quality chain value co-creation over the overall time. It is also worth noting that the consistency of government support and digital construction input elements in cases 7 and 9 shows an increasing trend from 2020 to 2023 (as shown in Figure 5), in which the degree of the necessity effect of digital construction input increases most rapidly, which coincides with the results of the previous study, and to a certain extent demonstrates the importance of digital construction input. With the passage of time, the manufacturing industry needs to complete the digital transformation, and so the demand for digital inputs for enterprises is also climbing rapidly.
Table 6.
Necessary condition analysis.
Table 7.
Adjusted intergroup distances exceeding 0.1.
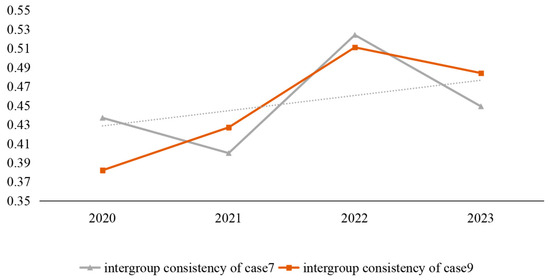
Figure 5.
Trends in intergroup consistency for cases 7 and 9.
5.2. Sufficiency Analysis of Configurations
Conditional grouping sufficiency analysis, as a core step of QCA, aims to investigate how different conditional variables combine to affect the outcome variable. In this paper, the three-stage consistency thresholds, frequency thresholds, and PRI thresholds are all set to 0.9, 5, and 0.75, respectively. Second, according to the previous analysis, there is no explicit necessity condition and so the necessity direction is no longer preset. Finally, the enhanced simple, intermediate, and complex solutions are obtained after model analysis. In this study, the enhanced intermediate solution is the main object of analysis, the enhanced simple solution is the auxiliary condition, and the core and edge conditions are further excavated. Table 8 presents the results of the three-stage grouping analysis, which contains a total of four groupings that can be further refined into four types, i.e., resource utilization multi-capability driven, multi-capability driven, government support multi-capability driven, and resource utilization-capability driven.
Table 8.
Configuration analysis results.
As shown in Table 8, the overall consistency is 0.949, 0.957, and 0.872, respectively, which is greater than 0.75, and the intragroup and component adjustment distances of individual grouping are lower than 0.2, indicating that the aggregation consistency has good explanatory strength and that these four groupings can be regarded as the sufficient conditions for the high overall efficiency of value co-creating, the high efficiency of multi-capability value-creating, and the high efficiency of value transforming.
Resource Utilization Multi-capability Driven. Configuration 1 is primarily driven by digital perception capability, with digital construction investment and digital collaboration capability serving as auxiliary conditions, while lacking government support as a core condition. BAIC Foton Automobile Co., Ltd. exemplifies this configuration, demonstrating enhanced efficiency in quality chain value co-creation through its digital transformation architecture incorporating cloud computing, mobility solutions, sharing mechanisms, interconnection technologies, and rapid iteration capabilities. Regarding digital construction investment, Foton Motor has implemented comprehensive end-to-end process transformation, accompanied by organizational restructuring and governance enhancement within a unified enterprise framework. This involves transitioning from traditional infrastructure systems with siloed data management to a cloud-based platform featuring data middleware core architecture and cloud-native application systems. The company’s supply chain digitization employs intelligent components inspection, automated storage (3D warehouse), AGV transportation, RFID identification, IoT scheduling, and digital-twin integration, achieving 100% distribution accuracy while optimizing resource utilization across the supply chain. Through its digital collaborative platform (DCP), Foton integrates market planning with R&D processes, enabling scenario-based product definition and data-driven development across all business domains. Continuous industrial internet platform investments further enhance information sharing through advanced data processing, AI algorithms, and high-performance computing, ultimately improving value creation efficiency.
Multi-capability Driven. Configuration 2 lacks digital construction and perception capabilities as core conditions but establishes digital operation capability as the core driver, supported by digital synergy capability as an auxiliary factor to achieve high-value co-creation efficiency. This configuration is exemplified by Beijing Yanjing Brewery Co., Ltd. Digitization of Yanjing Brewery’s supply chain management facilitates a closed-loop production, supply, and marketing process with integrated end-to-end control; its business scope encompasses material files, procurement, sales, inventory, outsourced processing, and quality management. The company developed a flexible, efficient, and interconnected research–production–supply–marketing management system, achieving information synergy across sales, production, procurement, inventory, finance, quality, and after-sales departments. This enhances three key capabilities, resource organization and synergy (e.g., upstream–downstream participants, facilities), precise operation and control (e.g., shortened delivery times, cost management), and resource optimization and scheduling (e.g., rapid response, cost-efficiency), thereby streamlining production and supply chains. Regarding digital operation capability, Yanjing Brewery implements a digital construction strategy focused on intelligent operations and enterprise-wide digitization, driving centralized, refined, and standardized transformation. This includes establishing five platforms—business analysis, production operation, enterprise management, digital empowerment, and infrastructure—which cover domains like production, HR, finance, supply chain, marketing, collaborative office, and assets, while continuously promoting business-management integration, enhancing enterprise intelligence, and digitizing operational processes. In summary, Yanjing Brewery’s comprehensive digital synergy and operational capabilities collectively enhance quality chain value co-creation efficiency.
Government Support-Multi-capability Driven. In configuration 3, digital construction investment and digital perception capability are absent. The resource base relies on government support, the dynamic capability derives from digital operation capability, and the integration of digital collaboration capability constitutes a sufficient condition set for high multi-value creation efficiency. A typical case of this configuration is Yuekang Pharmaceutical Group Co., Ltd. The Beijing Economic and Technological Development Zone provides industrial agglomeration advantages and policy support for constructing Yuekang Pharmaceutical’s intelligent workshop, facilitating rapid implementation of its fully automated production line. Regarding digital operations, the company has developed a full-process AI drug R&D platform that relies on multiple cutting-edge large models and AI algorithms developed in-house, which are widely applied in novel peptide drug design, cationic lipid development, and other fields, as well as in the accurate prediction of drug activity and toxicity. Yuekang Pharmaceutical’s production workshop complies with international standards, and its facilities have been upgraded through comprehensive informatization, intelligent technologies, and digitization. The company was designated a “National Intelligent Manufacturing Pilot Demonstration Enterprise” by China’s Ministry of Industry and Information Technology, which has enhanced intelligent efficiency throughout the entire R&D–production process via digitalization. Simultaneously, Yuekang Pharmaceutical established a strategic cooperation agreement with Huawei in early 2024 to jointly develop a digital transformation project. This collaboration entailed deep integration in digital marketing systems, digital supply chain systems, and digital innovation R&D; the adoption of Huawei’s digital transformation practices and management concepts; and the advancement of comprehensive digitalization across strategic, marketing, supply chain, and innovation R&D domains. Guided by the three factors—government support, digital collaboration capability, and digital operation capability—Yuekang Pharmaceutical has significantly enhanced multi-value creation efficiency within the quality chain via collaborative configuration conditions.
Resource Utilization Capability Driven. Configuration 4 takes government support, digital perception capability, and digital operation capability as marginal deficiencies, and digital synergy capability as the core condition, supplemented by digital construction investment as the marginal condition. Typical cases of this grouping include China Beijing Tongrentang (Group) Co., Ltd. In terms of digital synergistic ability, the first phase of the digital supply chain project of Tongrentang Co., Ltd. has achieved the development and implementation of functional modules such as supplier management, procurement process optimization, finished product output, etc., and the use of professional databases and supply chain systems for the interoperability of on-line digital intelligent management and off-line production modes, realizing intelligent scheduling and achieving the best results in terms of optimization. In January 2025, Beijing Tongrentang Co., Ltd. (hereinafter referred to as “Tongrentang”) and China Unicom Beijing Branch (hereinafter referred to as “Beijing Unicom”) established a collaborative partnership through the formal execution of a strategic cooperation agreement. This agreement marks the initiation of sustained and systematic research endeavors aimed at advancing the digital transformation of traditional Chinese medicine (TCM). At the same time, Beijing Tongrentang Co., Ltd. (hereinafter referred to as ‘Tongrentang’) took the lead in the Chinese medicine industry in the in-depth fusion of knowledge graphs and AI models, completing the intelligent upgrading of the knowledge graph system. Tongrentang continues to improve the efficiency of value transformation in its quality chain through continuous investment in digital construction and digital synergy.
All four types exhibited intergroup consistency adjusted distances < 0.1 [113], indicating no significant temporal effects. However, consistency levels fluctuated above 0.75 during 2020–2023, with a notable dip in 2021 (Figure 6). This non-random anomaly (2021–2023) likely reflects COVID-19 disruptions to manufacturing operations in Beijing. Systemic shocks to supply chain coordination and multi-stakeholder value co-creation attenuated conventional causal explanations [114]. Nevertheless, adjusted distances < 0.1 across configurations preserve analytical robustness, affirming the model’s generalizability [112].
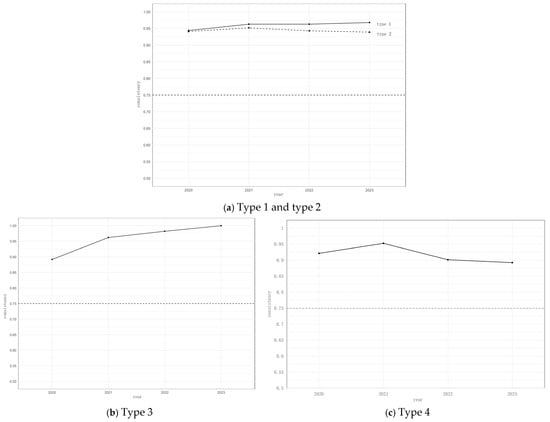
Figure 6.
Trends in intergroup consistency.
As illustrated in Figure 7, analysis of consistency within the case group reveals that only a limited number of enterprise configuration paths exhibit limited explanatory power for quality chain value co-creation efficiency. Statistical analysis indicates that enterprise sub-industries with consistency levels below 0.75 are predominantly concentrated in the pharmaceutical manufacturing and chemical raw materials/products manufacturing sectors. This phenomenon can be attributed to several factors: First, micro-level analysis suggests that most enterprises in these industries are typically small-scale, while the technical complexity associated with pharmaceutical and chemical manufacturing is comparatively high. Smaller enterprises often lack robust resource integration and process coordination capabilities, which impedes efficiency in multi-stage value co-creation. Second, technical complexities in these sectors—such as prolonged drug R&D cycles and high failure rates [115]—necessitate that cooperation networks reconfigure trust mechanisms and profit distribution rules during transitions from technical to market risks [116], leading to temporal inconsistencies in value co-creation pathways and diminishing overall effectiveness. Third, China’s pharmaceutical manufacturing sector has persistently underperformed in profitability over the past two decades [117], and its return on net assets has consistently deviated from the manufacturing sector’s average, further constraining value co-creation efficiency. Concurrently, digital transformation within China’s pharmaceutical manufacturing industry exhibits distinct phased characteristics. Three critical challenges persist: First, insufficient system integration is evident, as 51.8% of pharmaceutical manufacturers remain at single-point information coverage, resulting in data silos across business systems. Second, lagging transformation progress is observed, with approximately 26% of enterprises still in the nascent stages of digital capability development and lacking fully established foundational platforms. Third, weak industrial chain collaboration persists, as over 60% of enterprises face technical barriers in supply chain data integration, hindering real-time collaboration and resource alignment across upstream–downstream partners [118]. In summary, the pharmaceutical and chemical manufacturing sectors’ limited resource integration capabilities, process coordination inefficiencies, low digital maturity, and external factors beyond the research framework have collectively contributed to the limited efficacy of configuration paths in enhancing value co-creation efficiency, thereby diminishing the explanatory power of these models.
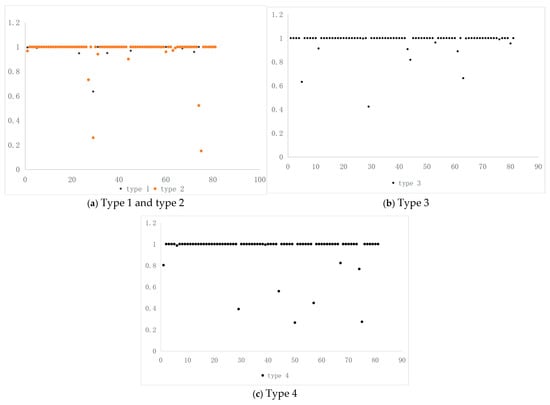
Figure 7.
Intragroup consistency of types 1–4.
6. Discussion and Implications
6.1. Research Conclusions
Digital transformation enhances the efficiency of value co-creation within quality chains and significantly contributes to sustainable development. By leveraging the resource–capability framework, it establishes value co-creation mechanisms through deep integration of digital technologies into enterprise resource allocation and capability development processes. This integration improves co-creation efficiency while advancing sustainability objectives. Regarding resources, digital transformation allows enterprises to overcome spatiotemporal constraints of traditional physical resources. Through the coordinated deployment of data resources, digital platforms, and intelligent technologies, it achieves efficient resource allocation and dynamic optimization. This transformed resource utilization directly reduces energy consumption and carbon emissions, fulfilling sustainability’s core requirements for resource conservation and environmental protection. From a capability perspective, digital transformation equips enterprises with agile market responsiveness. Technologies such as digital twins and artificial intelligence enable real-time monitoring and intelligent decision-making across all quality chain segments. These enhanced capabilities not only improve product/service quality stability but also advance sustainable development through reduced resource waste and environmental impact. Furthermore, by establishing open collaborative platforms, digital transformation facilitates data sharing and collaborative innovation among upstream and downstream entities. This fosters an ecological network for value co-creation, disrupting traditional linear supply chain structures. Consequently, small- and medium-sized enterprises gain access to global value chains and innovation resources, strengthening overall industrial competitiveness and risk resilience.
This study employs a QCA approach, using 81 manufacturing enterprises in Beijing as a case study, to investigate the synergistic effects of resource-based and dynamic capability factors on the multi-stage efficiency of quality chain value co-creation. The key findings reveal that enhancing quality chain value co-creation efficiency necessitates a synergistic integration of resource-based factors and dynamic capabilities. Neither resource-based nor dynamic capability factors alone constitute necessary conditions for achieving high efficiency in quality chain value co-creation. The mechanism through which resource–capability factors drive quality chain value co-creation exhibits temporal stability, remaining unaffected by short-term policy fluctuations or technological disruptions. As illustrated in Figure 7, intragroup consistency trends highlight pronounced industry-specific variations in configuration characteristics. The configuration paths for pharmaceutical manufacturing and chemical raw materials/products manufacturing exhibit limited efficacy in enhancing quality chain value co-creation efficiency. These enterprises, typically small-scale, face high technical complexity in pharmaceutical and chemical manufacturing, coupled with low profitability and immature digital transformation. Consequently, they struggle with resource integration and coordination, rendering digital dynamic capabilities ineffective in value co-creation. This underscores the need for tailored digital transformation strategies for sub-industries.
The following four distinct configuration paths for improving high-quality chain value co-creation efficiency were identified, each reflecting a unique synergy of resource–capability conditions in digital transformation:
Resource Utilization Multi-capability Driven. This approach centers on digital perception capabilities, with digital construction investment and collaboration capabilities serving as non-synergistic elements. It establishes a “perception–architecture–collaboration” trinity mechanism, enabling end-to-end process transformation through digital system reconstruction (e.g., BAIC Foton’s data middleware, IoT, and digital-twin integration). Unlike single-element transformation models, this framework demonstrates that infrastructure cloudification requires deep integration with scenario-based perception capabilities.
Multi-capability Driven. In contexts lacking digital infrastructure and perception capabilities, this path leverages digital operation capabilities as the engine and collaboration capabilities as the transmission chain, creating a closed-loop system for production, supply, and marketing. It challenges resource constraint theories by proving that operation capabilities embedded in business flows can compensate for infrastructure gaps (e.g., Yanjing Beer’s five digital intelligence platforms spanning production, supply chain, and finance).
Government Support Multi-capability Driven. Here, government support acts as a strategic fulcrum, driving digital operation and collaboration capabilities to form an innovation triangle. This model highlights the multiplier effect of policy interventions when combined with AI algorithms and ecosystem collaboration (e.g., Yuekang Pharmaceutical’s smart workshop in Beijing Economic Development Zone), bridging the “R&D transformation” gap in pharmaceuticals.
Resource Utilization Capability Driven. Focused on digital collaboration capabilities and construction investment, this path constructs a knowledge-driven supply chain hub. It demonstrates how traditional industries can harness innovative technologies (e.g., knowledge graphs in traditional Chinese medicine supply chains) to encode implicit experiences into computable knowledge nodes, optimizing scheduling and activating dormant data value.
6.2. Theoretical Contributions
The digital transformation resource–capability framework elucidates the internal mechanisms underlying the improvement of value co-creation efficiency in the quality chain, offering a novel analytical perspective and explanatory framework for sustainable development theory. First, this framework transcends the traditional resource-based view’s (RBV’s) dependence on static resources, highlighting the dynamic and reconfigurable nature of digital resources. Digital resources (e.g., data, algorithms, platforms) are non-exclusive and reproducible, enabling value multiplication through sharing and iteration. This aligns closely with the “sharing economy” and “circular economy” principles in sustainable development theory.
Second, the framework redefines organizational capabilities within capability theory, challenging conventional paradigms. While traditional capability theory centers on internal capability accumulation, digital transformation prioritizes “capability externalization” and “ecological empowerment.” Firms leverage digital platforms to disseminate capabilities (e.g., data analytics, algorithm models) to partners, enhancing their quality management and innovation. This fosters a sustainable “capability symbiosis” model. Moreover, this externalization mechanism not only enhances quality chain value co-creation efficiency but also drives industry-wide sustainable development via technology diffusion and knowledge sharing.
6.3. Management Implications
Based on the findings, the following recommendations are proposed:
Leverage Diverse Combinations of Resource-Based and Dynamic Capabilities. To enhance efficiency, enterprises should strengthen synergies between resource-based and dynamic capabilities. Resource and capability development are interrelated, reflecting the multifaceted drivers of value co-creation among stakeholders. Firms should establish multi-party quality collaboration platforms based on existing resources, fully utilize digital quality capabilities within the chain system, and address value co-creation barriers through targeted digital solutions. Enterprises should improve data transparency in supply chain stakeholder interactions and internal quality management processes. This supports decision-making across the quality chain, enhances multidimensional digital dynamic capabilities, addresses deficiencies in single- or dual-stage capabilities, and achieves synergistic efficiency improvements.
Adopt Sector-Specific Strategies for Multi-Stage Efficiency. Conduct in-depth case studies of high-performing benchmark enterprises within sectors to identify critical gaps and challenges. Develop tailored quality chain value co-creation models aligned with firms’ developmental stages and maturity levels to overcome bottlenecks in Quality 4.0 transformation:
Large-scale enterprises characterized by high-quality management maturity and a comprehensive digital process framework have deployed industrial Internet platforms, enabling real-time monitoring and predictive maintenance of core processes. These enterprises align with a resource utilization multi-capability-driven value co-creation model, leveraging big data and cloud computing to build a shared platform that integrates internal and external resources. By enhancing information transparency and real-time collaboration while linking digital collaboration and perception capabilities via standardized interfaces—such as IoT real-time monitoring and blockchain traceability systems—they facilitate upstream–downstream quality data sharing and process alignment, thereby establishing a data-driven, integrated quality management model.
Small- and medium-sized enterprises (SMEs) demonstrating moderate quality management maturity and reliance on external technical partnerships have adopted partial digital quality tools but have yet to dismantle quality data silos or establish end-to-end digital governance. Given their comparatively limited resources, SMEs may adopt a multi-capability-driven model to develop an agile, lean quality management framework targeting core bottlenecks, such as supplier collaboration or customer feedback loops. Through rapid iterative trials enabled by low-cost digital tools, these enterprises can optimize capability-matching efficiency and flexibly deploy modular digital collaboration tools via a “capability library” system.
Emerging manufacturing enterprises characterized by strong policy dependence can leverage government-led initiatives—such as industrial Internet identification resolution systems or targeted subsidies—to foster cross-enterprise data sharing. Guided by a policy-supported, multi-capability-driven framework, they may establish an open quality data mid-platform anchored in government-led digital infrastructure. By forming multi-stakeholder standardization committees and formalizing data-sharing agreements and quality evaluation metrics, these enterprises can incentivize supply chain partners to engage in joint R&D or quality certification through subsidies and tax incentives. Concurrently, pilot benchmarking projects aligned with policy priorities enable the development of replicable collaborative models.
For medium-to-large manufacturing enterprises with vertically integrated supply chains, advanced quality management maturity, and a focus on quantifying quality benefits, the resource utilization capability-driven model supports a supply chain intelligent optimization framework. Deploying integrated ERP and CRM systems enables end-to-end visualization, while machine learning algorithms optimize inventory, delivery, and quality risk prediction. By combining customer profiling with big data analytics, these enterprises enhance supply chain resilience, prioritize digitalization of high-value segments (e.g., key supplier management or customized services), and align operational outputs with market demand.
They should integrate analyses of profitability models and quality performance to establish frameworks linking quality improvements to revenue growth, thereby mitigating management pressures from high initial costs. They should also avoid overemphasizing efficiency in specific stages and recognize objective differences in value co-creation efficiency, multi-value creation efficiency, and economic value conversion across sectors. Furthermore they should develop concrete, quantifiable profit targets and incentives to help enterprises design customized smart quality management transformation plans. Governments should coordinate manufacturing policies, implement differentiated strategies, and formulate sector-specific incentives for intelligent quality management upgrades.
6.4. Limitations and Prospects
This study has the following limitations: (1) the selection of influencing factors based on resource-based and dynamic capability theories, while inclusive of validated variables, may overlook others and (2) the QCA method focuses on qualitative analysis. Future studies should combine QCA with quantitative methods as data and metrics improve, enabling deeper exploration of antecedents affecting manufacturing quality chain value co-creation efficiency. Future research could extend this work by first transforming the four configuration paths derived from QCA into dummy variables and constructing multilevel regression models to examine the causal impact of these configurations on the quality chain’s value co-creation efficiency. Alternatively, researchers might introduce higher-order interaction terms for these configurations, employing generalized linear models (GLMs) to assess the statistical significance of such terms. Finally, comparative analyses could explore the convergence between QCA-derived paths and regression outcomes to identify methodological synergies.
Author Contributions
Conceptualization, Z.Z. and M.C.; methodology, Z.Z.; software, M.C.; validation, Z.Z.; formal analysis, M.C.; investigation, M.C.; resources, Z.Z.; data curation, M.C.; writing—original draft preparation, M.C.; writing—review and editing, Z.Z.; visualization, M.C.; supervision, Z.Z.; project administration, Z.Z.; funding acquisition, Z.Z. All authors have read and agreed to the published version of the manuscript.
Funding
This research received no external funding.
Institutional Review Board Statement
Not applicable.
Informed Consent Statement
Not applicable.
Data Availability Statement
The original contributions presented in this study are included in the article. Further inquiries can be directed to the corresponding author.
Acknowledgments
Thanks to the judging experts and all members of our team for their insightful advice.
Conflicts of Interest
The authors declare no conflicts of interest.
References
- The Central People’s Government of the People’s Republic of China. Study the “Decision” Daily Q&A|What Are the Key Points to Be Grasped in Improving the Resilience and Security Level of the Industrial Chain and Supply Chain System. 2024. Available online: https://www.gov.cn/zhengce/202408/content_6969460.htm (accessed on 11 May 2025).
- State Administration for Market Regulation. Five Departments jointly Issued Guidance Opinions to Promote the Overall Improvement of the Quality of the Industrial Chain and Supply Chain. 2024. Available online: https://www.samr.gov.cn/xw/mtjj/art/2024/art_5cc1fec1b0e04579b685280761ab25c1.html (accessed on 11 May 2025).
- State Administration for Market Regulation. The State Administration for Market Regulation Convened a Special Work Leading Group Meeting on Quality Chain Strengthening. 2024. Available online: https://www.samr.gov.cn/xw/zj/art/2024/art_8100bdd2963747c1bd8152b2f97cc6d0.html (accessed on 11 May 2025).
- Adeniran, I.A.; Efunniyi, C.P.; Osundare, O.S.; Abhulimen, A.O. Transforming Marketing Strategies with Data Analytics: A Study on Customer Behavior and Personalization. Int. J. Sch. Res. Eng. Technol. 2024, 4, 41–51. [Google Scholar] [CrossRef]
- AL-Shboul, M.A. Artificial Intelligence Drivers’ Effect on Willingness to Adopt the Human Capital Supply Chain in Manufacturing Firms: An Empirical Investigation from Developing Countries—A Mediation Model. Ind. Manag. Data Syst. 2024, 124, 2919–2938. [Google Scholar] [CrossRef]
- Asif, M. Are QM Models Aligned with Industry 4.0? A Perspective on Current Practices. J. Clean. Prod. 2020, 258, 120820. [Google Scholar] [CrossRef]
- Monge, P.R.; Fulk, J.; Kalman, M.E.; Flanagin, A.J.; Parnassa, C.; Rumsey, S. Production of Collective Action in Alliance-Based Interorganizational Communication and Information Systems. Organ. Sci. 1998, 9, 411–433. [Google Scholar] [CrossRef]
- Lee, B.X.; Kjaerulf, F.; Turner, S.; Cohen, L.; Donnelly, P.D.; Muggah, R.; Davis, R.; Realini, A.; Kieselbach, B.; MacGregor, L.S.; et al. Transforming Our World: Implementing the 2030 Agenda Through Sustainable Development Goal Indicators. J. Public Health Pol. 2016, 37, 13–31. [Google Scholar] [CrossRef] [PubMed]
- Song, G.; Wang, F.; Dong, F. Can Digital Economy Foster Synergistic Increases in Green Innovation and Corporate Value? Evidence from China. PLoS ONE 2024, 19, e0304625. [Google Scholar] [CrossRef] [PubMed]
- Troczynski, T. The quality chain. Qual. Prog. 1996, 29, 208. [Google Scholar]
- Cao, Z.; Huo, B.; Li, Y.; Zhao, X. The Impact of Organizational Culture on Supply Chain Integration: A Contingency and Configuration Approach. Supply Chain. Manag. Int. J. 2015, 20, 24–41. [Google Scholar] [CrossRef]
- Wu, H.; Li, G.; Zheng, H. How Does Digital Intelligence Technology Enhance Supply Chain Resilience? Sustainable Framework and Agenda. Ann. Oper. Res. 2024, 1–23. [Google Scholar] [CrossRef]
- Wu, Y.; Zhang, Y. An Integrated Framework for Blockchain-Enabled Supply Chain Trust Management towards Smart Manufacturing. Adv. Eng. Inform. 2022, 51, 101522. [Google Scholar] [CrossRef]
- Fragapane, G.; Eleftheriadis, R.; Powell, D.; Antony, J. A Global Survey on the Current State of Practice in Zero Defect Manufacturing and Its Impact on Production Performance. Comput. Ind. 2023, 148, 103879. [Google Scholar] [CrossRef]
- Oteri, O.J.; Onukwulu, E.C.; Igwe, A.N.; Mikki Ewim, C.P.-; Ibeh, A.I.; Sobowale, A. Cost Optimization in Logistics Product Management: Strategies for Operational Efficiency and Profitability. Int. J. Multidiscip. Res. Growth Eval. 2023, 4, 852–860. [Google Scholar] [CrossRef]
- Dwivedi, A.; Srivastava, S.; Agrawal, D.; Dubey, S.; Singh, T.; Pratap, S. Examining the Facilitators of I4.0 Practices to Attain Stakeholders’ Collaboration: A Circular Perspective. Prod. Manuf. Res. 2023, 11, 2266643. [Google Scholar] [CrossRef]
- Xu, S.; Lu, Y.; Yu, C. Augmented Reality-Assisted Cloud Additive Manufacturing with Digital Twin Technology for Multi-Stakeholder Value Co-Creation in Product Innovation. Heliyon 2024, 10, e25722. [Google Scholar] [CrossRef]
- Pinho, N.; Beirão, G.; Patrício, L.; Fisk, R.P. Understanding Value Co-Creation in Complex Services with Many Actors. J. Serv. Manag. 2014, 25, 470–493. [Google Scholar] [CrossRef]
- Lusch, R.F.; Vargo, S.L.; Wessels, G. Toward a Conceptual Foundation for Service Science: Contributions from Service-Dominant Logic. IBM Syst. J. 2008, 47, 5–14. [Google Scholar] [CrossRef]
- Prahalad, C.K.; Ramaswamy, V. Co-Creation Experiences: The next Practice in Value Creation. J. Interact. Mark. 2004, 18, 5–14. [Google Scholar] [CrossRef]
- Jaakkola, E.; Alexander, M. The Role of Customer Engagement Behavior in Value Co-Creation: A Service System Perspective. J. Serv. Res. 2014, 17, 247–261. [Google Scholar] [CrossRef]
- Martínez-Cañas, R.; Ruiz-Palomino, P.; Linuesa-Langreo, J.; Blázquez-Resino, J.J. Consumer Participation in Co-Creation: An Enlightening Model of Causes and Effects Based on Ethical Values and Transcendent Motives. Front. Psychol. 2016, 7, 793. [Google Scholar] [CrossRef]
- Sun, Z.; Yearwood, J. (Eds.) Handbook of Research on Demand-Driven Web Services: Theory, Technologies, and Applications; Advances in Web Technologies and Engineering; IGI Global: Hershey, PA, USA, 2014; ISBN 978-1-4666-5884-4. [Google Scholar]
- Gillani, F.; Chatha, K.A.; Jajja, S.S.; Cao, D.; Ma, X. Unpacking Digital Transformation: Identifying Key Enablers, Transition Stages and Digital Archetypes. Technol. Forecast. Soc. Change 2024, 203, 123335. [Google Scholar] [CrossRef]
- Managing Digital Transformation: Understanding the Strategic Process, 1st ed.; Hinterhuber, A., Vescovi, T., Checchinato, F., Eds.; Routledge: Oxon, UK; New York, NY, USA, 2021; ISBN 978-1-003-00863-7. [Google Scholar]
- Chen, Y.; Li, J.; Zhang, J. Digitalisation, Data-Driven Dynamic Capabilities and Responsible Innovation: An Empirical Study of SMEs in China. Asia Pac. J. Manag. 2024, 41, 1211–1251. [Google Scholar] [CrossRef]
- Tao, F.; Cheng, J.; Qi, Q.; Zhang, M.; Zhang, H.; Sui, F. Digital Twin-Driven Product Design, Manufacturing and Service with Big Data. Int. J. Adv. Manuf. Technol. 2018, 94, 3563–3576. [Google Scholar] [CrossRef]
- Warner, K.S.R.; Wäger, M. Building Dynamic Capabilities for Digital Transformation: An Ongoing Process of Strategic Renewal. Long Range Plan. 2019, 52, 326–349. [Google Scholar] [CrossRef]
- Nambisan, S.; Lyytinen, K.; Majchrzak, A.; Song, M. Digital Innovation Management: Reinventing Innovation Management Research in a Digital World. MIS Q. 2017, 41, 223–238. [Google Scholar] [CrossRef]
- Anthony, B., Jr. Distributed Ledger and Decentralised Technology Adoption for Smart Digital Transition in Collaborative Enterprise. Enterp. Inf. Syst. 2023, 17, 1989494. [Google Scholar] [CrossRef]
- Karim, M.M.; Van, D.H.; Khan, S.; Qu, Q.; Kholodov, Y. AI Agents Meet Blockchain: A Survey on Secure and Scalable Collaboration for Multi-Agents. Future Internet 2025, 17, 57. [Google Scholar] [CrossRef]
- Barney, J. Firm Resources and Sustained Competitive Advantage. J. Manag. 1991, 17, 99–120. [Google Scholar] [CrossRef]
- Lusch, R.F.; Vargo, S.L. The Service-Dominant Logic of Marketing; Routledge: London, UK, 2014; ISBN 978-1-317-45464-9. [Google Scholar]
- Brynjolfsson, E.; Hitt, L.M. Beyond Computation: Information Technology, Organizational Transformation and Business Performance. J. Econ. Perspect. 2000, 14, 23–48. [Google Scholar] [CrossRef]
- Sun, Y.; Zhou, Y. Specialized Complementary Assets and Disruptive Innovation: Digital Capability and Ecosystem Embeddedness. Manag. Decis. 2024, 62, 3704–3730. [Google Scholar] [CrossRef]
- Hossain, M.E.; Tarafder, M.T.R.; Ahmed, N.; Al Noman, A.; Sarkar, M.I.; Hossain, Z. Integrating AI with Edge Computing and Cloud Services for Real-Time Data Processing and Decision Making. Int. J. Multidiscip. Sci. Arts 2023, 2, 252–261. [Google Scholar] [CrossRef]
- Li, L.; Tang, W.; Zhou, H.; Yang, S. Digitalization and Firm Performance: The Moderating Role of Top Management Team Attributes. IEEE Trans. Eng. Manag. 2024, 71, 6595–6605. [Google Scholar] [CrossRef]
- Zhang, X.; Li, Z. Research on the Impact of Corporate Green Transformation on Organizational Performance under ESG Strategy Orientation. Risk Financ. Manag. 2025, 6, 24. [Google Scholar] [CrossRef]
- Tsavdaridis, G.; Papaodysseus, C.; Karadimas, N.V.; Papazafeiropoulos, G.; Delis, A. Methodologies and Handling Techniques of Large-Scale Information in Decision Support Systems for Complex Missions. Appl. Sci. 2024, 14, 1995. [Google Scholar] [CrossRef]
- Hauke-Lopes, A.; Ratajczak-Mrozek, M.; Wieczerzycki, M. Value Co-Creation and Co-Destruction in the Digital Transformation of Highly Traditional Companies. J. Bus. Ind. Mark. 2023, 38, 1316–1331. [Google Scholar] [CrossRef]
- Adner, R. Ecosystem as Structure: An Actionable Construct for Strategy. J. Manag. 2017, 43, 39–58. [Google Scholar] [CrossRef]
- Zhao, Z.; Gao, G. The Impact of Digital Trade on China’s Position in the GVC: An Empirical Analysis Based on Sino-Russian Cross-Border Panel Data. Sustainability 2024, 16, 5493. [Google Scholar] [CrossRef]
- Wu, C.-H. A Dynamic Perspective of Government Intervention in a Competitive Closed-Loop Supply Chain. Eur. J. Oper. Res. 2021, 294, 122–137. [Google Scholar] [CrossRef]
- Yi, Y.; Li, Y.; Hitt, M.A.; Liu, Y.; Wei, Z. The Influence of Resource Bundling on the Speed of Strategic Change: Moderating Effects of Relational Capital. Asia Pac. J. Manag. 2016, 33, 435–467. [Google Scholar] [CrossRef]
- Ministry of Industry and Information Technology. Notice of the Ministry of Industry and Information Technology and Other Three Departments on Issuing the “Implementation Opinions on the Quality Excellence Project in Manufacturing”. 2023. Available online: https://www.gov.cn/zhengce/zhengceku/202312/content_6921503.htm (accessed on 12 May 2025).
- Hanna, N. A Role for the State in the Digital Age. J. Innov. Entrep. 2018, 7, 5. [Google Scholar] [CrossRef]
- Wang, Y.; Shi, J.; Qu, G. Research on Collaborative Innovation Cooperation Strategies of Manufacturing Digital Ecosystem from the Perspective of Multiple Stakeholders. Comput. Ind. Eng. 2024, 190, 110003. [Google Scholar] [CrossRef]
- Dimaggio, P.J.; Powell, W.W. Chapter 4 The Iron Cage Revisited: Institutional Isomorphism and Collective Rationality in Organizational Fields. In The New Economic Sociology; Dobbin, F., Ed.; Princeton University Press: Princeton, NJ, USA, 2004; pp. 111–134. ISBN 978-0-691-22927-0. [Google Scholar]
- Gereffi, G.; Humphrey, J.; Sturgeon, T. The Governance of Global Value Chains. Rev. Int. Political Econ. 2005, 12, 78–104. [Google Scholar] [CrossRef]
- Teece, D.J.; Pisano, G.; Shuen, A. Dynamic Capabilities and Strategic Management. Strat. Mgmt. J. 1997, 18, 509–533. [Google Scholar] [CrossRef]
- Brenner, B. Transformative Sustainable Business Models in the Light of the Digital Imperative—A Global Business Economics Perspective. Sustainability 2018, 10, 4428. [Google Scholar] [CrossRef]
- Leso, B.H.; Cortimiglia, M.N.; Ghezzi, A.; Minatogawa, V. Exploring Digital Transformation Capability via a Blended Perspective of Dynamic Capabilities and Digital Maturity: A Pattern Matching Approach. Rev. Manag. Sci. 2024, 18, 1149–1187. [Google Scholar] [CrossRef]
- Argote, L.; Ren, Y. Transactive Memory Systems: A Microfoundation of Dynamic Capabilities. J. Manag. Stud. 2012, 49, 1375–1382. [Google Scholar] [CrossRef]
- Lan, F.; Hou, L. Dynamic Capability Reconstruction of Digital Transformation for Emerging Market Enterprises: Learning from Chinese Experience. Int. J. Technol. Policy Manag. IJTPM 2021, 21, 231. [Google Scholar] [CrossRef]
- Chen, L. Enterprise Digital Transformation, Dynamic Capabilities and Innovation Performance. Front. Bus. Econ. Manag. 2023, 11, 327–332. [Google Scholar] [CrossRef]
- Chen, R.-S.; Sun, C.-M.; Helms, M.M.; Jih, W.-J. Aligning Information Technology and Business Strategy with a Dynamic Capabilities Perspective: A Longitudinal Study of a Taiwanese Semiconductor Company. Int. J. Inf. Manag. 2008, 28, 366–378. [Google Scholar] [CrossRef]
- Duchek, S. Organizational Resilience: A Capability-Based Conceptualization. Bus Res 2020, 13, 215–246. [Google Scholar] [CrossRef]
- Ghosh, S.; Hughes, M.; Hodgkinson, I.; Hughes, P. Digital Transformation of Industrial Businesses: A Dynamic Capability Approach. Technovation 2022, 113, 102414. [Google Scholar] [CrossRef]
- Onukwulu, E.C.; Odochi-Agho, M.; Eyo-Udo, N.L. Innovations in Supplier Evaluation: Frameworks and Techniques for Supply Chain Resilience. Int. J. Res. Sci. Innov. IJRSI 2025, 11, 610–623. [Google Scholar] [CrossRef]
- Sharma, J.; Singh, S.; Tyagi, M.; Powar, S. Avenues of Decarbonisation in the Dynamics of Processed Food Supply Chains: Towards Responsible Production Consumption. Heliyon 2024, 10, e26456. [Google Scholar] [CrossRef]
- Immadisetty, A. Real-Time Data Analytics in Customer Experience Management: A Framework for Digital Transformation and Business Intelligence. Int. J. Sci. Res. Comput. Sci. Eng. Inf. Technol. 2024, 10, 1280–1288. [Google Scholar] [CrossRef]
- Trim, P.R.J.; Lee, Y.-I. How B2B Marketers Interact with Customers and Develop Knowledge to Produce a Co-Owned Marketing Strategy. J. Bus. Ind. Mark. 2021, 36, 1943–1955. [Google Scholar] [CrossRef]
- Wu, Y.; Wang, J.; Li, C. Decisions of Supply Chain Considering Chain-to-Chain Competition and Service Negative Spillover Effect. Sustainability 2019, 11, 1612. [Google Scholar] [CrossRef]
- Leong, C.; Lin, S.; Tan, F.; Yu, J. Coordination in a Digital Platform Organization. Inf. Syst. Res. 2024, 35, 363–393. [Google Scholar] [CrossRef]
- Zhang, Z.; Qu, T.; Zhao, K.; Zhang, K.; Zhang, Y.; Guo, W.; Liu, L.; Chen, Z. Enhancing Trusted Synchronization in Open Production Logistics: A Platform Framework Integrating Blockchain and Digital Twin under Social Manufacturing. Adv. Eng. Inform. 2024, 61, 102404. [Google Scholar] [CrossRef]
- Ahmed, S. Enhancing Data Security and Transparency: The Role of Blockchain in Decentralized Systems. Int. J. Adv. Eng. Manag. Sci. 2025, 11, 167–176. [Google Scholar] [CrossRef]
- Linderson, S.; Eshetu Birkie, S.; Bellgran, M. The Issue of Corporate Mandatory Standards in Production Improvement Programmes. J. Ind. Eng. Manag. 2024, 17, 385. [Google Scholar] [CrossRef]
- Nizam Mohammad, M.F.; Abdullah, R.; Ab. Jabar, M.; Haizan Nor, R.N.; Mohd Nur, N. A Theoretical Framework of Knowledge Management Systems on Quality Management Systems. JOIV Int. J. Inform. Vis. 2024, 8, 2163. [Google Scholar] [CrossRef]
- Banker, R.D.; Bardhan, I.R.; Chang, H.; Lin, S. Plant Information Systems, Manufacturing Capabilities, and Plant Performance. MIS Q. 2006, 30, 315. [Google Scholar] [CrossRef]
- Mishra, D.P.; Kukreja, R.K.; Mishra, A.S. Blockchain as a Governance Mechanism for Tackling Dark Side Effects in Interorganizational Relationships. Int. J. Organ. Anal. 2022, 30, 340–364. [Google Scholar] [CrossRef]
- Panetto, H.; Zdravkovic, M.; Jardim-Goncalves, R.; Romero, D.; Cecil, J.; Mezgár, I. New Perspectives for the Future Interoperable Enterprise Systems. Comput. Ind. 2016, 79, 47–63. [Google Scholar] [CrossRef]
- Cepeda, G.; Vera, D. Dynamic Capabilities and Operational Capabilities: A Knowledge Management Perspective. J. Bus. Res. 2007, 60, 426–437. [Google Scholar] [CrossRef]
- Li, F.; Nucciarelli, A.; Roden, S.; Graham, G. How Smart Cities Transform Operations Models: A New Research Agenda for Operations Management in the Digital Economy. Prod. Plan. Control 2016, 27, 514–528. [Google Scholar] [CrossRef]
- Li, L.; Du, K.; Zhang, W.; Mao, J.Y. Empowering Digital Transformation: The Roles of Platforms. J. Inf. Technol. 2024, 39, 650–667. [Google Scholar] [CrossRef]
- Brynjolfsson, E.; McElheran, K. The Rapid Adoption of Data-Driven Decision-Making. Am. Econ. Rev. 2016, 106, 133–139. [Google Scholar] [CrossRef]
- Ochuba, N.A.; Amoo, O.O.; Okafor, E.S.; Akinrinola, O.; Usman, F.O. Strategies for Leveraging Big Data and Analytics for Business Development: A Comprehensive Review Across Sectors. Comput. Sci. IT Res. J. 2024, 5, 562–575. [Google Scholar] [CrossRef]
- Khedr, A.M.; Sheeja Rani, S. Enhancing Supply Chain Management with Deep Learning and Machine Learning Techniques: A Review. J. Open Innov. Technol. Mark. Complex. 2024, 10, 100379. [Google Scholar] [CrossRef]
- Roscoe, S.; Cousins, P.D.; Handfield, R. The Microfoundations of an Operational Capability in Digital Manufacturing. J. Oper. Manag. 2019, 65, 774–793. [Google Scholar] [CrossRef]
- Khoveyni, M.; Eslami, R. Two-Stage Network DEA with Shared Resources: Illustrating the Drawbacks and Measuring the Overall Efficiency. Knowl.-Based Syst. 2022, 250, 108725. [Google Scholar] [CrossRef]
- Castelli, L.; Pesenti, R.; Ukovich, W. A Classification of DEA Models When the Internal Structure of the Decision Making Units Is Considered. Ann. Oper. Res. 2010, 173, 207–235. [Google Scholar] [CrossRef]
- Eisenhardt, K.M. Making Fast Strategic Decisions in High-Velocity Environments. Acad. Manag. J. 1989, 32, 543–576. [Google Scholar] [CrossRef]
- Garcia-Castro, R.; Francoeur, C. When More Is Not Better: Complementarities, Costs and Contingencies in Stakeholder Management: Complementarities, Costs, Contingencies in Stakeholder Management. Strat. Mgmt. J. 2016, 37, 406–424. [Google Scholar] [CrossRef]
- Baumgartner, M.; Thiem, A. Often Trusted but Never (Properly) Tested: Evaluating Qualitative Comparative Analysis. Sociol. Methods Res. 2020, 49, 279–311. [Google Scholar] [CrossRef]
- Castro, R.G.; Ariño, M.A. A General Approach to Panel Data Set-Theoretic Research. J. Adv. Manag. Sci. Inf. Syst. 2016, 2, 63–76. [Google Scholar] [CrossRef]
- Cao, Y.; Peng, X.; Prybutok, V. Achieving Sustainable Excellence: A Theoretical Comparison of Established Quality Awards. Qual. Manag. J. 2024, 31, 138–153. [Google Scholar] [CrossRef]
- Abbas, J.; Kumari, K. Examining the Relationship between Total Quality Management and Knowledge Management and Their Impact on Organizational Performance: A Dimensional Analysis. J. Econ. Adm. Sci. 2023, 39, 426–451. [Google Scholar] [CrossRef]
- Zhu, H. The Role of Digital Transformation in Supply Chain Efficiency and Economic Output. Environ. Sci. Pollut. Res. 2023, 31, 3656–3668. [Google Scholar] [CrossRef]
- White, R.E.; Cooper, K. Grounded Theory. In Qualitative Research in the Post-Modern Era; Springer International Publishing: Cham, Switzerland, 2022; pp. 339–385. ISBN 978-3-030-85126-2. [Google Scholar]
- Yu, J.; Xu, Y.; Zhou, J.; Chen, W. Digital Transformation, Total Factor Productivity, and Firm Innovation Investment. J. Innov. Knowl. 2024, 9, 100487. [Google Scholar] [CrossRef]
- Bazimya, S.; Erorita, S.M. Analyzing the Financial Performance of Manufacturing Firms: A Focus on Return on Equity, Return on Assets and Return on Sales. Int. J. Humanit. Soc. Stud. 2024, 12. [Google Scholar] [CrossRef]
- Eisenhardt, K.M. Building Theories from Case Study Research. Acad. Manag. Rev. 1989, 14, 532. [Google Scholar] [CrossRef]
- Vargo, S.L.; Lusch, R.F. Institutions and Axioms: An Extension and Update of Service-Dominant Logic. J. Acad. Mark. Sci. 2016, 44, 5–23. [Google Scholar] [CrossRef]
- Nyberg, A.J.; Moliterno, T.P.; Hale, D.; Lepak, D.P. Resource-Based Perspectives on Unit-Level Human Capital: A Review and Integration. J. Manag. 2014, 40, 316–346. [Google Scholar] [CrossRef]
- Liu, M.; Hua, D. Enhancing Resource Allocation Efficiency: The Impact of Servitization in China’s Manufacturing Sector. Ind. Mark. Manag. 2024, 121, 160–178. [Google Scholar] [CrossRef]
- Bhandari, A.; Javakhadze, D. Corporate Social Responsibility and Capital Allocation Efficiency. J. Corp. Financ. 2017, 43, 354–377. [Google Scholar] [CrossRef]
- Kun, Á.; Dieckmann, U. Resource Heterogeneity Can Facilitate Cooperation. Nat. Commun. 2013, 4, 2453. [Google Scholar] [CrossRef]
- Kamoche, K. The Integration–Differentiation Puzzle: A Resource-Capability Perspective in International Human Resource Management. Int. J. Hum. Resour. Manag. 1996, 7, 230–244. [Google Scholar] [CrossRef]
- Rosak-Szyrocka, J.; Żywiołek, J.; Shahbaz, M. (Eds.) Quality Management, Value Creation, and the Digital Economy; Taylor & Francis: Abingdon, UK, 2023. [Google Scholar]
- Kim, D.; Kumar, V.; Kumar, U. Relationship between Quality Management Practices and Innovation. J. Oper. Manag. 2012, 30, 295–315. [Google Scholar] [CrossRef]
- Afrifa, G.A.; Tingbani, I.; Adesina, O.O. Stochastic Frontier Modelling of Working Capital Efficiency across Europe. Technol. Forecast. Soc. Change 2022, 184, 122012. [Google Scholar] [CrossRef]
- Paulraj, A. Understanding the Relationships Between Internal Resources and Capabilities, Sustainable Supply Management and Organizational Sustainability: Antecedents, Sustainable Supply Management, and Sustainability Performance. J. Supply Chain. Manag. 2011, 47, 19–37. [Google Scholar] [CrossRef]
- Berchicci, L. Towards an Open R&D System: Internal R&D Investment, External Knowledge Acquisition and Innovative Performance. Res. Policy 2013, 42, 117–127. [Google Scholar] [CrossRef]
- Lentjušenkova, O.; Lapiņa, I. An Integrated Process-Based Approach to Intellectual Capital Management. Bus. Process Manag. J. 2020, 26, 1833–1850. [Google Scholar] [CrossRef]
- Hofmann, E.; Kotzab, H. A Supply Chain-Oriented Approach of Working Capital Management. J. Bus. Logist. 2010, 31, 305–330. [Google Scholar] [CrossRef]
- Ajao, S.; Small, S. Liquidity management and corporate profitability: Case study of selected manufacturing companies listed on the Nigerian stock exchange. Bus. Manag. Dyn. 2012, 2, 10–25. [Google Scholar]
- Ruyken, P.T.G.; Wagner, S.M.; Jonke, R. What Is the Right Cash Conversion Cycle for Your Supply Chain? Int. J. Serv. Oper. Manag. IJSOM 2011, 10, 13. [Google Scholar] [CrossRef]
- Flynn, B.B.; Huo, B.; Zhao, X. The Impact of Supply Chain Integration on Performance: A Contingency and Configuration Approach. J. Oper. Manag. 2010, 28, 58–71. [Google Scholar] [CrossRef]
- Yu, W.; Jacobs, M.A.; Salisbury, W.D.; Enns, H. The Effects of Supply Chain Integration on Customer Satisfaction and Financial Performance: An Organizational Learning Perspective. Int. J. Prod. Econ. 2013, 146, 346–358. [Google Scholar] [CrossRef]
- Lii, P.; Kuo, F.-I. Innovation-Oriented Supply Chain Integration for Combined Competitiveness and Firm Performance. Int. J. Prod. Econ. 2016, 174, 142–155. [Google Scholar] [CrossRef]
- Zhao, X.; Huo, B.; Selen, W.; Yeung, J.H.Y. The Impact of Internal Integration and Relationship Commitment on External Integration. J. Oper. Manag. 2011, 29, 17–32. [Google Scholar] [CrossRef]
- Adomako, S.; Amankwah-Amoah, J.; Tarba, S.Y.; Khan, Z. Perceived Corruption, Business Process Digitization, and SMEs’ Degree of Internationalization in Sub-Saharan Africa. J. Bus. Res. 2021, 123, 196–207. [Google Scholar] [CrossRef]
- Fiss, P.C. Building Better Causal Theories: A Fuzzy Set Approach to Typologies in Organization Research. Acad. Manag. J. 2011, 54, 393–420. [Google Scholar] [CrossRef]
- Ragin, C.C. Redesigning Social Inquiry: Fuzzy Sets and Beyond; University of Chicago Press: Chicago, IL, USA, 2008. [Google Scholar]
- Teece, D.J. Hand in Glove: Open Innovation and the Dynamic Capabilities Framework. Strateg. Manag. Rev. 2020, 1, 233–253. [Google Scholar] [CrossRef]
- Schuhmacher, A.; Hinder, M.; Von Stegmann Und Stein, A.; Hartl, D.; Gassmann, O. Analysis of Pharma R&D Productivity—A New Perspective Needed. Drug Discov. Today 2023, 28, 103726. [Google Scholar] [CrossRef]
- Von Zedtwitz, M.; Gassmann, O.; Boutellier, R. Organizing Global R&D: Challenges and Dilemmas. J. Int. Manag. 2004, 10, 21–49. [Google Scholar] [CrossRef]
- Sun, J.; Rosli, A.B.; Daud, A. Operational Efficiency of Pharmaceutical Companies in China: Based on Three-Stage DEA with Undesirable Outputs. Sustainability 2024, 17, 207. [Google Scholar] [CrossRef]
- Electronic Technology Information Research Institute of MMIT Home Page. Available online: https://www.cics-cert.org.cn/web_root/webpage/articlecontent_101006_1893941892177989634.html (accessed on 9 May 2025).
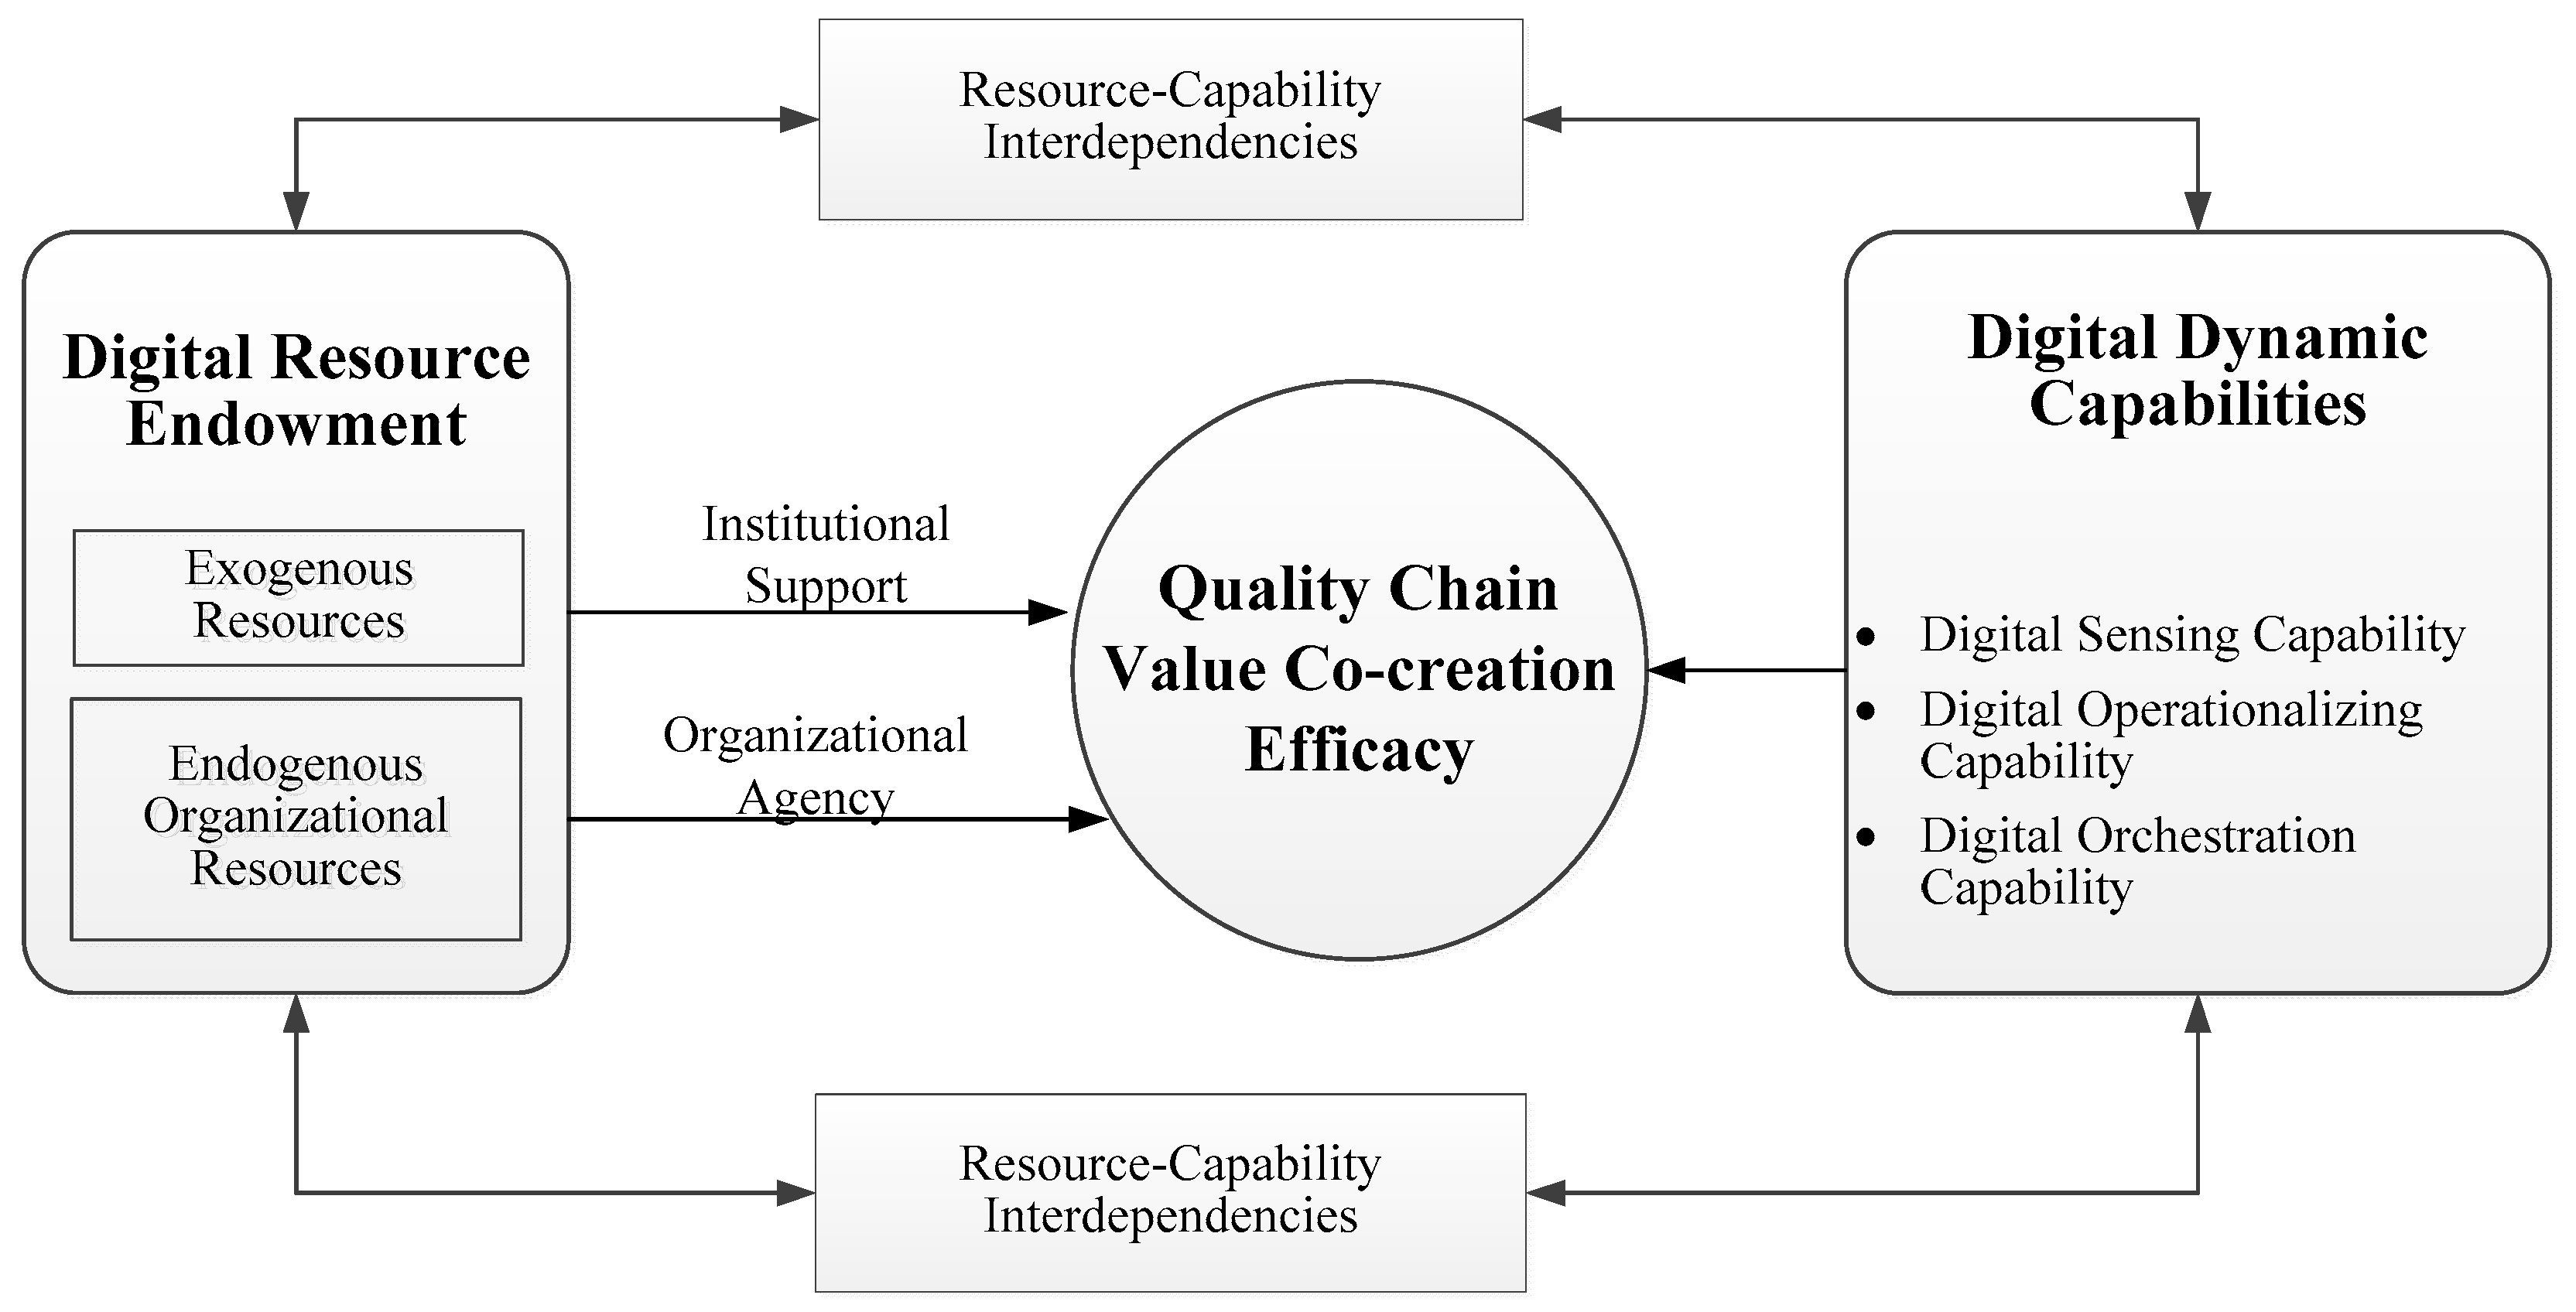
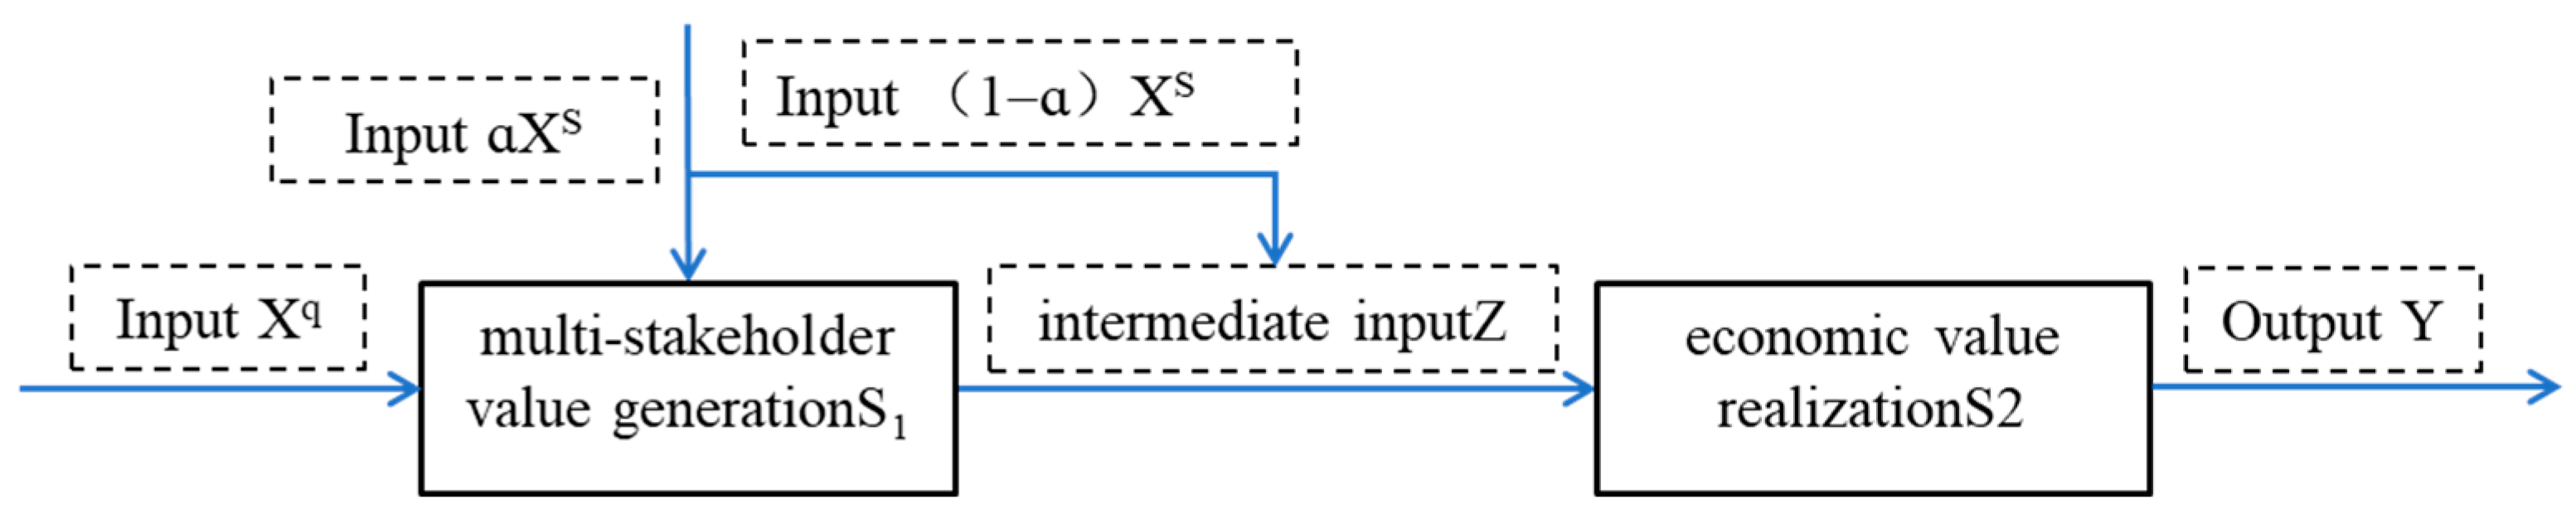
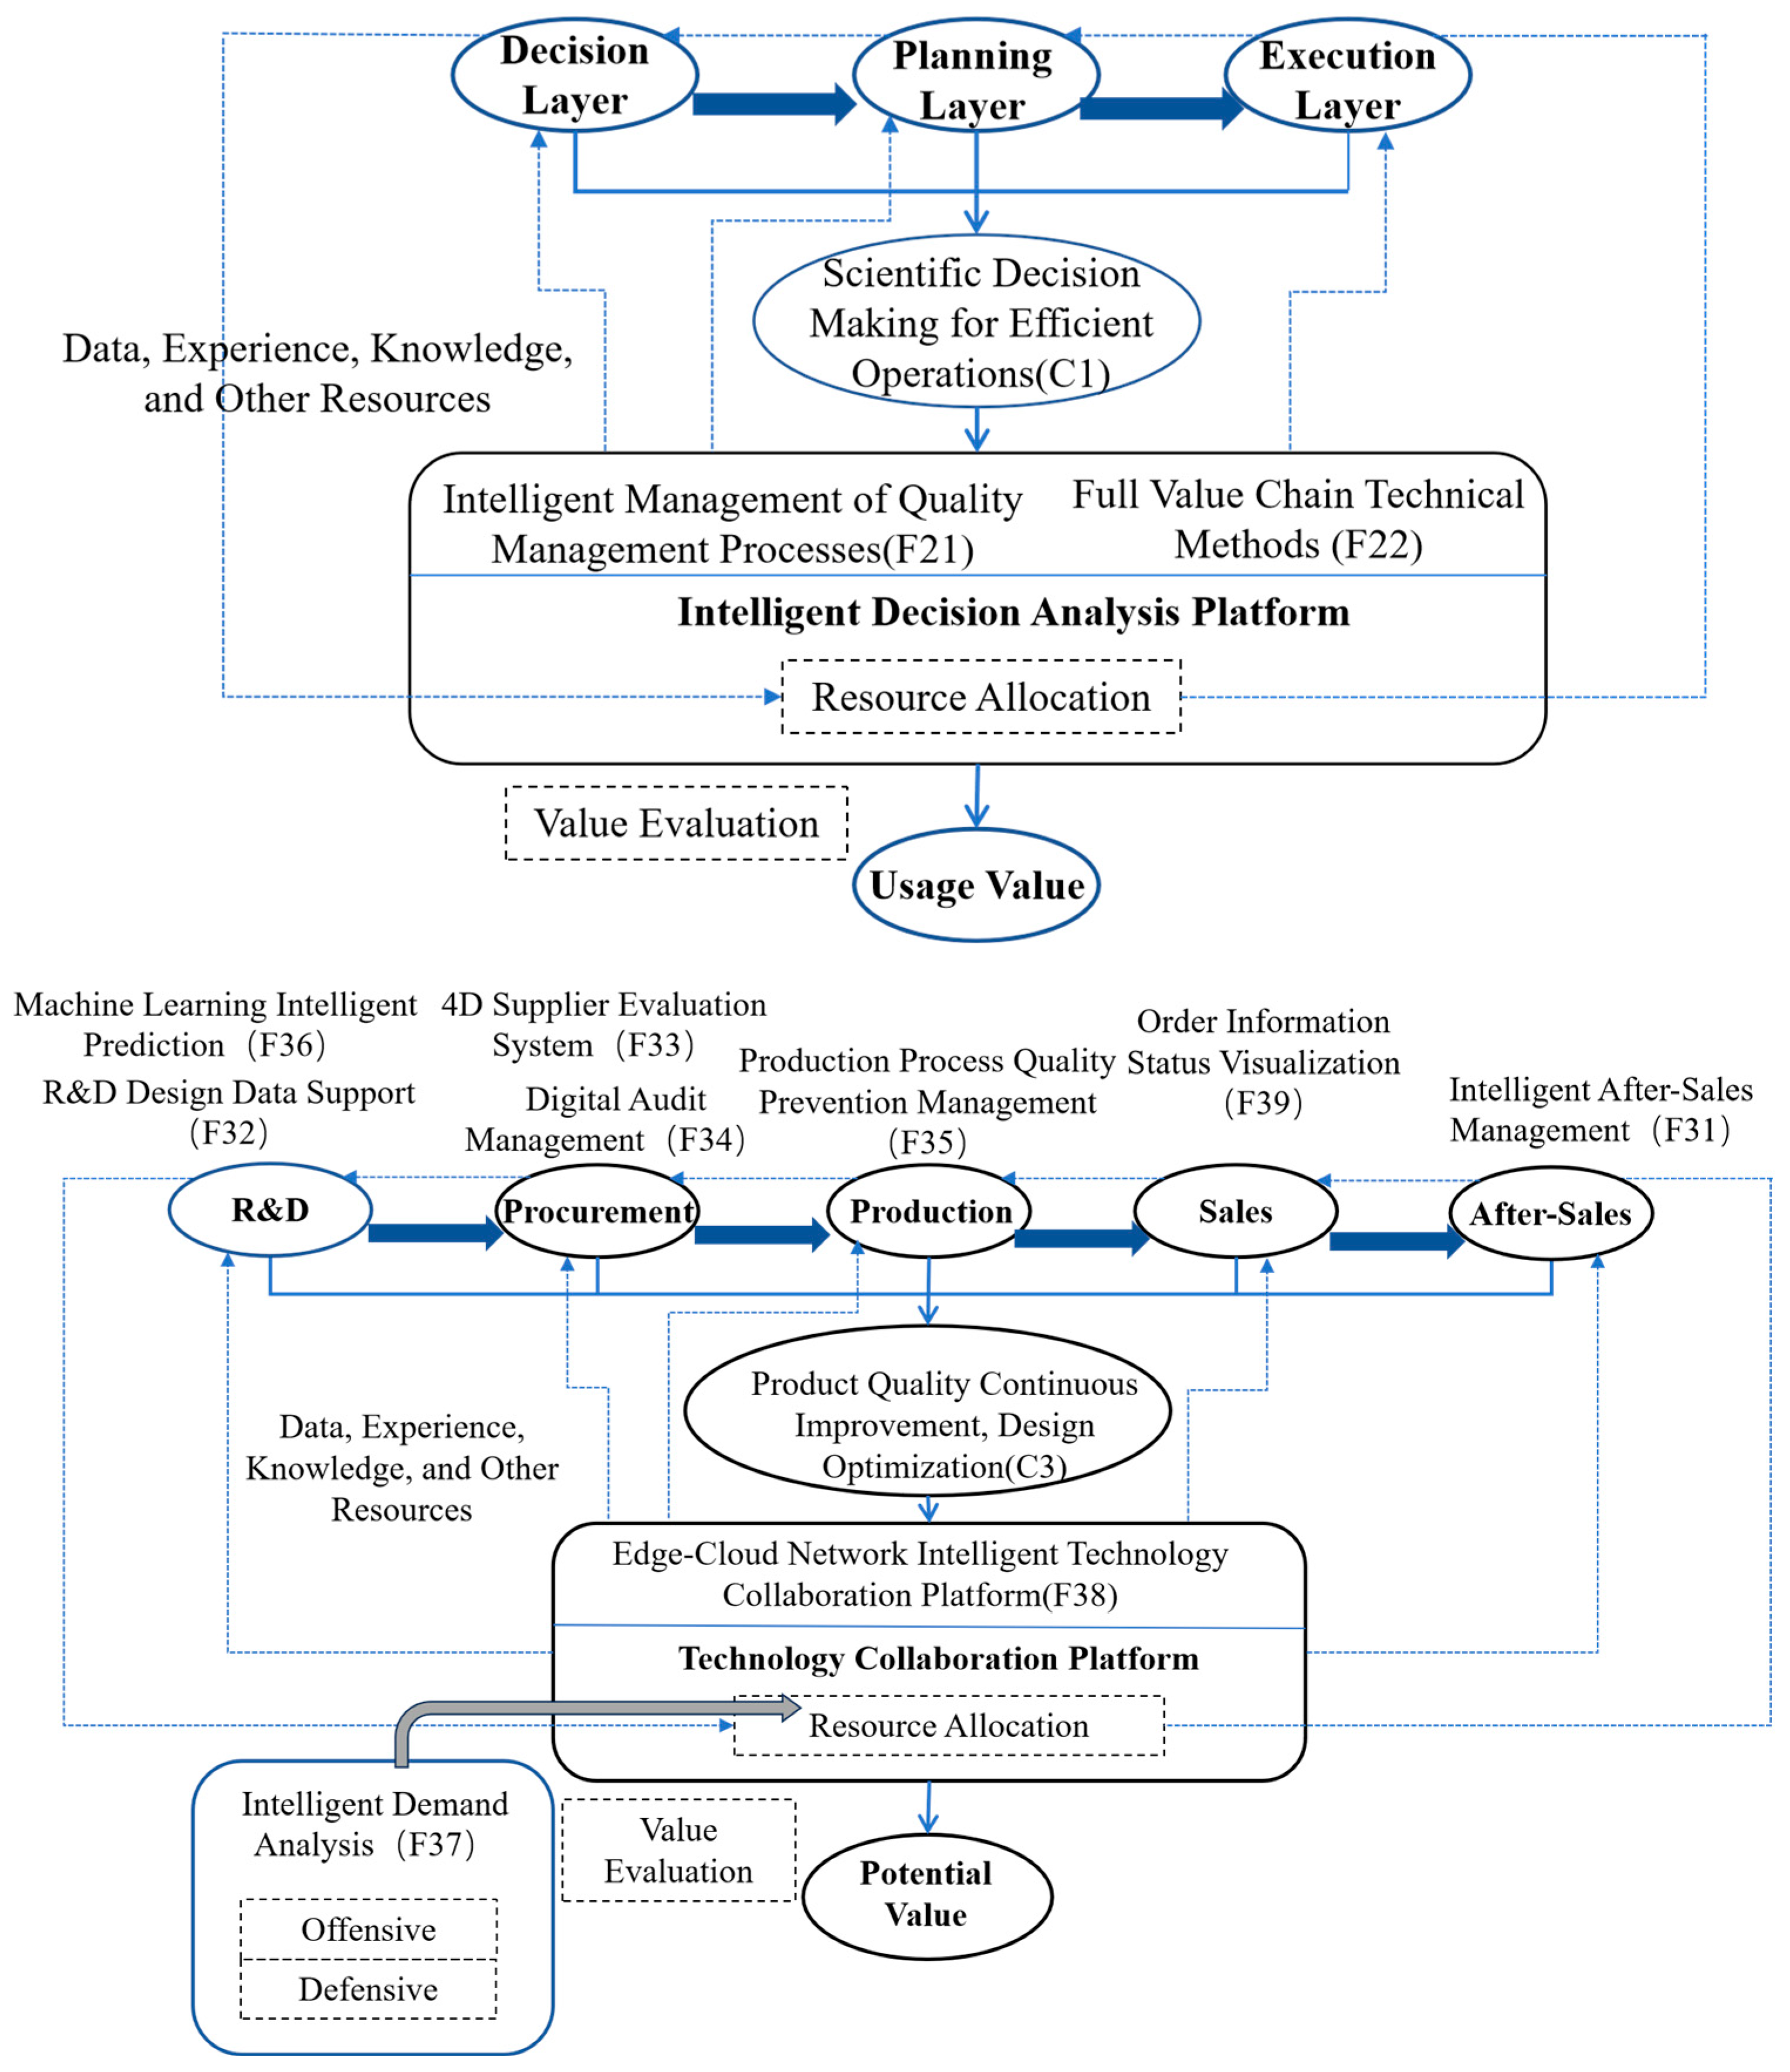
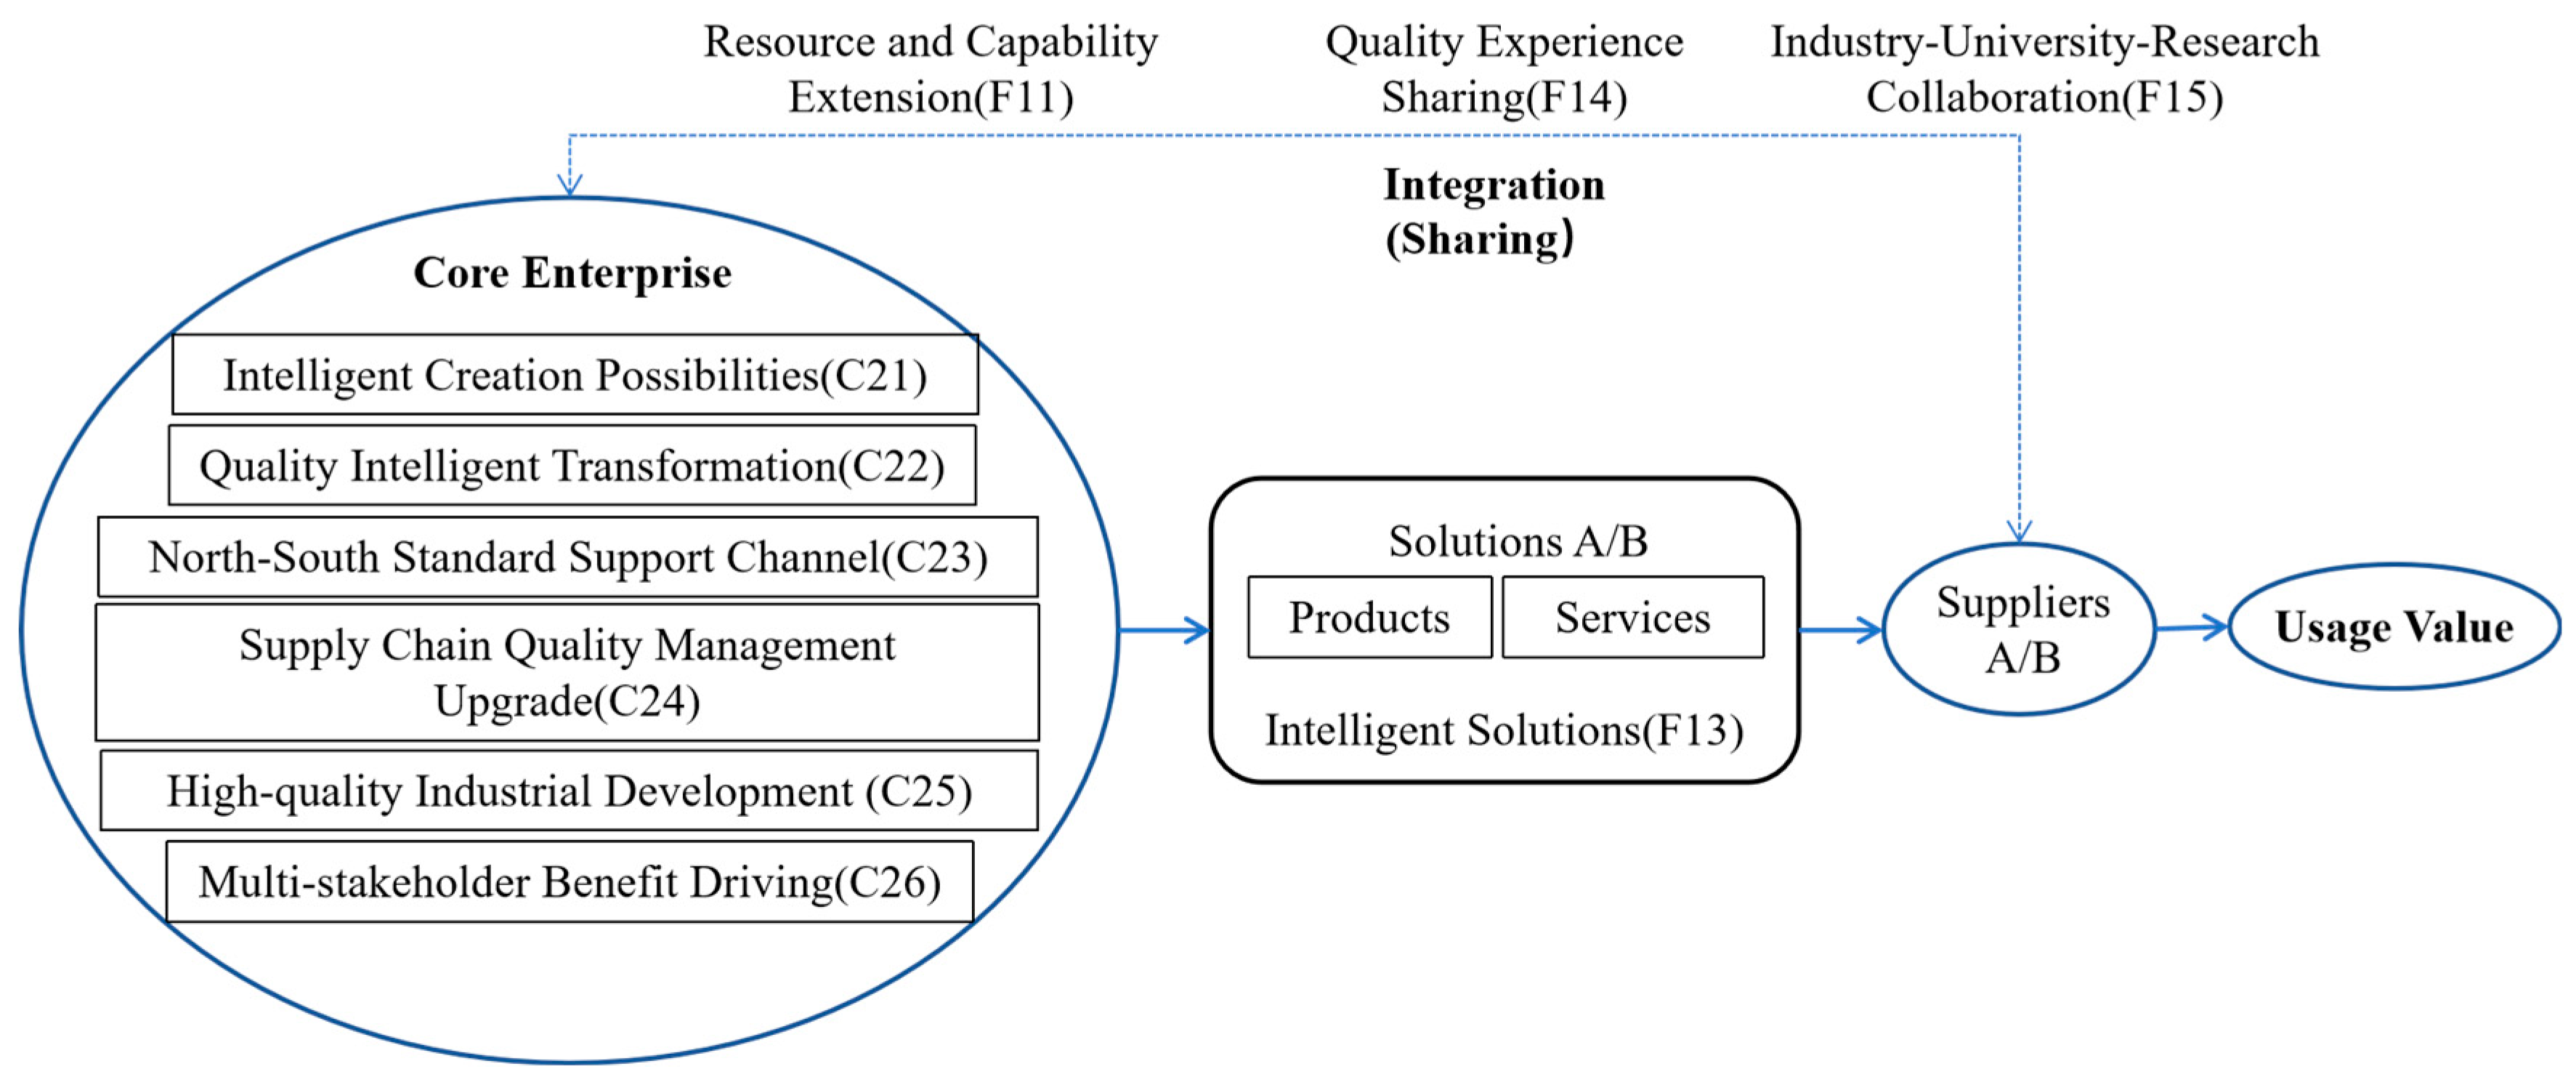
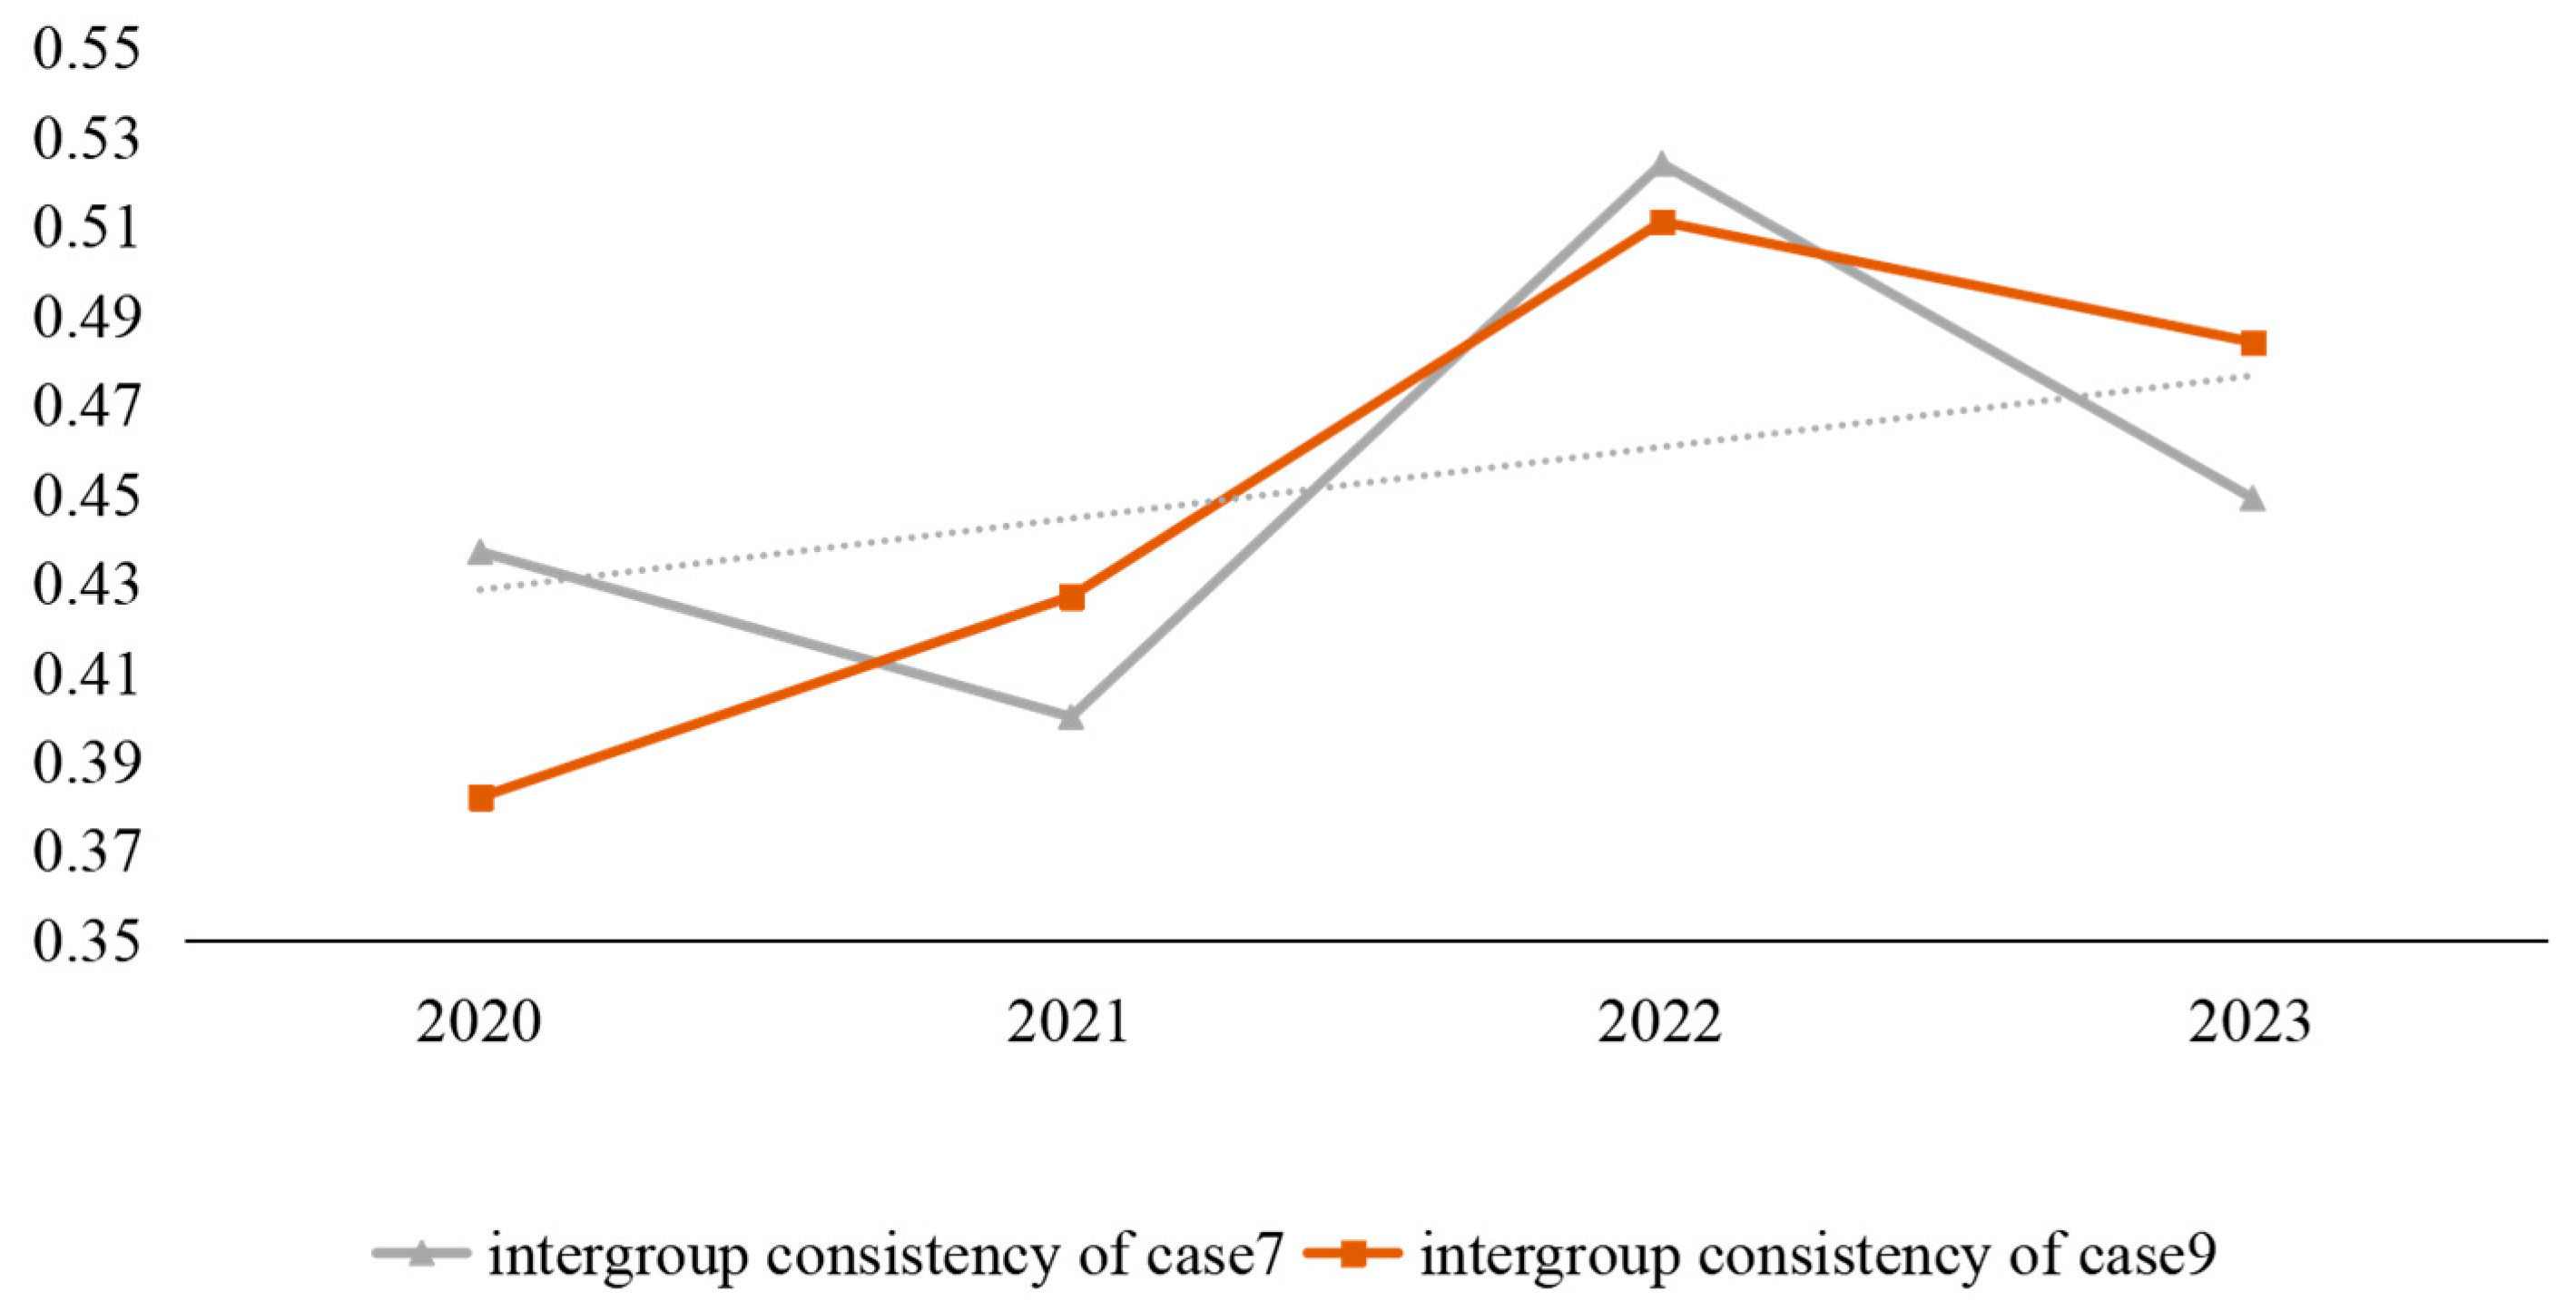
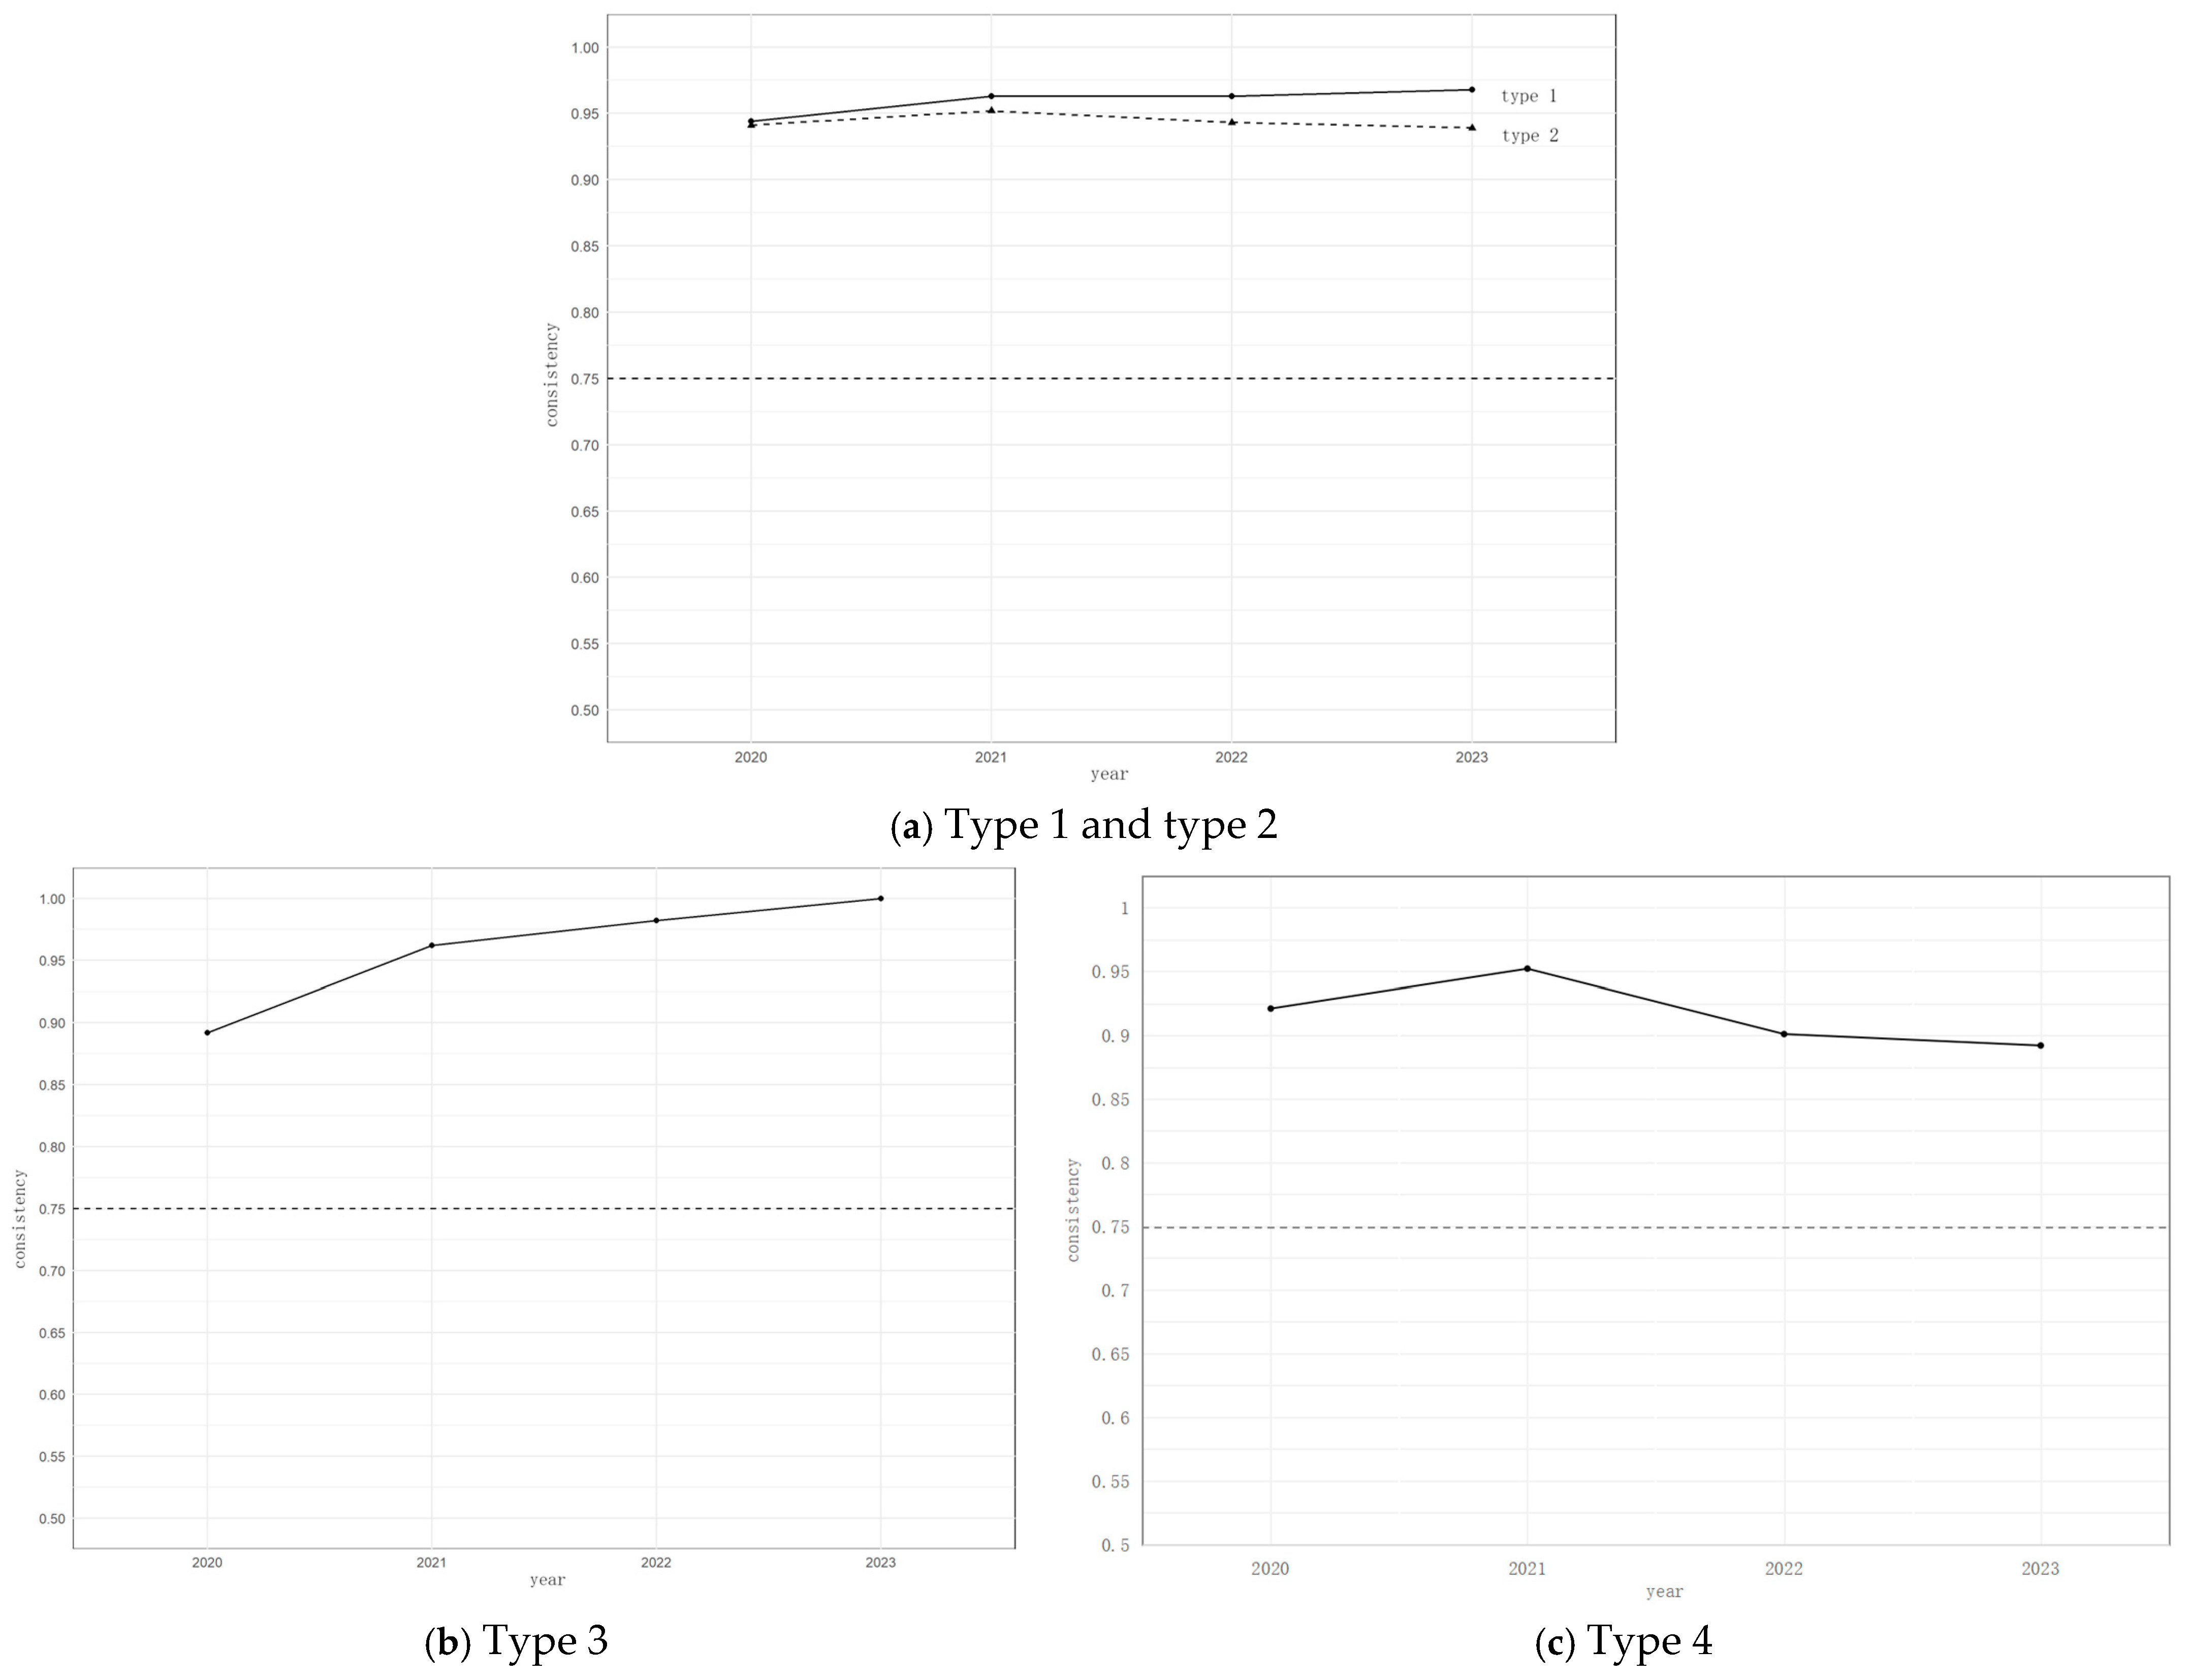
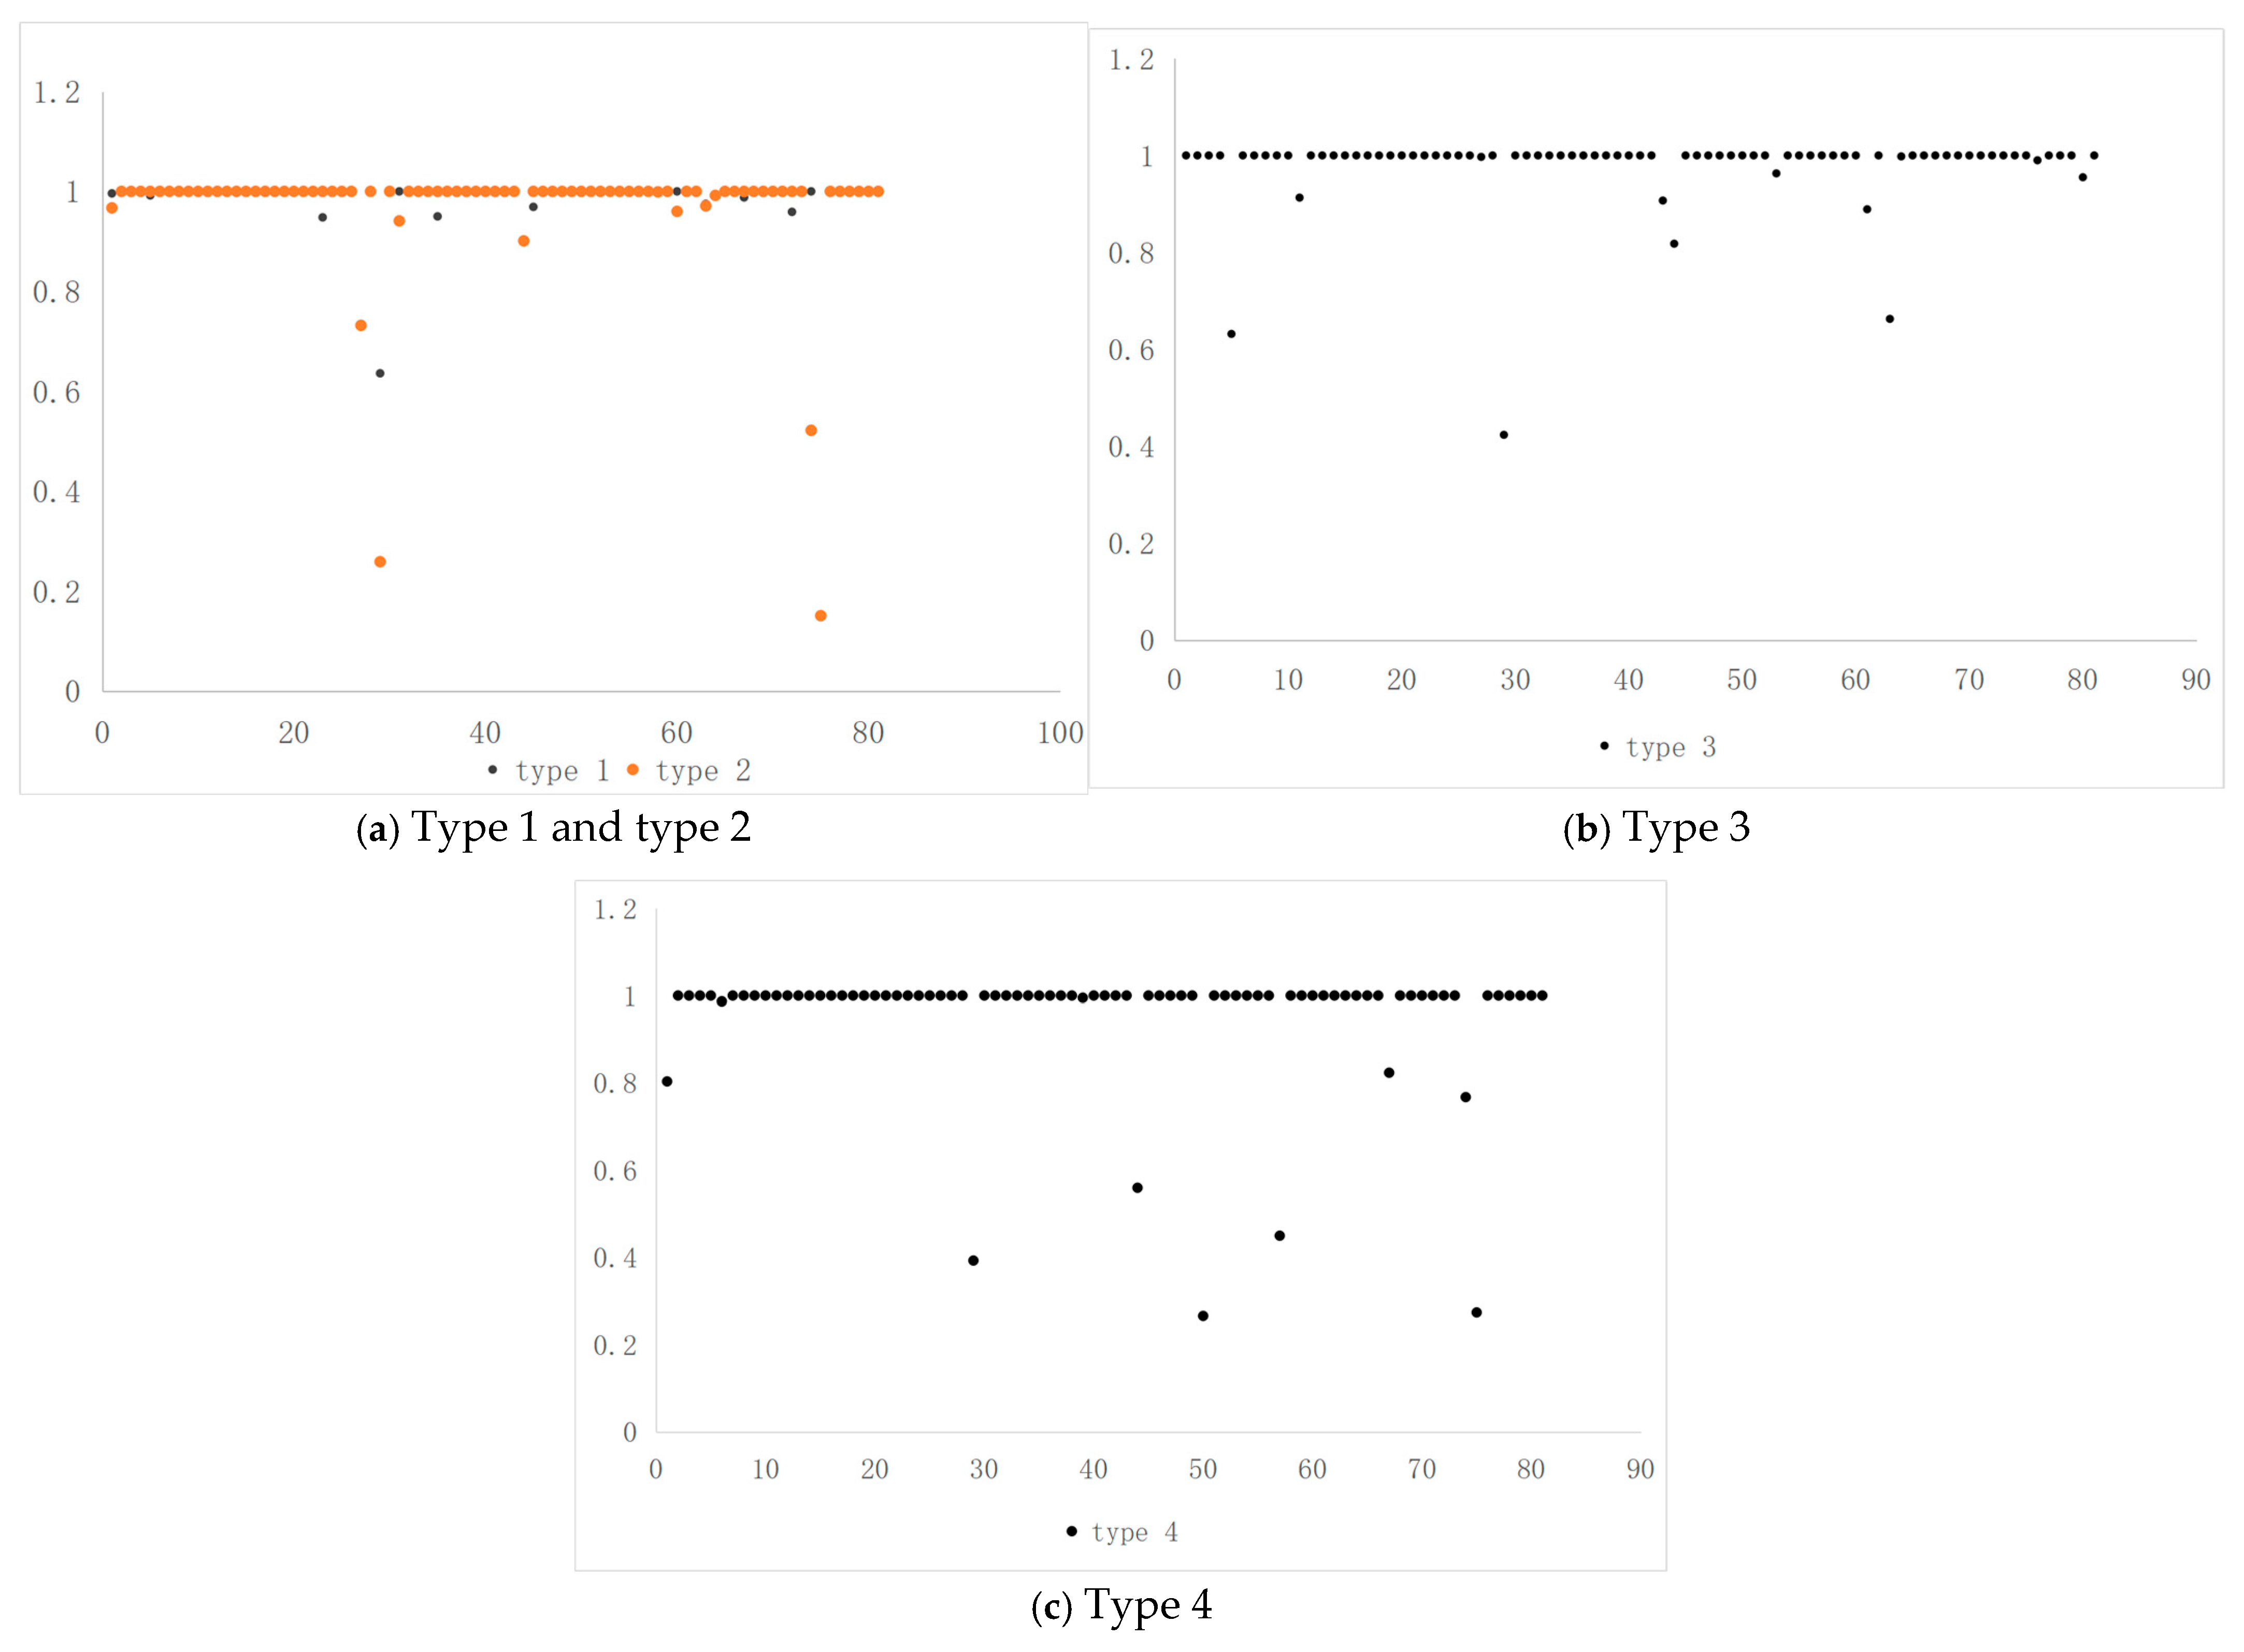
Disclaimer/Publisher’s Note: The statements, opinions and data contained in all publications are solely those of the individual author(s) and contributor(s) and not of MDPI and/or the editor(s). MDPI and/or the editor(s) disclaim responsibility for any injury to people or property resulting from any ideas, methods, instructions or products referred to in the content. |
© 2025 by the authors. Licensee MDPI, Basel, Switzerland. This article is an open access article distributed under the terms and conditions of the Creative Commons Attribution (CC BY) license (https://creativecommons.org/licenses/by/4.0/).