Abstract
This study examines the impacts of industrial wastewater from the Uttara Export Processing Zone (UEPZ) on natural resources, agriculture, and the health of nearby communities in Nilphamari, Bangladesh. Using a quantitative, self-report approach, data were collected from 162 households across four villages in Nilphamari Sadar Upazila, selected based on proximity to the UEPZ. Findings reveal significant environmental degradation: almost all (96%) respondents reported that water in nearby rivers and ponds has changed color and is odorous, unpleasant to taste, and contaminated, harming aquatic biodiversity. Agricultural productivity has declined, with 67 percent of respondents experiencing reduced crop yields, increased crop diseases, and rising cultivation costs due to greater dependence on fertilizers and pesticides. Also, 96 percent of respondents reported that the fish population diminished, reducing alternative income sources. Health impacts were pronounced; 69 percent of the respondents experienced water pollution-related complications, including skin, respiratory, gastrointestinal, and eye problems. Perceptions of wastewater health risks were strongly aligned with reported illnesses. Binary logistic regression further indicated a positive association between degraded crop health and human health problems. The study concludes that UEPZ’s wastewater disposal negatively affects natural resources, agriculture, and public health, underscoring the need for improved waste management and mitigation to protect affected communities.
1. Introduction
The government of Bangladesh promotes rapid industrial development to alleviate pressure on agricultural lands, increase export revenue, and create employment opportunities for its growing population. The country rapidly increased its industrialization following independence in 1971, primarily due to the growth of the Readymade Garments Industries. The industrial sector grew, accounting for 34.81 percent of the total Gross Domestic Product (GDP) in 2024 [1]. As Bangladesh transitions from agriculture to industrialization and urbanization, concerns about pollution and environmental damage are rising [2]. While the pace of industrialization has brought considerable economic benefits, it has also posed serious environmental challenges, particularly in densely populated areas where industrial zones are situated near residential and agricultural lands [3].
The disposal of industrial wastewater is one of the most important environmental problems. Many industries, such as steel manufacturing, electroplating, small-scale production, textile, dye casting, and food processing, discharge their effluents directly to nearby water bodies without any treatment. The textile industry is one of the major polluting industries that contributes to water pollution. Many industries do not install appropriate treatment facilities to treat wastewater. Though the Department of Environment (DoE) made the rule compulsory to implement effluent treatment plants (ETPs) to receive clearance, smaller industries cannot afford high-quality ETPs. Many of the big and medium-sized industries do not implement ETPs to maximize profit through curtailing production costs. Alarmingly, among Bangladesh’s eight Export Processing Zones (EPZs), only three—located in Dhaka, Chittagong, and Comilla—utilize centralized effluent treatment facilities. Consequently, a huge amount of untreated waste and water is released into rivers and water bodies every day.
The establishment of EPZs in Bangladesh has been a strategic initiative to promote economic growth through export-oriented industrialization [3]. The Uttara Export Processing Zone (UEPZ) in Nilphamari exemplifies this approach among the total eight EPZs in the country. The UEPZ contributes to the nation’s economy by creating employment opportunities and generating foreign exchange. However, despite these economic advantages, the environmental footprint, specifically the management of industrial wastewater disposal, has raised serious concerns. Various industries, including garments, plastics, textiles, footwear, electronics, and leather, release a substantial number of effluents, solid waste, and sewage sludges. These waste materials often contain pollutants such as toxic organic compounds, heavy metals, and other harmful substances, which degrade soil health, water quality, and ecosystem stability [4].
The Uttara EPZ in the Nilphamari district of Bangladesh is the seventh of the country’s eight export processing zones and the only one located in northern Bangladesh. Established in September 2001, it sits at coordinates 88°51′50″ E and 25°51′29″ N. The EPZ employs approximately 30,000 people, the majority of whom are women. There are over 190 industrial plots within the zone; 138 plots have been allocated, 12 are currently operational, 33 are under development, and 9 remain unoccupied. Presently, 22 industries are active in the Uttara EPZ, some equipped with wastewater treatment facilities [5]. The industries dispose of a huge amount of untreated waste materials and untreated water directly into nearby ponds and agricultural fields, which leads to severe water and soil contamination. This contamination alters the environment’s physical, chemical, and biological properties, adversely affecting public health, agriculture, and overall community well-being [6]. Residents in the surrounding areas suffer from various waterborne diseases, such as mucous membrane disorders, dermatitis, and severe respiratory irritation. Additionally, long-term health issues like cancer, reproductive problems, and gastrointestinal diseases are on the rise due to continuous exposure to polluted water [7].
Agriculture serves as the primary source of livelihood for the surrounding inhabitants, and this sector is especially vulnerable to pollution-induced soil and water degradation. The crop yields have declined, and the cultivation cost has increased [8]. Moreover, pollution further disrupts the ecological balance and community livelihoods by posing a threat to livestock, wildlife, and aquatic species [9].
Although several studies have examined either the financial advantages or the environmental costs of Export Processing Zones (EPZs) in Bangladesh, few have offered an integrated assessment of how industrial wastewater disposal simultaneously affects natural resources, agricultural livelihoods, and public health at the community level [6,10,11,12]. The Uttara EPZ provides a critical and understudied case because it is the only EPZ in northern Bangladesh, situated near rural, agriculture-dependent communities that are especially vulnerable to pollution-induced degradation—making it a unique site to explore the compounded socio-environmental impacts of industrialization. This study aims to bridge this gap by exploring the holistic impact of industrial wastewater disposal from UEPZ on natural resources, agriculture, the economy, and community health. The research is designed to contribute to the evolution of policy by providing a more holistic view of these converging effects, as well as encouraging the adoption of environmentally friendly industrial practices that would be beneficial for both the environment and the affected populations. Moreover, the results of this study will help enrich the current academic discourse on industrial pollution, environmental health, and sustainable development and, therefore, will be useful as a foundation for future research.
This study directly aligns with several United Nations Sustainable Development Goals (SDGs). By examining the intersections of industrial growth, environmental degradation, and community well-being, it advances the objectives of SDG 3 (Good Health and Well-being), SDG 6 (Clean Water and Sanitation), SDG 8 (Decent Work and Economic Growth), SDG 12 (Responsible Consumption and Production), and SDG 15 (Life on Land). This research contributes to the discourse of sustainable development and supports evidence-based policymaking for environmental and social protection.
As shown in Figure 1, this study used a conceptual framework presenting the interconnected impacts of industrial untreated wastewater disposal of UEPZ on natural resources, agriculture, health, environment, and community livelihoods. Rooted in theories of environmental degradation and socio-economic vulnerability, this framework portrays the industrial wastewater’s cascading effects [13,14].
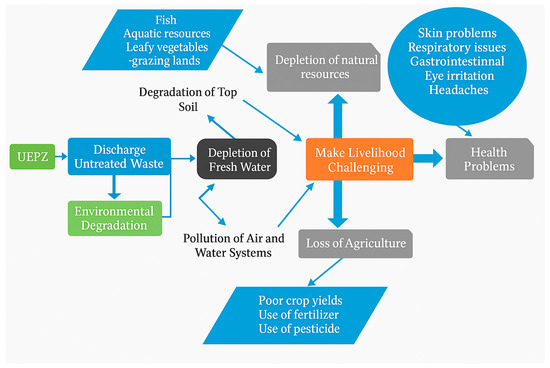
Figure 1.
Conceptual framework of the study developed by the authors.
The discharged untreated wastewater is the central cause of water pollution, which disrupts ecosystems and natural resources. Environmental degradation due to the absence of an effective waste management system is a recurring global issue in industrial zones [15]. This degradation affects essential resources such as irrigation systems, cultivable lands, drinking water, and air quality. Degraded water and soil quality cause loss of biodiversity and resource depletion, and reduce environmental resilience, which severely affects local livelihoods. The loss of fish stocks, grazing lands, and leafy vegetables destabilizes the food security and economic stability of a society [16]. The soil and water contamination leads to a decline in agricultural productivity; farmers rely on fertilizers and pesticides, which further degrade soil quality and increase costs [17].
Polluted air, water, and soil contribute to numerous health problems, including respiratory problems, skin disorders, eye irritation, and gastrointestinal issues. These health burdens reduce the quality of life and limit economic productivity. Consequently, the agricultural decline, resource depletion, and health problems destabilize household economies, which leads to socioeconomic vulnerability. As [18] mentioned there is also a negative impact of industrial pollution on social inequality.
Through an integrated analysis of these dimensions, the research aims to clarify the environmental and socio-economic challenges posed by industrial wastewater and support the formulation of sustainable policies. The research is driven by the following overarching question: What are the impacts of industrial wastewater disposal on the livelihoods of UEPZ residents? Specifically, the study examined (1) the effects of industrial wastewater on the natural resources around UEPZ; (2) its impact on agricultural practices; and (3) the consequences for community health.
2. Materials and Methods
2.1. Study Field
The study was conducted in the Sonaray and Songolsi unions of Sadar Upazila, Nilphamari District, Bangladesh, as shown in Figure 2. These two unions were selected due to their proximity to the Uttara Export Processing Zone (UEPZ). Specifically, the villages of Araji Kukapara and Ulotpara from the Sonaray Union, as well as Keranipara and Kadamtoli from the Songolsi Union, were chosen for their proximity to the UEPZ, making them ideal locations for examining the study’s focus on wastewater impacts. The geographic center is approximately at 25.97° N, 88.91° E.
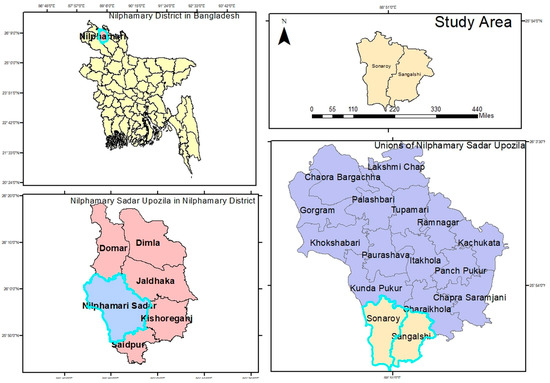
Figure 2.
Study area (source: author’s mapping by using ArcGIS software, version 10.7.1). (The exact study area is outlined using and colored differently than the rest of the regions).
The study area lies within the Teesta River Basin, and the surrounding geography falls in the Lower Gangetic Plains alluvial zone, characterized by fluvial-deposited soils that dominate about 80 percent of Bangladesh’s terrain [19]. Industrial effluents from the UEPZ primarily enter the local hydrological system via the Soromongola waterbody, eventually draining into the Khora River and smaller channels like Khorkhoria Khal, increasing the risk of contamination. The region experiences a humid tropical monsoon climate, with a mean annual temperature of approximately 25.7 °C, and seasonal lows around 12.3 °C (January) to highs near 32 °C (June) [20]. Annual precipitation averages 2200 mm, typical of Bangladesh’s lowland floodplain regions [20]. The area was historically part of the Lower Gangetic Plains moist deciduous forest ecoregion, which was once covered by semi-evergreen and moist broadleaf forest, now largely replaced by agricultural land such as rice paddies and homestead agroforestry [21].
The selected villages are directly affected by UEPZ wastewater discharges through local water channels. A high dependence on agriculture, reliance on surface water, and proximity to industrial operations make this region particularly suitable for assessing environmental, agricultural, and public health impacts related to industrial wastewater contamination.
2.2. Research Approach
The study employed a quantitative research approach. This approach is appropriate for measuring relationships between variables and analyzing data numerically [22]. The study used structured and semi-structured, paper-based survey questionnaires as the primary instrument for data collection. The household heads served as respondents; households were selected as the unit of analysis. Trained interviewers from sociology backgrounds administered the face-to-face interview using an English-written structured questionnaire. This method aligns with best practices in survey-based research as trained interviewers help to ensure consistency in responses and mitigate potential misinterpretation by respondents [23]. The data collectors recorded the answers directly onto the survey forms after eliciting responses.
Questionnaire Structure
As Table 1 shows, the structured questionnaire used for this study was divided into five main sections to comprehensively capture socio-demographic data and perceptions of wastewater impacts. Part A collected socio-demographic information such as gender, age, education, occupation, and household income through closed-ended questions. Part B examined the perceived effects of industrial wastewater on natural resources, including surface and groundwater, soil, and local biodiversity, using closed-ended and multiple-response items. Part C addressed agricultural impacts, including changes in crop yield, additional cultivation costs, fish population changes, and income effects, primarily through closed-ended and multiple-response questions. Part D investigated human health impacts, asking respondents to report experienced health issues and their perceived link to wastewater disposal using closed-ended, multiple-choice, and open-ended formats. Part E gathered respondent opinions on the broader effects of wastewater disposal on community livelihoods—covering water, soil, biodiversity, agricultural production, health, and well-being—measured using a Likert scale.

Table 1.
The structure of the questionnaire.
2.3. Sampling Frame, Sample Size and Data Collection
Fieldwork was carried out in June 2024. The data collection process involved face-to-face interviews using the structured questionnaire described above. A total of 162 households were randomly selected for participation, ensuring a diverse sample without any predetermined selection criteria. Trained data collectors unfamiliar with the area were employed to administer the surveys, thereby reducing potential bias. They approached households at random and interviewed the head of the household whenever possible. In cases where the head of the household was unavailable, another family member was considered as the respondent. The response rate was high, with only six households declining to participate due to concerns about job security related to the UEPZ. Despite such potential concerns, the remaining households willingly responded.
The sample size achieved offers strong statistical reliability for the study. We used the standard sample size estimation formula:
where Z = 1.96 for a 95% confidence level, p = 0.5 for maximum variability, and E = 0.075 (7.5% margin of error); the initial required sample size without population adjustment is
Since the total household population in the selected villages is finite (estimated at N = 650 households), finite population correction (FPC) is applied:
Therefore, the effective required sample size after FPC is 141 households. Our collected 162 samples exceed the adjusted requirement. This gives us a margin of error below 7.5 percent for the study population, which supports the reliability and validity of the findings. We analyzed the data using Microsoft Excel (Microsoft Corp., Redmond, WA, USA), IBM SPSS Statistics, Version 20 (IBM Corp., Armonk, NY, USA), and Google Colab-Python Environment (Google LLC, Mountain View, CA, USA) for descriptive and inferential statistics to explore the relationships between wastewater exposure and community impacts.
2.4. Design of Experiment
The study used a cross-sectional survey framework, focusing on households as the main unit of analysis. It was designed to capture differences in environmental, agricultural, and health conditions linked to proximity to the Uttara Export Processing Zone (UEPZ). The selected villages, within the likely exposure area, served as natural observation sites instead of experimental clusters. The household selection strategy was based on statistical power. Calculations assumed a 95 percent confidence level, 80 percent power, and a moderate effect size (Cohen’s h = 0.3). This ensured the sample size was large enough to identify meaningful associations in key outcome variables. Although the survey did not alter any conditions, it upheld analytical rigor by keeping household-level observations independent. It also reduced potential selection bias through randomization procedures. Data quality improved with a pre-tested instrument, strict adherence to standardized interviewing methods, and consistent training for interviewers. Although recall-based questions were included to capture changes over the past five years, the study’s cross-sectional design limits causal interpretations. Still, the approach offered a solid foundation for examining statistical relationships between wastewater exposure and reported impacts on natural resources, agriculture, and human health, using both descriptive and inferential analyses.
2.5. Ethical Considerations
Participation in the study was voluntary; informed consent was obtained from all participants. Before the interviews, the interviewers informed the participants of the study details, including its objectives and their rights to not answer any questions they did not want to answer and to stop participating in the survey at any time. The study did not record or use names or identifying information in the analysis or reporting, which ensured the privacy of the respondents. Throughout the research process, the study prioritized participants’ safety, privacy, and dignity by providing anonymity and confidentiality. Aligning with the established ethical guidelines in social research, these measures helped to foster honest responses [22,24]. This research was reviewed by the Ethical Committee of the Department of Sociology, Begum Rokeya University, Rangpur, Bangladesh (Protocol No. EA/03/24).
3. Results
This study has several limitations. First, the study was conducted based on quantitative data only, which was gathered through structured surveys. However, such an approach is useful for producing generalizable findings while failing to capture the richness of an individual’s experiences and the dynamics of community interactions. The use of qualitative methods such as Focus Group Discussions, in-depth interviews, or case studies could have strengthened the reliability and validity of the findings of the study. Furthermore, data collection was carried out only once—in June 2024—which prevented findings from capturing the seasonal or temporal dynamics of wastewater impacts. Also, the research was conducted in four villages near the UEPZ and, therefore, may not be representative of the whole impact of industrial pollution in other affected areas. Finally, the survey was performed at the household level and did not include the perceptions of industrial actors such as factory owners and managers, who may have offered a different perception of the problems and advantages in the fight against waste management.
3.1. Demographic Characteristics
As Table 2 shows, most respondents were male (77%), which reflects the gendered dynamics of household representation in rural Bangladesh. This skew raises the possibility of gender bias in the data, particularly since women are underrepresented in reporting health impacts. Most respondents belonged to the economically productive age range, with 48% being 20–40 years old, positioning them at the frontline of both labor exposure and environmental vulnerability. A notable portion (39%) had no formal education, and 24% had completed their Secondary School Certificate or higher.
Table 2.
Descriptive statistics of demographic characteristics of respondents.
The data reveal that farming remains the dominant occupation among respondents (49%), highlighting each community’s strong reliance on agriculture. Many respondents (16%) also work in the informal sector, including rickshaw pulling and day labor, reflecting the prevalence of non-contractual, low-security employment, and some of them (15%) are involved with business. Six out of ten women identified as housewives, suggesting that traditional gender roles continue to shape labor participation in the area. The findings point to a labor market heavily tilted toward informal and subsistence-based work, with limited formal employment opportunities.
The reported monthly family income of the respondents is very low, indicating a lower level of economic status within the community. Only 11% of the respondents have a monthly income of USD 252 to USD 294. Most of the respondents (51%) have a monthly income of USD 127–251, while 37% have a monthly income of USD 20–126.
3.2. Impacts of Industrial Wastewater on Natural Resources
The survey was conducted to determine the current state of water in the local rivers and ponds. As Figure 3 shows, a high majority of the respondents had concerns about the quality of water. Among them, 73% reported a change in the color of the water, and a higher percentage (83%) reported a deterioration in the smell of the water, which indicates pollution. Furthermore, 58% of the respondents reported a change in the taste of water, which also suggests a general deterioration in water quality. Visible pollutants were reported to be present by 22% of the respondents, which indicates other pollution problems. Furthermore, 17% of the respondents reported changes in aquatic life, which means that the water quality is deteriorating and affecting the habitat and its inhabitants. These perceptions suggest that the surface water ecosystem is undergoing significant degradation due to wastewater disposal.
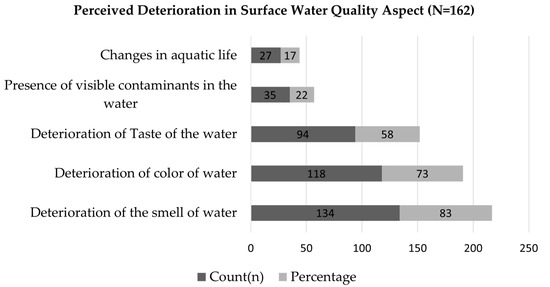
Figure 3.
Perceived deterioration in different aspects of surface water quality (N = 162).
The survey on the availability and quality of drinking water from tube wells in the UEPZ area produced rather contradictory results when it comes to the perceptions of the respondents. Figure 4 shows that only 9% of the respondents rated the water quality as very good, while 43% of them said it was good. Furthermore, 30% of the respondents rated the water quality as average. In general, though the majority of the respondents rated the water quality as good or average, one-third of the respondents (18%) had a negative opinion and rated it as poor or very poor. This contrast points to a perceived divide between surface water pollution and groundwater safety, possibly reflecting beliefs about groundwater’s relative protection from industrial contamination.
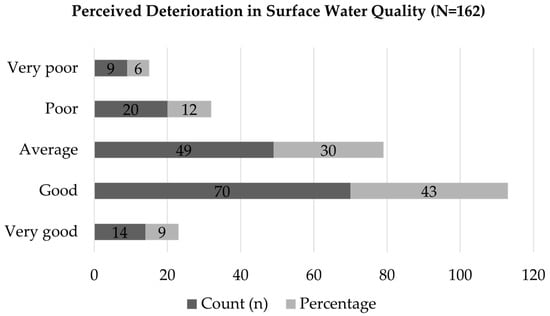
Figure 4.
Perceived quality ratings for tube well drinking water in UEPZ area (N = 162).
Figure 5 shows that respondents are highly concerned about the effects of industrial wastewater disposal on natural resources in the UEPZ area. The majority (87%) of respondents agreed that wastewater from UEPZ has negative impacts on natural resources. 90% of respondents agreed that wastewater from the UEPZ area had adversely affected soil quality and decreased biodiversity. Seven out of ten respondents reported degraded air quality. These results indicate that a wide range of concerns exists regarding the environmental impacts of industrial wastewater.
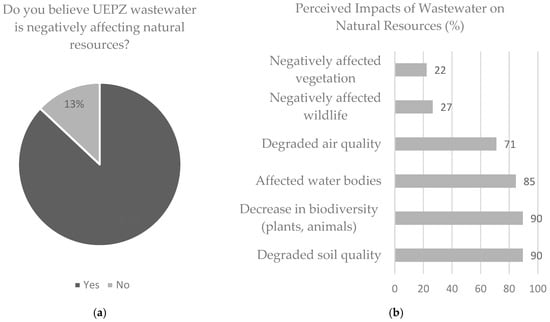
Figure 5.
Perceived negative impacts of the UEPZ wastewater disposal on natural resources: (a) Do you believe UEPZ wastewater is negatively affecting natural resources? (b) Perceived impact of wastewater on natural resources (%).
3.3. Impacts of Industrial Wastewater on Agriculture
Agriculture is the primary livelihood for the majority of households in the UEPZ surrounding area. The findings reveal that the sector is increasingly threatened by environmental degradation. Table 3 shows that most respondents (66%) had accessible land within the vicinity. Most of them (62%) cultivate grains, and others grow vegetables (37%), and fruit (20%). As for the source of water for farming, almost all of them (99%) extracted water from groundwater through wells or boreholes for irrigation. In the last five years, respondents reported having experienced changes in the quality of water used for irrigation. Respondents have also found notable changes in the color of water (62%), changes in the odor of water (68%), and residues in the water (58%). These results show increasing problems with water quality in the area.
Table 3.
The involvement of respondents with agriculture and the impact of the UEPZ wastewater disposal on agriculture.
Table 3 shows that most respondents (65%) experienced decreased crop yields, and 69% observed changes in the health of crops since the EPZ started operations. Study participants reported that diseases of crops and pest infestation have increased, resulting in stunted growth of the crops. The survey did not categorize the degree of yield loss. Specific issues included more crop diseases (65%), pest problems (54%), and stunted growth (54%). These effects have led to higher production costs for most households. About 94% reported extra expenses due to changes in water or soil quality, with 53% using more fertilizers and 47% using more pesticides. Figure 6 shows these extra financial pressures. It illustrates the share of households facing additional costs and how much they are spending more on fertilizers and pesticides. These trends not only reduce net farm income but also lead to greater reliance on chemicals to maintain yields. This situation intensifies the environmental challenges the community faces.
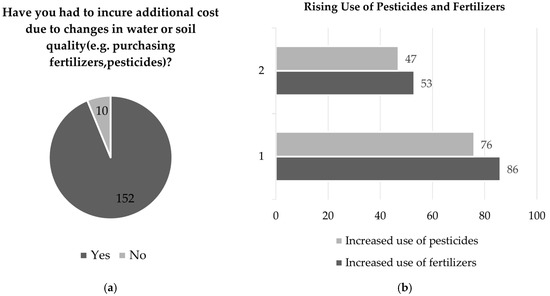
Figure 6.
Perceived additional cost due to changes in water and soil quality for purchasing more pesticides and fertilizer: (a) Have you had to incur additional costs due to changes in water or soil quality (e.g., purchasing fertilizers, pesticides)? (b) Additional cost for rising use of pesticides and fertilizers (1 depicts percentage (%) and 2 depicts count of respondents).
Data presented in Table 4 indicate that the operation of the UEPZ has had substantial negative impacts on both the local fish population and the income of nearby residents. More than three-quarters of respondents reported biological damage to fish populations, including reduced numbers (96%), discoloration (82%), increased mortality (80%), and deformities (77%). Less commonly reported impacts were decreased size (36%) and increased disease incidence (27%). This finding suggests that contamination is affecting not just fish survival but also growth and reproduction.
Table 4.
Impacts of the UEPZ wastewater disposal on fish cultivation.
The consequences of this ecological decline are deeply felt at the household level. A large majority (88%) of survey respondents indicated that these changes in the fish population have adversely affected their livelihoods, as fishing and fish farming previously served as essential livelihoods. Additionally, 76% of respondents noted a decrease in their farming income, attributing this decline to the activities of the UEPZ.
About 66 percent of respondents have land near UEPZ. Respondents with land near the UEPZ are exposed to wastewater from industry. So, we hypothesize that those who have land near the UEPZ will suffer from the impacts of wastewater. From Table 5, we observe that there is no relation between having land near the UEPZ and income (0.617 > p-value), but respondents had to bear more costs for cultivation (0.032 < p-value). Thus, someone having land near the UEPZ has to bear more costs for cultivation than someone not having land near the UEPZ. Increased pest infestation and having land near UEPZ are independent of each other (0.345 > p-value), which implies pest infestation is equal for both parties who have land near the UEPZ and those who do not. There is a significant relationship between decreased crop production (0.00 < p-value) and having land near the UEPZ. This implies that those who have land near the UEPZ tend to have lower crop production than those who do not have land near the UEPZ. On the contrary, the decrease in fish production (0.105 > p-value) and having land near the UPEZ are independent; there is no difference between the production of fish for those that have land near the UEPZ and those that do not.
Table 5.
Chi-square test significance value (p-value = 0.05).
The increase in disease incidents (0.351 > p-value) and having land near the UEPZ are independent. This suggests that industrial wastewater may not be the cause of increased disease incidents. As Table 5 shows, decreased farming income (0.00 < p-value) and having land near the UEPZ are not independent. There is a significant relationship between them. Those who have land near the UEPZ are more prone to have decreased farming income than those who do not. Water quality degradation and having land near the UEPZ are significantly (0.009 < p-value) related to each other. Those who have land near the UEPZ noticed that their irrigation water quality and the water of the river/stream are degrading, and attribute this to industrial wastewater. Soil quality degradation and having land near the UEPZ are significantly (0.01 < p-value) related to each other. The farmers who have land near the UEPZ believe their land’s soil quality is degrading due to wastewater at higher levels than those who have land further from the UEPZ.
Farm productivity decreases, and having land near the UEPZ is not independent, but is significantly related (0.00 < p-value). Those farmers who have land near the UEPZ tend to have less farm productivity than those farmers who do not have land nearby.
3.4. Impacts of Industrial Wastewater on Human Health
Table 6 indicates that water quality issues in the vicinity of the UEPZ have significant effects on human health. Most respondents (69%) experienced one or more health symptoms that they attributed to water pollution, while 31 percent did not. The health concerns identified included skin problems, such as rash and itching (66%); respiratory symptoms, including cough and asthma (14%); and gastrointestinal symptoms, including stomach pain and diarrhea (17%). Respondents also noted eye irritation or infection (20%), as well as headaches or dizziness (9%). Importantly, these categories are not mutually exclusive; many respondents reported multiple symptoms simultaneously, indicating compound health effects rather than isolated conditions. When asked whether they think these health issues are related to wastewater disposal from the UEPZ, almost one-half (44%) reported “yes.”
Table 6.
Health-related experiences and their connection with the UEPZ wastewater disposal.
3.5. Binary Logistic Regression
Binary logistic regression was employed to identify the determinants of two key outcome variables: (i) whether respondents reported health problems attributed to wastewater exposure, and (ii) whether respondents believed that wastewater negatively affects natural resources. Odds ratios (ORs) with corresponding 95% confidence intervals (CIs) were calculated to evaluate the strength and direction of associations. Independent variables included demographic characteristics, environmental observations, and perception-based measures.
The full regression results are presented in Table 7, while the forest plots (see Figure 7 and Figure 8) provide a visual summary of predictors, illustrating the relative effect sizes and statistical significance.
Table 7.
Binary logistic regression of different variables of having perceived health issues due to wastewater and wastewater effects on natural resources (values are odds ratio followed by 95 percent confidence interval in parenthesis).
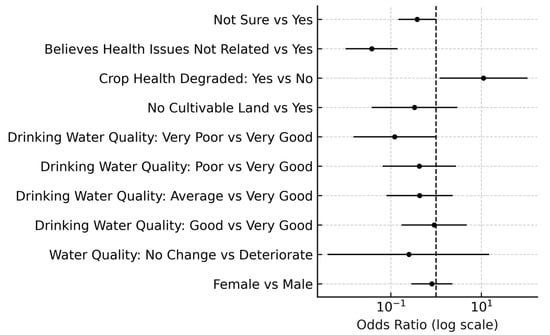
Figure 7.
Forest plot of predictors for reporting health issues attributed to wastewater exposure (N = 162). Odds ratios (OR) with 95% confidence intervals are shown.
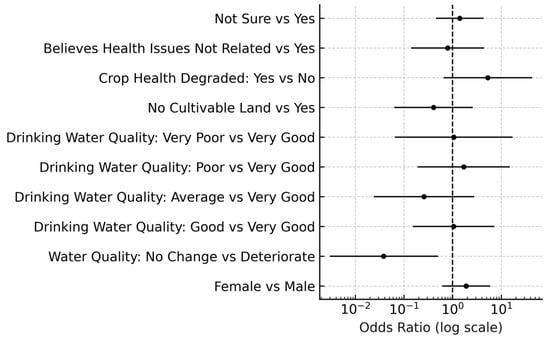
Figure 8.
Forest plot of predictors for perceived negative impact of wastewater on natural resources (N = 162). Odds ratios (OR) with 95% confidence intervals are shown.
3.5.1. Reported Health Issues Attributed to Wastewater Exposure
Perceived crop health deterioration was a strong and statistically significant predictor of reporting health issues related to wastewater. Respondents who noticed crop health degradation had 11.21 times higher odds of indicating that they or their family members experienced health problems linked to wastewater compared to those who did not see such degradation (OR = 11.209; 95% CI: 1.203, 104.460; p = 0.034) (see Figure 7). Although the confidence interval is wide, indicating some variability in the estimate, the lower limit remains above 1. This confirms a strong positive connection. It suggests that visible signs of environmental damage may either directly increase exposure to contaminants or raise risk perception, leading to more reported health problems.
Perception-based factors also showed particularly strong associations. Respondents who did not believe that wastewater causes health issues had significantly lower odds of reporting any related health problems (OR = 0.038; 95% CI: 0.010, 0.142; p < 0.001; Figure 7). Those who were uncertain about this link also showed notably reduced odds (OR = 0.382; 95% CI: 0.147, 0.992; p = 0.048). These findings highlight the role of environmental risk awareness and personal beliefs in influencing health-related reporting.
The model showed satisfactory explanatory power, accounting for 32.6% of the variance in reported health problems (Cox and Snell R2 = 0.326) and 45.9% after adjustment (Nagelkerke R2 = 0.459). The −2 Log Likelihood value of 135.529 shows a good model fit.
3.5.2. Perceived Negative Impact of Wastewater on Natural Resources
Perceptions of water quality change were a major factor in beliefs about wastewater’s impact on the environment. Respondents who noticed no change in water quality were much less likely to believe that wastewater harms natural resources compared to those who reported a decline (OR = 0.038; 95% CI: 0.003, 0.503; p = 0.013) (see Figure 8). This indicates that visible signs of environmental damage, especially in water quality, are closely linked to how people view ecological risks. While not statistically significant at the 0.05 level, respondents who witnessed crop health decline were more likely to see a negative effect from wastewater (OR = 5.318; 95% CI: 0.655, 43.153; p = 0.118). This hints at a potential connection that might reach statistical significance with a larger sample size or different environmental conditions.
The model explained 11.5% of the variance (Cox and Snell R2 = 0.115) and 21.4% after adjustment (Nagelkerke R2 = 0.214), with a −2 Log Likelihood value of 104.935. Although the explanatory power was lower than in the health outcome model, the relationships are still important for understanding public views on the ecological effects of wastewater.
3.5.3. Interpretation and Implications
These results show that both objective environmental indicators, such as water quality decline and crop health drop, and subjective perception-based factors affect how communities respond to risks related to wastewater. Among all the factors, perceived connections between wastewater and health outcomes had the strongest links. This highlights the need for better environmental education and clearer communication about risks. From a policy standpoint, boosting public awareness campaigns, ensuring clear communication about wastewater risks, and increasing environmental monitoring at the community level could improve the accuracy of health reports and make environmental advocacy more effective. The combined presentation of regression results in Table 7 and the visual summaries in Figure 7 and Figure 8 makes it easier to understand for both academic and policy audiences.
3.6. Perceived Effects of UEPZ Wastewater on Livelihood
Table 8 shows the mean values of agreement for different variables on the effects of industrial wastewater. Mean values from 3.41 to 4.20 indicate “Agree,” so respondents agreed with the following statements:
Table 8.
Distribution of respondents by their level of agreement on the perceived effects of UEPZ wastewater on the livelihood.
- Farm productivity has decreased over the last 10 years.
- Farms need more fertilizer applications (both organic and inorganic) to support more crop yields.
- Industrial wastewater harms the health of livestock.
- I believe that industrial wastewater disposal in this area negatively affects the quality of drinking water.
- I have noticed an increase in health problems among residents in this area due to industrial wastewater.
- Household members do not go to the farm/work when sick.
- Skin has itched more than it used to over the last 10 years.
- Health hazards posed by industrial activities result in rural dwellers/farmers spending more to maintain their health.
Mean values from 4.21 to 5 indicate “Strongly Agree.” That is, respondents strongly agreed with the following statements:
- Industrial wastewater has negatively impacted the water quality in local rivers and ponds.
- Industrial wastewater has negatively affected the local soil quality.
- Biodiversity (plants and animals) in the area has been negatively impacted by industrial wastewater.
- Industrial wastewater disposal has reduced the fertility of agricultural land.
- The taste of fish has decreased due to untreated water pollution in the area.
Table 8 also shows the agreement on the effect of wastewater on the livelihood of the respondents. Respondents believe industrial wastewater has negatively affected water quality (98%), soil quality (98%), and biodiversity (87%) and reduced fertility (90%)—resulting in decreased farm productivity over the last 10 years. This also suggests a need for more fertilizer (86%), decreased taste of fish (96%), negative impacts on the health of livestock (84%), and negative effects on the quality of the drinking water (62%). There are also reported increases in health problems among the residents due to wastewater (74%), as well as skin diseases increasing over the last ten years (66%). As a result of these health issues, residents do not farm when they are sick (77%) and they spend more money to maintain their health (60%).
4. Discussion
To our knowledge, no research investigates the cascading effects of industrial untreated wastewater on the livelihood of community people. This limits the ability to compare findings from this study to other regions. However, some issues should be emphasized and considered for future research in other locations.
The age structure of the population in this study shows that people of all ages are involved in the local economy, with the majority being of working age. This is a very important factor in economic activities and community development. The largest group, aged 31–40 years, constitutes about 28 percent of the sample, indicating a clear presence of individuals in early to mid-adulthood who are likely to be at the peak of their economic productivity. This is in line with previous demographic studies that have established that the age structure of a population is a key economic determinant [25]. The respondents’ educational status shows that many of them are not educated, and 39 percent are unable to write. This is rather worrying, as socioeconomic development is inhibited by low levels of education, given that education is a key determinant of economic development and individual power [26]. Lower levels of education have the potential to limit understanding of environmental risks and diminish interest in and capacity to press for regulatory action to mitigate environmental degradation. Moreover, the low higher education enrollment (3% percent of graduates) is a sign that there is a need to increase the educational levels of the population of the region, which is important for enhancing entrepreneurship and innovation [27].
The major economic activity of the respondents showed that 48.8 percent were in farming. This emphasis on agriculture is typical of rural areas in developing countries, where agriculture remains the main source of livelihood and employment. For example, a striking 92 percent of rural households are involved in farming to some extent in African countries [28]. The fact that approximately 15 percent of the population is involved in business activities indicates some diversification of the economy, which is necessary for resilience to agricultural risks and growth [29]. The income distribution of the respondents is rather diverse, and 26 percent of them receive USD 125.59–167.44 per month. This is because there are many forms of economic activities and production within the community. However, the presence of poor people (4% less than USD 41.86) points to the continuing economic challenges and poverty that need to be addressed [30].
The perceptions of environmental degradation found in this study are consistent with findings of other studies on the adverse impacts of industrial pollution on water bodies, which can have severe ecological and public health implications. For instance, five years before this research, Haque et al. found that the UEPZ surrounding area is moderately or slightly polluted due to the presence of untreated industrial wastewater [11]. Similarly, Akter et al. concluded that the aquatic body around Dhaka EPZ is highly polluted due to the various types of industrial disposal directly to the water body, placing nearby human populations at significant risk due to the environmental conditions [10].
The survey results show that there is a positive correlation between respondents’ land ownership within the buffer zone of the UEPZ and their awareness of soil quality change. This was achieved by first posing the null hypothesis that there is no relationship between these variables. Since the result was significant, we can conclude that there is a relationship between these items, and respondents believe that the soils around the UEPZ appear to be losing their quality. Only 11 percent of people believe that the land near the UEPZ has become better due to industrial wastewater. In the same manner, all respondents pointed out that soil quality has worsened since the establishment of industries [2]. Moreover, the survey results show that respondents are concerned about the effects of industrial wastewater on natural resources, as 96 percent of them reported a general worsening of water quality. The high level of respondents’ observations on changes in water color (73%), smell (83%), and taste (58%) also shows that there is a high level of pollution, which may be affecting the aquatic organisms and human health [31].
The survey data show the impact on agriculture, and the majority of respondents (67%) have reported reduced crop yields since the establishment of the UEPZ. This finding is consistent with previous studies demonstrating that industrial pollution negatively impacts agricultural production through both soil and water contamination [8]. For instance, a study along the Turag Riverbank in Dhaka documented substantial deterioration in water and soil quality, accompanied by declines in both the quality and quantity of rice production following industrial expansion. The same study also reported increased insect infestations, which further contributed to yield losses. Similarly, research in Nepal found that crop productivity was markedly lower on land irrigated with effluent-contaminated water compared to land irrigated with clean water [32].
In the present study, the data show that a large number of respondents reported a very large decrease in the Boro rice strain and a medium decrease in the Aus rice strain, as well as a relatively smaller decline (78%) in Aman rice cultivated under rainfed conditions. The increase in the application of fertilizers and pesticides due to poor water and soil conditions (94% of the respondents, who incurred additional costs) reveals the extra economic burden on farmers, which may intensify rural poverty and food insecurity [33]. The results also show that there are severe negative effects on the fish population since 96 percent of the respondents reported a decrease in fish catch. The observed increase in fish mortality (80%) and deformities (77%) is an indication of highly polluted water, which has implications for the environment and the inhabitants, who depend on fishing for their livelihoods [34]. This harms the income from fishing since 76 percent of the respondents report that farming income has reduced, which shows the vulnerability of the communities to environmental changes [35]. These data point to cascading and cumulative effects of wastewater releases, environmental degradation, and negative impacts on economic sustainability and development.
When it comes to human health, the data shows that industrial wastewater has a severe impact, as 69 percent of the respondents have claimed to have been affected by water quality. The health complaints reported include skin (66.0%), respiratory (13.6%), and gastrointestinal (17.3%) complaints, which conform to the known health effects of water pollution [36]. This cross-country comparison of health effects associated with wastewater disposal from the UEPZ is important, given that 44 percent of the respondents believe that these health effects are related to wastewater disposal. Study participants mentioned that the quality of the river is getting worse with industrial effluents, and previous research [37,38] has been shown that river pollution affects the food chain and people’s health. The microorganisms within the river water, as a result of industrial effluents and untreated water, are the prime sources of different water-borne diseases like diarrhea, cholera, scabies, and asthma. Similar findings in Nigeria show that heavy metals are absorbed in food and water and pose health risks to people who consume them [39].
In general, the survey results demonstrate the negative effects of industrial wastewater on natural resources, agriculture, the economy, and human health in the UEPZ area. Overall, these findings reveal the need for proper environmental regulations and measures to control pollution and to protect the health of people living in the affected communities.
These findings directly intersect with several United Nations Sustainable Development Goals (SDGs). The documented health risks correspond to SDG 3 (Good Health and Well-being), while the observed deterioration in water quality and access relates to SDG 6 (Clean Water and Sanitation). The economic consequences for farmers and fishers align with SDG 8 (Decent Work and Economic Growth) and SDG 1 (No Poverty), given the link between environmental degradation and livelihood insecurity. By framing these impacts within the SDG framework, this study not only contributes empirical evidence to the environmental and socio-economic discourse but also highlights the need for policy action that advances both local well-being and global sustainability commitments.
5. Conclusions
This study provides clear quantitative evidence that untreated industrial wastewater from the Uttara Export Processing Zone has significant negative impacts on the surrounding communities’ natural resources, agricultural productivity, and public health. Notably, 96% of respondents reported a decline in fish populations, 87% perceived adverse effects on natural resources, 90% observed soil degradation and biodiversity loss, and 65% experienced reduced crop yields. Health impacts were also substantial, with 69% reporting symptoms linked to water pollution. Some of the health complications include skin complaints, respiratory complications, stomach disorders, and eye complaints. These patterns point to cascading effects that threaten both environmental sustainability and local livelihoods. Water and soil pollution have increased the costs of agriculture because of the increased costs of fertilizers and pesticides. The decrease in the fish population also affects other forms of income. An increase in health complications among the region’s population has increased the costs of health care and decreased the ability to work.
Findings of this research elevate several important policy recommendations to mitigate the adverse cascading and cumulative effects of untreated industrial wastewater disposal from the UEPZ. First, the government should make it compulsory for industries to set up CETPs in the UEPZ to treat wastewater before discharge to avoid pollution and its effects on natural resources, agriculture, and human health. Additionally, the development of a specific wastewater discharge system with designated discharge points and separate drainage to nearby rivers is crucial to prevent the pollution of agricultural lands with untreated wastewater. To enhance agricultural production and resilience, the government should develop and implement programs that provide technical support and guidance to farmers on how to manage risks and enhance production in the new environmental conditions. Regarding ecological effects, it is crucial to continue preserving and restoring natural resources, including reforestation and protecting biological diversity. To tackle the adverse health outcomes, community health interventions should be prioritized, which include health check-ups, awareness campaigns for the populations at risk, and easy access to health facilities. Environmental, agricultural, and health policies can therefore be complementary to address the negative effects of industrial activities on the regions and the environment.
Author Contributions
Conceptualization, A.B.M.N.; methodology, A.B.M.N.; validation, A.B.M.N.; formal analysis, M.S.K.; investigation, A.B.M.N. and M.S.K.; data curation, M.S.K.; writing—original draft, A.B.M.N.; writing—review and editing, L.R.; supervision, L.R. All authors have read and agreed to the published version of the manuscript.
Funding
The authors disclose receipt of the following financial support for the research: this work was supported by the University Grants Commission (UGC), Bangladesh, and by Virginia Polytechnic Institute and State University, College of Liberal Arts and Human Sciences.
Institutional Review Board Statement
The study was reviewed and approved by the Department of Sociology, Begum Rokeya University, Rangpur, Bangladesh (protocol code EA/03/24, approval date 4 April 2024) for studying involving humans.
Informed Consent Statement
Before starting the survey, all participants were informed about the nature, purpose, and procedure of the study. Verbal consent was obtained from each participant before proceeding with the data collection. Participation was voluntary. The respondents were assured of confidentiality and anonymity of their responses.
Data Availability Statement
Data will be made available on request.
Acknowledgments
We impart our gratitude to the dedicated team of data collectors whose hard work and commitment made this study possible. We are equally thankful to all respondents who graciously shared their time, experiences, and insights. The authors also sincerely thank the anonymous reviewers and the editorial team of Sustainability for their valuable comments and suggestions, which helped improve the quality of this manuscript.
Conflicts of Interest
The authors declare no potential conflicts of interest for the research, authorship, and publication of this article.
References
- Bangladesh Bureau of Statistics. Bangladesh Bureau of Statistics Official Website. Available online: http://nsds.bbs.gov.bd/en (accessed on 9 August 2025).
- Afrad, M.S.I.; Monir, M.B.; Haque, M.E.; Barau, A.A.; Haque, M.M. Impact of Industrial Effluent on Water, Soil and Rice Production in Bangladesh: A Case of Turag River Bank. J. Environ. Health Sci. Eng. 2020, 18, 825–834. [Google Scholar] [CrossRef] [PubMed]
- Bhattacharya, D. Export Processing Zones in Bangladesh: Economic Impact and Social Issues; International Labour Organization: Geneva, Switzerland, 1998; Volume 80. [Google Scholar]
- Sultana, M.N.; Hossain, M.S.; Latifa, G.A. Water quality assessment of Balu river, Dhaka Bangladesh. Water Conserv. Manag. 2019, 3, 8–10. [Google Scholar] [CrossRef]
- Hossain, M.M.; Hassan, K.M.; Satu, S.N. Investigation of industrial effluent & drinking water quality near Uttara EPZ area of Nilphamari. In Proceedings of the WasteSafe 2023, 8th International Conference on Solid Waste & Faecal Sludge Management (WasteSafe 2023), Khulna, Bangladesh, 25–26 February 2023. [Google Scholar] [CrossRef]
- Islam, M.S.; Sultana, A.; Sultana, M.S.; Shammi, M.; Uddin, M.K. Surface Water Pollution around Dhaka Export Processing Zone and Its Impacts on Surrounding Aquatic Environment. J. Sci. Res. 2016, 8, 413–425. [Google Scholar] [CrossRef]
- Venkatesan, G.; Subramani, T. Environmental degradation due to the industrial wastewater discharge in Vellore District, Tamil Nadu, India. Indian J. Geo-Mar. Sci. 2018, 47, 2255–2259. [Google Scholar]
- Hossain, M.A.; Rahman, G.K.M.M.; Rahman, M.M.; Molla, A.H.; Mostafizur Rahman, M.; Khabir Uddin, M. Impact of Industrial Effluent on Growth and Yield of Rice (Oryza sativa L.) in Silty Clay Loam Soil. J. Environ. Sci. 2015, 30, 231–240. [Google Scholar] [CrossRef] [PubMed]
- Kumar, V.; Sharma, A.; Kaur, P.; Singh Sidhu, G.P.; Bali, A.S.; Bhardwaj, R.; Thukral, A.K.; Cerda, A. Pollution Assessment of Heavy Metals in Soils of India and Ecological Risk Assessment: A State-of-the-Art. Chemosphere 2019, 216, 449–462. [Google Scholar] [CrossRef]
- Akter, M. Water Quality Assessment of an Industrial Zone Polluted Aquatic Body in Dhaka, Bangladesh. Am. J. Environ. Prot. 2014, 3, 232. [Google Scholar] [CrossRef][Green Version]
- Haque, M.E.; Shermin, M.; Mukta, A.Y. Assessing Water and Soil Pollution Due to Uttara EPZ, Nilphamari, Bangladesh. J. Geosci. Environ. Prot. 2019, 7, 136–153. [Google Scholar] [CrossRef]
- Mahbub, A.; Tanvir, H.; Afrin, L.T. An Evaluation of Environmental and Social Impact Due to Industrial Activities—A Case Study of Bangshi River around Dhaka Export Processing Zone (DEPZ), Bangladesh. Int. Res. J. Environ. Sci. 2014, 3, 103–111. [Google Scholar]
- Kasperson, J.X.; Kasperson, R.E.; Turner, B.L., II. Regions at Risk: Comparisons of Threatened Environments; United Nations University Press: Tokyo, Japan; New York, NY, USA; Paris, France, 1995. [Google Scholar]
- Turner, B.L., II. The Earth as Transformed by Human Action; Cambridge University Press & Assessment: Cambridge, UK, 1988; Volume 40, pp. 340–341. [Google Scholar]
- Singh, G.; Mishra, S. Industrial Pollution Management Approach. In Heavy Metal Toxicity: Environmental Concerns, Remediation and Opportunities; Singh, R.P., Singh, P., Srivastava, A., Eds.; Springer Nature: Singapore, 2023; pp. 363–388. ISBN 978-981-9903-96-2. [Google Scholar]
- Barbier, E. Natural Resources and Economic Development; Cambridge University Press: New York, NY, USA, 2019. [Google Scholar]
- Pretty, J.; Hine, R. Pesticide Use and the Environment. In The Pesticide Detox: Towards a More Sustainable Agriculture; Earthscan: London, UK; Washington, DC, USA, 2005. [Google Scholar]
- Martinez-Alier, J. The Environmentalism of the Poor: Gold, Oil, Forests, Rivers, Biopiracy. In The Environmentalism of the Poor A Study of Ecological Conflicts and Valuation; Edward Elgar Publishing: Cheltenham, UK, 2002. [Google Scholar]
- Alluvial Soil—Banglapedia. Available online: https://en.banglapedia.org/index.php/Alluvial_Soil (accessed on 11 August 2025).
- Department of Environment, Ministry of Environment, Forest and Climate Change, Government of Bangladesh. First Biennial Update Report of Bangladesh to the United Nations Framework Convention on Climate Change; Department of Environment: Dhaka, Bangladesh, 2023; Available online: https://unfccc.int/documents/634149 (accessed on 21 August 2025).
- Lower Gangetic Plains Moist Deciduous Forests. Available online: https://www.oneearth.org/ecoregions/lower-gangetic-plains-moist-deciduous-forests/ (accessed on 11 August 2025).
- Creswell, J.W. Research Design: Qualitative, Quantitative, and Mixed Method Approaches, 2nd ed.; Sage Publications: Thousand Oaks, CA, USA, 2003; ISBN 978-0-7619-2441-8. [Google Scholar]
- Fowler, F.J., Jr. Survey Research Methods, 5th ed.; Sage Publications: Thousand Oaks, CA, USA, 2013. [Google Scholar]
- Babbie, E. The Practice of Social Research, 15th ed.; Cengage Learning: Boston, MA, USA, 2020. [Google Scholar]
- Lee, R.; Mason, A.; Members of the NTA Network; Lee, R.; Mason, A.; Amporfu, E.; An, C.-B.; Bixby, L.R.; Bravo, J.; Bucheli, M.; et al. Is Low Fertility Really a Problem? Population Aging, Dependency, and Consumption. Science 2014, 346, 229–234. [Google Scholar] [CrossRef]
- Barro, R.J. Education and Economic Growth. Ann. Econ. Financ. 2013, 14, 301–328. [Google Scholar]
- Hanushek, E.A.; Woessmann, L. The Role of Cognitive Skills in Economic Development. J. Econ. Lit. 2008, 46, 607–668. [Google Scholar] [CrossRef]
- Davis, B.; Di Giuseppe, S.; Zezza, A. Are African Households (Not) Leaving Agriculture? Patterns of Households’ Income Sources in Rural Sub-Saharan Africa. Food Policy 2017, 67, 153–174. [Google Scholar] [CrossRef]
- Haggblade, S.; Hazell, P.; Reardon, T. Transforming the Rural Nonfarm Economy: Opportunities and Threats in the Developing World; Baltimore, Johns Hopkins University Press: Baltimore, MD, USA, 2010. [Google Scholar]
- Ravallion, M. The Economics of Poverty: History, Measurement, and Policy; Oxford University Press: Oxford, UK, 2015. [Google Scholar]
- Wang, X.; Liu, B.; Zhang, W. Distribution and Risk Analysis of Heavy Metals in Sediments from the Yangtze River Estuary, China. Environ. Sci. Pollut. Res. 2020, 27, 10802–10810. [Google Scholar] [CrossRef] [PubMed]
- Neupane, R.P. Effect of Industrial Effluents on Agricultural Crops and Soil. Master’s Thesis, Tribhuvan University, Kathmandu, Nepal, 2003. [Google Scholar]
- Tilman, D.; Cassman, K.G.; Matson, P.A.; Naylor, R.; Polasky, S. Agricultural Sustainability and Intensive Production Practices. Nature 2002, 418, 671–677. [Google Scholar] [CrossRef] [PubMed]
- Dasgupta, S.; Laplante, B.; Meisner, C.; Wheeler, D.; Yan, J. The Impact of Sea Level Rise on Developing Countries: A Comparative Analysis. Clim. Change 2009, 93, 379–388. [Google Scholar] [CrossRef]
- Béné, C.; Arthur, R.; Norbury, H.; Allison, E.H.; Beveridge, M.; Bush, S.; Campling, L.; Leschen, W.; Little, D.; Squires, D.; et al. Contribution of Fisheries and Aquaculture to Food Security and Poverty Reduction: Assessing the Current Evidence. World Dev. 2016, 79, 177–196. [Google Scholar] [CrossRef]
- Prüss-Ustün, A.; Bartram, J.; Clasen, T.; Colford, J.M.; Cumming, O.; Curtis, V.; Bonjour, S.; Dangour, A.D.; De France, J.; Fewtrell, L.; et al. Burden of Disease from Inadequate Water, Sanitation and Hygiene in Low- and Middle-income Settings: A Retrospective Analysis of Data from 145 Countries. Trop. Med. Int. Health 2014, 19, 894–905. [Google Scholar] [CrossRef]
- Das, J.; Karmaker, N.; Khan, R.A. Reasons and Consequences of River Water Pollution and Their Remediation: In Context of Bangladesh. GSC Adv. Res. Rev. 2021, 7, 023–024. [Google Scholar] [CrossRef]
- Uddin, M.J.; Jeong, Y.-K. Urban River Pollution in Bangladesh during Last 40 Years: Potential Public Health and Ecological Risk, Present Policy, and Future Prospects toward Smart Water Management. Heliyon 2021, 7, e06107. [Google Scholar] [CrossRef]
- Odige, J. Harmful Effects of Wastewater Disposal into Water Bodies: A Case Review of the Ikpoba River, Benin City, Nigeria. Trop. Freshw. Biol. 2015, 23, 87. [Google Scholar] [CrossRef]


Disclaimer/Publisher’s Note: The statements, opinions and data contained in all publications are solely those of the individual author(s) and contributor(s) and not of MDPI and/or the editor(s). MDPI and/or the editor(s) disclaim responsibility for any injury to people or property resulting from any ideas, methods, instructions or products referred to in the content. |
© 2025 by the authors. Licensee MDPI, Basel, Switzerland. This article is an open access article distributed under the terms and conditions of the Creative Commons Attribution (CC BY) license (https://creativecommons.org/licenses/by/4.0/).