Abstract
An assessment of sustainability at the macro level is carried out for 12 leading OECD economies, plus China and Brazil, over the period of 1960–2015 in a comparative dynamic fashion under varying policy priorities: economic, social, environmental, and equal importance. Overall, Sweden, Switzerland, and Norway are found to be outperforming most other countries based on the basket of 16 different sustainability indicators consistently over time. While there are underlying causes of such performance expressed in policies of innovation, decarbonisation, and social cohesion, addressing economic, environmental, and social dimensions, there are some soft factors traditionally lying outside economic or policy domains. Such factors represent the power of institutions, the level of psychological well-being, and societal values, which tend to be statistically different in Sweden, Switzerland, and Norway, as opposed to other countries in the sample. The reasons for the changes in sustainability performance among countries under different policy priorities are discussed at length, with special attention paid to an economically, environmentally, and socially weighted sustainability index of progress.
1. Introduction
While the global economy moved beyond six of the nine planetary boundaries [1], it is now becoming abundantly clear that sustainability must be the top priority at the national and international levels. Going beyond GDP is becoming a buzzword in high OECD political circles [2], a long time since Herman Daly [3,4,5] and Robert Ayres [6,7,8] introduced and Victor [9] and Jackson [10] developed further the idea that economic growth should not be the ultimate goal of societal development. Major international institutions like the OECD, UN, and EU have been running Measuring Progress programmes [11] and examining alternatives to GDP [12]. This paper will address a range of research questions of particular interest to us: How could sustainability be assessed using multiple indicators? What are the implications of the assessment of sustainability changes over time? What is the role of policy priorities? How can the dynamic performances of countries be compared over time? What are the reasons, including policies, and institutional and societal factors that could explain the relatively strong performance among top performers and the weak performance among countries that are lagging behind? The rest of this paper is structured as follows: Section 2 presents the literature review; Section 3 outlines the methodology of the analysis; Section 4 presents the results; Section 5 discusses underlying institutional and societal factors explaining performance; and Section 6 concludes.
2. Literature Review
Accurately assessing an economy’s performance is as difficult for researchers as it is relevant for policymakers. Efforts to measure economic performance, historically often summarised as Gross Domestic Product (GDP), today strive to include more aspects of current well-being and sustainability. Well-being often includes indicators of education, health, or distribution, while sustainability is assessed in economic, social, and environmental dimensions (Appendix A). Motivated by recent financial and environmental crises, measuring progress “beyond GDP” has become part of the academic and policy mainstream, exemplified by flagship sustainable development reports published by the OECD, EU, and UN [2,13,14,15]. Signalling the topic’s relevance, these reports build on a literature that has tried to define, accurately measure, and compare economic performance and sustainability since the 1970s. To provide an overview, we grouped contributions by method type, as can be seen in Appendix A below. Many of the earlier studies in the field are closely tied to national accounting. They start with a standard economic measure, such as GDP or GNP, and adjust by including or excluding certain measures. Moving beyond monetary indicators, the second cluster of studies aggregates a broad spectrum of indicators into a composite index, providing a single compact measure of complex processes. Footprints also provide an aggregated number, but are focused on environmental aspects. Where composite indices provide an abstracted, single-number result, footprints aggregate into a result expressed in a concrete common unit, such as hectares or GHG emissions. Lastly, non-integrated baskets use broad indicator sets without aggregating them. Across, but also within, method types, approaches vary in the degree to which they cover social, economic, and environmental sustainability, such as whether they convincingly address weighting issues, how easily they are comparable across time and space, and how useful they are for policy purposes. Most studies allow for compensation between indicators, thus capturing weak sustainability [16], while only a few fulfil strong sustainability criteria. Each method type can be interpreted as an attempt to mitigate the shortcomings of another. Studies based on national accounting have a strong theoretical foundation, but their need for monetary indicators means that only aspects can be included where reliable valuation methods exist. Composite indices are not limited in terms of indicators, but the weighting of different indicators can seem arbitrary. Footprints provide an easily understandable measure, but this measure might be harder to disaggregate and use for policy purposes. Non-integrated baskets avoid arbitrary weighting but forfeit easy overall comparability across space and time. As will be laid out in the following section, no study has achieved easy cross-country comparisons over a longer time horizon while addressing weighting issues, including all three main dimensions of sustainability, and providing a useful foundation for policy purposes.
As mentioned, early contributions are closely linked to national accounting methods. Nordhaus and Tobin adjust GNP by reclassifying some of the expenditures that are usually counted as final [17]. The resulting Measure of Economic Welfare (MEW) can then be compared with the amount of consumption that would be possible while ensuring that welfare does not decrease for future generations. Focusing on natural capital stocks, Hartwick adjusts the net national product by including changes in natural capital stocks and suggests that any surplus should be reinvested into produced capital to compensate for the depletion of natural capital stocks [18]. With their weak sustainability approach, the MEW and Hartwick provide the groundwork for two of the most prominent examples of multidimensional sustainability assessments. The first, either known as Genuine Savings (GS) or Adjusted Net Savings (ANS), was first explored by Pearce and Atkinson and elaborated on by Hamilton, among others [19,20]. At its core, GS or ANS deduct the depreciation of man-made and natural capital from gross savings. In Hamilton’s study [20], GS mean traditional net savings plus education expenditures minus energy, minerals, net forest depletion, and carbon dioxide damage. For 1997, the results suggest that extractive economies are less sustainable, while high consumption in middle- and high-income countries is unproblematic. The second major approach based on national accounting is the Index of Sustainable Economic Welfare (ISEW) [4] or the Genuine Progress Indicator (GPI) [21]. Like GDP, the ISEW starts with personal consumption but then adjusts for distribution, as well as deducting and adding a range of measures, including more environmental indicators than GS/ANS. The main takeaway of the GPI/ISEW—generally called the “threshold hypothesis” [22]—suggests that GDP only contributes to welfare up to a threshold, after which the GPI starts diverging from GDP growth. Approaches based on national accounting remain relevant. Lawn and Clarke [22] apply the GPI to seven Asian-Pacific countries. GS have been calculated for a wide range of countries and time horizons [23,24] and have been proposed by OECD reports as one of the most useful indicators of economic sustainability [25]. Arrow et al. developed their own measure [26] with results close to those of [21]. National accounting itself has seen important developments towards more accurate monetary and physical measurements, as can be seen in the emergence of the System of Environmental–Ecological Accounting as an international statistical standard (United Nations (UN), 2014). Relying on monetary indicators clearly has advantages. Approaches based on national accounting are easily understandable because of their proximity to standard measures, and they can be compared across time and space. Using economic theory as an entry point can improve accessibility but can lead to reliance on strong assumptions [27]. And despite statistical improvements, reliable valuation methods are limited, and criticisms connected to the incommensurability of values apply [28].
Composite indices address these concerns by including non-monetary indicators, often resulting in diverse and large indicator sets, which are then aggregated into a single number. Many composite indices exist, some specialised in one or two sustainability dimensions, and some in all. Indices focused on environmental sustainability include the WWF Living Planet Index [29], the Environmental Vulnerability Index [30], the Environmental Sustainability Index [31], and the Environmental Performance Index [32], the latter two both published by the Universities of Yale and Columbia. Osberg and Sharpe focus on economic sustainability [33], while the rest of the composite indices in Appendix A try to capture economic, social, and environmental sustainability. Others have added institutional sustainability as a fourth dimension [34]. The selection of indicators usually comes down to policy priorities and data availability. Extensive indicator baskets can limit the available time horizon or general comparability across time and space. The latter can also be affected by changes in methodology, as is the case for the ESI and HDI (the United Nations Development Programme [35]. Some indices were not published for more than a few years [30,36]. The inclusion of different units of measurement means that decisions must be made when aggregating. Most studies employ equal weights, acknowledging that finding an expert consensus is likely impossible [15]. The EPI employs varying weights based on policy objectives [32], changing from edition to edition, limiting cross-temporal comparisons. Whether average or varying weights are chosen, some arbitrariness remains. Only Osberg and Sharpe address this issue by applying equal and alternative weights, illustrating varying priorities. Because of the weighting issues, as well as the complex indicator sets, the composite indices can seem quite abstract [33].
Footprints can be easier to grasp. Like approaches based on national accounting, footprints present their result in one concrete common unit, be it hectares, GHG emissions, or emitted light energy. The most elaborate example is the Ecological Footprint (EF), at its core representing water and land use associated with consumption and waste absorption, boiled down to a single number. EFs can be calculated on any scale, for example, nationally and globally [37]. By comparing the global EF with Earth’s carrying capacity, the EF becomes an indicator of global overconsumption. Even though the EF’s message is easily understood, its calculations are still quite complicated and can suffer from a lack of data in certain countries and a high correlation with CO2 emissions [38]. These issues are the reason why some have proposed the Carbon Footprint [39] as a more practical indicator to assess overconsumption [25]. Instead of land and water use, the CF represents GHG emissions associated with consumption categories. A third example comes from Sutton, who puts emitted light energy in relation to a country’s value of ecosystem services, thus comparing a proxy for consumption with a proxy for biocapacity [40]. Sutton also shows that his index is closely correlated with the EF, but not with the ESI, highlighting that sustainability measures can be contradictory and might measure entirely different aspects. Footprints give an easy indication of overconsumption. While they might be easier to understand than composite indices, they could be less useful for policy purposes. In the case of the EF and the CF, they can show which sectors are especially intensive in land use or GHG emissions, but they cannot be disaggregated into the complex processes that they try to capture as easily as most composite indices.
Non-integrated baskets are a direct answer to the weighting issues inherent to composite indices, while maintaining the possibility to include a wide variety of indicators. One contemporary example is the assessment based on SDGs (the European Commission (EC), the Statistical Office of the European Union, 2022). With 101 indicators and without the practical overview provided by a composite index, such an assessment can seem overwhelming, which is why others have argued for non-aggregation with a compact indicator set [14,25]. Stiglitz et al. [25] argue for a separation of the assessment of current well-being and sustainability, and of economic and environmental sustainability. They see aggregated measures such as GS or EF as possible parts of a “dashboard”, but not as an overall assessment of sustainability. By only looking at indicators for one dimension of sustainability, weighting becomes less of an issue. Whoever is reading the presented data can do so according to their policy priorities. Cognizant of these priorities, Mascarenhas et al. select their basket according to questionnaires with stakeholders [41]. Compared with composite indices, non-aggregation makes strong sustainability criteria possible [42]. If there is a critical stock of natural capital, then the indicator basket can simply be interpreted accordingly, without a composite index muddying the waters. By avoiding some of the issues of composite indices, non-integrated baskets sacrifice immediate readability and overall comparability across space and time. The non-integrated baskets listed in Appendix A do not cover a very long time horizon.
Trade-offs always exist when choosing a method to assess current well-being, sustainability, or both. Approaches based on national accounting allow for a strong foundation in economic theory and easier comparisons, but are problematic because the valuation of the environment can be hard or impossible. A larger basket means more nuance, but less comparability across time and space and weighting issues if aggregated. A more focused approach can mean decreased usefulness for policy purposes and exclusion of at least one of the three dimensions of sustainability. Different methods address the problems of other methods, but are connected to new shortcomings. Some have combined existing indices to obtain a more complete picture [43]. In our own work, we addressed weighting issues by employing multicriteria decision aid (MCDA) with varying weights to allow for analysis from different policy standpoints [28,44]. Overall, no approach has maintained coverage of all three major dimensions of sustainability, with broad cross-temporal and cross-country comparisons, while sufficiently addressing weighting issues. Osberg and Sharpe [33] analyse alternative priorities, but their approach is limited to economic sustainability. GS/ANS approaches can cover a long time horizon and have no issues with arbitrary weighting, but their reliance on monetary indicators limits their coverage of environmental sustainability, and their models rely on strong theoretical assumptions [27]. Any measure using a large indicator basket sacrifices some comparability across time and space, either because indicators are not available or statistical capabilities vary between countries or across time, making comparison difficult. The index proposed in this paper uses a set of indicators that is compact enough to enable broad cross-country and cross-temporal comparisons and is varied enough to capture all three dimensions of sustainability. To circumvent weighting issues, data for different policy alternatives are presented. The result can be easily disaggregated into its components, providing a useful basis for policy analysis.
3. Methodology
Our methodology of multidimensional assessment of sustainability (Figure 1) rests on previous work applying multicriteria decision aid for dynamic sustainability assessment [28,44,45]. The largest element of novelty in the present research is the simultaneous assessment of several countries based on multiple sustainability indicators covering the extended period of 1960–2015. The assessment forms part of the UNIVERSE modelling complex, where each of the indicators for each country constitutes a separate dynamic econometric model similar to the research performed by Shmelev and Speck [46].
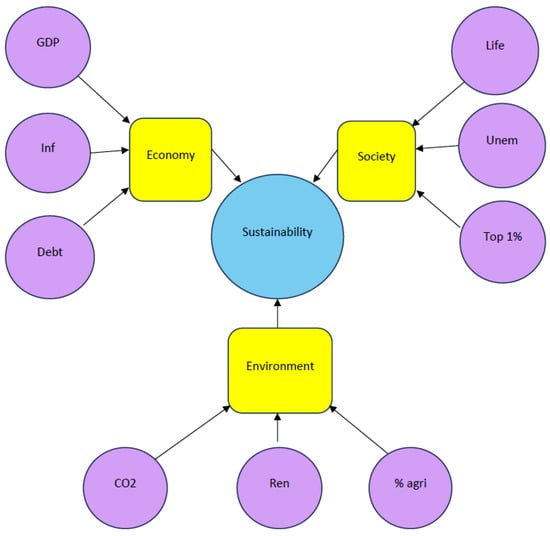
Figure 1.
Sustainability assessment methodology.
The selection of 14 countries in our sample—USA, China, Japan, Brazil, Sweden, Switzerland, Norway, Turkey, Canada, Austria, France, Germany, Denmark, and the Netherlands—is far from random, reflecting a strategic choice that captures a representative share of global economic activity, sustainability policies, and environmental impact. Focusing on economic dimensions, the sample accounts for over 62% of global GDP (2023), with major economies such as the USA (26%), China (16.9%), Japan (4.2%), Germany (4%), and France (2.9%) leading the global economy. The mix of advanced economies represented by the OECD countries and emerging economies (China, Brazil, and Turkey) ensures a balanced comparison of sustainability progress across different developmental stages. Including smaller high-performing economies like Switzerland, Sweden, and Norway provides insight into innovative sustainability policies. Examining environmental dimensions, the USA and China alone account for over 45% of global CO2 emissions, making them critical for understanding sustainability trends [47]. Japan, Germany, Canada, and France are among the largest industrialised economies with major environmental impacts. Sweden, Norway, and Switzerland are recognised for their leadership in environmental sustainability and renewable energy [48]. Brazil is essential as a leader in biodiversity and renewable hydropower, but also a key player in deforestation and land use change. From the policy diversity and institutional model perspective, the countries selected represent a variety of economic and governance models: the Nordic countries of Sweden, Norway, Denmark are strong welfare states with leading sustainability policies; the Anglo-Saxon model liberal economies of the USA and Canada apply market-driven sustainability approaches; the Continental European countries of France, Germany, the Netherlands, Austria, and Switzerland use mixed economic models with high environmental standards; and the emerging economies of China, Brazil, and Turkey exhibit rapid growth and contrasting sustainability challenges. This study includes countries from North America, Europe, East Asia, and South America, covering a wide geographic and climatic diversity. The mix of high-income, middle-income, and rapidly developing nations allows meaningful cross-country comparisons. The selection of countries was driven by data availability, as constructing a consistent dataset of nine key sustainability indicators from 1960 to the present was not feasible for many nations, including Mexico, most of Africa, and Indonesia, making our final choice both necessary and analytically robust.
Assessment of sustainability is, essentially, a multidimensional assessment problem, bringing together economic, social, and environmental aspects of the development process. This is why multicriteria decision aid (MCDA) tools [49] are best suited to assess performance. In this study, we adopt an elegant MCDA methodology of linear aggregation with weights, with one peculiarity. We change weights expressing varying policy priorities for environmental, social, or economic dimensions, similar to how it has been carried out for cities in the studies by Shmelev [50] and Shmelev and Shmeleva [50,51,52,53].
The selection of indicators in our research was dictated by years of experience and the desire to cover as long a time period as possible (1960–2015), at the same time covering all sustainability dimensions in equal measure. The final set of indicators includes the following (Figure 1): the GDP per capita at purchasing power parity, the inflation rate, and debt-to-GDP ratio, representing the economic dimension; life expectancy, the unemployment rate, and the share of the top 1% of income, representing the social dimension; and, finally, CO2 emissions, the share of renewable energy, and the % of agricultural land, representing the environmental dimension. We kept the balance between the dimensions clear by using three indicators in each, since the composition of the basket of indicators is a political choice that will influence the result, and we wanted all the dimensions to be represented in equal measure. The percentage of agricultural land is a useful proxy for biodiversity loss because the expansion of agriculture often leads to habitat destruction, fragmentation, and the replacement of native ecosystems with monocultures, all of which significantly reduce species richness and ecological integrity [54]. The share of income held by the top 1% serves as a clear measure of income inequality, capturing the concentration of wealth among the highest earners and reflecting how unevenly economic gains are distributed across society.
All data were normalised and are expressed as numbers projected onto the [0:1] interval, with larger values representing the better values of the indicator, taking into account the preference to maximise or minimise this indicator. Normalisation was carried out across the whole set of values of each indicator across the whole set of countries, with the worst value being projected to 0 and the best to 1 on the [0:1] scale. The varying policy priorities are expressed by changing weights, with a weight of 0.5 given to the priority dimension and 0.25 to each of the remaining dimensions and the individual weights of indicators obtained by dividing the dimension weight by 3 (the number of indicators in each dimension).
Using such global normalisation, we were able to compare the performance of several countries on the same scale under economic, environmental, and social priorities and equal weights scenarios. Most of the data came from the [55]. There are multiple methodological issues related to the quality of environmental and social data at the macro level that should be mentioned here. We would have loved to be able to use consistent data for the Gini Index of income inequality for all countries for the period of 1960–2015; however, this was not possible to obtain at the time of publication. Equally, we would have loved to use long time series data on biodiversity, e.g., bird index data; however, such data were not available for the whole period under consideration, so we had to resort to a proxy of % of agricultural land. When this indicator increases, we assume that the % of forest and the biodiversity present there declines. At the same time, we would have loved to use a consistent dataset on recycling rates for 1960–2015 for all countries; however, this was not available either. Of the whole plethora of sustainability indicators recommended by the SDG methodology, there are still persistent gaps that limit the evidence-based, comprehensive analysis of policies with long time horizons similar to the one adopted in this paper. One exception is the study by Shmelev and Speck [48], which used a comparable dataset starting in 1960 and applied an econometric model to study the real-life impacts of carbon and other environmental taxes on CO2 emissions in Sweden.
4. Analysis
The results of our analysis can be seen in the four graphs below, displaying developments across our sustainability basket, aggregated into a composite index. Each graph covers the indices of 14 countries from 1960 until 2015, with varying weights for the different dimensions of sustainability. Figure 2 shows the results for equal weights, while Figure 3, Figure 4 and Figure 5 each prioritise one dimension over the others, as we have laid out above. In the following section, we will analyse the stories that these graphs tell about sustainability across economic, social, and environmental dimensions, and across time. For brevity’s sake, we will focus on seven countries, enough to offer some interesting takeaways and demonstrate the strengths of our dashboard.
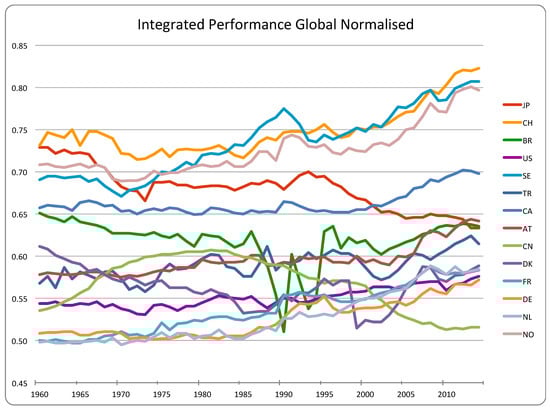
Figure 2.
Integrated Sustainability Performance Index: 12 OECD countries, China, and Brazil in 1960–2015 (equal weights). Source: authors’ calculations.
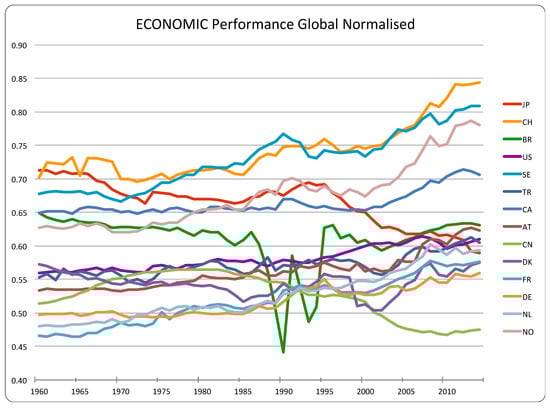
Figure 3.
Integrated Sustainability Performance Index: 12 OECD countries, China, and Brazil in 1960–2015 (economic priorities). Source: authors’ calculations.
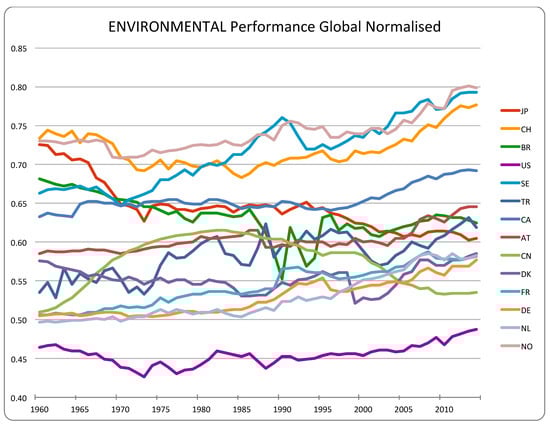
Figure 4.
Integrated Sustainability Performance Index: 12 OECD countries, China, and Brazil in 1960–2015 (environmental priorities). Source: authors’ calculations.
Figure 5.
Integrated Sustainability Performance Index: 12 OECD countries, China, and Brazil in 1960–2015 (social priorities). Source: authors’ calculations.
With equal weights, three clear top performers are identifiable: Switzerland, Norway, and Sweden. Two countries come close, with Japan performing well early on and dropping off afterwards, and Canada, characterised by a stable and recently improving curve. These two are joined by Austria and Turkey as countries whose integrated performance stays above 0.55, with both showing an overall improvement. Countries whose integrated performance drops below 0.55 in some phases are Brazil, Denmark, Germany, the Netherlands, France, China, and the USA. Developments in these countries are varied. Germany, the Netherlands, and France start out from a similarly low level but achieve steady and significant improvement with time. Improvement in the US is observed, but is smaller, while China, Brazil, and Denmark experience especially high variance.
Observing these overall trends, some interesting questions emerge. What is driving the positive developments among the top performers? Why are the curves of France, Germany, and the Netherlands so similar, while developments in Denmark have been more up and down? What explains China’s rise and fall? What went wrong in Japan and in Brazil in the 1980s and 1990s? Looking at the results with varying weights in Figure 3, Figure 4 and Figure 5 provides hints at some answers. Brazil’s up-and-down performance is most pronounced with economic prioritisation, suggesting that the main drivers of overall performance in this time period come from this dimension. Figure 3, Figure 4 and Figure 5 produce more questions, for example, why the US performs so badly under environmental prioritisation. To clear things up, we will take a closer look at seven individual countries.
4.1. The USA
The evenly weighted index for the US has improved slowly but steadily, with signs of stagnation in recent years. This overall trend can be seen under economic (Figure 3) and social prioritisation (Figure 5), with the former showing a relatively larger improvement, although at a lower level. With environmental priorities, the overall development is still slightly positive (especially in recent years), but the improvement has been less steady and is a negative outlier in international comparison.
For economic indicators, positive trends for GDP and negative trends for debt roughly cancel each other out, while inflation has seen some ups and downs, but has been stable on average. Both debt and inflation have increased as a result of the financial crisis and explain some of the stagnation in overall and economic performance since 2008. The overall stability of economic indicators hints at the high priority that political decision-makers in the US place on the mitigation of economic crises. The smaller improvement under social prioritisation is accounted for by a relatively high level across social indicators in the beginning and recent negative trends in the top 1% income share, which mirrors widely discussed increases in inequality [55]. Unemployment has been up and down, in line with economic crises.
It is clear that sustainability indicators are shaped by crises. Following a recession in the 1960s, carbon emission reductions were not a high priority. Then and now, CO2 emissions per capita remained at nearly double that of the OECD average [56], driving the negative performance trend (Figure 3). Growing environmental awareness in the late 1960s and early 1970s produced some environmental improvements, but momentum was lost again by the early 1980s [57,58]. Since the 2000s, however, more significant improvements can be seen in a slow decrease in per capita CO2 emissions and an increasing share of renewables, suggesting that policy priorities can shift not just as a result of economics, but also because of the environmental crisis. Symptoms of the growing political will to address environmental problems can be seen recently in the Obama and Biden administration, but progress was neither easy, because of opposition from the Republican party, nor linear, as the Trump administration rolled back policies and withdrew from the Paris Climate Agreement in 2017 [59]. Beyond changing administrations, a contributor to the temporary decrease in environmental performance after 2008 could also be changing public attitudes amidst increasing unemployment, which has been shown to be closely correlated with shifting priorities away from environmental goals [60].
4.2. Brazil
Overall, Brazil’s performance has slightly declined, with a drastic up and down in the 1990s, which was especially pronounced under economic prioritisation. Under environmental priorities, performance starts at a higher level but decreases by the largest margin, while with increased weights for the social indicators, the graph is more stable, and even increases slightly.
As the severity of the up and down under economic prioritisation (Figure 2) suggests, its main drivers are debt and inflation. Debt was high as a result of the 1970s oil crisis, contributing to rising inflation. Additionally, it has been shown that Latin American countries such as Brazil that re-democratised after 1980 tended to pursue populist policies that further increased inflation, eventually leading to hyperinflation in the early 1990s [61,62]. The economic turmoil was eventually addressed by the “Plano Real”, which introduced a new currency, increased government revenue, and re-established some of the national government’s control over the fiscal policies of the federal states, which had contributed to the rise in inflation [61]. Although new problems have emerged, the “Plano Real” is one of the main reasons why sustainability performance in Figure 2 has been improving since the early 2000s.
The relatively strong performance under environmental prioritisation (Figure 4), as well as the relatively large decrease, is driven by Brazil’s share of renewables and CO2 emissions. Motivated by supply shortages from non-renewables such as the oil crises, Brazil’s energy mix has been clean in international comparison, with large hydropower and sugarcane energy capabilities [63], hovering at around 50% renewable energy consumption out of total consumption, as opposed to below 15% for OECD members [56]. Even though CO2 emissions have grown and are the main factor explaining the performance decrease under environmental prioritisation, Brazil’s per capita carbon emissions are still much lower than the OECD average and, in 2015, were nearly five metric tons below those of China [56]. The emission changes in Brazil also differ from China’s and the world average in that they have been closely linked to changes in the energy mix and carbon intensity, rather than energy intensity [63].
Lastly, the relative overall stability and slight improvement under social prioritisation (Figure 5) since the mid-2000s relative to the developments under environmental priorities can be explained by small-to-moderate improvements across the social indicators. Life expectancy has steadily increased due to growth and a range of social reforms that have reduced poverty and improved inequalities in regard to access to education and healthcare [64]. Despite these improvements, income inequality is still high in international comparison, and the top 1% income share was rising until 2008 and has decreased only slightly since [65]. On a positive note, due to the successful economic recovery from the turmoil of the 1990s along with increased formalisation [66], Brazil managed to break an upwards trend in unemployment that had been going on until the late 1990s, decreasing the total unemployment rate from 11.13% in 1999 to 6.76% in 2014 [56].
4.3. Japan
Japan is the country with the largest overall decrease in the sustainability index, which plateaued between the middle of the 1970s and 1990s. Under economic prioritisation (Figure 2), this decline was steeper after 1995, and under environmental priorities, since 1975 (Figure 4). With increased weights for social indicators, the decrease was much smaller than for the other prioritisations (Figure 5).
Japan’s overall sustainability decline is driven by both economic and environmental indicators. While economic conditions were somewhat stable until the early 1970s, growth-driven CO2 emissions were increasing rapidly in this timeframe [67], explaining the steeper curve before 1975 in Figure 3. While emissions still rose overall until the 2000s, a governmental crackdown on polluting companies in 1973 managed to stabilise emission growth [67]. With CO2 emissions stabilising, the main drivers of the performance decline after 1995 were stagnating growth and increasing government debt. After decades of steady growth brought on by export-driven development [68], growth has slowed down since 1995, and government debt has increased in an effort to mitigate the negative effects of potential stagnation. Explanations for this stagnation range from the slowing of productivity growth [69,70], declining exports [70], and China’s expansion [69] to a currency appreciation against the USD [71]. Especially, Japanese manufacturing struggled to stay competitive in light of the growth of other Asian economies [70]. Traditional tools to reinvigorate the economy have been ineffective in the context of very low inflation or deflation, which has led to arguments for the existence of a Japanese liquidity trap [72].
In contrast with the relatively large performance decline from an economic and environmental viewpoint, the trend under social prioritisation has been less steep. While unemployment has recently increased to over 5% due to the economic slowdown discussed above, Japan’s economy is equal in comparison with the US and the European average [73], with the top 1% income share remaining under 10% due to the basis of large capital incomes being removed during World War 2 and occupational reforms, as well as progressive taxation, and collective bargaining later on [74]. As for most other developed countries, life expectancy has steadily increased, explaining the relative stability of the graph in Figure 5.
4.4. Sweden
Sweden, alongside Norway and Switzerland, stands out as one of the top performers in sustainability, maintaining consistently high scores across economic, social, and environmental dimensions. After a modest start in the 1960s, Sweden has achieved steady and sustained improvements, with a brief setback in the early 1990s. Its performance remains especially strong under social prioritisation, reflecting the country’s enduring commitment to equality, inclusion, and public welfare (Figure 5), while the other two see larger improvements, although at a slightly lower level.
Sweden’s slower initial progress is largely attributed to moderate economic growth and rising CO2 emissions during the postwar decades. However, the emergence of environmental awareness—accelerated by the oil shocks of the 1970s—spurred significant institutional and policy reforms. The establishment of the Environmental Protection Agency in 1967 and the Environmental Protection Act in 1969 marked the beginning of a systematic environmental governance approach.
A landmark event was the 1972 United Nations Conference on the Human Environment, held in Stockholm, which launched the global environmental agenda and led directly to the creation of the United Nations Environment Programme (UNEP). In parallel, Sweden undertook pioneering efforts in urban sustainability, including the pedestrianisation of central districts in Stockholm, Malmö, and Gothenburg, measures that significantly reshaped mobility patterns and reduced urban emissions.
Compared with its Western European peers, Sweden’s environmental consciousness entered the mainstream relatively early [75]. This led to substantial investments in hydropower, nuclear energy, and environmental protection, with significant emission reductions and an increased share of renewables achieved, which, along with faster growth, accounts for the improved overall performance. Declining CO2 emissions have remained as one of the drivers of progress (Figure 3), driven by a mix of technological improvements in hydro and nuclear power, carbon taxation, and, especially, energy taxes on coal and gas [46].
The country’s success has also been underpinned by a highly open economy with a strong focus on research, development, and innovation. Sweden’s globally recognised firms exemplify this trajectory: Volvo, known for its leadership in vehicle safety and durable engineering; Hasselblad, a pioneer in high-end imaging technology and innovation; and IKEA, which built its brand not only on affordable design but also on sustainability, circularity, and reuse of sawmill waste in its early furniture lines. These companies reflect Sweden’s ability to integrate sustainability, economic competitiveness, and global cultural influence.
The temporary performance decline in the 1990s is due to the economic crisis in the early 1990s, produced by the financial deregulation of the 1980s [76] and triggered by a rapid drop in real estate prices [77], which produced a decrease in GDP, rising inflation, and high unemployment [78]. The recovery was kick-started when the krona changed to a floating exchange rate, leading to a sharp depreciation and subsequent export-driven growth [79,80]. This paved the way for further improvements across our sustainability criteria, brought on by strong growth, low inflation, and decreasing CO2 emissions, the latter promoted by an economy in which the main employing sectors are also insignificant contributors to economy-wide CO2 emissions [47].
With the resolution of the crisis, which has generally been deemed to be an example of good crisis management [80], unemployment returned to a low level, which, together with low inequality, contributes to Sweden being one of the top performers overall, and especially strong under social prioritisation. The reasons for the strong social performance of Sweden, specifically, and Scandinavian countries, generally, have been linked to the existence of a pragmatic, consensus-based social democratic “Nordic model”, which has managed to use the growth of its economy as a facilitator of a comparatively equal society with strong unions, small wage differentials, and effective cooperation between major societal actors [73,81].
4.5. China
China, despite impressive economic growth, is one of the countries that has experienced a classic case of a turning point [44]. Unlike Japan, however, conditions were improving before 1985, and, unfortunately, the massive economic growth after economic reforms has not brought with it overall sustainability improvements within the timeframe of this research (Figure 2, Figure 3, Figure 4 and Figure 5). Across prioritisations, significant differences can be observed: both the economic and social prioritisations show a decline after 1985, at a much lower level for the former than the latter. From an environmental viewpoint, conditions peaked in the mid-1980s.
The positive picture pre-1985 is characterised by low inflation, which returned to these levels after a large spike as a result of the “Great Leap Forward” [82], relatively low CO2 emissions due to a largely non-industrial economy, growing life expectancy, and low inequality [83]. Economic reform in 1978, which brought partial liberalisation while preserving strong state capabilities, unlocked rapid GDP growth in the following decades [84]. Many authors have discussed other drivers behind these developments, ranging from physical and human capital accumulation [85,86], growing productivity [86,87], and institutional change [88]. Others have argued that the extent of Chinese growth might have been overstated due to under-reported inflation [89]. The positive developments in GDP were accompanied by a mixed picture for our other sustainability indicators. Brought on by the newfound economic autonomy and large government expenditures, inflation saw upward spikes at the end of the 1980s into the mid-1990s and stabilised afterwards. Debt has been increasing gradually, explaining the overall decrease in performance under economic prioritisation (we need to see data to make sure that this is true). Increasing unemployment until 2006 because of job losses in state-owned enterprises, as well as a relaxation of the hukou system, which had kept rural workers out of urban employment [90], accounts for part of the similar decrease under social prioritisation. Additionally, the top 1% share of income has been steadily increasing because of unequal access to education, urbanisation, and a growing skill premium [91].
In contrast, under environmental prioritisation, developments have been mixed and complicated by the fact that China’s most sustainable sectors provide relatively little employment in comparison with countries such as Sweden, Germany, and the US [47], and China has yet to phase out coal to fully decarbonise. Still, renewable energy capacities have rapidly increased, indicating a significant shift in government priorities [92]. While energy efficiency and consumption patterns have become more sustainable, CO2 emissions have steadily grown and slowed down only recently, reflecting further political commitments, but there has also been a slight slowdown in growth [93].
4.6. Germany
Along with the neighbouring Netherlands and France, Germany’s performance has steadily improved, although at a relatively low level. This steady increase can be seen both with economic and environmental prioritisation, while developments under social priorities have been slightly more unsteady. After an initial decline in performance until 1985, and excluding a temporary decrease in 1995, a strong upward trend has meant that performance with social priorities is now the strongest out of the three sustainability dimensions.
Most indicators in our basket have improved, either steadily or with some ups and downs. The latter applies to GDP, which has grown in three major surges, with stagnation or an up and down at the end of each. The early 1980s saw an economic downturn due to the 1979 oil shock [94], and in the early-to-mid-1990s, reunification brought on the so-called consolidation crisis [95], and the recession was worsened by the burst of the “dotcom” bubble [96]. The negative effects of the financial crisis in 2008 were large, but the recovery was swift because of a resilient labour market and the flexibility of fiscal policies [97]. While debt has increased, developments for CO2 emissions and the share of renewables have been positive, driven by a decreasing energy intensity [98] and a gradual move away from coal [99], although per capita emissions remain high.
While Germany is widely recognised as a technological leader and a model of industrial efficiency, it is important to acknowledge that many of its leading companies carry complex and troubling historical legacies. Firms such as Siemens, Volkswagen, Daimler-Benz (now Mercedes-Benz), BASF, Bayer (formerly part of IG Farben), and Bosch were deeply embedded in the Nazi war economy. These companies not only supported the regime through military production but also made extensive use of forced labour, including civilians from Eastern Europe who were often subjected to inhumane conditions and, in many cases, worked to death. IG Farben, the chemical conglomerate that was later split into several major firms, produced Zyklon B, the gas used in extermination camps, and operated facilities adjacent to concentration camps such as Auschwitz [100,101]. Hugo Boss manufactured uniforms for the Wehrmacht, SS, and SA, further illustrating the extent of industrial collaboration with the Nazi regime. These historical realities must be acknowledged in any honest assessment of long-term development trajectories.
It is, however, equally important to recognise the profound transformation that has taken place in Germany since the war. Between 1995 and 2011, our earlier research shows a remarkable and harmonious simultaneous improvement in economic, environmental, and social performance, positioning Germany as a leading example of integrated sustainable development [44].
In the decades following reunification, Germany has emerged not only as a technological and economic powerhouse but also as a global leader in renewable energy and environmental innovation. Central to this transformation is the Energiewende (“energy turnaround”), a comprehensive national strategy launched in the early 2000s with the dual goals of decarbonising the energy sector and phasing out nuclear power.
The roots of this transformation lie in the Renewable Energy Sources Act (EEG) passed in 2000, which introduced feed-in tariffs guaranteeing above-market prices for renewable electricity fed into the grid. This policy mechanism provided long-term investment security and sparked exponential growth in solar photovoltaic (PV), onshore wind, and later offshore wind installations. Germany’s decentralised ownership model—where hundreds of thousands of citizens, farmers, and cooperatives invested in solar and wind—helped democratise the energy landscape and stimulated local economic development.
By 2020, Germany had increased its renewable share in gross electricity consumption from just 6% in 2000 to over 42%, and by 2023, renewables accounted for almost 52% of electricity generation. Wind energy has become the largest single source, followed by solar PV and bioenergy. The transition has also generated hundreds of thousands of jobs, especially in the manufacturing and services sectors around wind turbines, solar panels, grid technology, and energy efficiency. This transformation was further accelerated by the 2011 decision to permanently phase out nuclear energy in the wake of the Fukushima disaster, a socially driven policy shift that underscored Germany’s commitment to a sustainable and risk-averse energy future.
Germany’s success has been underpinned by strong policy continuity, robust public support, long-term vision, and significant technological innovation, particularly in grid integration, storage, and demand-side flexibility.
4.7. Denmark
In contrast with its German and Swedish neighbours, Denmark’s performance has fluctuated significantly. A large decline from 1960 to 1985 was followed by improvement until 1995, then a rapid drop to an all-time performance low, and finally relative stability. As a result of this up and down, Denmark’s integrated basket of indicators has slightly declined. While the fluctuations are less extreme under economic and environmental prioritisation, social indicators seem to be the drivers behind the ups and downs.
Denmark’s economic indicators look similar to both Germany’s and Sweden’s, with clear growth overall, and downturns in the early 1980s, late 1990s, and after 2008. Inflation was high in the 1970s because of large fiscal expenditures to maintain employment during and after the oil crisis, but was reined in by a conservative government that introduced a fixed exchange rate in the 1980s, which has been identified as one of the reasons for the remarkably low inflation ever since [102]. In a North and Central European comparison, Denmark’s debt has remained relatively low, again initiated by the conservative political swing in the early 1980s [102,103]. Thus, low inflation and debt account for most of Denmark’s good economic performance in comparison with Germany.
Under environmental prioritisation (Figure 5), Denmark also outperforms Germany, except for a temporary decrease in the late 1990s. With steady improvements in agricultural land and the share of renewables, CO2 emissions are the main drivers behind fluctuations. Emissions were up and down until 1990 and increased to a peak by the end of the decade, explaining the overall decline in Denmark’s curve until the late 1990s. Motivated by the oil crisis in the 1970s, political will to achieve energy self-sufficiency, especially through renewable energy, existed much earlier [104], but only a fundamental restructuring of the heating system and energy sector brought on long-term emission reductions [105]. Despite improvements, it should be noted that research has shown that modelling Denmark’s emissions while including GHGs connected to traded goods might reduce the significance of improvements [106].
Denmark’s overall decline under social prioritisation is driven by increasing income inequality, while changes in unemployment account for the comparatively large fluctuations. With a Palma ratio of below 1, Denmark’s income is distributed quite equally in international comparison [105]. At the same time, the top 1% income share has been increasing [107]. While some growth-oriented policies may have exacerbated the developments, rising inequality is likely tied to global trends, which have seen a growing gap between wages for lower-skill and higher-skill work as well as increasing capital incomes [108]. In addition to economic stagnation and a spike in CO2 emissions, the steep downward trend at the end of the 1990s is connected to peaking unemployment around that time. The same goes for the following recovery, where a mix of new labour market policies, training programs, more effective trade unions, and increased participation of women, combined with an economic upswing, produced an “employment miracle” [109]. The shape of Denmark’s graph in Figure 4 then develops in line with a spike in unemployment due to the 2008 financial crisis and the subsequent recovery.
Denmark stands out globally as a pioneer in the transition to renewable energy, having strategically leveraged its early investments in wind technology to build a highly resilient, low-carbon energy system. Beginning in the 1970s as a response to the oil crisis, Denmark committed to reducing its dependence on imported fossil fuels through aggressive support for wind power. This commitment was reinforced by strong public ownership models, local co-operatives, and a supportive regulatory environment that prioritised grid integration and innovation. By 2023, Denmark generated over 55% of its electricity from wind alone—the highest share in the world—and over 80% from renewables overall, including bioenergy and solar. A particularly striking dimension of Denmark’s success is the transformation of its national energy company, Ørsted (formerly Danish Oil and Natural Gas, or DONG Energy), which once derived over 85% of its revenue from fossil fuels. Over the past two decades, Ørsted has undergone a radical restructuring, divesting from coal and upstream oil and gas assets, and repositioning itself as the global leader in offshore wind. Today, Ørsted operates major offshore wind farms in Europe, Asia, and North America and aims to be carbon-neutral in energy generation and operations by 2025, a target unmatched by any major energy firm. Denmark’s success demonstrates how even fossil fuel-intensive utilities can be transformed through a combination of policy consistency, technological leadership, public trust, and market mechanisms. The Danish experience not only exemplifies national decarbonisation performed right but also offers a replicable model for how to align industrial strategy with climate objectives while maintaining economic competitiveness and social consensus.
4.8. Norway
Norway’s sustainability performance stands out as exemplary among OECD countries, driven by its robust use of hydropower and a deep commitment to renewable energy. Hydropower contributes the vast majority of Norway’s electricity, resulting in an exceptionally high renewable energy share of 57%, far surpassing the OECD average and significantly reducing its per capita CO2 emissions to just 7.52 tonnes, nearly half that of the United States. In addition to this, Norway has demonstrated spectacular progress in electric vehicle (EV) adoption, becoming a global leader in EV penetration due to strong governmental incentives, infrastructural investments, and societal commitment to decarbonisation.
The Norwegian EV revolution has been underpinned by a comprehensive and long-standing policy framework. Since the early 1990s, Norway has introduced a generous package of incentives to encourage EV uptake, including exemption from VAT (25%), no import taxes, access to bus lanes, toll waivers, free or discounted public parking, and reduced annual road tax. These policies, combined with Norway’s high fuel taxes and widespread environmental awareness, made EVs economically attractive and socially desirable well before mass adoption began elsewhere.
By 2025, EVs accounted for more than 80% of all new car sales, a figure unmatched globally. This transition was further facilitated by significant public investment in charging infrastructure, supported by national and municipal governments. Norway now boasts one of the most dense and reliable charging networks in Europe, including widespread fast chargers even in remote and rural regions, making EV ownership viable across the entire country.
Importantly, Norway’s EV transition is made even more sustainable by the nearly emission-free electricity that powers its grid. Unlike countries where EVs may rely on coal-heavy grids, Norway’s hydropower dominance ensures that EVs contribute almost no lifecycle emissions from electricity use. This synergy between clean generation and clean mobility makes Norway a model of integrated sustainability in transport and energy.
Public attitudes and grassroots environmentalism have also played a crucial role. Norwegian consumers have embraced EVs not just for financial reasons but out of a growing cultural preference for sustainable lifestyles. Municipalities have further reinforced the transition by prioritising low-emission zones, improving bike and pedestrian infrastructure, and planning for car-free city centres, particularly in Oslo and Bergen.
Beyond passenger vehicles, Norway has begun to electrify public transport and even maritime shipping, including the world’s first fully electric car ferries and electric short-haul aircraft pilots, pointing to a deep structural transformation of the entire mobility system. Taken together, these achievements reflect not just technological progress but the effectiveness of a coherent, cross-sectoral national strategy for decarbonisation.
Norway’s sustainability leadership is not only grounded in its extensive use of hydropower—accounting for nearly all of its domestic electricity—but also in its forward-looking financial strategy, anchored by the Government Pension Fund Global (GPFG). Managed by Norges Bank Investment Management, the GPFG is the world’s largest sovereign wealth fund, with assets exceeding USD 1.6 trillion in 2025. Funded by surplus revenues from Norway’s oil and gas sector, it represents a globally admired model of converting finite fossil wealth into enduring financial assets for the benefit of future generations. The fund is governed by a strict ethical investment mandate, excluding companies involved in severe environmental harm, human rights violations, coal, tobacco, and controversial weapons. It has increasingly shifted capital towards renewable energy and sustainable infrastructure, although it still maintains partial holdings in traditional energy sectors, a point of ongoing public debate. Combined with Norway’s spectacular success in electric vehicle adoption, strong environmental governance, and widespread social cohesion, the GPFG underscores how Norway unites ecological responsibility, economic prudence, and intergenerational justice in its sustainability model.
4.9. Switzerland
Switzerland ranks at the very top of sustainability assessments due to a unique combination of institutional strength, environmental stewardship, technological innovation, and social cohesion. Its deep-rooted democratic governance, characterised by a highly participatory system of direct democracy and federalism, has ensured long-term policy stability and citizen trust, critical enablers of sustainability. This institutional model, with origins stretching back to the 13th century, fosters a high degree of accountability and consensus-based policy making.
Economically, Switzerland is a global financial powerhouse, home to one of the world’s leading investment and banking sectors, with an emphasis on stability, ethical finance, and long-term wealth preservation. A defining feature of the Swiss financial system today is its growing commitment to sustainable finance, with environmental, social, and governance (ESG) criteria now embedded across much of the sector. As of 2023, over 50% of all Swiss investment funds qualified as ESG-compliant, with ESG products accounting for a remarkable 87% of net new inflows. Institutional investors dominate, but retail clients are increasingly drawn to ESG-aligned portfolios, and banks have introduced mandatory sustainability preferences in investment advisory. Major institutions such as Lombard Odier and Pictet report that 40–50% of their assets under management are ESG-aligned, while Zurich Cantonal Bank has issued over CHF 1.5 billion in green bonds. This shift, reinforced by self-regulatory frameworks from the Swiss Bankers Association, underscores how sustainability is becoming structurally embedded in Swiss finance.
The country boasts a strong innovation ecosystem, led by world-renowned institutions such as ETH Zurich and EPFL, which drive cutting-edge research in clean energy, environmental science, and sustainable urbanism. Geographically, Switzerland benefits from abundant hydroelectric resources thanks to its alpine topography, enabling it to generate over 60% of its electricity from hydropower, making it one of the cleanest energy producers per capita in Europe. The country’s exceptional public transportation system—a vast, punctual, and interconnected rail network—reduces reliance on private vehicles, further lowering emissions while enhancing social equity and mobility.
Switzerland also plays a significant global diplomatic and sustainability role, hosting numerous international organisations, including the United Nations Office at Geneva, the World Health Organization, and the Intergovernmental Panel on Climate Change (IPCC). This institutional density strengthens its influence in shaping global sustainability norms. Domestically, Switzerland combines high life expectancy and low inequality with fiscal responsibility, maintaining low public debt and strong macroeconomic fundamentals that enable sustained investment in green infrastructure and public services. Its waste management system is among the most effective in the world, with exceptionally high recycling rates supported by civic participation and stringent regulations. Swiss cities exemplify green urbanism, blending compact design, access to nature, and excellent quality of life with low emissions and efficient land use.
5. Discussion
The comparative assessment of per capita sustainability performance across major economies highlights significant disparities, particularly in environmental priorities. The United States, Germany, and the Netherlands underperform compared with Norway, Switzerland, and Sweden, whose superior outcomes are rooted in structural economic factors, energy policies, and institutional characteristics.
The United States exhibits weak environmental performance due to its heavy reliance on fossil fuels, which results in per capita CO2 emissions of 16.41 tonnes per year, substantially higher than Switzerland’s 4.35, Sweden’s 4.48, and Norway’s 7.52. This stark contrast reflects the limited penetration of renewable energy in the US, which stands at only 12.95%, significantly trailing Sweden’s 48.54%, Norway’s 57%, and Switzerland’s 64%. Additionally, the US faces structural inefficiencies in urban planning, transportation reliance on private vehicles, and an inconsistent environmental policy framework prone to political reversals. The Scandinavian countries, in contrast, have long-established environmental policies, including carbon taxes and investments in hydroelectric and nuclear energy. The results we obtained fully correspond to the most recent Sustainable Development Report [110], which revealed that the USA remains one of the very few countries that have never submitted their Voluntary National Reports within the UN Sustainable Development Goals Framework.
In the year 2000, several major US corporations significantly contributed to the national economy while also imposing substantial public health and environmental costs. ExxonMobil, with revenues of approximately USD 210 billion (2.05% of GDP), was a leading emitter of CO2‚ exacerbating climate change and associated health issues. General Motors and Ford Motor Company, generating USD 183 billion and USD 170 billion (3.4% combined), respectively, were major contributors to urban air pollution and traffic-related fatalities, with 43,000 deaths that year from automobile accidents alone. Philip Morris, earning USD 80 billion (0.78% of GDP), was directly linked to 435,000 tobacco-related deaths, the leading cause of preventable death in the US. Coca-Cola and PepsiCo, with combined revenues near USD 41 billion (0.4% of GDP), drove the obesity and diabetes epidemic through the mass marketing of sugary drinks, contributing to 365,000 deaths from poor diets and inactivity. Both companies were also leading producers of plastic waste, contributing heavily to environmental pollution. Purdue Pharma, though smaller in size (USD 1 billion in revenue), helped spark the opioid crisis through aggressive marketing of OxyContin, leading to 17,000 overdose deaths in 2000 alone. Altogether, these seven companies accounted for nearly 6.7% of US GDP, while being linked to hundreds of thousands of avoidable deaths annually and massive environmental harm. As Carpenter [111], writes in Sweet and Deadly: “Coke stole America’s health and cashed it in for billions of USD, privatising the profits while socialising the costs, and leaving in its wake many unhealthy citizens, often with massive medical bills”. This stark juxtaposition raises serious ethical questions about the long-term sustainability and human cost of economic models built on industries with inherently destructive externalities. An additional dimension of the unsustainable development pattern observed in the United States can be traced to the origins of the concept of planned obsolescence, introduced by Alfred Sloan, then CEO of General Motors. While not formally articulated until the 1950s, the practice of changing car models annually started in the 1920s and 1930s and embedded a consumerist ethos and an unsustainable growth model into the heart of the postwar American economy.
President Donald Trump has initiated the process for the United States to withdraw from the Paris Agreement once again. On 20 January 2025, he signed an executive order titled “Putting America First in International Environmental Agreements,” directing the immediate withdrawal from the Paris Agreement and other related international climate commitments. This marks the second time the US has exited the Paris Agreement under Trump’s leadership; the first withdrawal occurred during his initial term. The executive order also mandates the termination of all US financial commitments under the United Nations Framework Convention on Climate Change, including the International Climate Finance Plan. This action has raised concerns among environmental organisations and international leaders, particularly those from nations vulnerable to climate change impacts.
France, in contrast with Germany and the Netherlands, has a significant nuclear energy share, which contributes to its relatively lower per capita CO2 emissions of 4.59 tonnes, comparable to Sweden and Switzerland. However, its reliance on nuclear power has not translated into a higher share of renewables, which remains at 13%. Germany, with a renewable share of only 14% and per capita CO2 emissions of 9.10 tonnes, continues to rely on fossil fuels, particularly coal, which has hindered its sustainability performance. The Netherlands, with an emissions rate of 8.88 tonnes per capita and similarly low renewable adoption, follows a comparable trajectory.
In economic terms, GDP per capita figures further differentiate these countries. Switzerland (USD 86,605), Norway (USD 97,019), and Sweden (USD 60,020) lead significantly over Germany (USD 47,959), France (USD 43,011), and the Netherlands (USD 52,830). The US, at USD 55,064, also lags behind the sustainability leaders. The higher economic output of Switzerland, Norway, and Sweden supports their ability to invest in sustainable infrastructure, research, and social welfare systems. Inflation also plays a role. While low in absolute terms, Switzerland (−0.01%) and Sweden (−0.18%) have outperformed Germany (0.907%) and France (0.508%). Norway, at 2.04%, remains stable. These variations indicate economic stability and controlled monetary policies that support sustainability-oriented investments.
Income distribution provides additional insights into the structural inequality present in these nations. The US stands out with a top 1% income share of 20.20%, higher than Sweden (8.73%) and Switzerland (11.3%), but lower than Norway (32.2%), France (32.43%), and Germany (38.26%). The high values in France and Germany indicate greater income inequality, which can weaken social sustainability by concentrating wealth among the elite, reducing social mobility, and limiting broader economic participation. In contrast, Scandinavian economies with lower inequality have robust social security systems and progressive taxation, ensuring more inclusive economic development.
Unemployment figures further delineate these economies. Switzerland (3.04%) and Norway (3%) maintain low unemployment, followed by Germany (4.98%) and Sweden (7.5%), while France lags with a significantly high unemployment rate of 10.29%. Sustainable economic models prioritise job security and social protections, explaining why Scandinavian economies outperform their European counterparts in holistic sustainability measures.
Agricultural land usage, serving as a proxy for biodiversity preservation, also reflects sustainability performance. Switzerland (38.53%), Norway (3%), and Sweden (7.45%) retain large areas of natural wilderness, while France (52.54%), Germany (47.94%), and the Netherlands (54.59%) have converted more land for agriculture. The US also exhibits high agricultural land use at 44.59%, which, while lower than Germany and France, still suggests a significant transformation of natural landscapes.
Debt-to-GDP ratios also distinguish sustainable economic policies. Switzerland (30.62%), Norway (28.7%), and Sweden (44.78%) manage debt effectively, allowing greater fiscal flexibility to invest in sustainability initiatives. France (94.90%) and Germany (75.70%) operate under higher debt burdens, restricting public spending on long-term environmental and social programs. The US fares even worse, with a debt-to-GDP ratio of 104.61%, constraining its ability to finance sustainability transitions effectively.
Life expectancy data further supports the correlation between economic stability, social investment, and sustainability performance. Switzerland (83.19 years), Sweden (82.25 years), and Norway (82.1 years) lead in longevity, while Germany (81.09), France (82.71), and the Netherlands (81.70) follow closely. The US significantly underperforms at 78.84 years, reflecting disparities in healthcare, social policies, and economic inequality.
The limitations of this study include a relatively small sample of countries, dictated by the availability of data; the lack of an extended body of data on sustainability indicators going back to 1960 for categories such as biodiversity and recycling rates; the lack of verified data on embodied emissions of CO2 for each country; and the general absence of long-run estimates of embodied environmental impacts of international trade. This paper does not aim to provide specific policy advice and offers a multidimensional approach for the assessment of dynamic sustainability at the macro level with varying policy priorities.
6. Conclusions
This comprehensive analysis reveals that Norway, Switzerland, and Sweden’s superior sustainability performance is driven by high renewable energy shares, low CO2 emissions, robust economic stability, lower income inequality, and strong environmental governance. In contrast, Germany, France, and the Netherlands underperform due to their dependence on fossil fuels, lower GDP per capita, higher income inequality, and structural economic constraints. The US remains an outlier with excessive carbon emissions, income inequality, and weak environmental policies.
Funding
This research received no external funding.
Institutional Review Board Statement
Not applicable.
Informed Consent Statement
Not applicable.
Data Availability Statement
The original contributions presented in this study are included in the article. Further inquiries can be directed to the corresponding author.
Conflicts of Interest
The authors declare no conflict of interest.
Appendix A
| Authors | Year | Method Type | Method Name | Indicators | Time Horizon | Conclusions |
| Nordhaus and Tobin [17] | 1972 | NA | Measure of Economic Welfare (MEW) | 10 | 1929–1965 | This study lays the groundwork for national accounting approaches, adjusting GNP by deducting expenditures that do not increase welfare. It then contrasts the calculated Measure of Economic Welfare (MEW) with an MEW that would hold welfare constant over time. Decreases in natural capital are discussed but excluded from calculations. The authors argue for introducing incentives to preserve resources to counter problems that arise when the price mechanism does not properly value wealth depletion. |
| Hartwick [18] | 1990 | NA | True NNP | 5 | n.a. | This is one of the foundational contributions to weak sustainability measures. It adjusts the net national product by deducting used-up natural capital stocks to arrive at a “true NNP” measure. It is based on “Hartwick’s Rule”, prescribing reinvestment of gains from declining stocks of exhaustible resources into produced capital to achieve sustainability. |
| Pearce and Atkinson [19] | 1993 | NA | Genuine Savings | 4 | 1965–today | This initial exploration of the GS/ANS approach proposes a weak sustainability indicator, based on comparing savings with the depreciation of capital stocks. An economy is sustainable if it saves more than it depletes its stocks of produced and natural capital. It presents results for 18 countries. |
| Daly [4] | 1994 | NA | Index of Sustainable Economic Well-Being | 21 | 1950–1990 | The ISEW divides personal consumption by income distribution and then deducts or adds a range of measures. It includes a wider range of environmental indicators than previous indices. Results are presented for the US from 1950 to 1990. The ISEW is shown to have grown much more slowly than GNP. Unsustainable consumption patterns are identified as the main reason for the ISEW’s divergence from GNP growth. |
| Wackernagel et al. [37] | 1997 | F | Ecological Footprint | 10 | 1961–2018 | The Ecological Footprint assesses how much land and water area is used for a country’s consumption and connected waste absorption. A sustainable country stays within its biophysical boundaries. Results are presented for 52 nations, showing that humanity is exceeding Earth’s biophysical capacity by one third. |
| Loh et al. [29] | 1998 | CI | WWF Living Planet Index | 3 | 1970–today | The Living Planet Index is an attempt at assessing the state of forest, freshwater, and marine ecosystems. It offers country data for each, as well as an integrated index. All overall indices are shown to have declined significantly. The report offers a separate measure for global consumption pressure. |
| Cobb et al. [21] | 1999 | NA | Genuine Progress Indicator | 18 | 1950–today | The GPI and ISEW are usually treated as synonymous. This 1999 contribution presents the US GPI, with personal consumption adjusted for income distribution and addition and subtraction of different measures, from 1950 to 1999. It includes measures for economic, social, and environmental sustainability, all denoted in USD. The report shows that the GPI started diverging downwards from GDP around 1970, lending support to the “threshold hypothesis”, according to which GDP growth only contributes to welfare up to a turning point. |
| Hamilton [20] | 2000 | NA | Genuine Savings | 7 | 1965–today | This report presents Genuine Savings (GS), adjusting traditional net savings by subtracting the net depletion in natural resource value and the value of pollution and adding investments in education. Results are presented for all countries and across regions in 1997. Only the Middle East and North Africa are shown as slightly unsustainable. Middle- and high-income countries, especially in South Asia and the Pacific, have the highest GS, while a negative correlation is shown between the resource dependency of countries and their GS. |
| Prescott-Allen [36] | 2001 | CI | Well-Being Index/Barometer of Sustainability | >60 | 1998 | This book proposes a Well-Being Index (WI), based on two top-level indices: the Human Well-Being Index (HWI) and the Ecosystem Well-Being Index (EWI). Instead of monetary or physical valuation, performance scores are compared with performance standards and aggregated into indices. Sustainability is defined as a WI of 81. Results are presented for 180 countries. No country in the report is categorised as sustainable. The overall “best” countries score high in the HWI but relatively low in the EWI. For most countries, the HWI is higher than the EWI. |
| Esty et al. [31] | 2002 | CI | Environmental Sustainability Index | 68 | 2000–2005 | The ESI is aggregated from five core components: environmental systems, reducing stresses, reducing human vulnerability, social and institutional capacity, and global stewardship. Twenty sub-indices, based on sixty-eight indicators, are averaged and compared internationally. Results are presented for 241 countries. Most high performers are high-income countries. Per capita income is shown to be positively correlated with the ESI, but countries with low incomes and high ESIs exist. |
| Osberg and Sharpe [33] | 2002 | CI | Index of Economic Well-Being | 15 | 1971–1999 | This study proposes an index assessing economic sustainability. Some indicators also touch on social aspects, e.g., the Gini coefficient and risk of unemployment. Fifteen indicators build four top-level indices that are integrated into an overall index. The index is shown to have increased less than GDP per capita in a sample of six OECD countries. |
| Sutton [40] | 2003 | F | Night Light Energy ESI | 2 | n.a. | This study calculates a sustainability index based on nighttime satellite imagery. It uses light energy emitted as a proxy for environmental impact and relates it to the value of ecosystem services. Madagascar, Mongolia, and several island nations are the most sustainable. A correlation with the EF, but not with the ESI, is pointed out. |
| SOPAC [30] | 2003 | CI | Environmental Vulnerability Index | 50 | 1973–2005 | The EVI assesses the environmental vulnerability of individual countries. Indicators are scaled according to thresholds, rating each on a 1–7 scale of environmental vulnerability. Sub-indices are provided for five policy-relevant areas, namely, climate change, exposure to natural disasters, biodiversity, desertification, water, agriculture/fisheries, and human health aspects. |
| Stiglitz, Sen, and Fitoussi [25] | 2009 | NIB | Not named | 28 | n.a. | This report proposes a separate assessment of current well-being and sustainability. To assess economic sustainability, it advocates for a monetary approach close to ANS, adjusted by depletion indicators, where reliable valuation methods exist. Separately, environmental sustainability should be assessed with the help of physical indicators, such as the Carbon Footprint. |
| Hertwich and Peters [39] | 2009 | F | Carbon Footprint | 1 | 1970–today | This study offers one of the first cross-country comparisons of the Carbon Footprint, assessing the amount of GHG emissions associated with the consumption of goods and services. It allows for comparisons across space and across sectors. The authors do not claim to have offered an overall assessment of sustainability. |
| Shmelev and Rodríguez-Labajos [28] | 2009 | MCDA | NAIADE | 3 (16) | 1960–2003 | This study offers a dynamic alternative to composite measurement indices. Criteria are selected according to policy agendas and theoretical considerations. Short-, medium-, and long-term analyses are carried out for the case of Austria, with weak and strong sustainability criteria. Indicators are not integrated into a composite index, but years are ranked according to their overall performance relative to other years. |
| Lawn and Clarke [22] | 2010 | NA | GPI | 18 | 1967–2006 | This paper recalculates and applies the GPI for seven Asian-Pacific countries. It provides support for the threshold hypothesis, but argues that for developmental late-comers, the point where the GPI diverges from GDP is earlier. |
| Mascarenhas et al. [41] | 2010 | NIB | The Algarve Regional SDI | 20 | n.a. | This study proposes a dashboard for regional sustainability assessment in the Algarve, Portugal. It addresses the weighting issues of other indices by selecting indicators based on questionnaires with local stakeholders. |
| Mirshojaeian Hosseini and Kaneko [34] | 2011 | CI | Not named | 29 | 2000–2007 | This study measures and ranks sustainability for 133 countries. Using Principal Components Analysis, indicators are grouped into four pillars: institutional, economic, social, and environmental. Both for individual countries and regions, the trends of overall sustainability and for each pillar are presented, showing similar behaviour for the first three and diverging trends for environmental sustainability. |
| Arrow et al. [26] | 2010 | NA | Not named | 21 | 1995–2000 | This study measures sustainability in five countries by assessing changes in comprehensive wealth, meaning an economic valuation of natural, human, reproducible, and, as an extension, health capital, while deducting capital gains on oil and carbon damages. If comprehensive wealth grows, a country’s development is deemed sustainable, as is the case for the US, China, India, and Brazil. For all these countries, the net depletion of natural capital is overcompensated by gains in human or reproducible capital. |
| UN [13] | 2014 | NA | SEEA | n.a. | n.a. | In this document, the UN introduces a statistical standard for environmental accounting. The accounts include environmental flows, environmental asset stocks, and economic activity. Some aggregate measures are included, such as depletion-adjusted net saving or depletion-adjusted net domestic product. |
| Mori et al. [42] | 2015 | NIB | City Sustainability Index | 12 | 2015 | This study proposes a sustainability assessment of cities, able to measure both economic, social, and environmental sustainability and leakage effects to other cities. It uses constraint indicators, for which a city must be above a certain threshold, and maximisation indicators, which are either positive or negative contributors. To maintain strong sustainability criteria, it does not aggregate. The index is applied to 12 megacities. |
| Shmelev [44] | 2017 | F | APIS | 3 | 1995–2011 | This chapter assesses the sustainability performance of seven countries. By testing varying weights, it allows for assessment from the viewpoint of different policy priorities, focused on the economy, environment, or the social dimension. Developments in Germany, France, and the UK are shown to be positive regardless of priorities, while trends in China, Russia, Brazil, and the US are less clear. |
| OECD [14] | 2017 | NIB | How’s Life indicator set | 32 | 2005–2017 | This indicator set assesses current well-being and sustainability separately. For current well-being, countries are scored on each measure. The sustainability assessment focuses on changes in natural, human, economic, and social capital stocks. No integrated index is produced, but trends in each stock are compared internationally. |
| Stiglitz, Fitoussi, and Durand [2] | 2018 | NIB | How’s Life indicator set | 32 | n.a. | This report advocates for a dashboard based on OECD [14] and broadly advocates for a further-reaching approach to measure current and future well-being beyond GDP. Acknowledging the SDGs as an attempt at such an approach, it argues for the need for prioritisation. It advocates for better measures for sustainability, including all three dimensions: social, economic, and environmental. |
| UNDP [35] | 2022 | CI | HDI | 4 | 1990–2022 | The HDI offers an integrated index of human development. It is not explicitly a sustainability index, but it can be adjusted to include planetary pressures or poverty. These adjusted HDIs then show whether a country’s performance improves or worsens with the inclusion of additional dimensions. Adjustments for planetary pressures include CO2 emissions and material footprint. It has been published since 1975, but due to changes in methodology, only data since 1990 are comparable. |
| Wolf et al. [32] | 2022 | CI | EPI | 40 | 2002–today | The EPI offers a large dashboard, integrated into a single index assessing environmental sustainability. Most high performers are high-income countries. Weights are chosen according to policy objectives |
| Li et al. [43] | 2022 | NA/F | ES and GEE | 21 | 2000–2018 | This study assesses economic sustainability through the GPI’s share of GDP and ecological efficiency through the GPI’s share of the Environmental Footprint. Its study area is the Yangtze River Delta in China. It shows positive trends for ecological efficiency and a negative trend for economic sustainability. |
| EC [112] | 2022 | NIB | EU SDG indicator set | 101 | 2017–2022 | This report uses 17 SDGs comprising 101 indicators to assess sustainable development in the EU. EU-wide trends are shown for each SDG. Performance criteria are not integrated into a composite index, but interlinkages between SDGs are discussed. For each SDG, a policy context is provided, showing what is already being carried out towards achieving the goal. |
| Sachs et al. [15] | 2022 | CI | SDG Index | 120 | 2010–today | The report assesses progress across the 17 SDGs, which are equally weighted and aggregated into a composite index. High-income countries, especially in Scandinavia, are high performers, while low-income countries tend to score lower. The report shows trends and challenges for each SDG and associated indicators in each country. |
| Abbreviations: NA = based on national accounting; CI = composite index; F = footprint; NIB = non-integrated basket; n.a. = not applicable. | ||||||
References
- Rickaby, M.A.; Glass, J.; Fernie, S. Conceptualizing the Relationship between Personal Values and Sustainability—A TMO Case Study. Adm. Sci. 2020, 10, 15. [Google Scholar] [CrossRef]
- Stiglitz, J.E.; Fitoussi, J.-P.; Durand, M. Beyond GDP: Measuring What Counts for Economic and Social Performance; Organisation for Economic Co-Operation and Development: Paris, France, 2018; Available online: https://www.oecd-ilibrary.org/economics/beyond-gdp_9789264307292-en (accessed on 8 February 2023).
- Daly, H.E. Steady-State Economics, 2nd ed.; with new essays; Island Press: Washington, DC, USA, 1991. [Google Scholar]
- Daly, H.E.; Cobb, J.B.; Cobb, C.W. For the Common Good: Redirecting the Economy Toward Community, the Environment, and a Sustainable Future, 2nd ed.; Updated and Expanded; Beacon Press: Boston, MA, USA, 1994. [Google Scholar]
- Daly, H.E. Beyond Growth: The Economics of Sustainable Development; Nachdr.; Beacon Press: Boston, MA, USA, 2000. [Google Scholar]
- Ayres, R.U. Turning Point: An End to the Growth Paradigm; St. Martin’s: New York, NY, USA, 1998. [Google Scholar]
- Ayres, R.U.; Warr, B. The Economic Growth Engine: How Energy and Work Drive Material Prosperity; E. Elgar: Cheltenham, UK, 2009. [Google Scholar]
- Ayres, R.U. The Bubble Economy: Is Sustainable Growth Possible? The MIT Press: Cambridge, MA, USA, 2014. [Google Scholar]
- Victor, P.A. Managing Without Growth: Slower by Design, Not Disaster; Edward Elgar: Cheltenham, UK, 2008. [Google Scholar]
- Jackson, T. Prosperity Without Growth: Economics for a Finite Planet; Earthscan: London, UK, 2009. [Google Scholar]
- OECD. How’s Life?: Measuring Well-Being; OECD: Paris, France, 2011. [Google Scholar] [CrossRef]
- UNEP. Inclusive Wealth Report 2023: Measuring Sustainability and Equity; United Nations Environment Programme: Nairobi, Kenya, 2023. [Google Scholar] [CrossRef]
- United Nations (UN) (Ed.). System of Environmental-Economic Accounting 2012: Central Framework; United Nations: New York, NY, USA, 2014. [Google Scholar]
- OECD. How’s Life? 2017: Measuring Well-Being; Organisation for Economic Co-Operation and Development: Paris, France, 2017; Available online: https://www.oecd-ilibrary.org/economics/how-s-life-2017_how_life-2017-en (accessed on 8 February 2023).
- Sachs, J.D.; Kroll, C.; Lafortune, G.; Fuller, G.; Woelm, F. Sustainable Development Report 2022, 1st ed.; Cambridge University Press: Cambridge, UK, 2022. [Google Scholar] [CrossRef]
- Dietz, S.; Neumayer, E. Weak and strong sustainability in the SEEA: Concepts and measurement. Ecol. Econ. 2007, 61, 617–626. [Google Scholar] [CrossRef]
- Nordhaus, W.; Tobin, J. Is Growth Obsolete? NBER Chapters; National Bureau of Economic Research, Inc.: Cambridge, MA, USA, 1972; pp. 1–80. Available online: https://econpapers.repec.org/bookchap/nbrnberch/7620.htm (accessed on 8 February 2023).
- Hartwick, J.M. Natural resources, national accounting and economic depreciation. J. Public Econ. 1990, 43, 291–304. [Google Scholar] [CrossRef]
- Pearce, D.W.; Atkinson, G.D. Capital theory and the measurement of sustainable development: An indicator of “weak” sustainability. Ecol. Econ. 1993, 8, 103–108. [Google Scholar] [CrossRef]
- Hamilton, K. Genuine Saving as a Sustainability Indicator; World Bank: Washington, DC, USA, 2000. [Google Scholar]
- Cobb, C.; Goodman, G.S.; Wackernagel, M. Why Bigger Isn’t Better: The Genuine Progress Indicator: 1999 Update; Redefining Progressone: Francisco, CA, USA, 1999. [Google Scholar]
- Lawn, P.; Clarke, M. The end of economic growth? A contracting threshold hypothesis. Ecol. Econ. 2010, 69, 2213–2223. [Google Scholar] [CrossRef]
- Lindmark, M.; Nguyen Thu, H.; Stage, J. Weak support for weak sustainability: Genuine savings and long-term wellbeing in Sweden, 1850–2000. Ecol. Econ. 2018, 145, 339–345. [Google Scholar] [CrossRef]
- McGrath, L.; Hynes, S.; McHale, J. Augmenting the World Bank’s estimates: Ireland’s genuine savings through boom and bust. Ecol. Econ. 2019, 165, 106364. [Google Scholar] [CrossRef]
- Stiglitz, J.; Sen, A.; Fitoussi, J. Report of the Commission on the Measurement of Economic Performance and Social Progress (CMEPSP); CMEPSP: Paris, France, 2009. [Google Scholar]
- Arrow, K.J.; Dasgupta, P.; Goulder, L.H.; Mumford, K.J. Sustainability and the measurement of wealth. Environ. Dev. Econ. 2012, 17, 317–353. [Google Scholar] [CrossRef]
- Dietz, S.; Neumayer, E. A Critical Appraisal of Genuine Savings as an Indicator of Sustainability. In Sustainable Development Indicators in Ecological Economics; Lawn, P., Ed.; Edward Elgar Publishing: Cheltenham, UK, 2006; p. 3641. [Google Scholar] [CrossRef][Green Version]
- Shmelev, S.E.; Rodríguez-Labajos, B. Dynamic multidimensional assessment of sustainability at the macro level: The case of Austria. Ecol. Econ. 2009, 68, 2560–2573. [Google Scholar] [CrossRef]
- McLoh, J.; Randers, J.; MacGillivray, A.; Kapos, V.; Groombridge, B.; Jenkins, M. Living Planet Report 1998; WWF International: Gland, Switzerland; New Economics Foundation: London, UK; World Conservation Monitoring Centre: Cambridge, UK, 1998; Available online: https://wwfint.awsassets.panda.org/downloads/livingplanetreport98.pdf (accessed on 8 February 2023).
- South Pacific Applied Geoscience Commission (SOPAC). Building Resilience in SIDS: The Environmental Vulnerability Index; SOPAC: Suva, Fiji, 2005; Available online: https://library.sprep.org/content/building-resilience-sids-environmental-vulnerability-index (accessed on 8 February 2023).
- Esty, D.C.; Granoff, I.M.E.; Ruth, B. 2002 Environmental Sustainability Index; Yale Center for Environmental Law and Policy (YCELP): New Haven, CT, USA, 2002. [Google Scholar]
- Wolf, M.J.; Emerson, J.W.; Esty, D.C.; de Sherbinin, A.; Wendling, Z.A. 2022 Environmental Performance Index; Yale Center for Environmental Law and Policy (YCELP): New Haven, CT, USA, 2022; Available online: https://epi.yale.edu/downloads/epi2022report06062022.pdf (accessed on 8 February 2023).
- Osberg, L.; Sharpe, A. An Index of Economic Well-being for Selected OECD Countries. Rev. Income Wealth 2002, 48, 291–316. [Google Scholar] [CrossRef]
- Mirshojaeian Hosseini, H.; Kaneko, S. Dynamic sustainability assessment of countries at the macro level: A principal component analysis. Ecol. Indic. 2011, 11, 811–823. [Google Scholar] [CrossRef]
- UNDP. Human Development Report 2021–22; Human Development Reports; United Nations: New York, NY, USA, 2022; Available online: https://hdr.undp.org/content/human-development-report-2021-22 (accessed on 8 February 2023).
- Prescott-Allen, R. The Wellbeing of Nations: A Country-By-Country Index of Quality of Life and the Environment. 2001. Available online: https://portals.iucn.org/library/node/7942 (accessed on 8 February 2023).
- Wackernagel, M.; Onisto, L.; Linares, A.; Falfán, I.S.L.; García, J.M.; Guerrero, A.I.S.; Myers, N.; Rees, W. Ecological Footprints of Nations. How Much Nature Do They Use? How Much Nature do They Have? 1997. Available online: https://www.semanticscholar.org/paper/Ecological-footprints-of-nations.-How-much-nature-Wackernagel-Onisto/dcd01a578651825184bc5072f7f50afeae645635 (accessed on 8 February 2023).
- Giljum, S.; Hammer, M.; Stocker, A.; Lackner, M.; Best ABlobel, D.; Ingwersen, W.; Naumann, S.; Neubauer ASimmons, C.; Lewis, K.; Shmelev, S. Scientific Assessment and Evaluation of the Indicator “Ecological Footprint”; German Federal Environment Agency: Dessau-Roßlau, Germany, 2007. [Google Scholar]
- Hertwich, E.G.; Peters, G.P. Carbon Footprint of Nations: A Global, Trade-Linked Analysis. Environ. Sci. Technol. 2009, 43, 6414–6420. [Google Scholar] [CrossRef] [PubMed]
- Sutton, P.C. An Empirical Environmental Sustainability Index Derived Solely from Nighttime Satellite Imagery and Ecosystem Service Valuation. Popul. Environ. 2003, 24, 293–311. [Google Scholar] [CrossRef]
- Mascarenhas, A.; Coelho, P.; Subtil, E.; Ramos, T.B. The role of common local indicators in regional sustainability assessment. Ecol. Indic. 2010, 10, 646–656. [Google Scholar] [CrossRef]
- Mori, K.; Fujii, T.; Yamashita, T.; Mimura, Y.; Uchiyama, Y.; Hayashi, K. Visualization of a City Sustainability Index (CSI): Towards Transdisciplinary Approaches Involving Multiple Stakeholders. Sustainability 2015, 7, 12402–12424. [Google Scholar] [CrossRef]
- Li, Y.; Qiao, J.; Xie, L.; Huang, L.; Su, Y.; Zhou, M.; Wang, K.; Zhang, J.; He, S. Assessing economic sustainability and ecological efficiency with genuine progress indicator: A case study of the Yangtze River Delta from 2000 to 2018. Environ. Sci. Pollut. Res. 2022, 29, 46751–46766. [Google Scholar] [CrossRef]
- Shmelev, S. Multidimensional Assessment of Sustainability: Harmony vs. the Turning Point. In Green Economy Reader: Lectures in Ecological Economics and Sustainability; Shmelev, S., Ed.; Studies in Ecological Economics; Springer International Publishing: Cham, Switzerland, 2017; pp. 67–98. [Google Scholar] [CrossRef]
- Shmelev, S. Dynamic sustainability assessment: The case of Russia in the period of transition (1985–2008). Ecol. Econ. 2011, 11, 2039–2049. [Google Scholar] [CrossRef]
- Shmelev, S.E.; Speck, S.U. Green fiscal reform in Sweden: Econometric assessment of the carbon and energy taxation scheme. Renew. Sustain. Energy Rev. 2018, 90, 969–981. [Google Scholar] [CrossRef]
- Shmelev, S.; Brook, H.R. Macro Sustainability across Countries: Key Sector Environmentally Extended Input-Output Analysis. Sustainability 2021, 13, 11657. [Google Scholar] [CrossRef]
- Shmelev, S.E.; Shmeleva, I.A. Global urban sustainability assessment: A multidimensional approach. Sustain. Dev. 2018, 26, 904–920. [Google Scholar] [CrossRef]
- Roy, B. Multicriteria Methodology for Decision Aiding; Springer: New York, NY, USA, 1996; Volume 12. [Google Scholar] [CrossRef]
- Shmelev, S.E.; Shmeleva, I.A. Multidimensional sustainability benchmarking for smart megacities. Cities 2019, 92, 134–163. [Google Scholar] [CrossRef]
- Shmelev, S. (Ed.) Sustainable Cities Reimagined: Multidimensional Assessment and Smart Solutions, 1st ed.; Routledge, Taylor & Francis Group: London, UK, 2019. [Google Scholar]
- Shmelev, S.E.; Lefievre, N.; Saadi, N.; Shmeleva, I.A. Interdisciplinary Linkages among Sustainability Dimensions in the Context of European Cities and Regions Research. Sustainability 2023, 15, 14738. [Google Scholar] [CrossRef]
- Shmelev, S.E.; Shmeleva, I.A. Smart and sustainable benchmarking of cities and regions in Europe: The application of multicriteria assessment. Cities 2025, 156, 105533. [Google Scholar] [CrossRef]
- Shmelev, S.E. Biodiversity Offset Schemes for Indonesia: Pro et Contra. Sustainability 2025, 17, 6283. [Google Scholar] [CrossRef]
- Piketty, T.; Saez, E. Inequality in the long run. Science 2014, 344, 838–843. [Google Scholar] [CrossRef]
- World Bank. World Development Indicators|DataBank. 2023. Available online: https://databank.worldbank.org/source/world-development-indicators (accessed on 12 October 2023).
- Kraft, M.E. U.S. Environmental Policy and Politics: From the 1960s to the 1990s. J. Policy Hist. 2000, 12, 17–42. [Google Scholar] [CrossRef]
- Rome, A. “Give Earth a Chance”: The Environmental Movement and the Sixties. J. Am. Hist. 2003, 90, 525. [Google Scholar] [CrossRef]
- Cha, J.M.; Farrell, C.; Stevis, D. Climate and Environmental Justice Policies in the First Year of the Biden Administration. Publius J. Fed. 2022, 52, 408–427. [Google Scholar] [CrossRef]
- Kenny, J. Economic conditions and support for the prioritisation of environmental protection during the Great Recession. Environ. Politics 2019, 29, 937–958. [Google Scholar] [CrossRef]
- Samuels, D. Fiscal Straitjacket: The Politics of Macroeconomic Reform in Brazil, 1995–2002. J. Lat. Am. Stud. 2003, 35, 545–569. [Google Scholar] [CrossRef]
- Bittencourt, M. Democracy, populism and hyperinflation: Some evidence from Latin America. Econ. Gov. 2012, 13, 311–332. [Google Scholar] [CrossRef]
- de Freitas, L.C.; Kaneko, S. Decomposition of CO2 emissions change from energy consumption in Brazil: Challenges and policy implications. Energy Policy 2011, 39, 1495–1504. [Google Scholar] [CrossRef]
- Freeman, T.; Gesesew, H.A.; Bambra, C.; Giugliani, E.R.J.; Popay, J.; Sanders, D.; Macinko, J.; Musolino, C.; Baum, F. Why do some countries do better or worse in life expectancy relative to income? An analysis of Brazil, Ethiopia, and the United States of America. Int. J. Equity Health 2020, 19, 202. [Google Scholar] [CrossRef] [PubMed]
- Alvaredo, F.; Chancel, L.; Piketty, T.; Saez, E.; Zucman, G. World Inequality Report 2018; Harvard University Press: Cambridge, MA, USA, 2018. [Google Scholar]
- Menezes-Filho, N.; Scorzafave, L. Employment and Inequality of Outcomes in Brazil; Insper: São Paulo, Brazil, 2009. [Google Scholar]
- Broadbent, J. Environmental Politics in Japan: Networks of Power and Protest; Cambridge University Press: Cambridge, UK, 1999. [Google Scholar]
- Zang, W.; Baimbridge, M. Exports, imports and economic growth in South Korea and Japan: A tale of two economies. Appl. Econ. 2012, 44, 361–372. [Google Scholar] [CrossRef]
- Tyers, R. Japanese Economic Stagnation: Causes and Global Implications. Econ. Rec. 2012, 88, 517–536. [Google Scholar] [CrossRef]
- Akram, T. The Japanese Economy: Stagnation, Recovery, and Challenges. J. Econ. Issues 2019, 53, 403–410. [Google Scholar] [CrossRef]
- McKinnon, R.; Ohno, K. The foreign exchange origins of Japan’s economic slump and low interest liquidity trap. World Econ. 2001, 24, 279–315. [Google Scholar] [CrossRef]
- Krugman, P.R.; Dominquez, K.M.; Rogoff, K. It’s Baaack: Japan’s Slump and the Return of the Liquidity Trap. Brook. Pap. Econ. Act. 1998, 1998, 137. [Google Scholar] [CrossRef]
- Alestalo, M.; Hort, S.E.; Kuhnle, S. The Nordic Model: Conditions, Origins, Outcomes, Lessons. 2009. Available online: https://edoc.vifapol.de/opus/volltexte/2013/4255/pdf/41.pdf (accessed on 19 October 2023).
- Moriguchi, C.; Saez, E. The Evolution of Income Concentration in Japan, 1886–2005: Evidence from Income Tax Statistics. Rev. Econ. Stat. 2008, 90, 713–734. [Google Scholar] [CrossRef]
- Heidenblad, D.L. Mapping a New History of the Ecological Turn: The Circulation of Environmental Knowledge in Sweden 1967. Environ. Hist. 2018, 24, 265–284. [Google Scholar] [CrossRef]
- Englund, P.; The Swedish 1990s Banking Crisis A Revisit in the Light of Recent Experience. Sveriges Riksbank. 2015. Available online: https://ypfs.som.yale.edu/node/16953 (accessed on 19 October 2023).
- Edvinsson, R.; Eriksson, K.; Ingman, G. A real estate price index for Stockholm, Sweden 1818–2018: Putting the last decades housing price boom in a historical perspective. Scand. Econ. Hist. Rev. 2021, 69, 83–101. [Google Scholar] [CrossRef]
- Kiander, J.; Vartia, P. Lessons from the crisis in Finland and Sweden in the 1990s. Empirica 2011, 38, 53–69. [Google Scholar] [CrossRef]
- Jonung, L.; Hagberg, T. How Costly Was the Crisis of the 1990s? A Comparative Analysis of the deepest Crises in Finland and Sweden over the last 130 Years; European Commission (European Economy—Economic Papers): Brussels, Belgium, 2005. [Google Scholar]
- Jonung, L. The Swedish Model for Resolving the Banking Crisis of 1991–93. Seven Reasons Why It Was Successful; Preprint; Directorate General Economic and Monetary Affairs, European Commission, European Economy—Economic Papers: Brussels, Belgium, 2009. [Google Scholar]
- Brandal, N.; Bratberg, Ø.; Thorsen, D.E. (Eds.) Introduction. In The Nordic Model of Social Democracy; Palgrave Macmillan: London, UK, 2013; pp. 1–15. [Google Scholar] [CrossRef][Green Version]
- Naughton, B. Inflation and Economic Reform in China. Curr. Hist. 1989, 88, 269–291. [Google Scholar] [CrossRef]
- Riskin, C. Inequality and the reform era in China. In The Oxford Companion to the Economics of China; Fan, S., Kanbur, R., Wei, S.-J., Zhang, X., Eds.; Oxford University Press: Oxford, UK, 2014. [Google Scholar] [CrossRef]
- Khan, M.H. Governance, Economic Growth and Development Since the 1960s; United Nations: New York, NY, USA, 2007. [Google Scholar]
- Chow, G.C. Capital Formation and Economic Growth in China. Q. J. Econ. 1993, 108, 809–842. [Google Scholar] [CrossRef]
- Wang, Y.; Yao, Y. Sources of China’s economic growth 1952–1999: Incorporating human capital accumulation. China Econ. Rev. 2003, 14, 32–52. [Google Scholar] [CrossRef]
- Borensztein, E.; Ostry, J. Accounting for China’s Growth Performance. Am. Econ. Rev. 1996, 86, 224–228. [Google Scholar]
- Qian, Y. How Reform Worked in China: The Transition from Plan to Market; The MIT Press: Cambridge, MA, USA, 2017. [Google Scholar] [CrossRef]
- Young, A. Gold into Base Metals: Productivity Growth in the People’s Republic of China during the Reform Period. J. Political Econ. 2003, 111, 1220–1261. [Google Scholar] [CrossRef]
- Feng, S.; Hu, Y.; Moffitt, R. Long Run Trends in Unemployment and Labor Force Participation in China; National Bureau of Economic Research: Cambridge, MA, USA, 2015; p. w2 1460. [CrossRef]
- Jain-Chandra, S.; Khor, N.; Mano, R.; Schauer, J.; Wingender, P.; Zhuang, J. Inequality in China—Trends, Drivers and Policy Remedies; IMF Working Papers; International Monetary Fund: Washington, DC, USA, 2018. [Google Scholar] [CrossRef]
- Yuan, X.; Zuo, J. Transition to low carbon energy policies in China—From the Five-Year Plan perspective. Energy Policy 2011, 39, 3855–3859. [Google Scholar] [CrossRef]
- Zheng, J.; Mi, Z.; Coffman, D.; Shan, Y.; Guan, D.; Wang, S. The Slowdown in China’s Carbon Emissions Growth in the New Phase of Economic Development. One Earth 2019, 1, 240–253. [Google Scholar] [CrossRef]
- Hellwig, M.; Neumann, M.J.M.; Vaubel, R.; Miller, M. Economic Policy in Germany: Was There a Turnaround? Econ. Policy 1987, 2, 105–145. [Google Scholar] [CrossRef]
- Heilemann, U. Rezessionen in der Bundesrepublik Deutschland von 1966 bis 2013. Wirtschaftsdienst 2019, 2019, 546–551. [Google Scholar] [CrossRef]
- Räth, N. Rezessionen in historischer Betrachtung. Statistisches Bundesamt, Wiesbaden. Wirtsch. Und Stat. 2009, 203. Available online: https://www.destatis.de/DE/Methoden/WISTA-Wirtschaft-und-Statistik/2009/03/rezession-betrachtung-032009.pdf?__blob=publicationFile#:~:text=Der%20vorliegende%20Beitrag%20befasst%20sich%20deshalb%20mit%20den,aber%20auch%20mit%20Entwicklungen%20vor%20dem%20Zweiten%20Weltkrieg (accessed on 25 June 2025).
- Blömer, M.J.; Dolls, M.; Fuest, C.; Löoffler, M.; Peichl, A. German Public Finances through the Financial Crisis. Fisc. Stud. 2015, 36, 453–474. [Google Scholar] [CrossRef]
- Duan, C.; Zhu, W.; Wang, S.; Chen, B. Drivers of global carbon emissions 1990–2014. J. Clean. Prod. 2022, 371, 133371. [Google Scholar] [CrossRef]
- Renn, O.; Marshall, J.P. Coal, nuclear and renewable energy policies in Germany: From the 1950s to the “Energiewende”. Energy Policy 2016, 99, 224–232. [Google Scholar] [CrossRef]
- Tooze, A. The Wages of Destruction: The Making and Breaking of the Nazi Economy; Penguin: London, UK, 2007. [Google Scholar]
- Hayes, P. Industry and Ideology: I. G. Farben in the Nazi Era; Cambridge University Press: Cambridge, UK, 2000. [Google Scholar]
- Møller Christensen, A.; Topp, J. Monetary Policy in the Nordic Countries: Experiences Since 1992. BIS Policy Papers No. 2. 1997. Available online: https://www.bis.org/publ/plcy02.pdf#page=6 (accessed on 12 July 2023).
- Steigum, E. The Norwegian Banking Crisis in the 1990s: Effects and Lessons; American Economic Association: Pittsburgh, PA, USA, 2010. [Google Scholar]
- Sovacool, B.K. Energy policymaking in Denmark: Implications for global energy security and sustainability. Energy Policy 2013, 61, 829–839. [Google Scholar] [CrossRef]
- Jensen, T.L.; Nielsen, J.; Pihl, M.D.; Damm, E.A.; Caspersen, S.; Bjørsted, E. Fra Kriseår til Velfærdssamfund—Et Portræt af Lønmodtagernes Vilkår Gennem 85 år. AE—Arbejderbevægelsens Erhvervsråd. 2021. Available online: https://www.ae.dk/files/media/document/ae_jubil%C3%A6um_web_med%20fotos%20uden%20ophavsret.pdf (accessed on 22 October 2023).
- Lenzen, M.; Pade, L.-L.; Munksgaard, J. CO2 Multipliers in Multi-region Input-Output Models. Econ. Syst. Res. 2004, 16, 391–412. [Google Scholar] [CrossRef]
- Caspersen, S. Den Gyldne Procent af Danskerne Sidder på Mere end ni Procent af de Samlede Indkomster for Første Gang i årtier. Economic Council of the Labour Movement. 2023. Available online: https://www.ae.dk/node/3280/pdf-export (accessed on 6 September 2023).
- Michelson, S. Inequality in Denmark Through the Looking Glass; OECD: Paris, France, 2016. [Google Scholar]
- Madsen, P.K. Denmark: Flexibility, Security and Labour Market Success; International Labour Organisation: Geneva, Switzerland, 1999. [Google Scholar]
- Sachs, J.D.; Lafortune, G.; Fuller, G.; Iablonovski, G. Financing Sustainable Development to 2030 and Mid-Century. Sustainable Development Report 2025; SDSN: Paris, France; Dublin University Press: Dublin, Ireland, 2025. [Google Scholar] [CrossRef]
- Carpenter, D. Sweet and Deadly: How Coca-Cola Spreads Disinformation and Makes Us Sick; MIT Press: Cambridge, MA, USA, 2025. [Google Scholar]
- European Commission (EC). Statistical Office of the European Union. In Sustainable Development in the European Union: Overview of Progress Towards the SDGs in an EU Context: 2022 Edition; European Union: Luxembourg, 2022; Available online: https://data.europa.eu/doi/10.2785/76551 (accessed on 20 February 2023).


Disclaimer/Publisher’s Note: The statements, opinions and data contained in all publications are solely those of the individual author(s) and contributor(s) and not of MDPI and/or the editor(s). MDPI and/or the editor(s) disclaim responsibility for any injury to people or property resulting from any ideas, methods, instructions or products referred to in the content. |
© 2025 by the author. Licensee MDPI, Basel, Switzerland. This article is an open access article distributed under the terms and conditions of the Creative Commons Attribution (CC BY) license (https://creativecommons.org/licenses/by/4.0/).