Abstract
The development of the digital economy has become a significant driving force for the innovation of green technology in the manufacturing sectors. Green technology innovation in the manufacturing sectors is not only a key engine for realizing economic green transformation and achieving the goal of achieving peak carbon emissions by 2030 and carbon neutrality by 2060, but also an important path for cultivating new quality productivity. Based on Schumpeter’s endogenous growth theory, in this study, we constructed an analytical model with a unified framework of digital economic development and environmental regulation, systematically explored the mechanism of digital economic development with respect to green technological innovation in the manufacturing sectors and the moderating effect of environmental regulation, and carried out empirical research based on panel data at the provincial level and the level of the subdivided manufacturing sectors in China. We found that the development of the digital economy promotes green technology innovation in the manufacturing industry. However, according to the theory of increasing marginal information costs, it shows a significant nonlinear relationship. Absorptive capacity is the key means of support that manufacturing enterprises can leverage to improve their level of green technological innovation. Environmental regulation plays a crucial role in guiding green technological innovation in the manufacturing sectors. A further heterogeneity analysis showed that the development of the digital economy exerts a stronger positive impact on green technological innovation in cleaner-production-oriented manufacturing sectors and those located in regions with more advanced financial regions and in technology-intensive industries. This study provides theoretical support for understanding the driving mechanisms of green technological innovation in the manufacturing sector against the backdrop of the digital economy, offering practical implications for optimizing environmental regulation policies and enhancing the level of green development in manufacturing.
1. Introduction
With the profound evolution of the global manufacturing pattern and the continuous reshaping of industrial competition, China’s manufacturing industry is accelerating towards the transformation path of digitalization, intellectualization, greening, and sustainable development. As the core sector that supports national economic development, the green transformation of the manufacturing industry is not only related to the process of high-quality industrial development but also holds critical significance in promoting the green and low-carbon transformation of the entire national economy and accelerating the development of the new drivers of high-quality productivity [1]. Currently, the development of China’s economy is facing triple pressure: demand contraction, supply shocks, and weakening expectations. The foundational role of the manufacturing industry in sustained and stable economic growth has become more prominent. However, the problems of high resource consumption and environmental loads in the traditional manufacturing industry remain relatively significant, posing a substantial obstacle to the sustainable development of the economy and society [2]. In this context, the synergistic promotion of “stable growth” and “emission reduction” in the manufacturing industry urgently relies on the strong support of green technological innovation. Promoting the modernization, greening, and low-carbon transformation of China’s traditional manufacturing industry has become a critical task in advancing Chinese-style modernization in the new era.
The development of the digital economy contributes to the systematic enhancement of green technological innovation capacity in the manufacturing sector, which can effectively crack the resource bottlenecks inherent in traditional development pathways and accelerate the construction of a modern manufacturing industry system. In practice, traditional manufacturing enterprises are generally faced with two core dilemmas, namely a “lack of motivation” and a “direction shift” in the promoting green technological innovation process due to the typical characteristics of such innovation—high investment, substantial risk, and long cycles. Some scholars have integrated financial development into the classic Schumpeterian endogenous growth framework and established a theoretical path for financial development influencing technological innovation and economic growth [3]. This theoretical framework addresses the issue of the “driving force” behind technological innovation. At the same time, environmental regulation, as the government exercises its own function, is not the source for manufacturing enterprises carrying out technological innovation, but it has a positive role in changing the direction of “technological innovation”. Therefore, examining the “direction” of technological innovation and investigating the mechanisms through which digital economy development influences green technological innovation in the manufacturing sector are of significant theoretical and practical importance. Such research not only contributes to promoting the transformation of China’s manufacturing industry from factor-driven to innovation-driven growth, but also plays a crucial role in enhancing green total factor productivity.
2. Literature Review and Comments
In the era of the digital economy, the manufacturing industry is facing multiple challenges caused by environmental changes while promoting economic growth. Achieving synergy between economic development and ecological protection has become a crucial pathway for the manufacturing industry’s pursuit of high-quality and sustainable development [4]. In the strategic pursuit of balancing economic development and environmental protection, green technological innovation is commonly regarded as a core initiative for enterprises to advance toward sustainable development [5]. Regarding the relationship between the digital economy and green technological innovation in the manufacturing sector, existing studies have primarily focused on aspects such as energy utilization efficiency, digital empowerment, and the level of green innovation. From the standpoint of energy conservation and emission reduction, digital technologies have been shown to substantially decrease energy consumption intensity and pollution emission levels by leveraging both scale effects and technological effects [6], while simultaneously enhancing resource allocation to foster green technological innovation in the manufacturing sector [7]. Accordingly, digitalization facilitates enterprise, transformation and upgrading, progressing from green structuring and capability enhancement to green leveraging [8]. The authors of [9] empirically found that the integration of the digital and real economies has a significant positive impact on green innovation by constructing a digital–real economy integration index and employing provincial panel data in China. Their findings further suggest that, at the macro level, provinces should enhance both industrial digitalization and the development of the digital industry, thereby fostering green technological innovation within the manufacturing sector. At the micro level, digitalization has been embedded in various aspects of enterprise operations, including production, marketing, and services. The advancement of digitalization provides favorable factor endowments, environmental support, and new opportunities for enhancing both the quantity and quality of green technological innovation within enterprises [10]. The digital economy has emerged as a crucial driving force and a new engine for enhancing green technological innovation in manufacturing enterprises, thereby fostering improvements in total factor productivity. However, the impact of digitalization on green technological innovation in the manufacturing sector is not a simple linear relationship. Rather, its effects vary under different contextual conditions. Liu et al. [11], drawing on panel data from 30 Chinese provinces between 2011 and 2020, employ the spatial Durbin model and threshold effect models to systematically examine the relationship between digital economy development and green innovation across varying levels of financial development, human capital, and industrial structure. The findings confirm, at the macro level, the nonlinear characteristics of this relationship. At the micro level, Wang et al. [12] provide further evidence by analyzing a sample of 1377 listed firms between 2012 and 2020, demonstrating a significant inverted U-shaped effect of firms’ digital capability on green innovation. This indicates that while moderate digital capability enhances green innovation performance, excessive digitalization may lead to efficiency losses and diminish innovation outcomes.
In the process of digital economy development, digital technologies and data resources provide manufacturing enterprises with extensive information, enabling them to promptly identify market demands and external innovation opportunities. This, in turn, facilitates product and process innovations and enhances their capabilities in green technological innovation [13]. Digital transformation further promotes knowledge sharing, allowing enterprises to leverage their absorptive capacity to more effectively convert and apply knowledge, thereby strengthening green technological innovation [14]. Responding to the opportunities and challenges posed by the rapidly evolving digital environment, manufacturing enterprises increase their absorptive capacity to enhance green technology innovation through digital servitization [15].
Porter et al. proposed “Porter’s hypothesis”, which argues that, to a certain extent, environmental regulation policies can effectively trigger innovation, and that such innovation can partially offset the compliance costs of these policies, known as the “innovation compensation effect” [16]. Environmental regulation guides manufacturing enterprises to undergo transformation in order to promote green technological innovation, while economic policy uncertainty moderates the direct impact of digital transformation on green technological innovation [17]. Peng et al. [18] build the theoretical framework that “environmental regulation stimulates the willingness for green innovation, and such willingness further promotes green innovation behavior”, classifying environmental regulation into incentive-based and command-based types, and their findings indicate that, compared with incentive-based regulation, command-based regulation exerts a stronger influence on the willingness for green innovation, which is more effective in stimulating enterprises’ green technological innovation activities.
The empirical studies that examine the relationship between the development of the digital economy and green technological innovation in manufacturing are scarce and controversial. Some studies suggest that digital technologies are reconfiguring value complementarities and resource allocation, reducing contract enforcement costs and innovation transaction costs, and thus promoting the diversification of green technological innovation [19]. However, diverse perspectives exist regarding the impact of technological innovation on manufacturing enterprises, with some scholars contending that digital transformation does not uniformly benefit all. Research indicates that while manufacturing firms have increased access to digital resources, the implementation of technology in certain scenarios has impeded innovation progress due to variations in capabilities and institutional constraints [20].
In summary, there are two limitations in previous studies: (1) There is a limitation of research based on the data from the level of the subdivided manufacturing industry in provinces of China. (2) There are mechanism research limitations: the existing research focuses on a single path, thereby neglecting the relationship between the internal absorptive capacity of enterprises and the external institutional environment. To complement the existing literature, it is necessary to systematically clarify the correlation between the advancement of the digital economy and the innovation of green technologies within the manufacturing sector, while delineating the primary causal pathways and diverse outcomes based on empirical evidence from China. This study aims to address two key inquiries: Firstly, does the progression of the digital economy stimulate green technological innovation in the manufacturing sector, and what are the underlying mechanisms of this influence? Secondly, given the environmental ramifications of manufacturing activities and the disparities in financial development across regions, how does the nexus between digital economy advancement and green technological innovation in manufacturing evolve? Resolving these queries will offer valuable insights to inform governmental strategies aimed at fostering green technological innovation within the manufacturing domain.
This study makes several key contributions. Firstly, the study introduces a research framework encompassing a benchmark mechanism and extended analyses, elucidating the main causal relationship and the nonlinear association between digital economy advancement and green technology innovation in the manufacturing sector from the perspective of different sub-industries. It empirically investigates the interplay among enterprises’ internal absorptive capacity, their responses to external environmental regulations, and the evolution of the digital economy. Secondly, it analyzes the universality of the dynamic relationship between external environmental regulation responses and digital economy development, thereby providing practical guidance for promoting sustainable development from a digital perspective. This study further opens the “black box” of the core causal relationship, aiming to offer a clear pathway for green technological innovation in manufacturing enterprises and to provide evidence that supports policymakers in strategically coordinating digital development strategies.
3. Theoretical Analysis and Research Hypotheses
3.1. The Impact of Digital Economy Development on Green Technology Innovation in Manufacturing
The emergence of the digital economy has fundamentally transformed how enterprises create value and innovation paths, leading to the evolution of business models, the reconfiguration of customer value, and significant impacts on green technological innovation in the manufacturing sector [21]. At the resource allocation level, the digital economy enables enterprises to integrate and deploy diverse innovation inputs more efficiently, including human resources, knowledge, capital, and other resources, thereby laying a foundation for green technology innovation [22]. With respect to innovation efficiency, the widespread adoption of digital technologies, such as artificial intelligence, the Industrial Internet, and other tools, enhances innovation efficiency by optimizing the innovation process in manufacturing enterprises. This allows for real-time monitoring and precise scheduling of the entire process, leading to substantial improvements in resource allocation efficiency and productivity [23]. At the innovation cost level, enterprises are continually improving their digital skills and organizational efficiency through digital transformation, resulting in a significant reduction in technological innovation costs.
However, the influence of digital economy development on green technological innovation in the manufacturing sector is not purely positive. Instead, it is constrained by multiple factors such as firms’ resource limitations, information absorption capacity, and the external institutional environment. For example, “over-digitalization”, “information overload”, and “technological lock-in” phenomena may lead to diminishing marginal effects, which may even hinder green technological innovation. Based on the resource-based view (RBV), excessive digital investment may consume substantial financial and managerial resources, thereby crowding out funds that could be allocated to green innovation [24]. The technology–organization–environment (TOE) framework further emphasizes that when enterprises’ internal capabilities are misaligned with external environmental conditions, the continuous intensification of digitalization may lead to efficiency losses and even weaken green innovation performance [25]. The information overload theory also provides a reasonable explanation for this phenomenon: With the expansion of digital technology, enterprises are confronted with an excessive flow of complex information, which increases decision-making complexity and disperses managerial attention [26,27]. Consequently, this can reduce the effectiveness of resource allocation for green Research and Development (R&D). In addition, from the perspective of opportunity cost and path dependence, excessive digitalization can crowd out financial resources that could otherwise be allocated to environmental protection and cleaner production investments [28,29]. Such resource misallocation may alter the innovation path of an enterprise and hinder its commitment to green technological upgrading.
Furthermore, although IT inputs can enhance the knowledge acquisition and integration capabilities of enterprises, if they exceed the cognitive boundaries of enterprises, they will cause information overload, which will weaken the absorption and utilization efficiency [30]. At the same time, if firms’ fundamental internal capabilities are not aligned with the scale of digital investment, over-digitalization may compress innovation resources and increase managerial costs, ultimately hindering green innovation outcomes [31]. From the perspective of the learning effect and competition effect, digital technology can promote green innovation through the learning effect in the initial development stage, but when it spreads to the general level of the industry, the competition effect will gradually appear and inhibit the innovation enthusiasm of enterprises, resulting in a “nonlinear” relationship between digitalization and green innovation [32].
In summary, under conditions that enterprises possess relatively sufficient internal resources, such as human resources and techniques, as well as external resources such as financial support, the development of the digital economy can significantly promote green technological innovation in the manufacturing sector through resource integration, process optimization, and cost reduction. However, as the degree of digitalization deepens, its positive effect may be constrained by rising marginal information costs and resource misallocation. When the development of digitization exceeds the reasonable threshold, this promotion effect not only tends to diminish, but even may exhibit a reverse effect, presenting a typical nonlinear characteristic. Therefore, this study proposes the following hypotheses:
H1:
The development of the digital economy significantly promotes green technology innovation in the manufacturing industry.
H1a:
The relationship between digital economy development and green technological innovation in the manufacturing sector exhibits a nonlinear, inverted U-shaped relationship.
3.2. The Mediating Role of Absorptive Capacity
Absorptive capacity refers to an enterprise’s ability to identify, acquire, transform, and apply external knowledge to support its internal innovation process. The development of the digital economy is reshaping the way manufacturing enterprises manage knowledge. First, the connection mechanism serves as the initial stage of digital technology’s role. By leveraging big data mining, the Internet of Things, and mobile analytics tools, manufacturing enterprises can establish real-time connectivity with diverse information resources from suppliers, customers, research institutions, and R&D partners, thereby facilitating the rapid acquisition and sharing of external knowledge. The integration of heterogeneous information sources not only lowers the costs of knowledge search but also strengthens the alignment between external knowledge and enterprises’ internal demands, thereby enabling a more effective realization of value [33]. Second, intelligent models reinforce the transformation and utilization of knowledge. Through digital empowerment, enterprises can establish new paradigms of intelligent perception, searching, and management, which enhance their capacity to acquire and absorb valuable knowledge from the external environment and, in turn, improve the efficiency of knowledge internalization and innovative application. Third, collaborative synergies create cross-organizational support for knowledge application. A variety of digital tools, such as cloud computing, collaborative platforms, and blockchain, facilitate knowledge sharing, information storage, and real-time analytics between manufacturing firms and their partners. By reinforcing co-innovation, joint value creation, and knowledge transfer, enterprises can accelerate the internalization of external knowledge, thereby enhancing their overall absorptive capacity and providing a robust foundation for green technological innovation.
Absorptive capacity serves as manufacturing enterprises’ fundamental guarantee of their potential to improve their levels of green technology innovation. Existing studies have shown that absorptive capacity not only significantly stimulates the innovation potential of manufacturing enterprises in regard to green products, processes, and services [34] but also enhances the ability of manufacturing enterprises to transform environmentally oriented external knowledge into green practices. Some scholars have empirically found that absorptive capacity has a positive impact on incremental, radical, and service-oriented green technological innovations [35]. As a type of innovation highly dependent on the integration of diverse knowledge resources, green technological innovation can be conceptualized as the reconfiguration of internal and external knowledge, where absorptive capacity enables enterprises to acquire and internalize external knowledge to better anticipate market preferences and sustain the competitiveness of green products. Digital technologies further facilitate this process by enhancing knowledge search and integration, thereby advancing green innovation through the shared use of market and scientific knowledge.
Green technology innovation often requires manufacturing enterprises to have the ability to extract, transform, and apply complex external knowledge to specific market scenarios, thereby improving the adaptability and market success of green products.
Based on this, Hypothesis 2 was formulated:
H2:
The development of the digital economy can positively influence green technological innovation in the manufacturing sector by enhancing absorptive capacity, indicating that absorptive capacity plays a mediating role in the relationship between digital economy development and green technological innovation.
3.3. The Regulatory Role of Environmental Regulation
At the theoretical level, the prevailing model of biased technological progress suggests that environmental regulation policies can effectively steer technological innovation towards green practices, thereby promoting green technological innovation [36,37]. Empirical investigations in China’s manufacturing sector have primarily examined the impact of environmental regulations on green technological innovation. Specifically, studies have sought to validate the Weak Porter hypothesis, which posits that moderate environmental regulations can spur innovation [38,39], and have explored the potential U-shaped relationship between environmental regulations and green technological advancements [40]. However, a consensus on these matters remains elusive. This study focuses on empirically analyzing how environmental regulations influence the implementations of green technological innovation in the manufacturing sector. Based on the regulatory approaches, we categorize environmental regulations into command-type and market-type regulations.
Command-type environmental regulation primarily imposes stringent constraints on the environmental practices of manufacturing enterprises through the formulation of strict environmental standards, the implementation of mandatory policies, or administrative enforcement. As regulatory stringency escalates, companies encounter elevated compliance costs and heightened survival pressures. They often must respond to increasingly stringent environmental protection requirements through green technological innovation, thereby fostering innovative impetus in otherwise passive contexts. From the perspective of risk control, the formation of environmental risk is primarily influenced by factors such as firms’ emission intensity, resource utilization efficiency, and the level of environmental management. In the realm of digital economy advancement, to meet environmental regulation requirements and mitigate environmental risks, manufacturing enterprises are increasingly adopting advanced digital technologies to achieve emission monitoring, process optimization, and eco-friendly upgrades. Consequently, the following hypotheses are posited:
H3:
Command-based environmental regulation exerts a positive moderating effect on the relationship between digital economic development and green technological innovation in manufacturing.
H3a:
Environmental regulations positively regulate the contribution of digital economy development to green technology innovation in manufacturing.
Market-based environmental regulation provides price signals and economic incentives for enterprises to invest in green initiatives and engage in innovation through the introduction of market mechanisms, prompting them to internalize environmental costs while pursuing profit maximization. Specifically, market-based regulation is based on the “polluter pays” principle, which involves a pollution charge mechanism. Therefore, the following hypotheses are proposed:
H4:
Market-based environmental regulation exerts a positive moderating effect on the relationship between digital economic development and green technological innovation in manufacturing.
H4a:
Pollution charges have a positive impact on the contribution of digital economy development to green technology innovation in manufacturing.
The theoretical model of this study is shown in Figure 1.
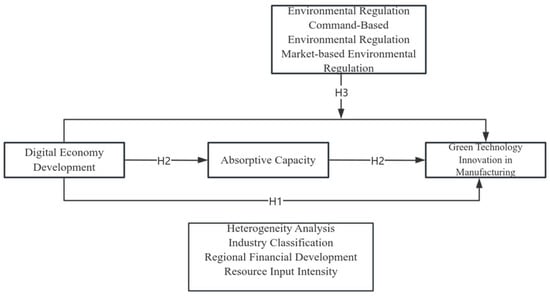
Figure 1.
The mechanism of digital economy development affecting the green technology innovation in manufacturing.
4. Research Design
4.1. Empirical Model Setting
(1) Based on Hypotheses H1 and H1a, we construct a nonlinear regression model with dual fixed effects to evaluate the impact of digital economy development on green technological innovation in the manufacturing sector. In this model, green technological innovation in manufacturing serves as the dependent variable, while digital economy development is specified as the independent variable. The model is as follows:
where j denotes province, i denotes subdivided manufacturing industry, and t denotes year. lnTECjit signifies the green technological innovation level of industry in province j, industry i, and year t. DEjit represents the digital economic development level in province j, industry i, and year t. The control variable controljit captures the factors influencing green technological innovation in the manufacturing industry at the provincial and industry levels. The term γjit denotes the fixed effects over time and across industries, while εjit represents the random error component. The coefficient β1 quantifies the linear effect of the province’s digital economic development level on industry green technology innovation, whereas β2 captures the nonlinear impact of the province’s digital economic development level on industry green technology innovation.
(2) Based on Hypothesis H2, to examine the mediating effect of absorptive capacity in the relationship between digital economy development and green technological innovation in the manufacturing sector, a mediation model is constructed following the method of Jiang [41]. In this model, absorptive capacity is introduced as the mediating variable, and the model is specified as follows:
LnABjit denotes absorptive capacity. By examining the direction and statistical significance of coefficients α1 and α2, and the mediating coefficient δ, we can evaluate the mediating role of absorptive capacity in the relationship between digital economy development and green technological innovation in the manufacturing sector.
(3) Based on Hypotheses H3, H3a, H4, and H4a, to examine the moderating effect of environmental regulation in the relationship between digital economy development and green technological innovation in the manufacturing sector, a moderation model is constructed as follows:
M denotes environmental regulation. By examining the direction and statistical significance of β3, we determine the moderating effect of environmental regulation on the relationship between digital economy development and green technological innovation in the manufacturing sector.
(4) To further examine the nonlinear relationship between digital economy development and green technological innovation, this study introduces the regional level of financial development (FD) as a threshold variable to test the potential threshold effects. Accordingly, the following threshold regression model is constructed:
FDit denotes the threshold variable of regional financial development, I denotes the indicator function, β represents the regression coefficients, and γ is the estimated threshold value.
4.2. Selection and Measurement of Variables
- (1)
- Dependent variable: Green technological innovation in manufacturing industries, referring to the practice of Qi [42]. We adopted the natural logarithm of the number of green invention patents authorized plus one in the subdivided manufacturing industries in each province to measure levels of green technological innovation (TEC). Furthermore, to solve the problem of inconsistency in industry categories, we referred to the methods used by Chen [43] and Liu [44], which adopted industrial classification merging and handled and retained 37 subdivided industries.
- (2)
- Independent variable: Digital economy development (DE). This study refers to the measurement methods of Wang [45] and Zhao [46], which are based on the connotation of the digital economy and focus on its conditions, applications, and environment. We developed a comprehensive system of indicators for the digital economy. This system establishes a total of four indicators for digital economy development, including carriers of digital economy development, digital industrialization, industrial digitization, and the development environment of the digital economy, reflecting the prerequisites necessary for the digital economy, ICT industry development, digital industry integration, and the development environment at the macro level. Six sub-indicators are selected, namely traditional infrastructure and new digital infrastructure reflecting the carrier of digital economy development; industry scale and industry types reflecting digital industrialization; industrial digitalization, as an embodiment of industrial digital transformation; and governance of the environment reflecting the environment of digital economy development. In addition, 20 tertiary-level indicators are selected based on the principles of scientificity, hierarchy, and data accessibility. Finally, we obtain the indicators for measuring the level of digital economy development at the provincial level in China from 2012 to 2020. The comprehensive system is shown in Table 1.
 Table 1. Indicator system for the level of development of the digital economy.
The detailed process of calculating China’s provincial digital economy development level is as follows:
Step 1: Standardize the global matrix data by employing dimensionless processing to ensure meaningful results in entropy logarithm calculations. This involves processing the global matrix data of diverse indicators to be non-negative for positive and negative indicators. Following the approach outlined in [47], a value of 0.0001 is added to the benchmark index in Equations (6) and (7):
i represents the province, and j denotes the indicator. Here, signifies the original value of the j-th indicator of province i, and denotes the standardized value of the j-th indicator of province i.
Step 2 involves calculating the proportions of indicators for province i in evaluation year m using Equation (8):
In Step 3, the entropy of the j-th indicator is calculated using Equation (9):
Step 4 entails calculating the difference coefficient of the j-th indicator with Equation (10):
Step 5 involves determining the entropy weight of the indicator, denoted as the weight of the j-th indicator relative to all indicators, using Equation (11):
Step 6 calculates the regional level of development of the digital economy of each province in year t with Equation (12):
- (3)
- Mediating variable: Absorptive capacity (Ab) as a mediating variable of digital economy development that promotes green technological innovation in the manufacturing industry. To measure absorptive capacity, this study adopts two approaches: R&D intensity, defined as the ratio of total R&D expenditure to total operating revenue of above-scale manufacturing enterprises in each province [48]; human capital with higher education: measured by the number of employees with higher education degrees in above-scale manufacturing enterprises in each province [49]. The rationale for selecting these two measures is as follows: First, manufacturing enterprises are required to adopt R&D investment strategies, as R&D intensity reflects their ability to absorb and accumulate external resources. Second, the number of highly educated employees captures a firm’s capability to acquire, internalize, and transform new knowledge.
- (4)
- Moderating variables: This study categorizes environmental regulation into command-type environmental regulation and market-type environmental regulation, with the former chosen as the variable. The number of local environmental regulations (ERA1) is used to measure the strength of environmental policy constraints. For market-based environmental regulation, the variable of pollution charge is used, which is represented by the environmental protection tax in each region (ERM1).
- (5)
- Threshold variable: In this study, the threshold variable is constructed to measure the level of regional financial development from three dimensions: financial scale, financial structure, and financial efficiency. Specifically, financial scale is measured by the ratio of the year-end loan and deposit balance of financial institutions to regional GDP, financial structure is proxied by the ratio of stock market transaction volume to the year-end loan balance of financial institutions, and financial efficiency is represented by the loan-to-deposit ratio of regional financial institutions at year-end. A composite index of regional financial development is then derived from these three indicators using the entropy method.
- (6)
- Control variables: This study selects the following control variables: the level of regional manufacturing development (IDU), expressed as the proportion of regional manufacturing value added in regional GDP; foreign direct investment (FDI), measured using the regional direct utilization of foreign investment indicators; the degree of marketization (MK), measured using the Fan Gang marketization index [36]; the size of the regional manufacturing sector assets (KSIZE), expressed as the total regional assets of the above-scale manufacturing sector; the size of the regional manufacturing sector labor force (LSIZE), expressed as the average number of workers of the above-scale manufacturing sector; regional manufacturing sector ownership structure (OS), expressed as the proportion of state-owned and state-controlled paid-in capital relative to the total paid-in capital of the above-scale manufacturing sector; and labor productivity in the manufacturing sector (LP), expressed as the regional scale of output value per unit of labor of the above-scale manufacturing sector.
Table 2 shows all of the variable indicators and measurement methods.
Table 2.
Selection and measurement of variables.
4.3. Sample Selection and Data Sources
This study focused on 37 manufacturing industries across 30 provinces in China (excluding Tibet, Hong Kong, Macao, and Taiwan due to data limitations), utilizing industry-level panel data for empirical analysis. All data are obtained from the China Industrial Statistical Yearbook, Local Industrial Statistical Yearbooks, China Environmental Statistical Yearbook, as well as the CSMAR and Wind databases. To ensure the robustness of the findings against confounding factors such as the Coronavirus Disease 2019 (COVID-19) pandemic, the research period was set from 2012 to 2020, resulting in 9990 observation samples. Data compilation involved utilizing information from Chinese above-scale manufacturing enterprises with annual revenues exceeding CNY 20 million between 1998 and 2013. (From 2014 to 2020, the number of newly established above-scale industrial enterprises increased at a relatively modest rate compared with 2013, with a growth rate of less than 5%. From a statistical perspective, this indicates that the sample data employed in this study are reliable.) This data was integrated with comprehensive databases on China’s industrial and commercial registration, as well as China’s patent application and authorization records, to establish industry-level manufacturing patent data through enterprise-level information matching. Additionally, employing the World Intellectual Property Organization’s (WIPO) latest criteria for green patent recognition, green patent data were identified and extracted from the patent samples. These green patents serve as key metrics for assessing the level of green technological innovation within the manufacturing sector and form the basis for subsequent empirical regression analyses.
4.4. Analysis of the Results of the Composite Index of the Level of Development of the Digital Economy
Table 3 displays the provincial digital economy development level in China, assessed using the entropy weight method. The data reveals a consistent increase in China’s digital economy development from 2012 to 2020, with the national average value climbing from 0.085 to 0.170. This progress underscores China’s success in promoting digital infrastructure, data integration, and digital industrialization. However, in some provinces (e.g., Hebei, Fujian, Jiangxi, and Sichuan), the composite index of digital economy development in 2020 declined compared with 2018. This may be attributed to multiple factors, including the impact of the COVID-19 pandemic, which led to a slowdown in digital economy investment within the manufacturing sector, a decline in the output value of pillar industries, and consequently, a reduction in the level of industrial digitalization. Nevertheless, a notable spatial disparity exists in the digital economy. The index of the eastern region is persistently higher than the national average. Although the eastern region as a whole remains ahead, the inter-provincial differentiation is obvious. Jiangsu, Guangdong, Beijing, and other core areas are experiencing rapid growth. The highest index was above 0.4 in 2020, but Tianjin, Hainan, and other areas experienced slow growth, indicating an internal phenomenon of “innovation resource re-centralization.” In 2020, the indices for the central region, the western region, and the northeast region were 0.144, 0.103, and 0.094, respectively. These regions have lower values than the country’s average. In terms of policy orientation, the country must enhance digital infrastructure, industrial integration, and technology investment in lagging-behind regions.
Table 3.
A comprehensive index of China’s digital economy development level.
Regional digital economy development trends are shown in Figure 2.
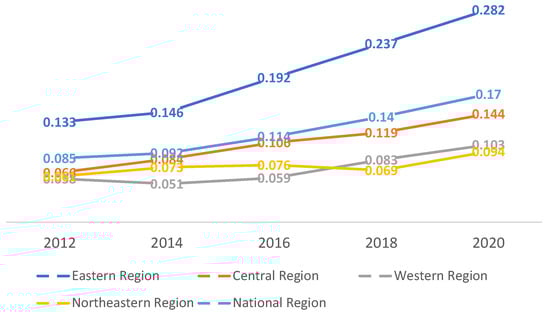
Figure 2.
The regional digital economy development trends in the eastern, central, western, northeastern, and national regions.
4.5. Descriptive Statistics
Table 4 presents the statistical properties of the variables. Specifically, the mean DE value is 0.119, with a standard deviation of 0.0881, suggesting a relatively modest level of digital economy development. The mean lnTEC value is 1.991, with a standard deviation of 1.891, indicating a comparatively low level of green technology innovation within the manufacturing sector. Notably, there is substantial variability, with a 8.691 difference between the maximum and the minimum values across the provinces and industries. This disparity underscores significant variations in green technology patent applications, highlighting pronounced heterogeneity in green technology innovation performance across different manufacturing sectors. This result is broadly consistent with the conclusions of existing international studies [50].
Table 4.
Descriptive statistics.
5. Analysis and Discussion of Empirical Results
5.1. Analysis of Baseline Regression Results
In Table 5, Columns (1–3) present the results of nonlinear regression with dual-fixed-effect analysis, incorporating a stepwise addition of control variables. In Column (1), without the inclusion of control variables, the coefficients of the linear and quadratic terms of digital economy development (DE) are 20.56 and −29.99, respectively; both are significant at the 1% level. To ensure robustness, this study employs a stepwise inclusion of control variables. In Column (2), after the incorporation of partial controls, the primary coefficient value of DE declines to 6.951, and the secondary coefficient value of DE increases to −8.144 yet remains significant at the 1% level. In Column (3), with all control variables introduced, the coefficients further shift to 6.827 and −7.563, both of which are still significant at the 1% level. These results indicate that the gradual inclusion of control variables reduces the magnitude of the linear coefficient of DE while simultaneously increasing that of the quadratic coefficient, underscoring the critical influence of omitted variables on regression outcomes. As shown in Column (3), after the incorporation of the full set of control variables, the results reveal that DE significantly fosters green technological innovation and exhibits a “nonlinear”, “inverted U-shaped” relationship, thereby proving Hypotheses H1 and H1a. Furthermore, the inclusion of control variables enhances the explanatory power of the model and renders the curvature of the nonlinear relationship more moderate, which further verifies the robustness of the nonlinear effect of digital economy development on green technological innovation in the manufacturing sector.
Table 5.
Results of the baseline nonlinear regression analysis.
Figure 3 illustrates the nonlinear relationship between digital economy development and green technological innovation in the manufacturing sector. The shaded area represents the 95% confidence interval. The turning point is 0.33, indicating that when the level of digital economy development is at the initial stage and remains below 0.33, it significantly promotes green technological innovation. However, as the degree of digitalization increases beyond the turning point, the marginal information cost increases and weakens the contribution of green technological innovation, exhibiting a nonlinear downward trend.
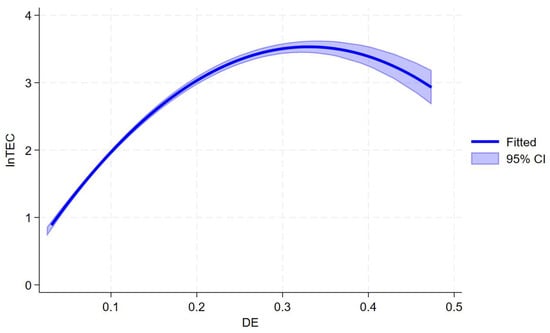
Figure 3.
The turning point is 0.33, and the 95% confidence interval is [0.31, 0.34].
The nonlinear (inverted U-shaped) relationship between digital economy development and green technological innovation in the manufacturing sector is shown in Figure 3.
5.2. Analysis of Mediating Effects
Table 6 presents the results of the mediation effect test of absorptive capacity in the relationship between digital economy development and green technological innovation in the manufacturing sector. Specifically, Columns (4) and (5) present the mediation regression results for dimension 1 of absorptive capacity, measured by the ratio of total R&D investment of large and above-scale manufacturing enterprises to their total operating revenue. The mediation value for dimension 1 of absorptive capacity is 0.545, and it is significant at the 1% level. Columns (6) and (7) present the mediation regression results for dimension 2 of absorptive capacity, measured by the number of employees with higher education in large and above-scale manufacturing enterprises. The mediation value for dimension 2 of absorptive capacity is 0.509, and it is also significant at the 1% level. In addition, both the linear and quadratic terms of digital economy development remain significant, indicating that digital economy development enhances the absorptive capacity of manufacturing enterprises, which in turn promotes green technological innovation. The results of Table 6 demonstrate the conduction mechanism of DE, DE2, lnAb, and lnTEC, thereby proving Hypothesis H2. These findings suggest that while advancing digitalization, enterprises should place greater emphasis on strengthening their absorptive capacity to effectively identify, integrate, and transform external knowledge, thereby maximizing the green innovation benefits brought by the digital economy. The results indicate that enterprises should prioritize developing absorptive capacity to effectively identify, integrate, and transform external knowledge, while enhancing their digitalization level, in order to maximize the impact of green technological innovation in manufacturing.
Table 6.
Results of the analysis of the mediated effects.
5.3. Analysis of the Moderating Effects
In Table 7, Columns (8) and (9) present the result of adding moderating variables of command-based environmental regulation and market-based environmental regulation. Column (8) shows that the coefficient of the interaction term between environmental regulation (measured by the number of environmental protection laws and regulations) and digital economy development is 0.676, and it is significant at the 1% level, indicating that under regulatory constraints, environmental regulation strengthens the positive impact of digital economy development on green technological innovation in the manufacturing sector. This suggests that a moderate increase in environmental protection regulations can reinforce the driving role of digitalization in green innovation, which indicates that under compliance pressure, enterprises are more inclined to adopt technological approaches to achieve energy conservation, emission reduction, and cleaner production; therefore, Hypotheses H3 and H3a are proved. Column (9) presents the results for market-based regulation, where the coefficient of the interaction term between pollution charges and digital economy development is 1.148 and is significant at the 1% level. Moreover, its moderating effect is stronger than that of command-based regulation, implying that market-based regulation plays a more prominent role in shaping the relationship. Compared with command-based regulation, market-based environmental regulation is more effective in stimulating enterprises’ cost sensitivity, which makes them more inclined to reduce emissions and compliance costs through green technology innovation in the process of digitization, thus forming a stronger “forced mechanism”, and H4 and H4a are proved.
Table 7.
Results of the analysis of the moderating effects.
5.4. Robustness Check
To assess the robustness of the benchmark regression findings, a series of robustness tests was performed, and the outcomes are presented in Table 8.
Table 8.
Robustness test.
- (1)
- Dependent variable replacement
In this examination, we substituted the original measurement of the dependent variable with the combined count of invention patents and utility model patents granted. This substitution is warranted as the primary objective of green technology innovation in manufacturing, making it a reasonable substitute for actualizing, implementing, and extracting utility from the innovative outcomes, rendering it a logical proxy. The outcomes are detailed in Column (10), revealing that the main coefficient estimate for DE stands at 6.218, while the secondary coefficient estimate for DE is −9.463. Both estimates exhibit statistical significance at the 1% level.
- (2)
- Tobit regression model
We choose the model of Tobit regression to ensure the robustness of the results, as the dependent variable is non-negative and may be subject to censoring. The Tobit estimation results are reported in Column (11). The primary coefficient value of DE is 5.585, and the secondary coefficient value of DE is −8.416. This shows that our main conclusions are not sensitive to the potential censoring of the dependent variable.
- (3)
- Two-sided shrinkage treatment
Furtherly, we performed a two-sided shrinkage treatment by winsorizing the continuous variables at the 1st and 99th percentiles. The regression results obtained after the shrinkage treatment are reported in Column (12). The primary coefficient value of DE is 7.054, and the secondary coefficient value of DE is −8.54. Both are significant at the 1% level.
- (4)
- The baseline nonlinear regression replacement
This study replaces the original nonlinear regression with a feasible generalized least squares model, which re-estimates the model, allowing panel-level heteroskedasticity and a common AR(1) process; the value of p is 0.81, and in Column (13), the primary coefficient value of DE is 3.284, which is significant at 1% level, and the secondary coefficient value of DE is −2.328, which is significant at 5%. The value of Wald chi2 is 7483 (p < 0.001); this test strongly rejects the null of joint insignificance. Thus, the nonlinear relationship is robust to alternative assumptions about error structure.
- (5)
- Endogeneity test
Although a series of control variables are introduced into the model to alleviate endogeneity concerns, potential endogeneity risks may still exist. To mitigate the possible reverse causality between the development of the manufacturing digital economy and green technological innovation, as well as the influence of unobservable regional factors, this study follows the approaches of Huang [51] and Li [52]. Specifically, the number of fixed telephones per 100 people in 1984 is selected as the first instrumental variable (IV1). The rationale is that the fixed telephone penetration rate in 1984 reflects the level of early regional communication infrastructure, which constitutes an essential foundation for subsequent digital development. The coverage of communication networks and the capacity for information dissemination can significantly affect the speed of internet adoption, the level of digital application, and the development of the information technology industry, thus meeting the relevance requirement. Since the fixed telephone data from 1984 are historical in nature and exert no direct impact on green technological innovation during the sample period, the exogeneity condition is also satisfied. To further enhance the explanatory power of the first instrumental variable, the interaction term between the year and the number of fixed telephones per 100 people in 1984 is constructed as the second instrumental variable (IV2). The logic is that the interaction between year and historical telephone penetration captures the persistent influence of early communication infrastructure on digital economy development over time, thereby better explaining temporal variations in the panel data and meeting the relevance condition. Moreover, such an interaction strengthens the explanatory power in the first-stage regression, alleviates weak instrument concerns, and does not directly affect green technological innovation, thereby satisfying the exogeneity condition.
Subsequently, a two-stage least squares (2SLS) model was employed to examine endogeneity. The outcomes are detailed in Table 9(1). The first-stage regression results reported in Column (14) indicate that IV1, IV2, and their squared terms are all significantly correlated with DE at the 1% level. The Kleibergen–Paap rk LM statistic is 883.1, which significantly rejects the null hypothesis and confirms the absence of weak identification problems. Meanwhile, the Kleibergen–Paap rk Wald F statistic (476.91) and the Cragg–Donald Wald F statistic (447.4) both exceed the Stock–Yogo critical value of 16.87 at the 10% significance level, further verifying the relevance and strength of the instruments. The second-stage regression results in Column (15) show that the coefficients of the linear and quadratic terms of DE are 6.504 and −10.23, respectively, both significant at the 1% level. The signs and magnitudes are consistent with those in the baseline regression, indicating that after endogeneity concerns are addressed, the nonlinear relationship between digital economy development and green technological innovation remains robust. In addition, the Hansen J-test yields a p-value of 0.3146, failing to reject the null hypothesis, which suggests that the instruments satisfy the exogeneity requirement and that no over-identification problem exists. Overall, the instruments meet both relevance and exogeneity conditions, effectively alleviating endogeneity concerns and ensuring the robustness of the regression results.
Table 9.
(1) Endogeneity test; (2) endogeneity test.
In measuring the intensity of environmental regulation, this study employs two indicators: the “number of local environmental protection regulations” and “pollution charges”. However, the intensity of environmental regulation may face potential endogeneity concerns. On the one hand, regions with a higher level of green technological innovation may, in turn, drive governments to implement stricter regulatory measures, thereby leading to reverse causality. On the other hand, insufficiently controlled factors such as regional economic development levels and industrial structures may simultaneously affect environmental regulation and green technological innovation, which may lead to the omitted variable bias. To mitigate these issues, this study adopts the following robustness checks in the empirical analysis: firstly, introducing a one-period lagged variable of environmental regulation to weaken potential reverse causality; secondly, incorporating region and year fixed effects to control for the unobservable factors.
Table 9(2) reports the results after introducing one-period lagged variables of “local environmental protection regulations” and “pollution charges” as well as incorporating region and year fixed effects. Column (16) shows that the coefficients of the linear and quadratic terms are 6.513 and −10.45, respectively, both significant at the 1% level, and the coefficient of DE*L_lnERA1 is 0.849 and is significant at the 1% level. Similarly, Column (17) reports coefficient estimates of 4.954 and −9.452 for the linear and quadratic terms, which are also significant at the 1% level, and the coefficient of DE*L_lnERM1 is 1.203 and is significant at the 1% level. These findings suggest that, after the alleviation of the potential endogeneity of environmental regulation intensity, the impact of environmental regulation on green technology innovation in the manufacturing sector remains significantly nonlinear. Specifically, moderate environmental regulation effectively stimulates green innovation, whereas excessively stringent regulation exerts an inhibitory effect.
5.5. Threshold Regression Analysis
Referring to the bootstrap method [53], 1000 resampling tests were conducted, and the threshold regression results are reported in Table 10. The findings indicate that the level of regional financial development exhibits a double-threshold effect in the relationship between digital economy development and green technological innovation. Specifically, when the regional financial development level is below 1.21, the impact of the digital economy on green technological innovation is significantly negative at the 1% level. In regions with underdeveloped financial systems, the expansion of the digital economy tends to suppress green innovation, as limited financial resource allocation compels enterprises to prioritize efficiency improvement over green technological innovation in the early stages of digital transformation. When financial development surpasses the first threshold, with values ranging between 1.21 and 2.08, the effect of the digital economy on green innovation becomes insignificant. However, the coefficient of the linear term increases significantly (from −3.182 to −0.0471), while that of the quadratic term decreases markedly (from 8.064 to −0.399), indicating that the negative effect gradually weakens. In this stage, enterprises experience alleviated financing constraints and enhanced risk-sharing. Once financial development exceeds the second threshold of 2.08, the impact of the digital economy on green technological innovation becomes significantly positive at the 1% level. This suggests that financial development optimizes capital allocation and improves the financing environment, thereby strengthening the promoting effect of the digital economy on green technology innovation. Nevertheless, as regional financial development continues to develop, the marginal effect slows down, implying that in highly developed financial systems, merely relying on digital economy investment may be insufficient to further stimulate green technology innovation. Hence, policy guidance is required to steer financial resources toward green-oriented digital applications, so as to avoid efficiency losses caused by “over-digitalization”.
Table 10.
Results of threshold regression analysis.
5.6. Heterogeneity Analysis
The preceding analysis examined the impact of digital economy development on green technological innovation in the manufacturing sector. However, significant heterogeneity may exist across manufacturing industries of different types in regions with varying levels of financial development. To further explore such heterogeneity, this study categorizes regions according to their level of financial development, classifies manufacturing industries by their level of pollution intensity, and further distinguishes manufacturing industries by the proportion of production resource input. These classifications provide a multi-perspective and multi-dimensional lens to reveal how the relationship between digital economy development and green technological innovation manifests differently across heterogeneous groups. This heterogeneity analysis contributes to a more nuanced understanding of the underlying mechanisms and provides more targeted policy implications.
The heterogeneity analysis reveals several important patterns. From the perspective of industry classification, Table 11 Column (19) reports the regression results for clean industries, where the coefficient of the linear terms of DE is 10.88 and the coefficient of the quadratic terms is −11.81, both significant at the 1% level. Compared with polluting industries, clean industries are better able to leverage digital technologies in data collection, business process reengineering, and resource allocation, thereby significantly enhancing green technological innovation. From the perspective of regional financial development, in regions with high levels of financial development, the coefficient of the linear terms of DE is 6.274, and the coefficient of the quadratic terms is −5.888; both are significant at the 1% level. This indicates that a sound financial system can help manufacturing enterprises alleviate financing constraints, optimize capital allocation, and strengthen risk-sharing mechanisms, thereby improving the availability and cost-efficiency of funds needed for green technological innovation, which in turn promotes the activity and quality of green technological innovation. From the perspective of factor input structure in labor-intensive industries, Column (23) shows that the coefficient of the linear term of DE is 9.719 and the coefficient of the quadratic term is −10.68; both are significant at the 1% level. The development of the digital economy promotes green technological upgrading by improving information acquisition efficiency, optimizing supply chain management, and enhancing production processes. In contrast, technology-intensive industries exhibit a more pronounced nonlinear relationship. Column (25) shows that the coefficient of the linear term of DE is 11.76 and the coefficient of the quadratic term is −13.52; both are significant at the 1% level. On the one hand, such enterprises possess stronger R&D capabilities and knowledge capital reserves, which enable them to embed digital technologies more effectively into various stages of green innovation. On the other hand, driven by high-value-added products and technological barriers, they are more inclined to adopt green technological innovation as a means of enhancing core competitiveness. For resource-intensive industries, however, the promoting effect of digital economy development on green technological innovation is relatively limited. While the coefficient of the linear terms of DE is 2.134 and is significant at the 10% level, indicating a modest positive effect, the coefficient of the quadratic term fails to pass the significance test, suggesting that the nonlinear relationship is not significant in this context. The reason is that resource-intensive industries heavily depend on natural resource inputs and operate under high energy consumption and environmental pressures. Although digitalization can improve resource utilization efficiency in certain production stages, the overall low technological dependency and insufficient investment in green R&D prevent digital technologies from being rapidly transformed into systemic green technological innovation.
Table 11.
Heterogeneity analysis: environmental impacts of enterprises’ production.
6. Research Conclusions and Recommendations
6.1. Research Conclusions
China’s transition toward high-quality development highlights the need for balancing economic growth with environmental sustainability. As a core pillar of the national economy, the manufacturing sector plays a critical role in this process. It is essential to understand the driving mechanisms of green technological innovation in the manufacturing sector, not only for strengthening industrial competitiveness but also for advancing ecological civilization and achieving sustainable development goals.
Using panel data covering 30 provinces and 37 subdivided manufacturing industries in China from 2012 to 2020, this study systematically investigates the impact of digital economy development on green technological innovation in manufacturing, including its effects, underlying mechanisms, threshold characteristics, and heterogeneity. The key outcomes of this analysis can be summarized as follows:
First, the regression analysis of the impact of digital economy development on green technological innovation in manufacturing shows that the linear term coefficient is 6.827 and the quadratic term coefficient is −7.563; both are significant at the 1% level. This presents a nonlinear, inverted U-shaped relationship between digital economy development and green technological innovation.
Second, existing studies have identified a nonlinear relationship between digital economy development and green performance, suggesting that excessive digitalization may result in resource misallocation and diminishing marginal returns (Lin, 2024) [54]. Building upon this, this study extends the analysis to the manufacturing sector and explicitly proposes that the “increasing marginal cost of information” constitutes a key mechanism underlying this nonlinear effect. The findings further reveal that China’s level of digital development has not yet reached the turning point, implying that the digital economy continues to promote green technological innovation in manufacturing. Nevertheless, this effect is not uniform, but rather shaped by the interplay of regional financial development, enterprises’ absorptive capacity, and the stringency of environmental regulation.
Third, the mediation analysis confirms that absorptive capacity constitutes a vital channel through which the digital economy promotes green technological innovation. Specifically, both R&D investment intensity and the proportion of highly educated employees act as positive mediators. By integrating R&D and non-R&D dimensions, this study provides a more holistic account of how digital technologies strengthen enterprises’ capabilities to acquire, assimilate, and apply external knowledge, thereby enhancing the effectiveness of green technological innovation.
Fourth, the threshold analysis reveals that regional financial development exerts a double-threshold effect on the relationship between digital economy development and green technological innovation in manufacturing. While prior studies have shown that financial development can alleviate financing constraints and foster green innovation [55], they have largely overlooked its nonlinear threshold effects. This study finds that once regional financial development surpasses the second threshold, it not only optimizes capital allocation and improves the financing environment, but also amplifies the positive impact of digital economy development on green innovation. These results highlight the stage-dependent boundary conditions under which the financial system shapes the digital economy’s role in driving green technological innovation.
Fifth, the heterogeneity analysis reveals that the positive effect of digital economy development on green technological innovation is mainly concentrated in cleaner industries and highly developed financial regions, while its impact is relatively weaker in pollution-intensive, resource-dependent industries. This indicates that institutional and resource conditions critically shape the boundary of policy effectiveness.
Sixth, by further incorporating external environmental regulation, the moderating mechanism analysis shows that environmental regulation significantly strengthens the nonlinear relationship between digital economy development and green technological innovation. As Li [56] argues, market-based regulation is more effective than command-based regulation in stimulating enterprises’ independent innovation. This study advances the discussion at the manufacturing level, which demonstrates that market-based environmental regulation exerts a stronger positive moderating effect compared with command-based regulation. This finding provides empirical evidence and policy implications for governments to promote green development.
6.2. Recommendations
Currently, digital economic development is emerging as a key driving force for green technological innovation in the manufacturing industry. These findings have important management implications:
First, despite the rapid development of the digital economy, significant regional disparities persist, with the eastern regions outperforming the central and western regions. To address this imbalance, China needs to enhance policy support for the central and western regions; strengthen digital infrastructure, for example, by expanding 5G networks and constructing large-scale data centers; and formulate financial policies that facilitate technological advancement, thereby improving regional financial development. This stands in contrast to the relatively balanced digitalization strategies observed in developed countries. For instance, the European Union has actively sought to reduce regional digital divides through initiatives of the “Digital Europe Programme”, which offers valuable insights for China to achieve more equitable nationwide digital development.
Second, we should strengthen the development of the digital economy as the landing point for promoting green technological innovation in the manufacturing industry. The relationship between digital economy development and green technological innovation is nonlinear; however, China’s average digital economy development level (0.17) remains below the turning value (0.33). On the one hand, it is essential to enhance both traditional and new digital infrastructure, accelerate the integration of industrial digitalization and digital industrialization, and foster a business environment conducive to digital economy development. On the other hand, manufacturing enterprises should deepen the integration of digital technologies, such as big data, cloud computing, and artificial intelligence, into product manufacturing and organizational management, in order to stimulate technological innovation and consolidate the foundation for green development, while avoiding the pitfalls of “over-digitalization”. In comparison, Germany’s Industry 4.0 emphasizes the coordinated advancement of “technology–green–efficiency”, while Japan highlights the parallel pursuit of smart manufacturing and energy conservation. All these experiences offer valuable international references for China.
Third, the transmission effect of absorptive capacity should be fully utilized. The test results of mediation show that manufacturing enterprises should make full use of the dynamic transmission mechanism of “digital economy development–absorptive capacity–green technology innovation”. Under the premise of balanced resource allocation, they should increase R&D investment, recruit high-quality talent teams, and continuously accumulate internal and external knowledge, skills, and experience. By developing diversified green knowledge solutions, enterprises can ultimately harness digital technologies to build intelligent production and management systems, thereby fostering green technological innovation.
Fourth, based on the analysis of the dual-threshold effect of regional financial development, different policy orientations should be adopted across regions with varying levels of financial development. In regions with a low level of development (financial development level < 1.21), the government should strengthen financial infrastructure, expand the coverage of green financial policies, and mitigate the “crowding-out effect” of digital economy expansion on green innovation. In regions with medium financial development (1.21 ≤ financial development level < 2.08), financial institutions should optimize green resource allocation mechanisms and enhance the effectiveness of green funding support. In highly developed regions (financial development level ≥ 2.08), manufacturing enterprises should proactively increase green R&D investment and diversify financing channels, while guarding against efficiency losses caused by “over-digitalization”. International experiences also provide useful insights: European countries have promoted green innovation through financial instruments such as green bonds and green funds, whereas emerging economies like India emphasize government subsidies to fill green financing gaps. These practices offer valuable references for the design of region-specific policies in China.
Fifth, when formulating environmental regulation policies, the government should balance its “incentive effect” and “constraint effect”. It is necessary to strike an appropriate balance between command-based environmental regulations and market-based environmental regulations, encouraging enterprises to increase green R&D through moderate environmental regulation. At the international level, the EU’s Emissions Trading System and the United States’ diversified clean energy incentive mechanisms demonstrate the critical role of environmental policies in fostering green innovation. While drawing on these international experiences, China should design differentiated and flexible environmental regulation policies that align with its industrial structure.
Sixth, different policies should be implemented in a “unique” manner to accurately match the characteristics of industries. Clean industries should strengthen the deep integration of digitization, polluting industries need to use digital technology to promote energy saving and emission reduction, labor-intensive industries need to enhance resource utilization through digitization, technology-intensive industries need to amplify the potential of green innovation through R&D investment and technological spillover, and resource-intensive industries need to promote the construction of green technology standards and resource recycling systems to enhance the overall green performance of digital transformation. Internationally, South Korea promotes intelligent manufacturing in labor-intensive industries, Japan strengthens green patent protection in technology-intensive industries, and Nordic countries establish recycling systems in resource-intensive industries. These practices provide international references for China to promote differentiated digitalization paths and enhance overall green performance.
Author Contributions
Conceptualization: K.L.; methodology: K.L. and Y.H.; software, data processing, formal analysis, resources, and data curation: K.L.; writing—original draft preparation: K.L.; supervision and writing—review and editing: K.L. and Y.H. All authors have read and agreed to the published version of the manuscript.
Funding
(1) This study was funded by the Agricultural Science and Technology Innovation Program, Chinese Academy of Agricultural Sciences (10-IAED-08-2025). (2) This study was funded by the Major Project of the National Social Science Fund of China: Research on Accelerating the Alignment of Production Relations with the New Quality Productive Forces (24ZDA021).
Institutional Review Board Statement
Not applicable.
Informed Consent Statement
Not applicable.
Data Availability Statement
The original data presented in this study are available on request from the first author.
Conflicts of Interest
The authors declare no conflicts of interest.
References
- Shi, D. Theory and practice of green development of China’s manufacturing industry—Along with the policy choice of deepening green development in the 19th National Congress. Contemp. Financ. Econ. 2018, 1, 3–11. [Google Scholar]
- Yang, M.; Xu, J.C.; Yang, F.X. Energy prices, capital energy efficiency and the path to peak carbon in China’s manufacturing sector. Econ. Res. 2022, 12, 69–86. [Google Scholar]
- Aghion, P.; Howitt, P. The Economics of Growth; MIT: Cambridge, MA, USA, 2009; pp. 131–166. [Google Scholar]
- Ferreira, J.J.; Fernandes, C.I.; Ferreira, F.A. Technology transfer, climate change mitigation, and environmental patent impact on sustainability and economic growth: A comparison of European countries. Technol. Forecast. Soc. Change 2020, 150, 119770. [Google Scholar] [CrossRef]
- Irfan, M.; Razzaq, A.; Sharif, A.; Yang, X. Influence mechanism between green finance and green innovation: Exploring regional policy intervention effects in China. Technol. Forecast. Soc. Change 2022, 182, 121882. [Google Scholar] [CrossRef]
- Dai, X.; Yang, S.Z. Digital Empowerment, Digital Input Sources and Greening Transformation of Manufacturing Industry. China Manuf. Econ. 2022, 9, 83–101. [Google Scholar]
- Wang, C.; Liu, Y.; Wan, Y.; Hu, S.; Xia, H. How does the digital economy impact the green upgrading of manufacturing? Perspectives on technological innovation and resource allocation. Appl. Econ. 2025, 57, 5049–5064. [Google Scholar] [CrossRef]
- Cao, Y.; Li, X.; Hu, H.L.; Wan, G.Y.; Wang, S.Y. How can digitalization promote green transformation of manufacturing enterprises?—An exploratory case study from the perspective of resource orchestration theory. Manag. World 2023, 39, 92–112+126+113. [Google Scholar]
- Shi, D.; Sun, G.L. Impact of the integration of digital economy and real economy on green innovation. Reform 2023, 2, 1–13. [Google Scholar]
- Guo, F.; Yang, S.G.; Chai, Z.Y. Has the digital transformation of enterprises promoted the “incremental improvement” of green technology innovation?—A textual analysis based on annual reports of Chinese listed companies. South. Econ. 2023, 2, 146–162. [Google Scholar]
- Liu, R.; Jiang, J.; Long, Y. How does the digital economy affect green innovation efficiency: Evidence from China. J. Environ. Plan. Manag. 2025, 68, 1514–1540. [Google Scholar] [CrossRef]
- Wang, X.; Ma, C.; Yao, Z. The double-edged sword effect of digital capability on green innovation: Evidence from Chinese listed industrial firms. Econ. Anal. Policy 2024, 82, 321–339. [Google Scholar] [CrossRef]
- Zhang, J.C.; Long, J. Digital transformation, dynamic capabilities, and firm innovation performance: Evidence from high-tech listed enterprises. Econ. Manag. 2022, 36, 74–83. [Google Scholar]
- Sun, Y. Digital transformation and corporates’ green technology innovation performance: The mediating role of knowledge sharing. Financ. Res. Lett. 2024, 62, 105105. [Google Scholar] [CrossRef]
- Lee, M.J.; Kim, Y.; Roh, T. Exploring the role of digital servitization for green innovation: Absorptive capacity, transformative capacity, and environmental strategy. Technol. Forecast. Soc. Change 2024, 207, 123614. [Google Scholar] [CrossRef]
- Porter, M.E.; van der Linde, C. Toward a new conception of the environment-competitiveness relationship. J. Econ. Perspect. 1995, 9, 97–118. [Google Scholar] [CrossRef]
- Wang, B.; Khan, I.; Ge, C.; Naz, H. Digital transformation of enterprises promotes green technology innovation: The regulated mediation model. Technol. Forecast. Soc. Change 2024, 209, 123812. [Google Scholar] [CrossRef]
- Peng, H.; Shen, N.; Ying, H.; Wang, Q. Can environmental regulation directly promote green innovation behavior? Evidence based on industrial agglomeration. J. Clean. Prod. 2021, 314, 128044. [Google Scholar] [CrossRef]
- Santoalha, A.; Consolo, D.; Castellaccia, F. Digital skills, relatedness and green diversification: A study of European regions. Res. Policy 2021, 50, 104340. [Google Scholar] [CrossRef]
- Bloom, N.; Jones, C.I.; Van, R.J. Are ideas getting harder to find? Am. Econ. Rev. 2020, 110, 1104–1144. [Google Scholar] [CrossRef]
- Liu, X.L.; Dong, C.T.; Ding, X.C. The era of digital innovation: China’s opportunities and challenges. Sci. Technol. Manag. 2020, 41, 3–15. [Google Scholar]
- Fang, G.; Chang, R.H. The impact of the Internet on knowledge value-added in enterprise collaborative innovation: The role of soft innovation resources. Sci. Technol. Prog. Countermeas. 2021, 38, 132–140. [Google Scholar]
- Li, L.; Liu, C.Q.; Han, M.C. Can informationization enhance enterprise innovation capacity: Evidence from the “two-chemical integration pilot zone”. Economics 2022, 22, 1079–1100. [Google Scholar]
- Han, Y.; Li, Z.; Feng, T.; Qiu, S.; Hu, J.; Yadav, K.K.; Obaidullah, A.J. Unraveling the impact of digital transformation on green innovation through microdata and machine learning. J. Environ. Manag. 2024, 354, 120271. [Google Scholar] [CrossRef] [PubMed]
- Miao, Z.; Zhao, G. Configurational paths to the green transformation of Chinese manufacturing enterprises: A TOE framework based on the fsQCA and NCA approaches. Sci. Rep. 2023, 13, 19181. [Google Scholar] [CrossRef] [PubMed]
- Ocasio, W. Towards an attention-based view of the firm. Strateg. Manag. J. 1997, 18, 187–206. [Google Scholar] [CrossRef]
- Eppler, M.J.; Mengis, J. The concept of information overload: A review of literature from organization science, accounting, marketing, MIS, and related disciplines. Inf. Soc. 2004, 20, 325–344. [Google Scholar] [CrossRef]
- Katz, M.L.; Shapiro, C. Network externalities, competition, and compatibility. Am. Econ. Rev. 1985, 75, 424–440. [Google Scholar]
- Arthur, W.B. Competing technologies, increasing returns, and lock-in by historical events. Econ. J. 1989, 99, 116–131. [Google Scholar] [CrossRef]
- Li, X.Y.; Chen, G.Q. Information technology investment, dynamic capabilities for technological innovation, and firm performance. Sci. Technol. Prog. Policy 2019, 16, 100–107. [Google Scholar]
- Yu, F.F.; Cao, J.Y.; Du, H.Y. Digital paradox: The double-edged effect of enterprise digitalization on innovation performance. Res. Dev. Manag. 2022, 34, 1–12. [Google Scholar]
- Pang, R.Z.; Li, D.G. The paradox of digitization and innovation: Does digitization promote corporate innovation—An explanation based on open innovation theory. South. Econ. 2022, 41, 97–117. [Google Scholar]
- Wang, M.L.; Song, Y.Y.; Yan, H.F. A study of the impact of digital transformation on the breadth of corporate internationalization: The mediating role of dynamic capabilities. Foreign Econ. Manag. 2021, 44, 33–47. [Google Scholar]
- Albort-Morant, G.; Leal-Rodríguez, A.; March, X. Absorptive capacity, relationship learning mechanisms as complementary drivers of green innovation performance. J. Knowl. Manag. 2018, 22, 432–452. [Google Scholar] [CrossRef]
- Chen, Y.; Tang, G.Y.; Jin, J.F. Linking market orientation and environmental performance: The influence of environmental strategy, employee’s environmental involvement, and environmental product quality. J. Bus. Ethics 2015, 127, 479–500. [Google Scholar] [CrossRef]
- Jing, W.M.; Zhang, L. Environmental control, opening up and green technological progress of Chinese industry. Econ. Res. 2014, 9, 34–47. [Google Scholar]
- Wang, L.H.; Wang, H.; Dong, Z.Q. Policy conditions for the compatibility of economic growth and environmental quality: A test of policy bias effects under the perspective of the direction of environmental technology progress. Manag. World 2020, 3, 39–60. [Google Scholar]
- Du, L.Z.; Zhao, Y.H.; Tao, K.; Lin, W.F. Compound effects of environmental regulation, governance transition on green competitiveness enhancement-empirical evidence based on China’s manufacturing industry. Econ. Res. 2019, 10, 106–120. [Google Scholar]
- Wan, P.B.; Yang, C.L. How environmental technology standards affect the green transformation of China’s manufacturing industry based on the perspective of technological transformation. China Manuf. Econ. 2021, 9, 118–136. [Google Scholar]
- Liu, W.J.; Du, M.Z.; Bai, Y. Impact of environmental regulation on green total factor productivity-a study based on the perspective of technological progress bias. China Popul. Resour. Environ. 2022, 3, 95–107. [Google Scholar]
- Jiang, T. Mediation and moderation effects in causal inference studies. China Ind. Econ. 2022, 5, 100–120. [Google Scholar]
- Qi, S.Z.; Lin, X.; Cui, B. Can environmental equity trading market induce green innovation? Evidence based on green patent data of listed companies in China. Econ. Res. 2018, 12, 129–143. [Google Scholar]
- Chen, S.Y. Estimation of statistical data by industry in China: 1980–2008. Economics 2011, 3, 735–776. [Google Scholar]
- Liu, C.J.; Zhang, S.H.; Li, X. Does green credit policy enhance green total factor productivity in China’s heavily polluting industries. Int. Financ. Stud. 2022, 4, 3–11. [Google Scholar]
- Wang, J.; Zhu, J.; Luo, Q. Measurement and Evolution of Digital Economy Development in China. J. Quant. Tech. Econ. 2021, 38, 26–42. [Google Scholar]
- Zhao, T.; Zhang, Z.; Liang, S. Digital Economy, Entrepreneurial Activity and High-Quality Development: Empirical Evidence from Chinese Cities. Manag. World 2020, 36, 65–75. [Google Scholar]
- Ma, X.F.; Zhang, R.; Ruan, Y.F. How to evaluate the level of green development based on entropy weight TOPSIS: Evidence from China. Int. J. Environ. Res. Public Health 2023, 20, 1707. [Google Scholar] [CrossRef]
- Liu, H.M.; Long, J.C.; Shen, Z.H. Research on the impact of digital transformation on green innovation of enterprises. Res. Manag. 2023, 10, 22–33. [Google Scholar]
- Li, F.; Dai, Y.; Zhang, D. Export activities, absorptive capacity, R&D cooperation, and innovation performance. Sci. Res. Manag. 2022, 43, 125–133. [Google Scholar]
- Biggi, G.; Mina, A.; Tamagni, F. There are different shades of green: Heterogeneous environmental innovations and their effects on firm performance. Res. Policy 2024, 53, 104803. [Google Scholar]
- Huang, Q.H.; Yu, Y.Z.; Zhang, S.L. Internet development and manufacturing productivity enhancement: Internal mechanism and Chinese experience. China Manuf. Econ. 2019, 8, 5–23. [Google Scholar]
- Li, Q.Y.; Li, Y.; Zhang, Y.S.N.; Zheng, H.T. Information spillover effect of enterprise digital transformation—Empirical evidence based on supply chain perspective. China Ind. Econ. 2023, 7, 142–159. [Google Scholar]
- Hansen, B.E. Threshold effects in non-dynamic panels: Estimation, testing, and inference. J. Econom. 1999, 93, 345–368. [Google Scholar]
- Lin, B.; Xie, Y. Impacts of digital transformation on corporate green technology innovation: Do board characteristics play a role? Corp. Soc. Responsib. Environ. Manag. 2024, 31, 1741–1755. [Google Scholar]
- Hsu, C.C.; Quang-Thanh, N.; Chien, F.; Li, L.; Mohsin, M. Evaluating green innovation and performance of financial development: Mediating concerns of environmental regulation. Environ. Sci. Pollut. Res. 2021, 28, 57386–57397. [Google Scholar] [CrossRef]
- Li, Y.; Ramanathan, R. Exploring the relationships between different types of environmental regulations and environmental performance: Evidence from China. J. Clean. Prod. 2018, 196, 1329–1340. [Google Scholar] [CrossRef]


Disclaimer/Publisher’s Note: The statements, opinions and data contained in all publications are solely those of the individual author(s) and contributor(s) and not of MDPI and/or the editor(s). MDPI and/or the editor(s) disclaim responsibility for any injury to people or property resulting from any ideas, methods, instructions or products referred to in the content. |
© 2025 by the authors. Licensee MDPI, Basel, Switzerland. This article is an open access article distributed under the terms and conditions of the Creative Commons Attribution (CC BY) license (https://creativecommons.org/licenses/by/4.0/).