Abstract
This paper presents the development and implementation of a shopfloor visualization-oriented digitalization framework for heterogeneous industrial equipment, aimed to enhance sustainable performance in manufacturing environments. The proposed solution addresses a critical challenge in modern industry: the integration of legacy and modern equipment into a unified, real-time monitoring and control system. In this paper, a modular and scalable architecture that enables data acquisition from equipment with varying communication protocols and technological maturity was designed and implemented, utilizing Industrial Internet of Things (IIoT) gateways, protocol converters, and Open Platform Communications Unified Architecture (OPC UA). A key contribution of this work is the integration of various data sources into a centralized visualization platform that supports real-time monitoring, anomaly detection, and performance analytics. By visualizing operational parameters—including energy consumption, machine efficiency, and environmental indicators—the system facilitates data-driven decision-making and supports predictive maintenance strategies. The implementation was validated in a real industrial setting, where the solution significantly improved transparency, reduced downtime, and contributed to measurable energy efficiency gains. This research demonstrates that visualization-oriented digitalization not only enables interoperability among heterogeneous assets, but also acts as a catalyst for achieving sustainability goals. The developed methodology and tools provide a replicable model for manufacturing organizations seeking to transition toward Industry 4.0 in a resource-efficient and future-proof manner.
1. Introduction
The digital transformation of manufacturing systems has become one of the most defining challenges and opportunities in the era of Industry 4.0. As industrial operations face increasing complexity, customization, and sustainability pressures, new technological paradigms such as the Industrial Internet of Things (IIoT), Cyber-Physical Systems (CPS), and Digital Twins (DT) have emerged to enable intelligent, flexible, and transparent production [1,2]. Among these, Shopfloor Visualization Systems (SFV) play a pivotal role in operationalizing digital data by translating complex machine, process, and system information into human-readable formats. Real-time visualization not only enhances situational awareness but also improves responsiveness, productivity, and decision-making [3,4].
Visualization systems offer a cognitive bridge between raw operational data and human interpretation. By presenting time-series data, alarms, performance indicators, and diagnostic messages through graphical dashboards, these systems empower operators, supervisors, and engineers to quickly understand and respond to emerging conditions on the factory floor [5]. In this context, several approaches have emerged in both academia and industry, attempting to model, simulate, and visualize shopfloor activities using digital tools ranging from static dashboards to immersive augmented reality [6,7]. These efforts aim to enhance production control, reduce downtime, and support lean and sustainable practices.
A growing body of literature has focused on the integration of DT architectures into manufacturing environments, enabling the creation of synchronized digital replicas of physical shopfloor systems [3,8]. Leng et al. [4] proposed a smart manufacturing framework based on Digital Twins, offering synchronized visualization and simulation of machine behavior, thus enabling predictive diagnostics and continuous optimization. Mohammad et al. [9] introduced a six-dimensional digital twin (HexaSFDT) architecture for smart shopfloors, integrating physical assets, cyber layers, services, and operational intelligence to offer a holistic and interoperable visualization model.
Beyond digital twinning, many authors have highlighted the importance of IIoT architectures in enabling machine-to-cloud communication and data availability at scale [5,10]. In this regard, IIoT devices such as edge gateways, wireless sensors, and protocol converters play a vital role in collecting machine-level data and transmitting it to visualization layers. However, these systems often face challenges in terms of latency, bandwidth, and data reliability, which has motivated the adoption of edge and fog computing paradigms for local processing [11]. Fog architectures allow real-time visualization to occur closer to the machine level, thereby supporting time-sensitive applications and reducing cloud dependency [12].
Despite these advancements, a critical limitation persists in most existing visualization frameworks: the assumption of a homogeneous, modern infrastructure. In many manufacturing settings—particularly small and medium enterprises (SMEs)—the equipment base is often composed of a mixture of legacy machines, analog-controlled systems, and vendor-locked proprietary devices that lack native digital interfaces [2,13]. Consequently, most visualization platforms fail to offer meaningful insights in such environments, as they lack the integration mechanisms necessary to connect and harmonize data from heterogeneous sources.
The issue of interoperability across heterogeneous equipment is among the most significant challenges in shopfloor digitalization [14]. Without standard communication protocols or unified data models, legacy machines often remain disconnected from the digital value chain. While OPC UA and MQTT provide protocol-level solutions, their effective application requires additional layers of data modeling, context-aware tagging, and semantic harmonization. Moreover, existing studies tend to focus on production metrics—such as throughput, OEE (Overall Equipment Effectiveness), or cycle time—while neglecting equally critical aspects such as energy consumption, sustainability, and system usability [9,15].
In recent years, sustainability has emerged as a core pillar of smart manufacturing. The integration of energy monitoring into shopfloor visualization systems enables manufacturers to track power usage in real time, identify inefficiencies, and reduce environmental impact [15]. Digital systems that provide feedback on energy profiles per shift, per machine, or per process can lead to more informed behavior among operators and energy managers, contributing to broader corporate sustainability goals.
Another key consideration that is frequently overlooked in the literature is the human–machine interaction (HMI) dimension of visualization systems. While some authors have explored the use of augmented reality (AR), wearable devices, and gesture-based interfaces [6], few systems address the interpretability and usability of visualization platforms across multiple organizational roles. From operators monitoring alarms to managers analyzing trends, the design of a shopfloor visualization system must cater to a wide spectrum of user needs, cognitive loads, and decision hierarchies.
Moreover, real-time visualization platforms must be designed with scalability and modularity in mind. As production facilities evolve, integrate new equipment, or change layouts, the digital infrastructure should be adaptable without requiring extensive redesign. Systems built on open protocols, reusable ontologies, and vendor-independent architectures are more likely to succeed in practice. This is particularly important in brownfield environments where replacing legacy equipment is neither economically viable nor operationally acceptable.
Given this context, there is a growing demand for practical, validated architectures that can facilitate visualization-based digitalization in environments characterized by technological heterogeneity. However, very few studies provide end-to-end solutions that span data acquisition, protocol translation, semantic modeling, real-time dashboards, energy monitoring, and predictive diagnostics—especially in the context of legacy integration.
To address these gaps, this paper proposes a Shopfloor Visualization-Oriented Digitalization Architecture (SV-ODA) that supports real-time monitoring and control across mixed-generation equipment. The solution integrates IIoT gateways, OPC UA—based semantic mapping, a SCADA-driven dashboard system, and custom modules for energy and condition monitoring. Unlike other conceptual models, this system has been fully implemented and validated in a real production facility comprising more than twenty diverse machines, ranging from modern CNC systems to analog-controlled legacy assets. The system architecture enables centralized visualization of equipment status, alarm events, energy consumption trends, and fault diagnostics, contributing both to operational efficiency and ecological sustainability.
The proposed system supports various user levels—from machine operators to energy analysts—by offering hierarchical dashboards that facilitate decision-making at both the tactical and strategic levels. In addition to improving equipment utilization and minimizing unplanned downtime, the platform fosters a culture of data-driven continuous improvement aligned with Industry 4.0 principles.
In summary, the present article addresses critical gaps in the literature by delivering a fully functional, scalable and validated visualization infrastructure for shopfloor environments characterized by high equipment heterogeneity. By combining real-world deployment with methodological rigor and modular design principles, the study contributes a replicable blueprint for intelligent and sustainable digital transformation in manufacturing.
2. Scientific Contribution and Proposed Technological Innovation
This research proposes an innovative and replicable architectural framework dedicated to the visualization-oriented digitalization of industrial shopfloors composed of heterogeneous equipment, including both legacy and modern systems. The scientific contribution of the paper consists in the development of a fully integrated and modular digital infrastructure that enables real-time interoperability, monitoring, and optimization across production assets with varying levels of technological maturity. The system was designed to overcome one of the most persistent challenges in industrial digitalization: the lack of standardized communication, limited connectivity, and data fragmentation in environments where legacy equipment is still dominant.
The proposed architecture introduces a coherent end-to-end approach that connects physical machines—regardless of manufacturer, protocol, or age—using Industrial Internet of Things gateways capable of extracting and converting data from non-networked machines, including those operating on RS-232, Modbus RTU, analog I/O, or proprietary signal lines. These gateways were combined with protocol abstraction layers based on OPC UA, enabling semantic harmonization and data normalization across devices. All incoming data were centrally modeled using a scalable and tag-based ontology, allowing for unified interpretation, cross-machine comparisons, and long-term storage in time-series databases.
The technological innovation extends beyond communication integration and focuses strongly on visualization as an operational and strategic layer. A real-time SCADA platform was used to develop a dynamic, interactive visualization environment, where operators, supervisors, and maintenance teams can monitor machine states, energy consumption, alarm history, and production performance in a multilayered dashboard structure. This visualization system includes a plant-level overview with color-coded machine statuses, area-level filtering, and machine-specific interfaces with real-time KPIs, trends, and condition indicators, making it possible to identify anomalies, track efficiency, and support predictive maintenance processes.
A distinctive feature of this work is the incorporation of live energy monitoring and sustainability tracking within the same platform. By integrating non-invasive current sensors and custom data acquisition modules, the system is capable of evaluating energy usage per machine and per shift, detecting unnecessary idle time, and highlighting inefficiencies. This supports not only economic goals but also ecological sustainability, aligning the digital infrastructure with current green manufacturing initiatives.
In terms of applicability, the system has been deployed and validated in a real production facility containing over twenty heterogeneous machines, including CNC equipment, robotic systems, and analog-controlled legacy assets. The successful integration of all components within this mixed environment confirms the robustness, flexibility, and scalability of the proposed framework. Operational results demonstrate significant improvements in key performance indicators, including reduced downtime, faster fault detection and intervention, increased operator situational awareness, and measurable reductions in standby energy consumption.
From a methodological perspective, the design of the system emphasizes modularity, vendor-independence, and ease of replication. The choice of open communication standards, configurable software platforms, and reusable data structures allows the solution to be extended to other industrial contexts without substantial redesign. The architecture developed in this research offers a practical model for facilities seeking to initiate or accelerate digital transformation processes without replacing existing infrastructure.
Furthermore, the research contributes to the broader scientific discourse by providing a validated, real-world solution to a common but under-addressed problem: how to achieve smart manufacturing capabilities in environments constrained by equipment heterogeneity and technological obsolescence. The proposed system not only closes critical interoperability gaps but also provides an extensible platform for future research directions such as digital twin synchronization, artificial intelligence-based diagnostics, and the use of semantic web technologies in industrial automation.
In the implementation stage, existing solutions such as direct OPC UA connectivity, MQTT, or commercial gateways were evaluated. The limitations of existing solutions reveal that they could not efficiently integrate legacy equipment operating on RS-232, Modbus RTU, or analog signals. For this reason, custom modules and hardware retrofits were developed to enable signal conversion and connectivity. The uniqueness of the proposed SV-ODA approach stems from the fact that it was validated for industrial assets of very different technological maturity, ensuring full interoperability where standard solutions alone could not be applied.
In practice, IIoT gateways were used to acquire both digital and analog signals. Noise was mitigated through numerical filtering (e.g., moving average) and threshold-based validation for critical signals such as spindle speed or current. In case of communication interruptions, gateways performed local buffering and synchronized with the central database once the connection was re-established. For low-reliability analog signals, calibrated non-invasive clamp-on sensors and redundant readings were employed, minimizing acquisition errors.
In conclusion, the scientific contribution of this work is evident: it delivers a complete and functional technical solution for real-time integration and visualization in industrial settings with diverse assets, and it provides a methodological and conceptual framework that can be used by researchers and practitioners to further develop adaptive, sustainable, and intelligent manufacturing systems.
3. Materials and Methods
The implementation of a real-time, visualization-oriented digitalization system in an industrial environment requires a carefully structured methodology and a robust architectural foundation capable of ensuring interoperability between diverse technological assets. In the present study, a comprehensive digital integration framework—referred to as the SFV—was designed, configured, and validated within a real production facility, with the goal of enabling centralized monitoring, enhanced situational awareness, and sustainability tracking across heterogeneous equipment infrastructures.
3.1. Rationale for Visualization and Digital Integration
Modern industrial shopfloors typically consist of a mixture of technologically diverse machines, including digitally native CNC systems, PLC-controlled robots, and legacy equipment without built-in connectivity. This heterogeneity poses significant barriers to effective process monitoring and optimization. The necessity of implementing a unified visualization layer stems from several critical needs: ensuring real-time visibility of machine status, enabling rapid response to process anomalies, monitoring resource consumption, and facilitating predictive maintenance through consistent data availability. In such a context, visualization is not a cosmetic add-on, but rather a strategic enabler for digital transformation and sustainability (Figure 1).
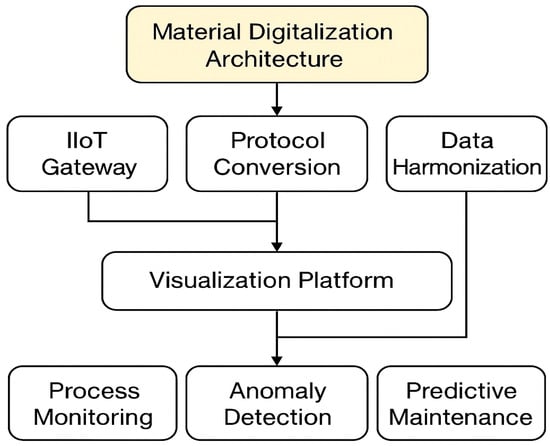
Figure 1.
Architecture of the Visualization-Oriented Digital Integration framework for heterogeneous industrial equipment.
3.2. System Architecture and Communication Topology
The architecture of the SFV system is structured into three principal functional layers: the equipment communication layer, the data integration and modeling layer, and the visualization and interaction interface layer. At the lowest level, data acquisition is performed via IIoT gateways capable of communicating with both modern equipment using native protocols (e.g., OPC UA, MQTT) and legacy machines using Modbus RTU, RS-232, or analog signal conversion. These gateways serve not only as protocol translators, but also as edge-computing units that buffer, preprocess, and time-stamp incoming data streams before forwarding them securely to the central server (Figure 2).
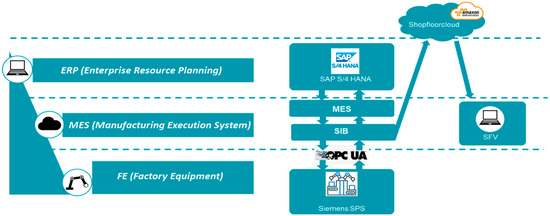
Figure 2.
Conceptual diagram of the SFV system architecture, showing equipment-gateway-server hierarchy.
Data exchange between modules was implemented through OPC UA for semantic harmonization and MQTT/REST for integration with external applications. Protocol conversion was performed within IIoT gateways using standard drivers for RS-232 and Modbus RTU. No proprietary algorithms were used; instead, well-established industrial standards were applied to ensure interoperability and replicability.
The implementation used commercial IIoT gateways (Advantech (Taipei City, Taiwan) and Siemens (Munich, Germany)), OPC UA node structures organized into hierarchical tags (machine states, process parameters, energy metrics), and non-invasive clamp-on electrical sensors with ±1% measurement accuracy for current and voltage. These details were documented during the industrial deployment.
The intermediate layer is responsible for semantic normalization and data modeling. It includes OPC UA servers and a harmonization module that standardizes the interpretation of equipment status, cycle counters, alarms, and energy readings into a unified format compatible with the visualization platform. Each connected machine is modeled as a digital asset with well-defined data tags, operational states, and energy metrics, enabling the abstraction of physical behavior into machine-readable representations.
3.3. Shopfloor Visualization Interface and User Interaction Design
The topmost layer—the visualization interface—was developed using the Ignition SCADA platform and adheres to the principles of human-centered design and situational awareness. The main screen presents a plant-wide 2D layout with interactive icons representing each connected asset. These icons dynamically update based on live machine status and they are color-coded according to operational condition (e.g., green for active, yellow for idle, red for error, gray for disconnected).
Navigation is organized hierarchically into three levels (Figure 3):
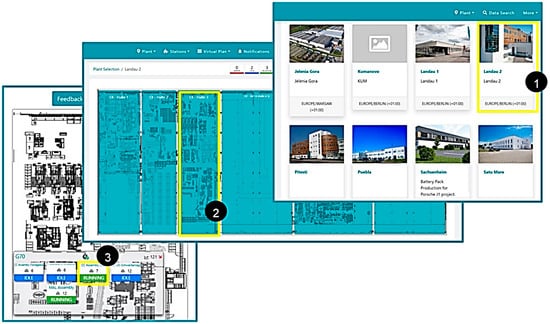
Figure 3.
Screenshot of global plant view with color-coded machine states.
- Global View—real-time status of all assets on a facility-wide map.
- Area View—focused visualization for specific production zones.
- Machine Detail View—in-depth metrics, charts, and historical logs for each machine.
Each detail page integrates real-time metrics, including spindle speeds, operating time, energy consumption, and alarm histories. Interactive graphs and drill-down panels enable operators and engineers to trace root causes of failures, compare performance over time, and monitor deviations from expected behavior (Figure 3 and Figure 4).
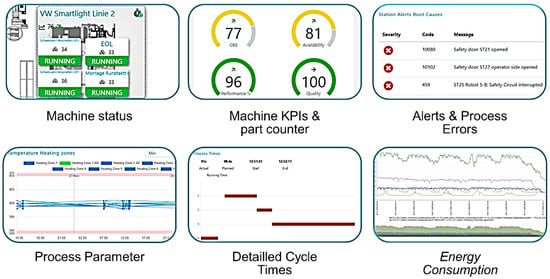
Figure 4.
Machine-level dashboard with live KPIs and historical trends.
3.4. Data Management and Analytical Capabilities
All acquired data are stored in a time-series database optimized for high-frequency industrial signals. Data integrity is ensured through time stamping at the edge, redundant buffering during connectivity interruptions, and automatic synchronization upon re-establishment of communication. This historical data backbone enables advanced analytics, such as:
- Trend analysis of cycle times and idle durations;
- Energy profiling per machine or production line;
- Correlation between alarm frequency and machine operating conditions;
- Evaluation of Overall Equipment Effectiveness (OEE) components.
Data from the SFV system can also be exported to higher-level enterprise systems (e.g., MES, ERP) or cloud analytics platforms through REST APIs or MQTT brokers, facilitating multi-level integration across the digital ecosystem (Figure 5).
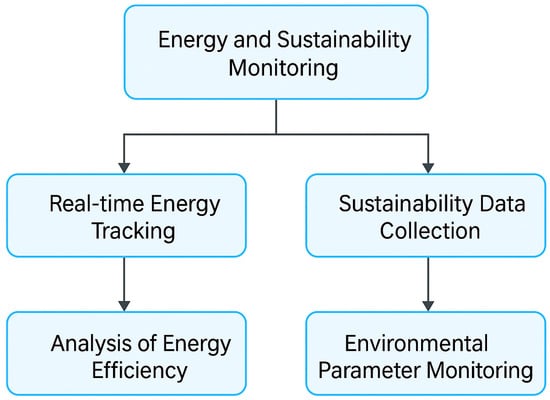
Figure 5.
Smart monitoring workflow for energy efficiency and sustainability in heterogeneous industrial environments.
3.5. Implementation Strategy and Industrial Deployment
The deployment followed a phased methodology:
- Phase I—Equipment audit and connectivity mapping: detailed technical assessment of communication capabilities and sensor availability.
- Phase II—Hardware installation and retrofit: deployment of IIoT gateways, clamp-on current sensors, and condition monitoring devices for legacy assets.
- Phase III—SCADA configuration and OPC UA modeling: creation of semantic tag structures, alarm templates, and machine profiles.
- Phase IV—Visualization layer design: user interface design using UX principles tailored to operator and manager needs.
- Phase V—Testing, feedback, and iterative optimization: real-time operational validation and fine-tuning based on on-site usage.
The final configuration included more than 20 interconnected industrial assets, with varying degrees of automation maturity. The architecture proved to be modular and scalable, allowing the addition of new machines with minimal effort and configuration overhead (Figure 6).
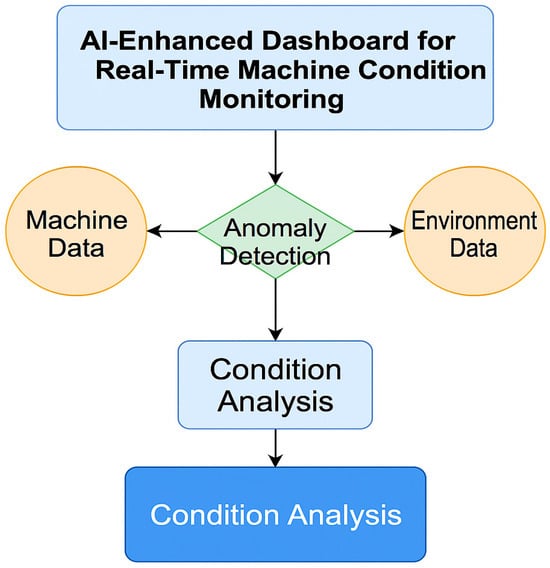
Figure 6.
AI-enhanced predictive maintenance and anomaly detection workflow for industrial equipment.
3.6. Security, Accessibility and Maintainability
The system incorporates several cybersecurity and accessibility features:
- Encrypted communication between gateways and SCADA via TLS;
- Role-based access control with user-specific permissions for viewing or editing;
- Redundant data storage with automated backup routines;
- Web-based access via secure login for supervisors and management.
The modular structure of the SFV system allows for easy maintenance, versioning of interface modules, and remote updates, ensuring long-term adaptability in dynamic production environments (Figure 7).
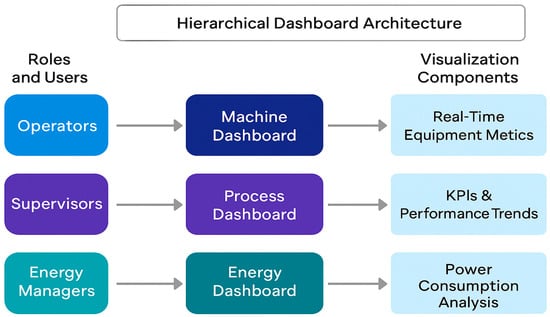
Figure 7.
Integrated data flow for real-time decision support in heterogeneous production systems.
In the deployed system, all gateway–server communications were encrypted using TLS 1.3, and access to the visualization layer was granted only through authenticated role-based permissions (operator, technician, manager). Additionally, access logs and security alarms were regularly monitored. Replay and spoofing attacks were prevented through timestamping at the source and NTP synchronization, while DoS attacks were mitigated by isolating the industrial traffic into a dedicated segmented network, independent from the general-purpose IT infrastructure.
4. Results
The implementation of the proposed Shopfloor Visualization-Oriented Digitalization System led to measurable improvements and tangible operational transformations in the production environment under study. Following an extended validation period in a live manufacturing setting, the system demonstrated its ability to significantly enhance process visibility, reduce response time to failures, support energy efficiency initiatives, and facilitate condition-based maintenance strategies across a heterogeneous equipment infrastructure.
By leveraging a modular architecture and protocol-agnostic communication model, data from a diverse array of industrial assets—including modern CNCs and legacy machines—were collected, harmonized, and visualized through a unified, real-time SCADA-based interface. The resulting visibility into production operations allowed operators to detect deviations or faults at an early stage and act accordingly. For instance, system deployment resulted in a 23% reduction in unplanned downtime, primarily due to improved fault localization and alarm diagnostics. As shown in Figure 8, the evolution of machine states over a one-week production interval demonstrates a clear decline in alarm states and a relative increase in productive operating time.
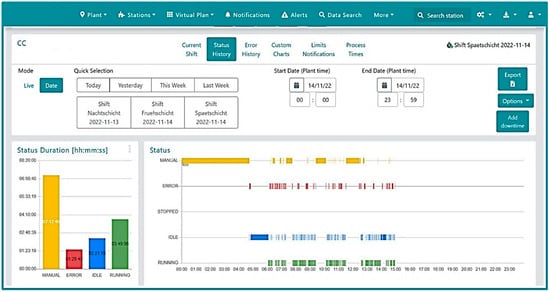
Figure 8.
Evolution of equipment operating states following SFV system implementation.
Another significant impact of the system was a 31% reduction in average intervention time during machine faults. This improvement was made possible by the real-time display of active alarm codes and the automated notification mechanisms directed at maintenance personnel. Figure 9 highlights the distribution of alarm types and their associated average response times, both before and after SFV implementation.
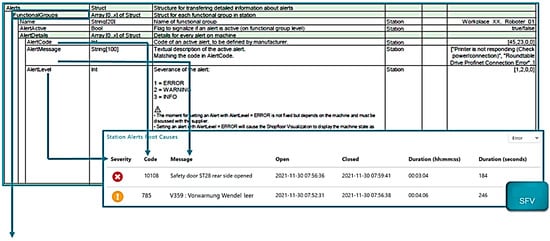
Figure 9.
Alarm distribution and maintenance response times before and after SFV deployment.
Beyond operational performance, the system delivered critical benefits in the area of energy management and sustainability monitoring. By integrating non-invasive electrical current sensors and smart metering solutions, the system enabled real-time tracking of energy consumption per machine and per production shift. As a result, idle energy consumption was reduced by approximately 17%, a gain achieved by identifying and eliminating unnecessary machine standby periods. In Figure 10, comparative consumption profiles demonstrate this reduction by showing energy usage patterns before and after SFV system deployment.
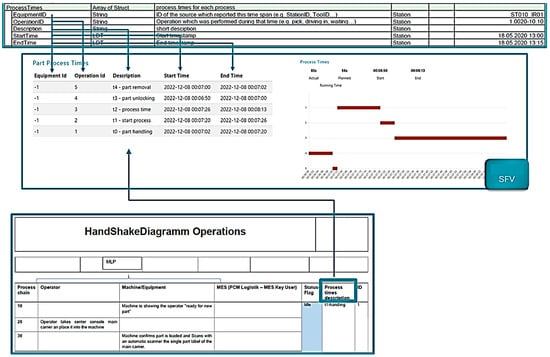
Figure 10.
Energy consumption profile per equipment unit—before and after SFV integration.
The reported 23% downtime reduction and 17% idle energy savings were obtained by monitoring the same set of more than twenty machines over several weeks. Testing methodology relied on before/after comparison of key performance indicators using historical baseline data and time-series analysis.
Furthermore, the availability of time-series data enabled the detection of recurring anomalies, such as excessive idle durations at the start of shifts or sudden energy spikes in specific time intervals. These patterns—difficult or impossible to detect through traditional supervision—were visualized through analytical dashboards embedded in the SFV interface.
The system also contributed meaningfully to managerial decision-making, as key performance indicators were accessible via mobile and web interfaces and could be aggregated into automated reports. This increased the responsiveness of the management team and enabled timely corrective actions when deviations from standard parameters were detected.
From the users’ perspective, the system was perceived as intuitive and functionally valuable. The main graphical interface—depicted in Figure 3—was frequently used by operators for live process tracking, while the detailed machine-level dashboards (Figure 4) allowed technicians to access alarm histories, energy trends, and current equipment status without needing to physically inspect each asset. This substantially increased the efficiency of maintenance and operational workflows.
Despite these positive outcomes, the project also encountered certain technical limitations. The integration of legacy equipment proved more complex than initially anticipated, requiring custom hardware retrofits and non-standard signal acquisition setups. Furthermore, the reliable operation of the system was contingent upon a stable industrial network infrastructure and well-defined cyber security protocols. These challenges were addressed through the implementation of encrypted data channels, automated backups, and granular user access control, though they remain important considerations for large-scale deployments.
In summary, the results validate the hypothesis that visualization-driven digitalization architecture, grounded in interoperability and modularity, can significantly enhance both operational performance and sustainability in manufacturing environments composed of heterogeneous technologies. The SFV system is not merely a monitoring tool, but a strategic enabler of smart industrial transformation and data-driven management.
The reported results strictly reflect data collected from the industrial site where deployment was performed. Potential biases were controlled by:
- Acquiring data over extended time intervals (several weeks);
- Comparing energy consumption and alarms before and after implementation on the same equipment;
- Correlating performance indicators (OEE, downtime, energy) with production output levels to avoid misattributing improvements to contextual variations.
5. Discussions
This study has demonstrated that the implementation of a visualization-oriented digitalization system tailored for heterogeneous shopfloor environments can serve as a critical enabler for real-time monitoring, operational optimization, and sustainable manufacturing performance. The architecture developed—designed to integrate both modern and legacy equipment—proved to be scalable, modular, and functionally robust in an industrial context characterized by technological diversity and limited native interoperability.
The results obtained throughout the deployment and evaluation phases confirmed the initial working hypothesis: namely, that a unified visualization framework, built upon IIoT-enabled communication, real-time SCADA interfaces, and semantic data modeling, it can reduce equipment downtime, accelerate maintenance response, and it provide actionable insights into energy consumption and process inefficiencies. The observed improvements (e.g., 23% downtime reduction, 17% energy savings in idle states, and 31% faster maintenance interventions) are consistent with prior findings in literature [3,4,6,10], which emphasize the operational impact of real-time data transparency and integrated monitoring. However, unlike many earlier studies that assume homogeneity in industrial infrastructure [5,7,13], this work addressed a broader and more practical challenge—enabling digital transformation in environments with legacy-dominated assets and limited native connectivity.
Furthermore, the human–machine interaction layer developed in this project adds an important dimension to the discourse on Industry 4.0 adoption: the effectiveness of such systems is not only a function of technological capability, but also of usability, interpretability, and alignment with operators’ workflows. The SFV interface—structured in layers from global plant overviews to machine-level analytics—demonstrated both technical relevance and user acceptance, thereby confirming that visualization is a powerful medium for translating raw industrial data into contextualized and operationally meaningful information.
Although validation was carried out in a discrete manufacturing facility (CNC, robotic, and legacy machines), the system has already demonstrated the capability to acquire and harmonize continuous process data (e.g., current, temperature, cycle time). The same gateway infrastructure and SCADA architecture can be applied to process industries (chemical, pharmaceutical, food), since data is collected, filtered, and visualized in the same way.
In broader terms, this research contributes to the ongoing discussion about how digital technologies can be leveraged not only for productivity gains, but also for sustainability objectives. By integrating real-time energy monitoring and supporting behavioral change (e.g., identification and elimination of energy-wasting practices), the SFV system aligns with the principles of green manufacturing and sustainable digitalization, a topic increasingly emphasized in recent literature [9,12,14].
From a methodological perspective, the modular implementation approach and layered architecture proposed in this study can serve as a replicable model for other facilities facing similar challenges. The use of OPC UA for semantic abstraction, the adaptation of non-invasive energy sensors, and the deployment of web-accessible SCADA dashboards constitute best practices that may be generalized across different industrial sectors.
The discussion was primarily focused on practical outcomes. However, results were compared against standard industrial indicators such as OEE, mean intervention time, and specific energy consumption. The academic contribution lies in demonstrating the feasibility of heterogeneous equipment integration under real-world industrial conditions, which is rarely addressed in existing literature.
The comparative analysis illustrated in Figure 11 demonstrates that the SV-ODA architecture surpasses the limitations of existing frameworks, particularly in legacy equipment integration, sustainability monitoring, and validation under real industrial conditions. While many current digitalization approaches remain conceptual or focus mainly on operational metrics, SV-ODA combines modularity, interoperability, and energy-oriented monitoring in a functional and replicable platform. This positioning establishes SV-ODA as a pragmatic solution that bridges traditional SCADA systems with advanced Digital Twin architectures, offering both immediate benefits and a foundation for future enhancements.
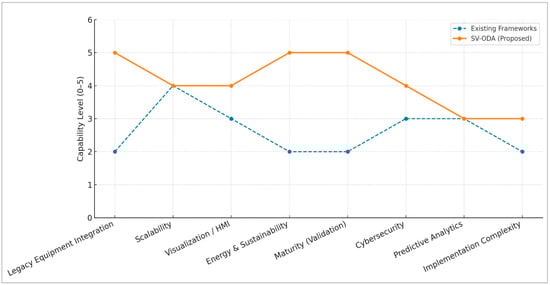
Figure 11.
Comparative analysis: SV-ODA vs. existing digitalization frameworks.
Despite these contributions, the study is not without limitations. The complexity of integrating non-standard and legacy machines required customized hardware and significant configuration effort, limiting initial scalability. Additionally, the system’s effectiveness depends on stable network infrastructure and well-defined security policies—factors that may vary across factories. Furthermore, while the visualization interface supported operational decision-making, its predictive capabilities remain limited to descriptive analytics.
Future research directions include the integration of machine learning algorithms for anomaly detection and predictive maintenance, the extension of the SFV platform to support digital twin synchronization, and the exploration of interoperability standards beyond OPC UA, such as Asset Administration Shells (AAS) or semantic web technologies. It would also be beneficial to evaluate the long-term behavioral impact of real-time visualization on operator decisions and energy efficiency, possibly through controlled longitudinal studies.
In conclusion, in this the paper is presented a significant step toward enabling real-time shopfloor intelligence in mixed-technology environments. The systems successful implementation and performance validation in an industrial setting provide not only proof of concept but also a concrete pathway toward smart, sustainable, and inclusive digitalization in manufacturing (Figure 12).

Figure 12.
Visualization of implementation challenges and measurable benefits of the proposed digitalization framework.
6. Conclusions
This study has presented the design, development, and validation of a visualization-oriented digitalization framework capable of integrating heterogeneous industrial equipment—both legacy and modern—into a unified, scalable, and real-time monitoring system. The results obtained demonstrate the practical viability and technological relevance of the proposed architecture, which successfully bridges communication gaps and creates operational visibility in complex, multi-generational industrial environments.
The significance of this research lies in its applied contribution to a long-standing challenge in digital transformation: the lack of interoperability and visibility in factories operating with diverse and often outdated technological assets. While many existing solutions assume a homogeneous or recently modernized infrastructure, this work addresses a broader, more realistic industrial context, making it highly applicable for small and medium enterprises and transition-phase production sites.
By employing IIoT gateways, OPC UA protocol abstraction, and a semantic SCADA interface, the proposed system enabled centralized visualization of machine states, energy consumption, fault history, and process performance metrics. The implementation led to quantifiable operational improvements, such as a 23% reduction in unplanned downtime, 17% idle energy savings, and a 31% decrease in mean time to repair. These findings not only support the initial research hypothesis but also confirm and extend existing literature on the operational benefits of real-time data transparency and integrated process monitoring (Figure 13).
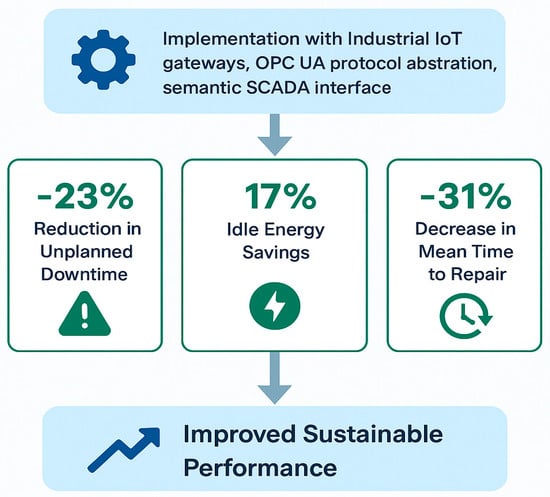
Figure 13.
Performance Impact of sustainable digitalization through IIoT—Enabled Shopfloor Integration.
Beyond its technical execution, the study also underscores the strategic role of visualization as a human-centered interface for contextualizing machine behavior and guiding decision-making at multiple levels—from operators on the shopfloor to managerial stakeholders. This contributes to a more inclusive approach to Industry 4.0, where advanced digital tools are designed to be accessible and actionable, not just functional.
In terms of scientific relevance, this research adds value by:
- Proposing a fully functional and validated integration model for mixed-generation industrial environments;
- Demonstrating the feasibility of deploying real-time visualization in retrofit scenarios;
- Providing empirical evidence of measurable benefits in efficiency, responsiveness, and sustainability;
- Contributing methodological guidelines for modular, scalable IIoT and SCADA deployments.
Moreover, the system aligns with global trends in sustainable manufacturing, emphasizing not only productivity enhancement but also energy optimization and digital responsibility. The system’s support for resource monitoring and behavioral feedback positions it as a tool for environmental accountability in production contexts.
However, certain limitations have been identified that warrant attention in future work—particularly the integration complexity of older machines, dependence on robust network infrastructure, and current constraints in predictive intelligence. As such, future research will focus on augmenting the platform with machine learning capabilities for anomaly prediction, expanding its semantic interoperability using digital twin standards such as AAS, and evaluating long-term behavioral impacts on operator practices and energy discipline.
In conclusion, the research contributes both theoretically and practically to the domain of industrial digitalization by offering a concrete, validated pathway toward real-time, intelligent, and sustainable factory operations, even in technologically heterogeneous environments. It opens new perspectives for adaptable, human-aware, and value-driven digital transformation strategies in the manufacturing sector.
Author Contributions
Conceptualization, A.-N.R., D.-I.D. and A.-E.D.; Data curation, A.-N.R.; Formal analysis, A.-N.R., D.-I.D. and A.-E.D.; Investigation, A.-N.R.; Methodology, A.-N.R.; Supervision, D.-I.D. and A.-E.D.; Validation, A.-N.R., D.-I.D. and A.-E.D.; Writing—original draft, A.-N.R., D.-I.D. and A.-E.D.; Writing—review and editing, A.-N.R., D.-I.D. and A.-E.D. All authors have read and agreed to the published version of the manuscript.
Funding
This research received no external funding.
Data Availability Statement
The original contributions presented in this study are included in the article. Further inquiries can be directed to the corresponding author.
Acknowledgments
The authors are grateful to the Transilvania University of Brasov for financial support.
Conflicts of Interest
The authors declare no conflicts of interest.
Abbreviations
The following abbreviations are used in this manuscript:
| IIoT | Industrial Internet of Things |
| OPC UA | Open Platform Communications Unified Architecture |
| CPS | Cyber-Physical Systems |
| DT | Digital Twins |
| SFV | Shopfloor Visualization Systems |
| HexaSFDT | Six-dimensional Digital Twin |
| SMEs | Small and Medium Enterprises |
| MQTT | Message Queuing Telemetry Transport |
| OEE | Overall Equipment Effectiveness |
| HMI | Human–Machine Interaction |
| AR | Augmented Reality |
| SV-ODA | Shopfloor Visualization-Oriented Digitalization Architecture |
| SCADA | Supervisory Control and Data Acquisition |
| CNC | Computer Numerical Control |
| RS-232 | Serial Communication Standard |
| Modbus RTU | Modbus Remote Terminal Unit |
| I/O | Input/Output |
| KPIs | Key Performance Indicators |
| PLC | Programmable Logic Controller |
| MES | Manufacturing Execution System |
| ERP | Enterprise Resource Planning |
| REST APIs | Representational State Transfer Application Programming Interfaces |
| UX | User Experience |
| TLS | Transport Layer Security |
| AAS | Asset Administration Shells |
References
- Oks, S.J.; Jalowski, M.; Lechner, M.; Mirschberger, S.; Merklein, M.; Vogel-Heuser, B.; Moeslein, K. Cyber-physical systems in the context of Industry 4.0: A Review, categorization and outlook. Inf. Syst. Front. 2022, 26, 1731–1772. [Google Scholar] [CrossRef]
- Corallo, A.; Del Vecchio, P.; Lezzi, M.; Morciano, P. Shop Floor Digital Twin in Smart Manufacturing: A Systematic Literature Review. Sustainability 2021, 13, 12987. [Google Scholar] [CrossRef]
- Monostori, L. Cyber-physical production systems: Roots, expectations and R&D challenges. Procedia CIRP 2014, 17, 9–13. [Google Scholar]
- Leng, J.; Wang, D.; Shen, W.; Li, X. Digital twins-based smart manufacturing system design in Industry 4.0: A review. J. Manuf. Syst. 2019, 60, 119–137. [Google Scholar] [CrossRef]
- Qin, J.; Liu, Y.; Grosvenor, R. A categorical framework of manufacturing for Industry 4.0 and beyond. Procedia CIRP 2016, 52, 173–178. [Google Scholar] [CrossRef]
- Lugaresi, G.; Matta, A. Real-time simulation in manufacturing systems: Challenges and research directions. In Proceedings of the Winter Simulation Conference, Gothenburg, Sweden, 2–9 December 2018; IEEE: Gothenburg, Sweden, 2018. [Google Scholar]
- Rehman, H.; Ahmed, M.; Yaqoob, E.; Hashem, I.; Ahmad, I.; Imran, S. Big data analytics in industrial IoT using a concentric computing Model. IEEE Commun. Mag. 2018, 56, 57024–57044. [Google Scholar] [CrossRef]
- Lee, J.; Bagheri, B.; Kao, H. A cyber-physical systems architecture for Industry 4.0–based manufacturing systems. Manuf. Lett. 2015, 3, 18–23. [Google Scholar] [CrossRef]
- Resman, M.; Herakovič, N.; Debevec, M. Integrating Digital Twin Technology to Achieve Higher Operational Efficiency and Sustainability in Manufacturing Systems. Systems 2025, 13, 180. [Google Scholar] [CrossRef]
- Wang, S.; Wan, J.; Zhang, D.; Li, D.; Zhang, C. Towards Smart Factory for Industry 4.0: A Self-organized Multi-agent System with Big Data Based Feedback and Coordination. Comput. Netw. 2016, 101, 158–168. [Google Scholar] [CrossRef]
- Chalapathi, G.S.S.; Chamola, V.; Vaish, A.; Buyya, R. Industrial Internet of Things (IIoT) applications of edge and fog computing: A review and future directions. In Fog/Edge Computing For Security, Privacy, and Applications. Advances in Information Security; Chang, W., Wu, J., Eds.; Springer: Cham, Switzerland, 2021; Volume 83, pp. 293–325. [Google Scholar] [CrossRef]
- Park, H.; Easwaran, A.; Andalam, S. Challenges in digital twin development for cyber-physical production systems. In Cyber Physical Systems. Model-Based Design; Chamberlain, R., Taha, W., Törngren, M., Eds.; Lecture Notes in Computer Science; Springer: Cham, Switzerland, 2019; Volume 11615, pp. 28–325. [Google Scholar] [CrossRef]
- Moeuf, A.; Pellerin, R.; Lamouri, S.; Tamayo-Giraldo, S.; Barbaray, R. The industrial management of SMEs in the era of Industry 4.0. Int. J. Prod. Res. 2018, 56, 1118–1136. [Google Scholar] [CrossRef]
- Zeid, A.; Sundaram, S.; Moghaddam, M.; Kamarthi, S.; Marion, T. Interoperability in smart manufacturing: Research challenges. Machines 2019, 7, 21. [Google Scholar] [CrossRef]
- Billey, A.; Wuest, T. Energy digital Twins in smart manufacturing Systems: A literature review. Manuf. Lett. 2023, 35, 1318–1325. [Google Scholar] [CrossRef]


Disclaimer/Publisher’s Note: The statements, opinions and data contained in all publications are solely those of the individual author(s) and contributor(s) and not of MDPI and/or the editor(s). MDPI and/or the editor(s) disclaim responsibility for any injury to people or property resulting from any ideas, methods, instructions or products referred to in the content. |
© 2025 by the authors. Licensee MDPI, Basel, Switzerland. This article is an open access article distributed under the terms and conditions of the Creative Commons Attribution (CC BY) license (https://creativecommons.org/licenses/by/4.0/).