
Sustainable Environmental Analysis of Wooden Boxes for Fruit and Vegetable Packaging and Transport in Comparison with Corrugated Cardboard Boxes

 , , and
Abstract
:1. Introduction
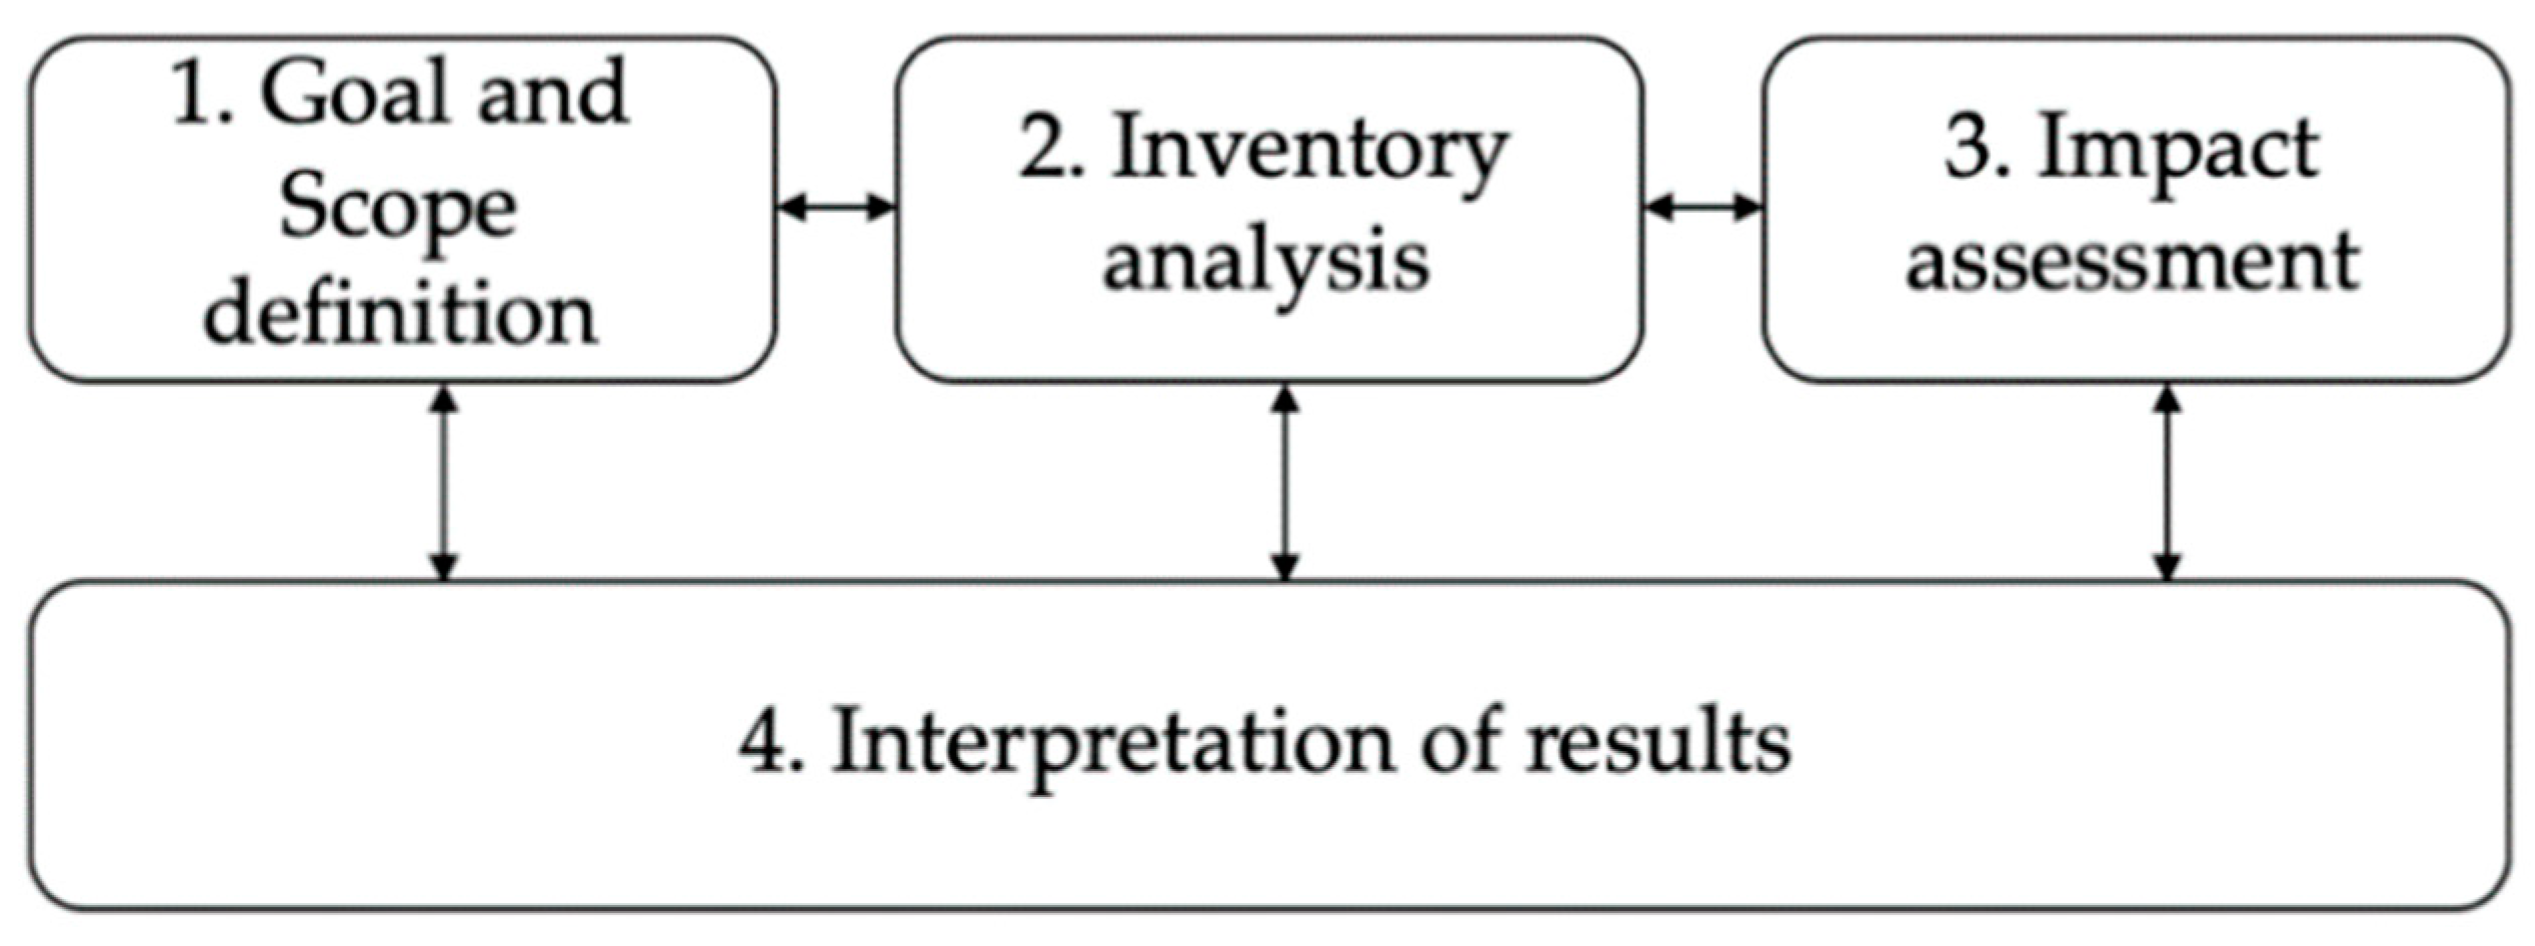
2. Materials and Methods
2.1. Goal and Scope
- (a)
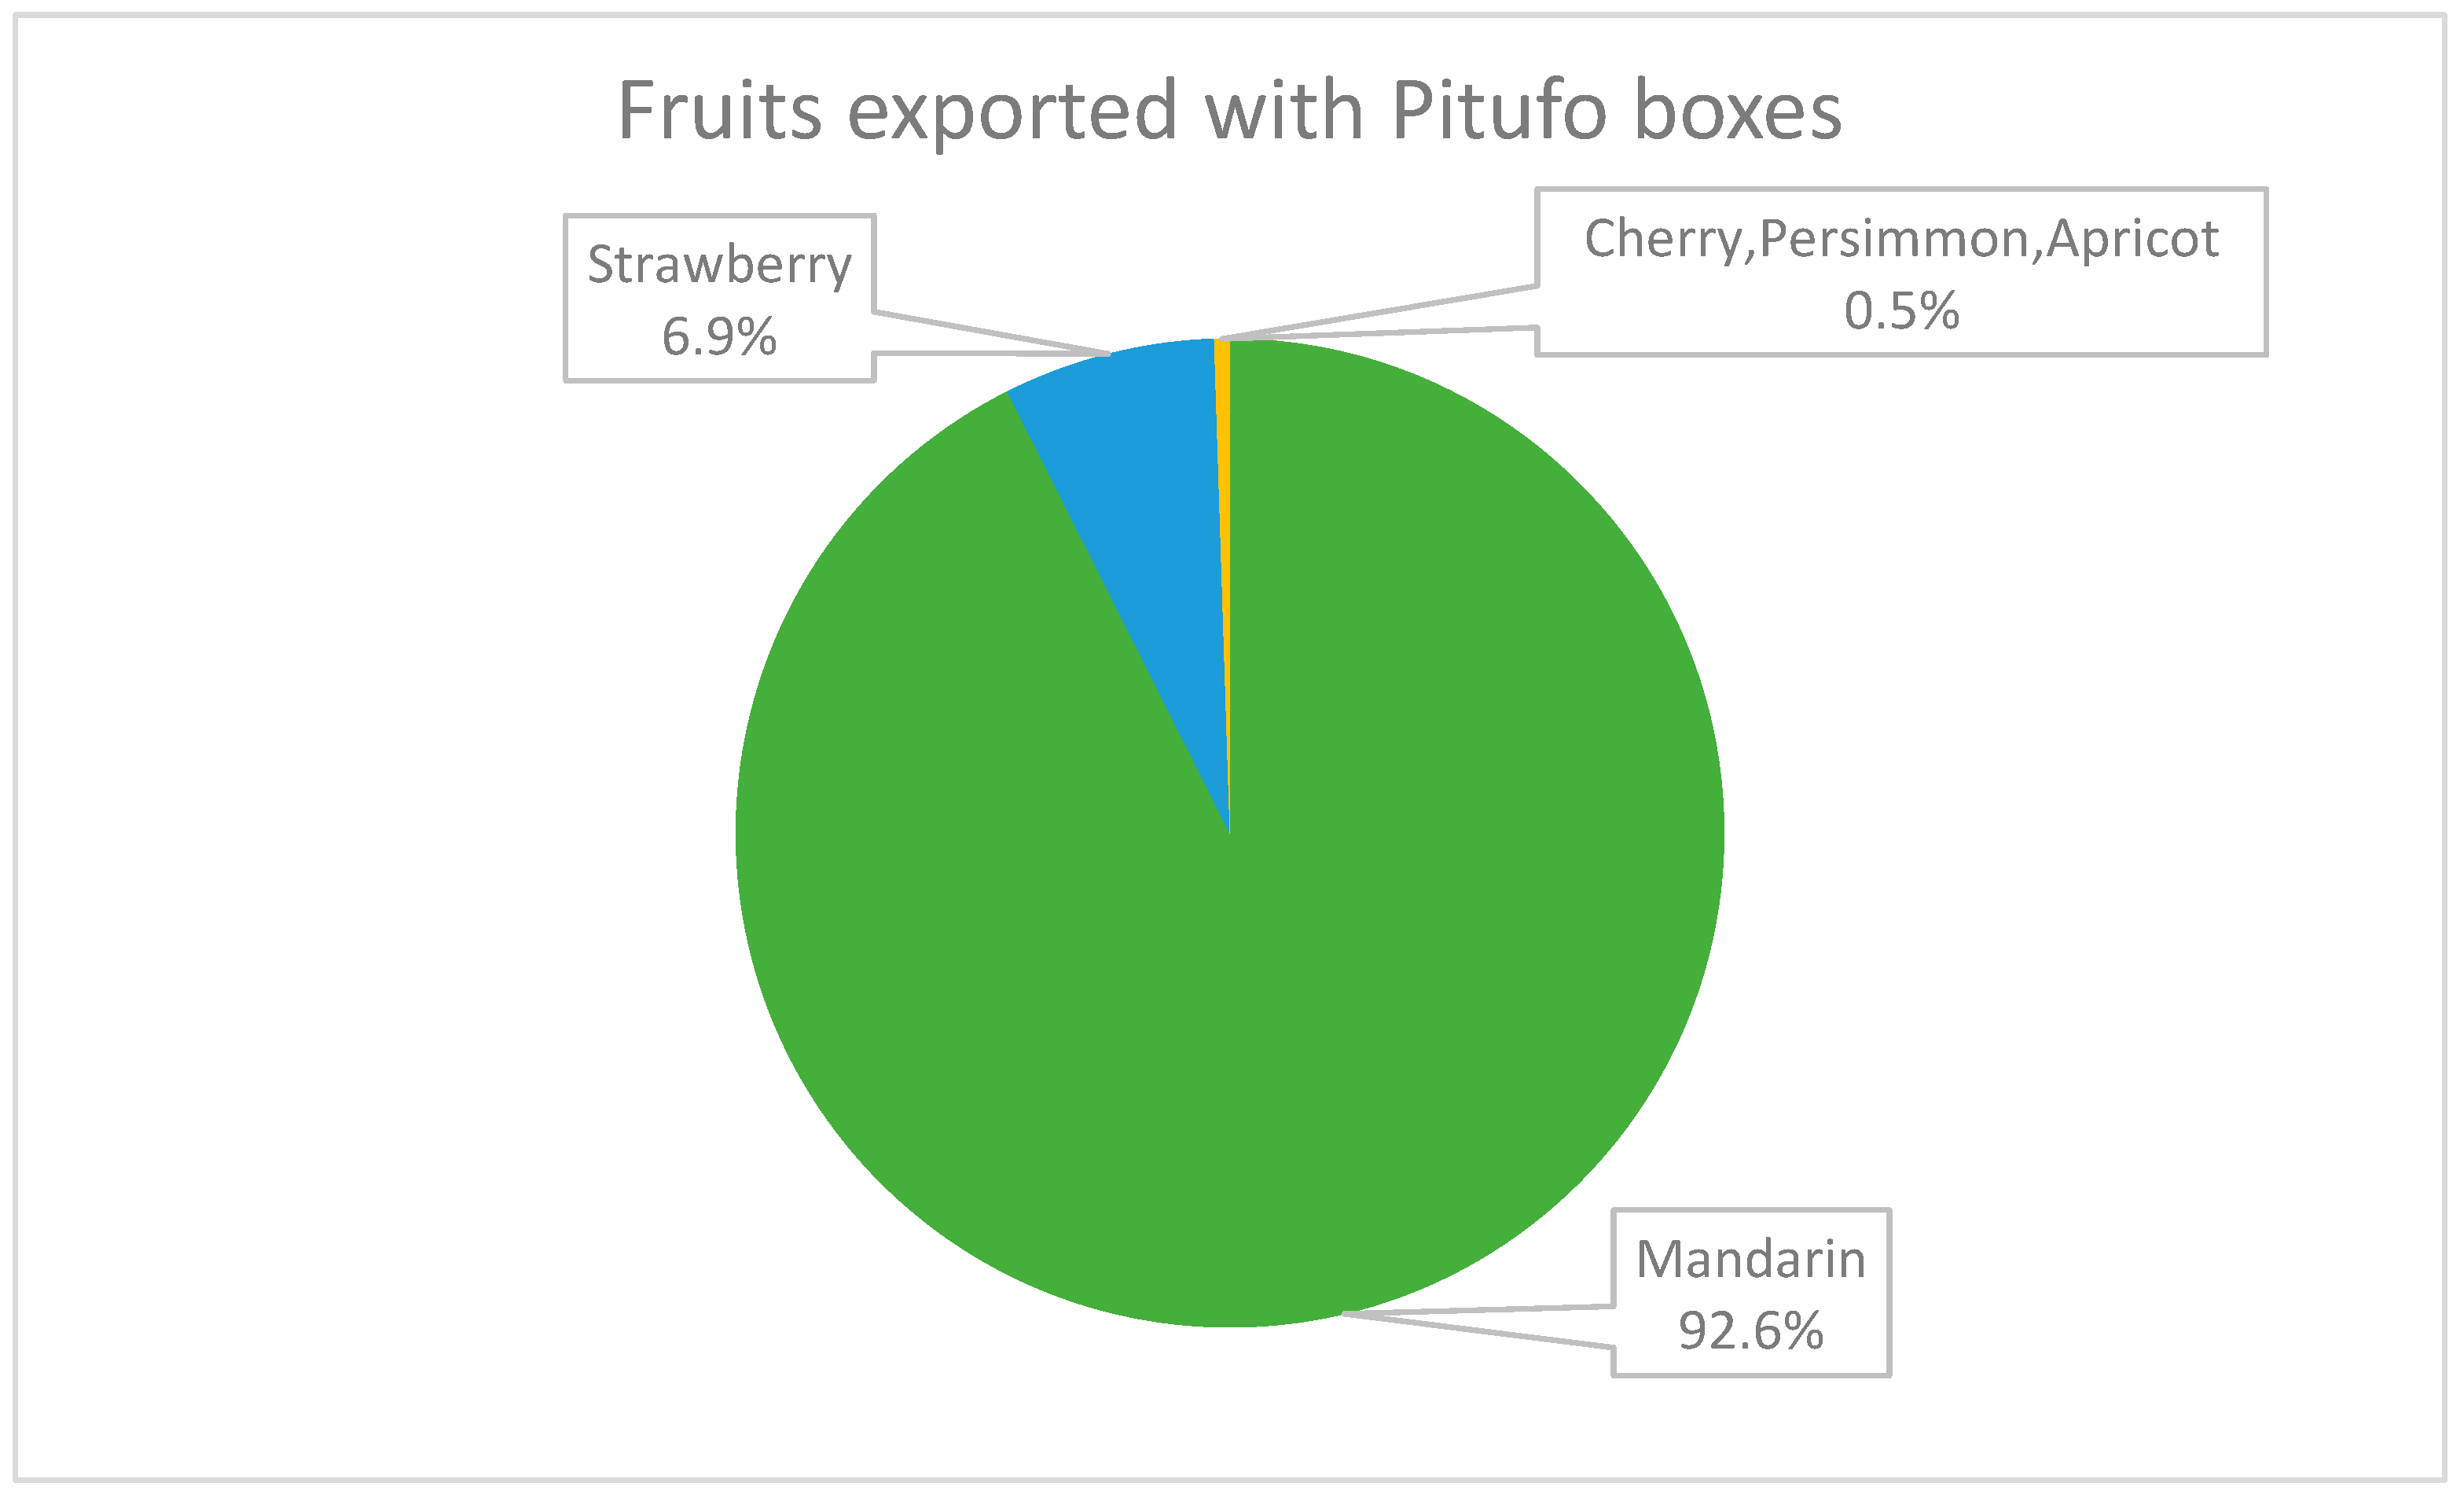
- Product selection
- (b)
- Functional Unit (FU)
- Trucks with Pitufo® WBs: 28,674 kg;
- Trucks with CCBs: 26,616 kg.
2.2. System Limits
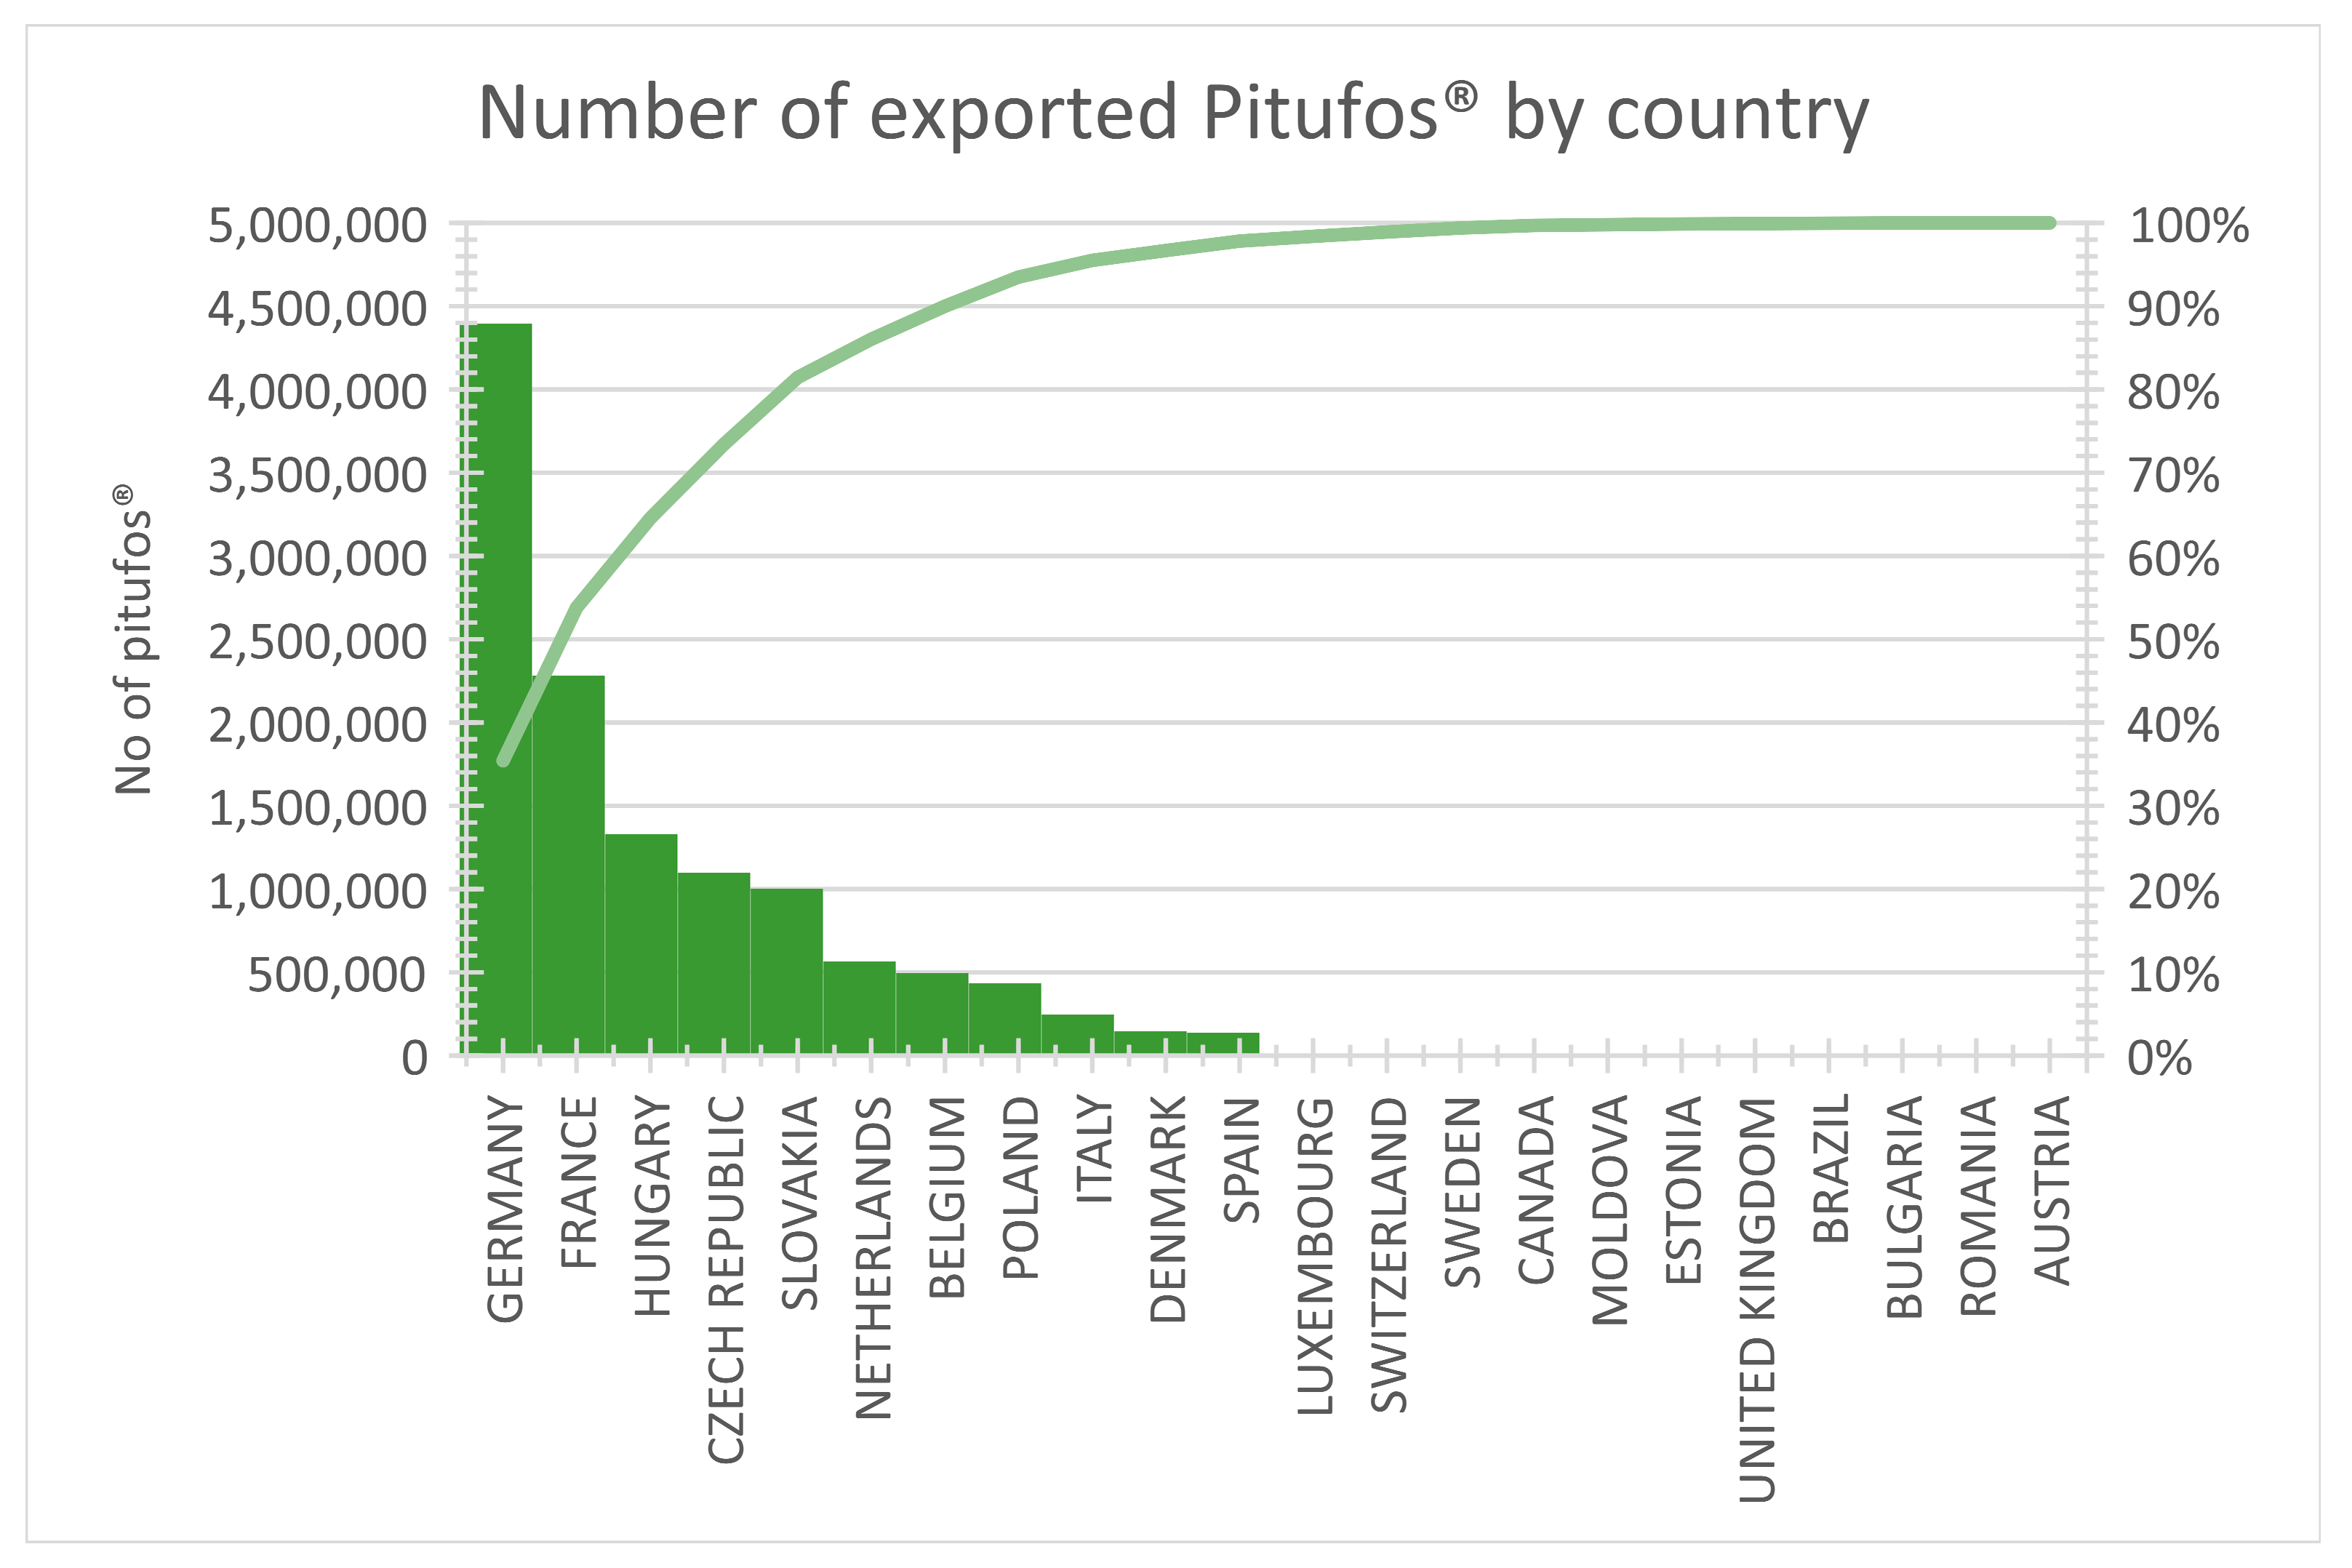
- Geographical limits: The fruit- and vegetable-packaging manufacturing system is limited to Spain. Pine, poplar and eucalyptus wood are almost entirely supplied domestically to the different elements of the WB. In the case of CCBs, the supply of raw material (cellulosic pulp), paper and corrugated board is also usually domestically produced. However, it can also be imported from other EU countries.
- Time limits: The base year of the study is 2022. In addition, it should be noted that some process data from 2015 to 2023 has been considered.
- (a)
- System boundaries for WBs
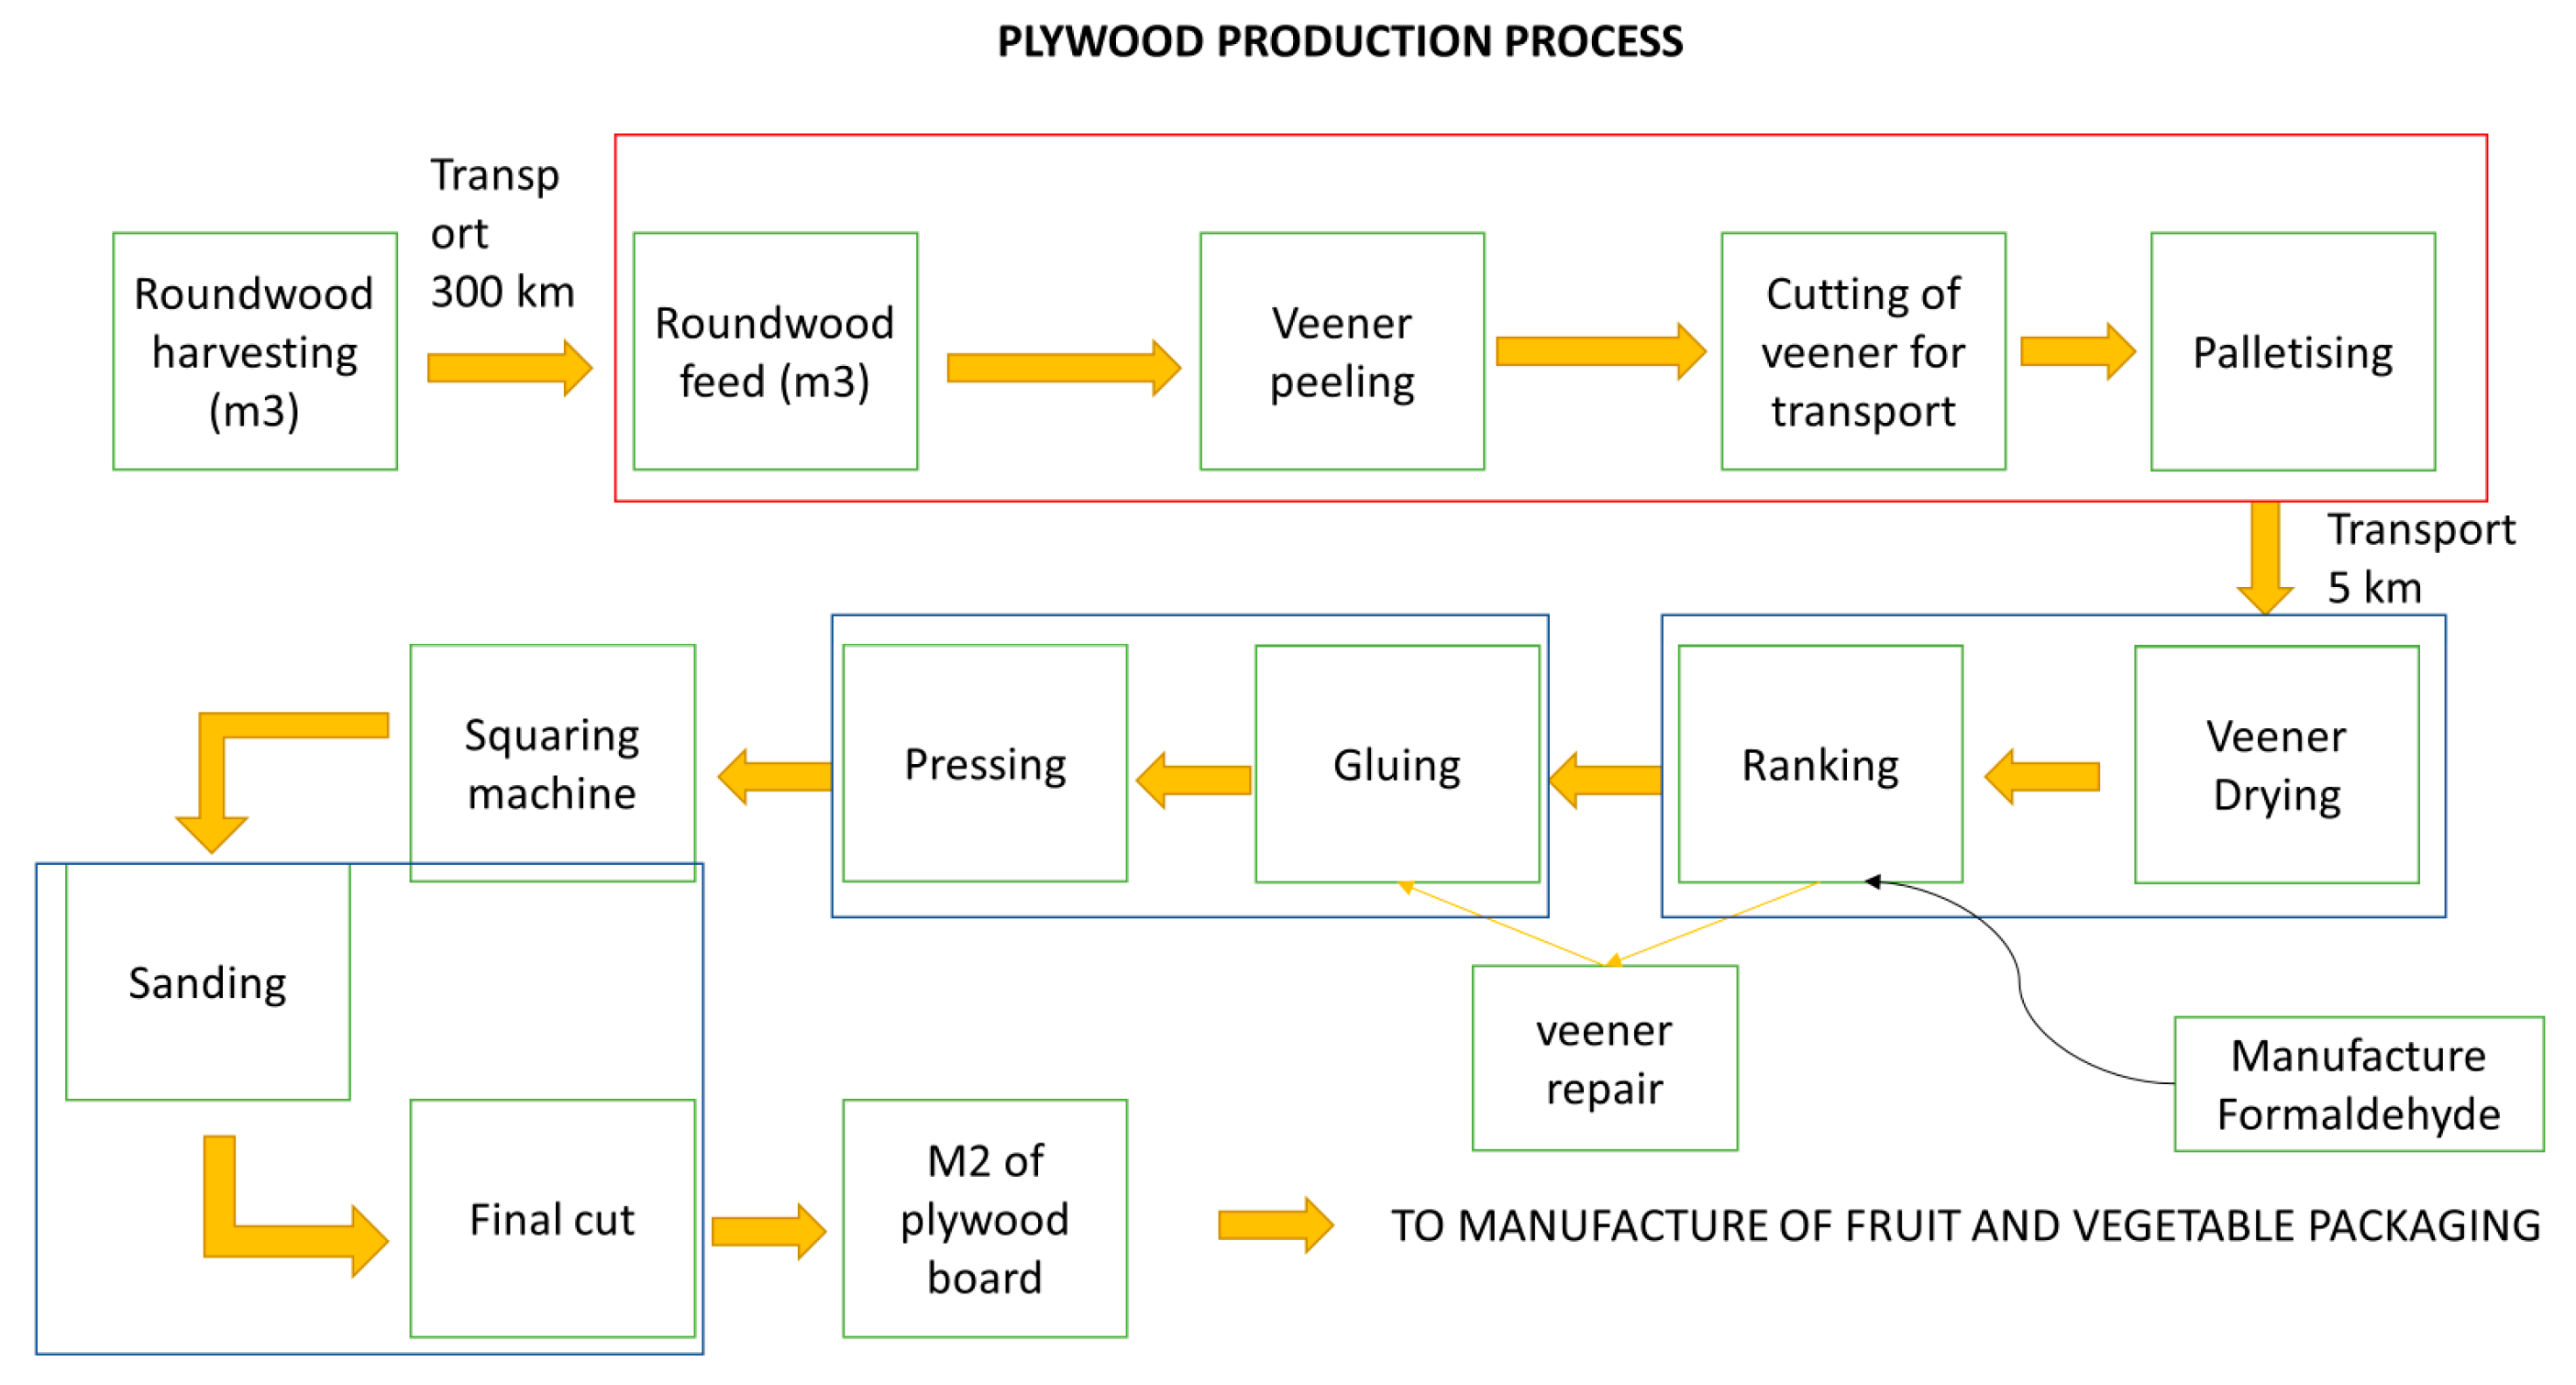
- Raw material extraction: includes processes related to the extraction of raw materials and their preparation, i.e., the extraction of the tree in the forest, energy consumption in forestry operations, and transport of raw material to the primary wood processing industries (sawmills, plywood and MDF factories).
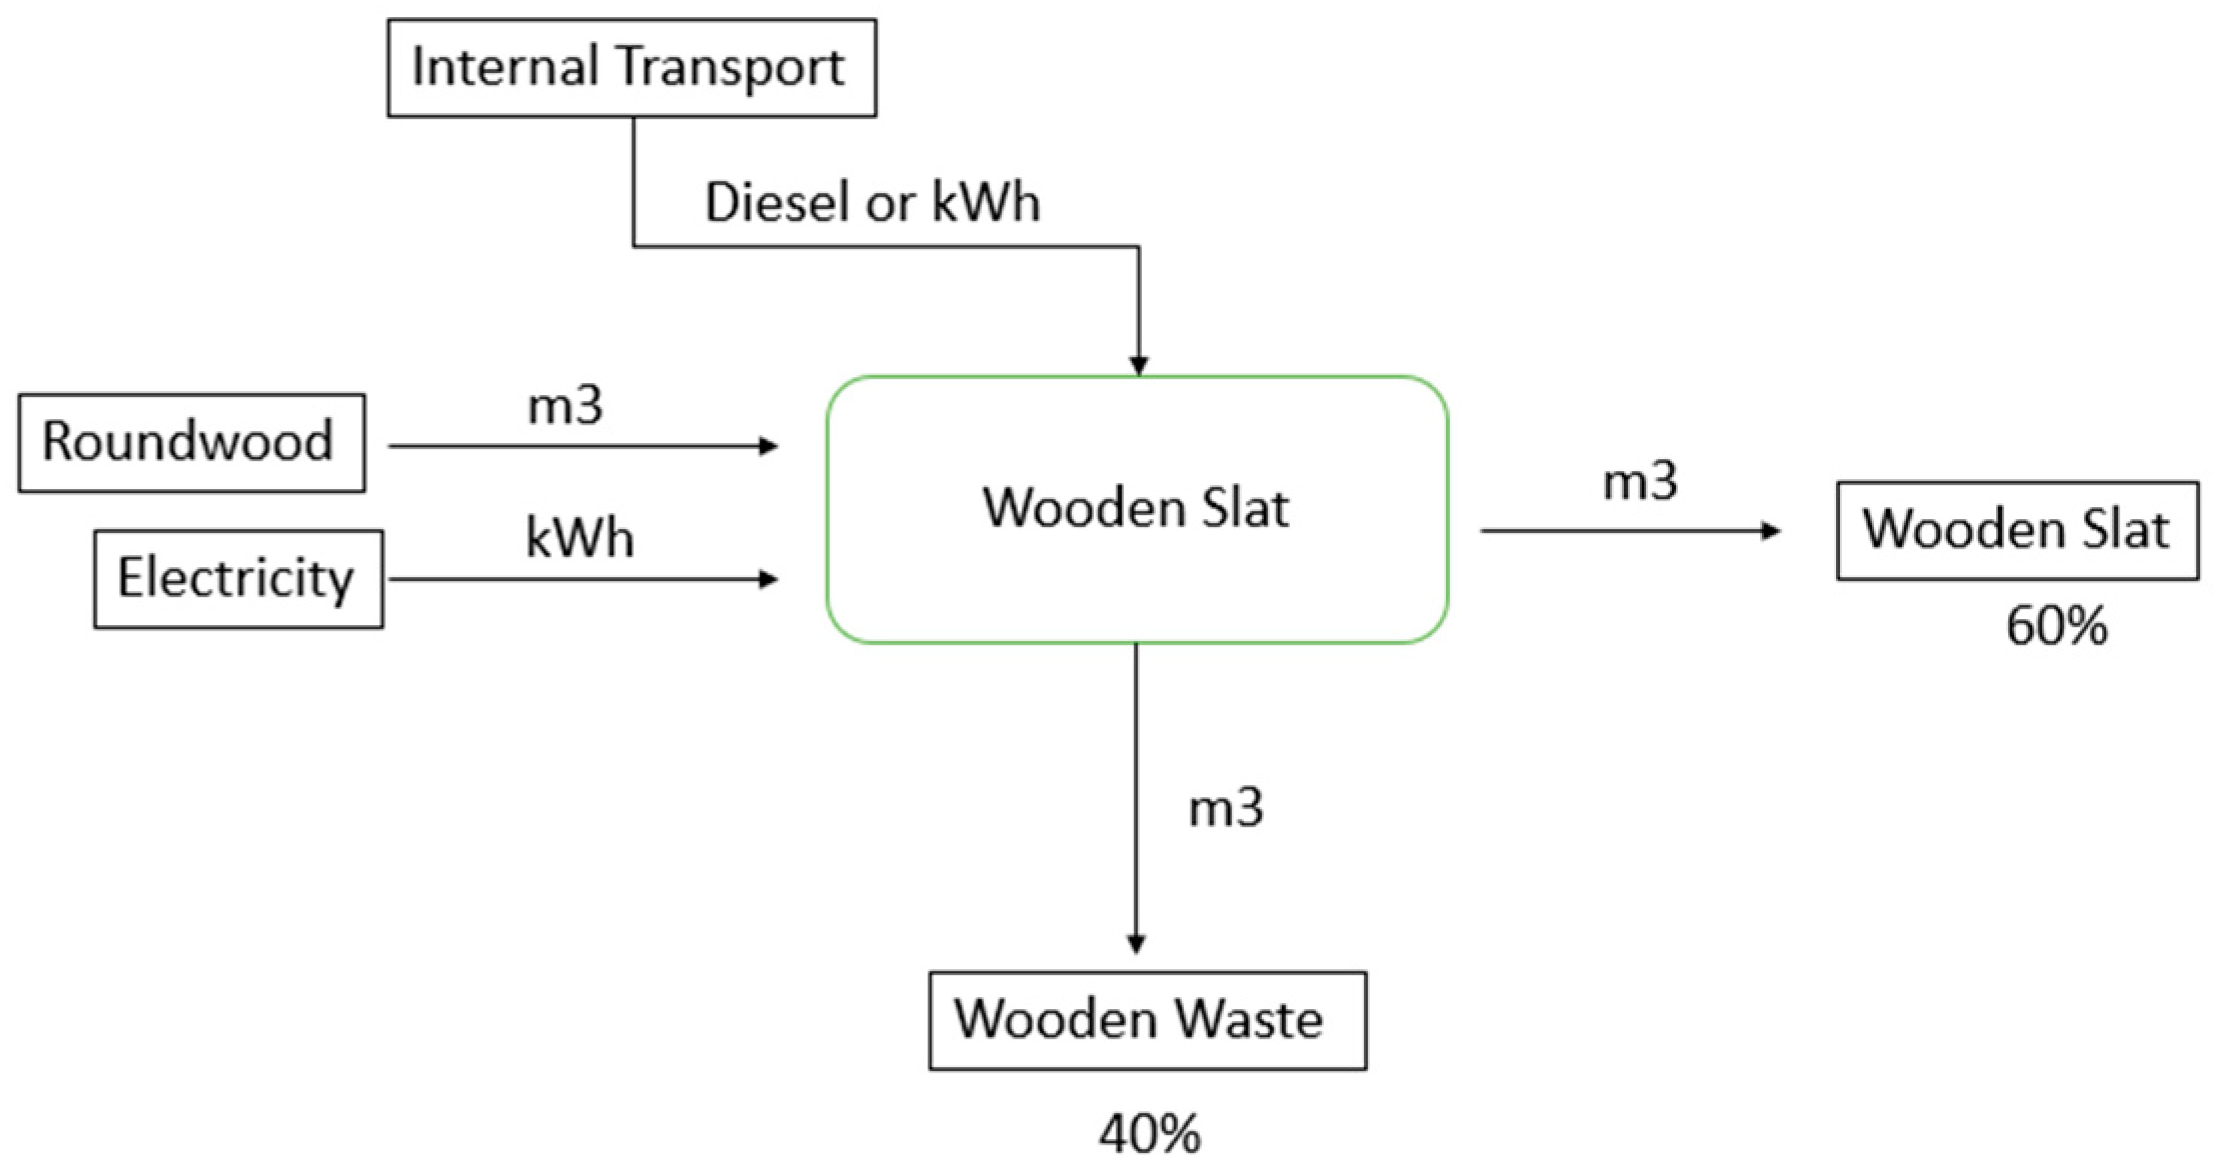
- Manufacture of WB base materials: this stage includes the processes in the sawmill (sawing of logs, sawing and drying of slats), plywood mill (production of rotary veneers, drying and ironing of veneers, forming, gluing, pressing and curing of three-layer boards) and MDF mills (chipping, shredding, drying, gluing, blanketing, felting, cold pre-pressing, hot pressing and curing of boards), as well as transport to the WB manufacturing plant.
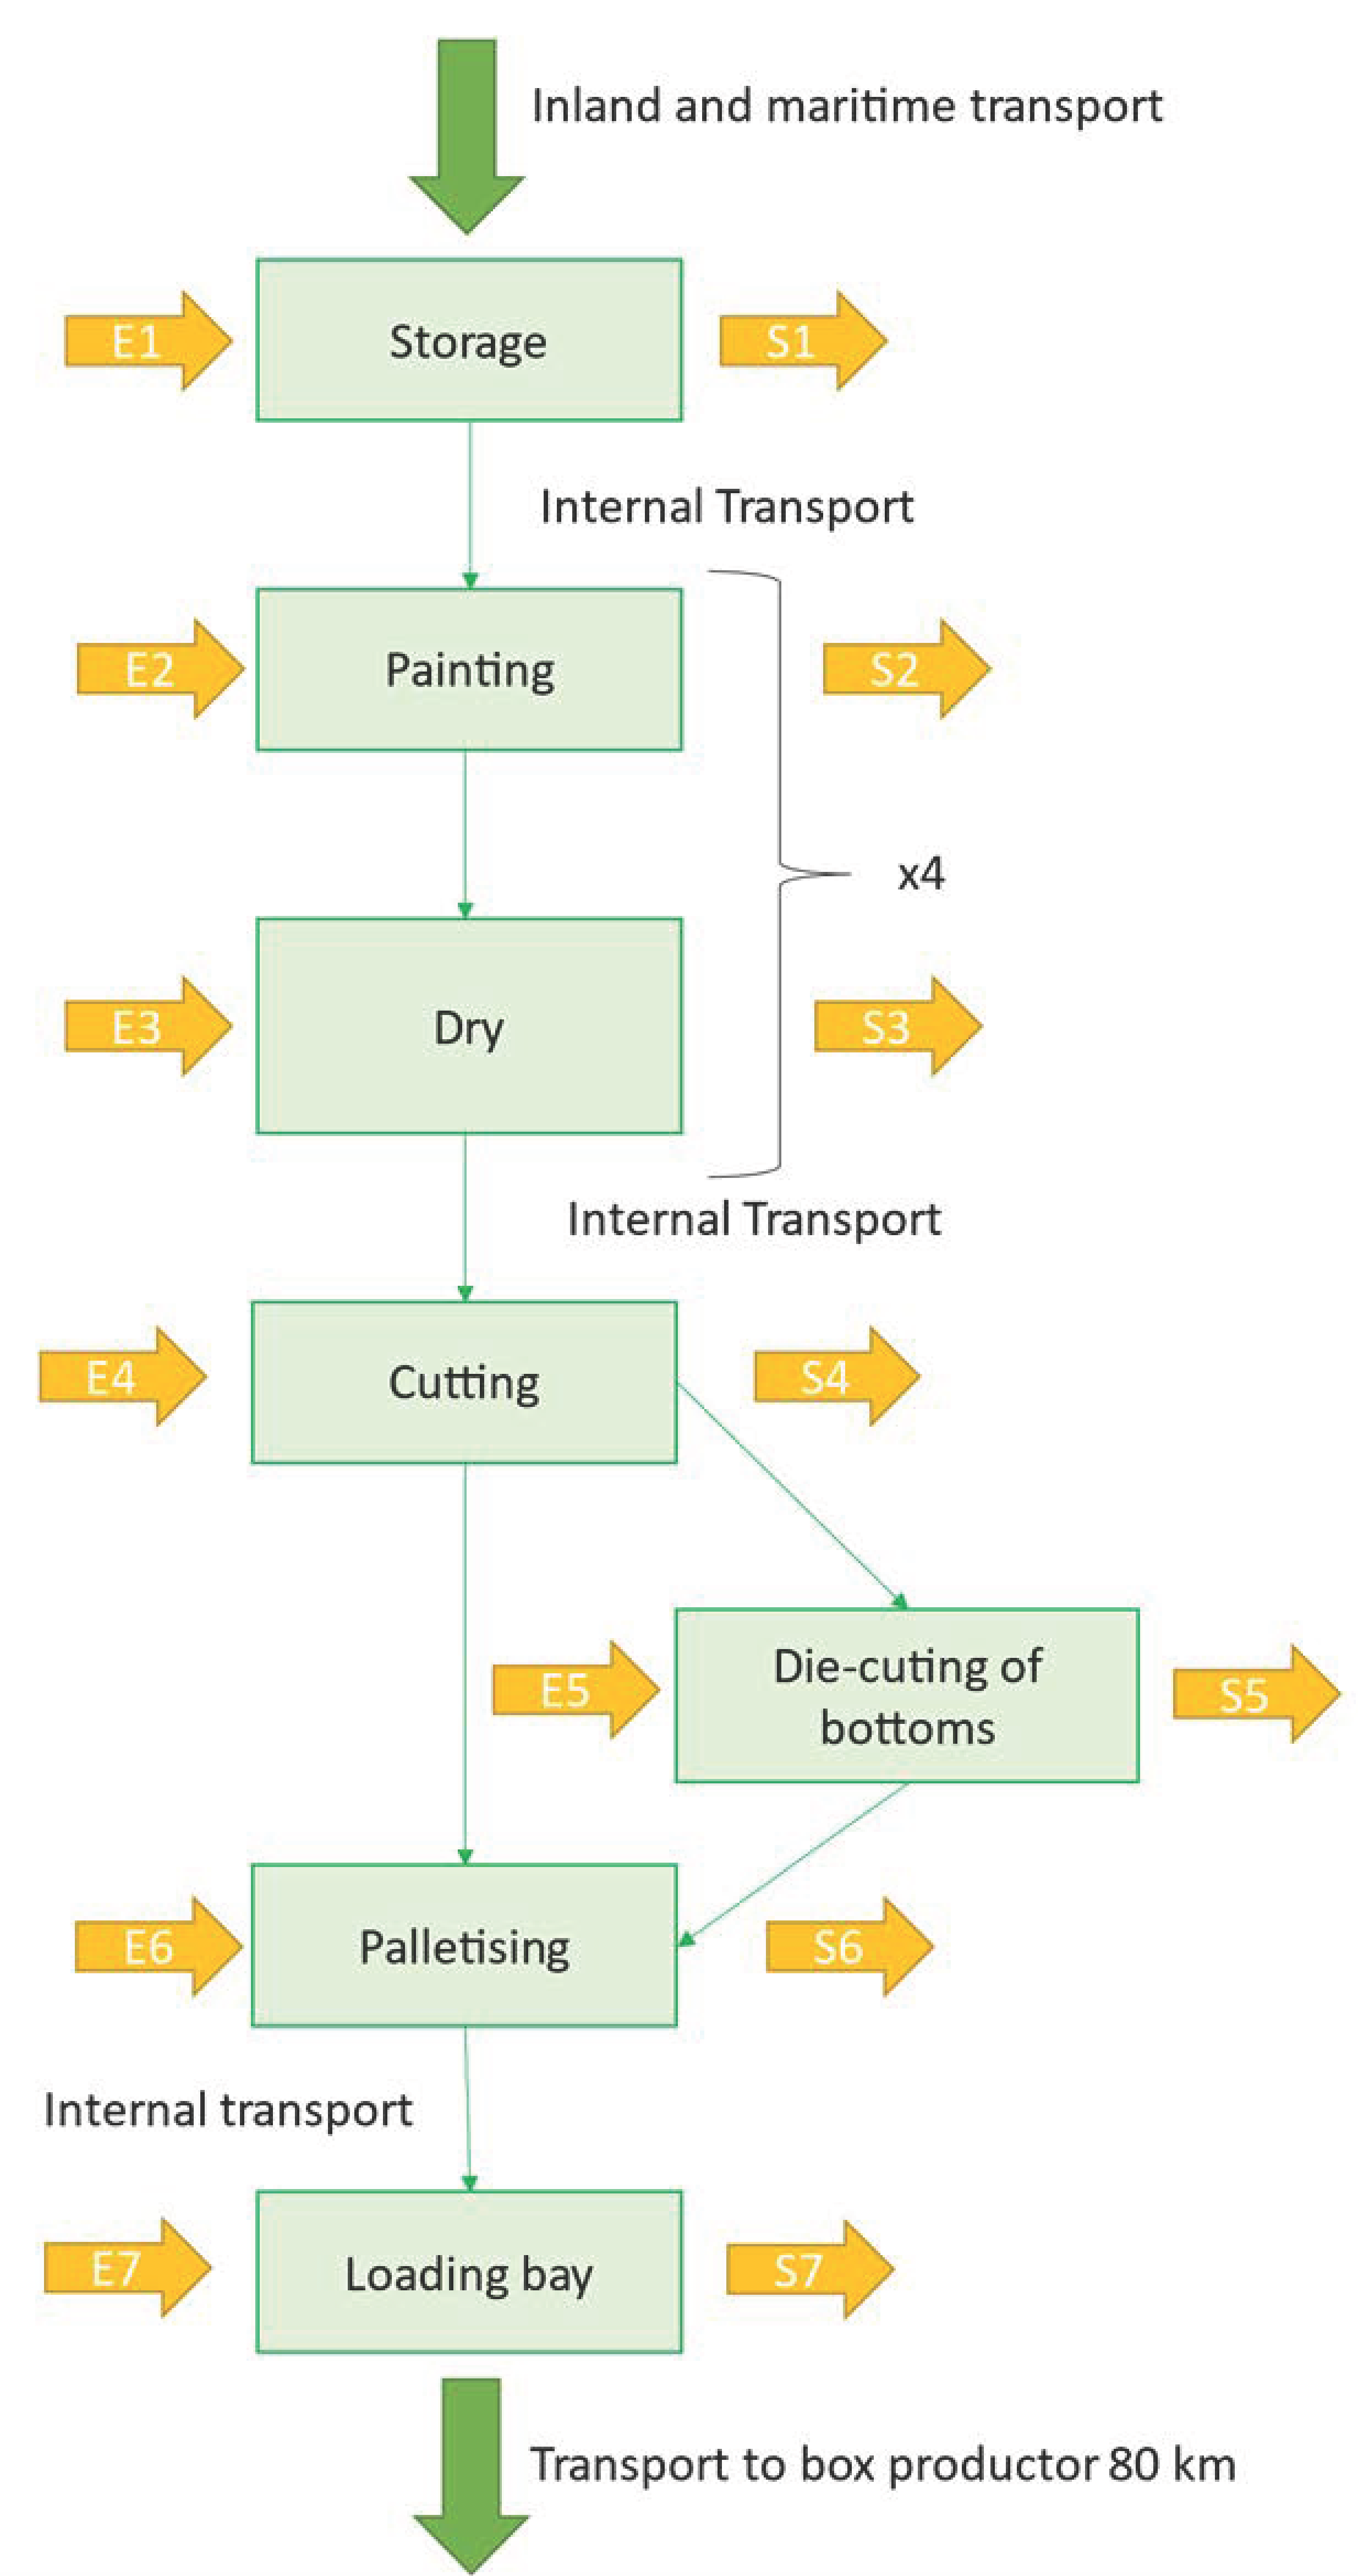
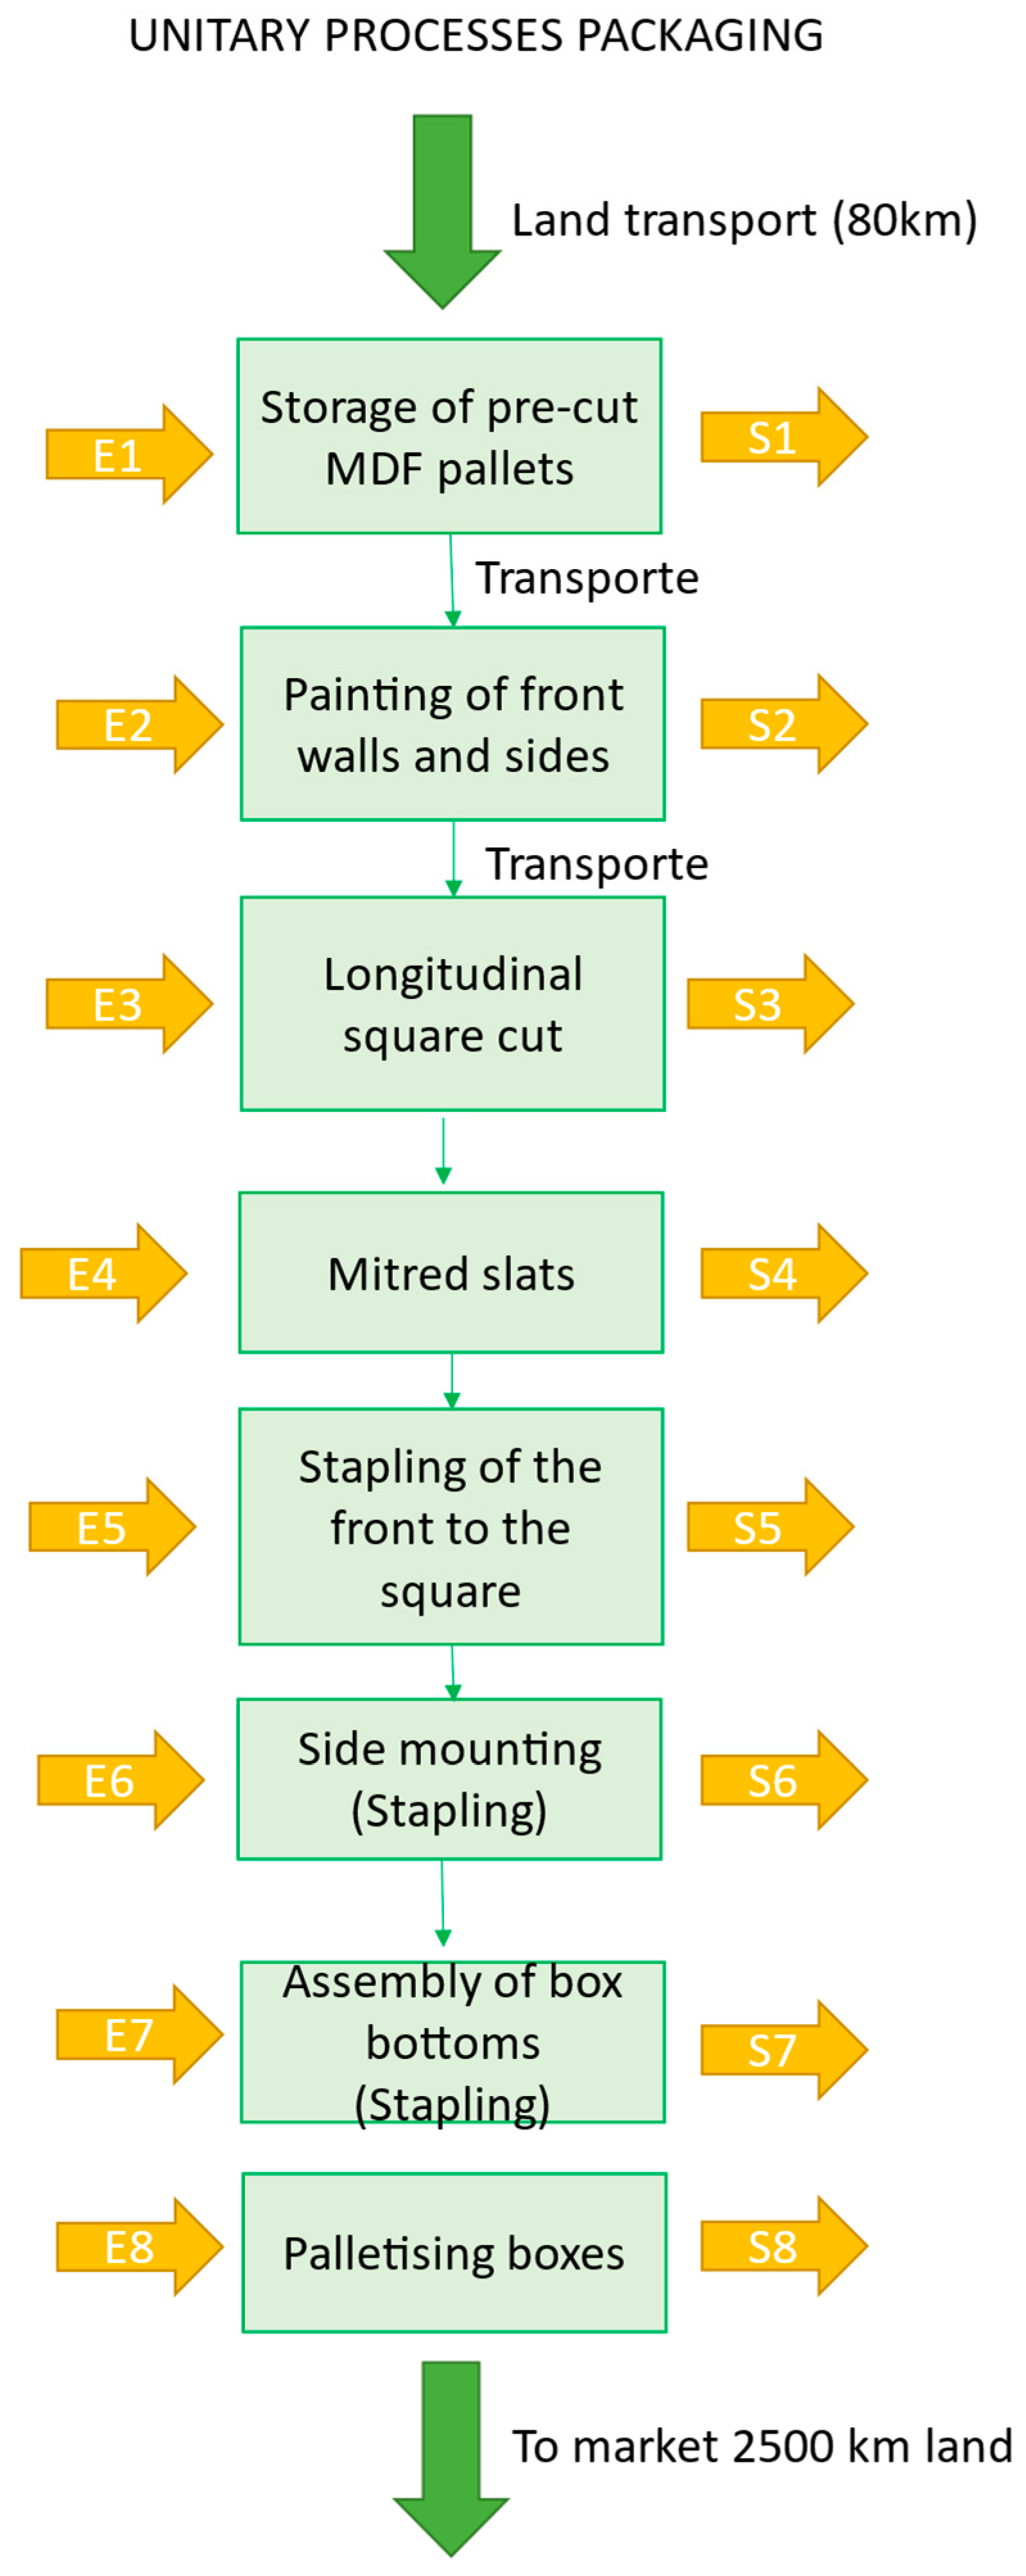
- Manufacturing of WBs: processes that transform panels and solid wood into ready-to-market Pitufo® WBs: mitring of strips, cutting and guillotining of strips and sides and ends of plywood panels, cutting of MDF bottoms (and sides and ends), assembly, stapling and marking.
- Distribution: Transport of pre-packed fruit and vegetable products to the destination market. Refrigerated trucks carry out this distribution with a maximum load capacity of 40 tonnes.
- End of Life: This is the entry into the waste management system, where the WB can be recovered as a whole material in recycling for the manufacture of particleboard or recovered as an energy source in combustion, cogeneration or gasification processes. The third option is biodegradation and composting in landfills.
- (b)
- System boundaries for CCBs
- Raw material extraction: includes processes related to the extraction of raw materials and their preparation, such as forest harvesting, energy consumption of harvesting and transport of the raw material to the pulp and paper mills.
- Manufacture of CCB materials: manufacturing processes of the different types of paper from forest-based raw materials or recycling (Kraft, semi-chemical, etc.) and paper and corrugated board manufacturing processes (boards with flutings and liners).
- CCB manufacture: cutting and manufacturing processes of the CCB, in our case, 30 × 20 cm.
- Logistics: transport over the distance to the export market in refrigerated trucks with a maximum load capacity of 40 t.
- End of Life: the entry into the waste management system and the type of end-of-life treatment applied to the CCB.
- (c)
- Exclusions
2.3. Methodology Employed for the Results Analysis and Impact Categories Analysed
- Global Warming Potential: the global warming potential of GHG emitted during the product life cycle, measured in CO2 eq.
- Acidification: contribution to the acidification of soil and water due to the emission of acidic substances, measured in SO2 eq.
- Eutrophication: release of nutrients into the environment, which can lead to excessive growth of algae and plants, negatively affecting aquatic ecosystems, measured in PO4 eq.
- Human toxicity: potential toxic effects on human health due to exposure to harmful chemicals, measured in “human toxicity units”.
- Abiotic resource depletion: use and depletion of non-renewable natural resources, such as minerals and fossil fuels, and water consumption, measured in “units of mass of an abiotic resource depleted”.
2.4. Inventory Analysis
2.4.1. Inventory Analysis of WBs
- Unitary process for the painting of fronts and sides;
- Unit assembly process of the WB.
2.4.2. Inventory Analysis of CCBs
- Outer layer: Testliner, 100% recycled fibre, weighing 195 g/m2.
- Corrugated outer: Fluting, 100% recycled fibre, weighing 170 g/m2.
- Middle layer: Fluting, 100% recycled fibre, weighing 170 g/m2.
- Inside: Fluting, 100% recycled fibre, weighing 190 g/m2.
- Inner layer: Testliner, 100% recycled fibre, weighing 250 g/m2.
3. Results and Discussion
3.1. Impact Assessment
3.1.1. Global Warming Potential
3.1.2. Terrestrial Acidification
3.1.3. Freshwater Eutrophication
3.1.4. Marine Eutrophication
3.1.5. Human Toxicity
- Group 1: carcinogenic to humans.
- Group 2A: probably carcinogenic to humans.
- Group 2B: possibly carcinogenic to humans.
- Group 3: cannot be classified as carcinogenic to humans.
3.1.6. Depletion of Abiotic Resources
3.1.7. Water Consumption
3.2. Discussion
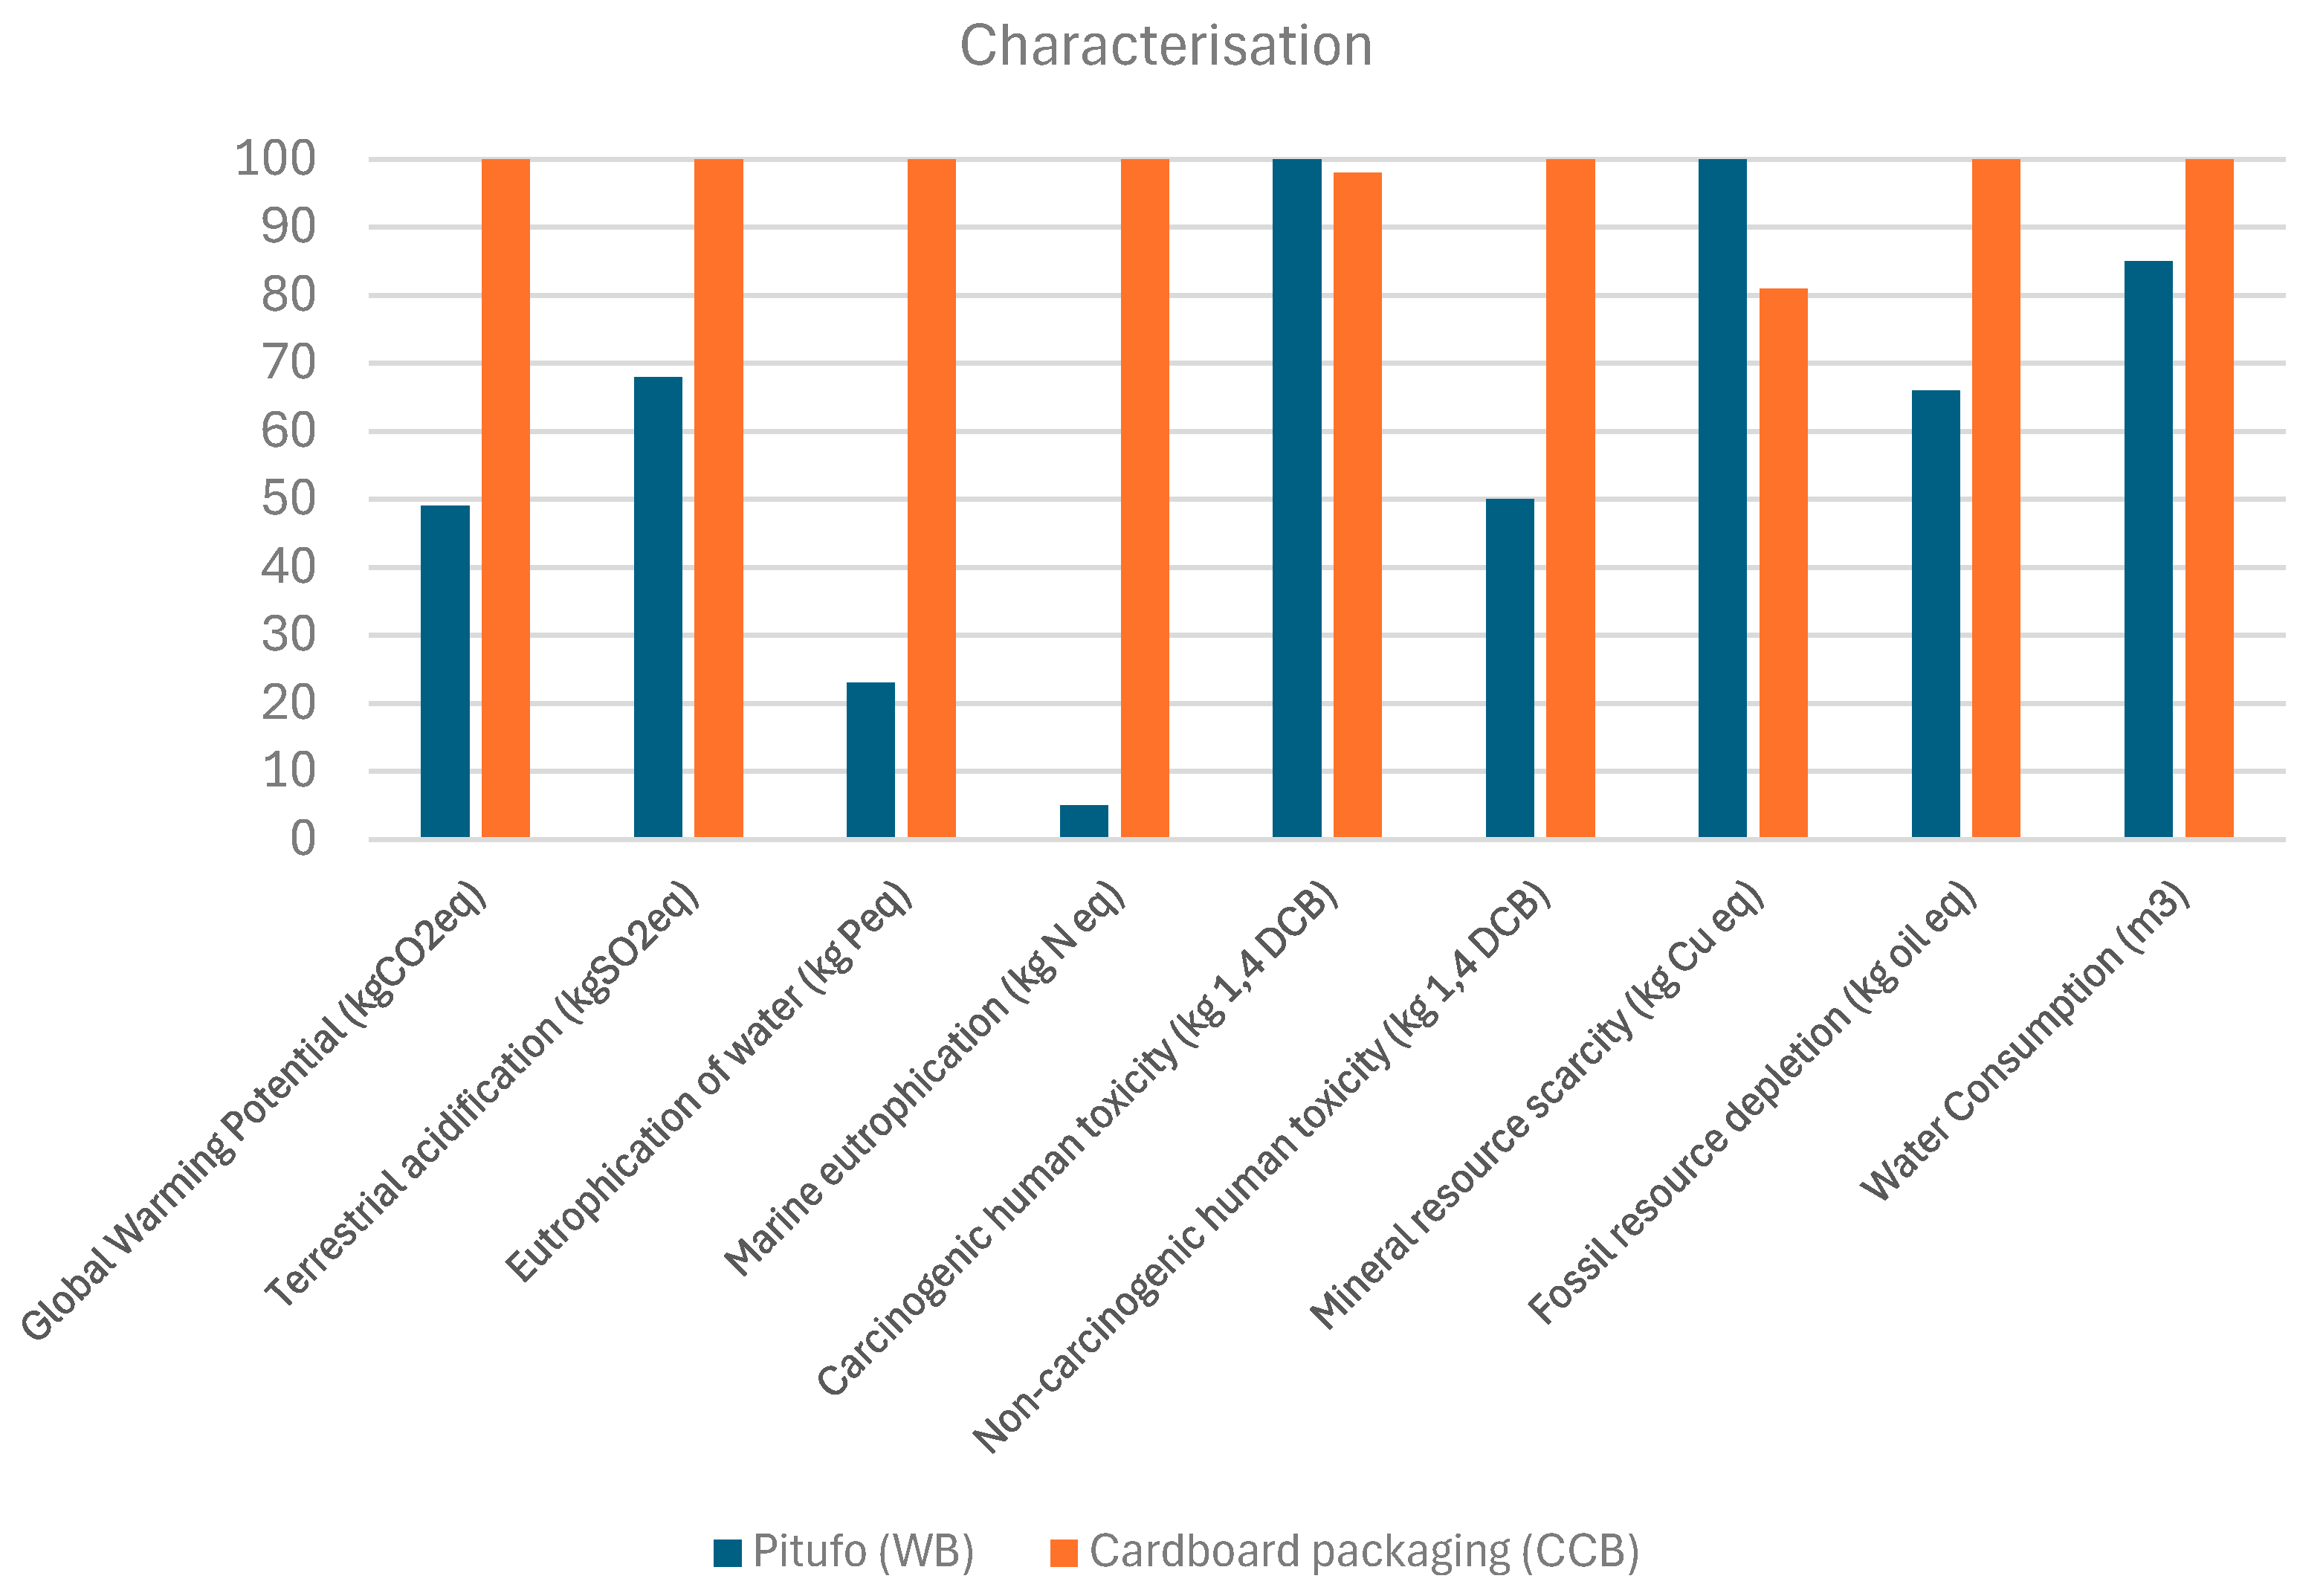
Characterisation
4. Conclusions
Author Contributions
Funding
Institutional Review Board Statement
Informed Consent Statement
Data Availability Statement
Acknowledgments
Conflicts of Interest
Appendix A. Results of Critical Review
References
- Spanish Federation of Associations of Producers and Exporters of Fruits Spanish Exports/Imports of Fruits and Vegetables. Available online: https://www.fepex.es/datos-del-sector/exportacion-importacion-espa%C3%B1ola-frutas-hortalizas (accessed on 3 October 2024).
- Maudos, J.; Salamanca, J. Observatory on the Spanish Agri-Food Sector in the European Context. Report 2023; Cajamar Caja Rural: Almería, Spain, 2024; ISBN 978-84-128038-8-4. [Google Scholar]
- Official Journal of European Union. Regulation (EC) No 1935/2004 of the European Parliament and of the Council of 27 October 2004 on Materials and Articles Intended to Come into Contact with Food and Repealing Directive 80/590/EEC and 89/109/EEC. Off. J. Eur. Union 2004, 338, 4–17. [Google Scholar]
- Guinée, J.B.; Heijungs, R.; Huppes, G.; Zamagni, A.; Masoni, P.; Buonamici, R.; Ekvall, T.; Rydberg, T. Life Cycle Assessment: Past, Present, and Future. Environ. Sci. Technol. 2011, 45, 90–96. [Google Scholar] [CrossRef] [PubMed]
- Albrecht, S.; Brandstetter, P.; Beck, T.; Fullana-I-Palmer, P.; Grönman, K.; Baitz, M.; Deimling, S.; Sandilands, J.; Fischer, M. An Extended Life Cycle Analysis of Packaging Systems for Fruit and Vegetable Transport in Europe. Int. J. Life Cycle Assess. 2013, 18, 1549–1567. [Google Scholar] [CrossRef]
- ECOBILAN. Analyse Du Cycle de Vie Des Caisses En Bois, Carton Ondulé et Plastique Pour Pommes; Agence de l’Environnement et de la Maîtrise de l’Energie (ADEME): Angers, France, 2000. [Google Scholar]
- Sauer, B.J.; Littlefield, J.; Franklin, W.E. Life Cycle Inventory of Reusable Plastic Containers and Display-Ready Corrugated Containers Used for Fresh Produce Applications, Final Report; Reusable Pallet and Container coalition, Inc.: Washington, DC, USA, 2004. [Google Scholar]
- Singh, S.; Chonhenchob, V.; Singh, J. Life Cycle Inventory and Analysis of Re-Usable Plastic Containers and Display-Ready Corrugated Containers Used for Packaging Fresh Fruits and Vegetables. Packag. Technol. Sci. 2006, 19, 279–293. [Google Scholar] [CrossRef]
- Albrecht, S.; Beck, T.; Barthel, L.; Fischer, M. The Sustainability of Packaging Systems for Fruit and Vegetable Transport in Europe Based on Life-Cycle-Analysis-Update 2009; Fraunhofer-Institut für Bauphysik IBP: Stuttgart, Germany, 2009. [Google Scholar]
- Pettersen, M.K.; Bardet, S.; Nilsen, J.; Fredriksen, S.B. Evaluation and suitability of biomaterials for modified atmosphere packaging of fresh salmon fillets. Packag. Technol. Sci. 2011, 24, 237–248. [Google Scholar] [CrossRef]
- Associates, F. Comparative Life Cycle Assessment of Reusable Plastic Containers and Display and Non-Display-Ready Corrugated Containers Used for Fresh Produce Applications; Franklin Associates: Baton Rouge, LA, USA, 2016. [Google Scholar]
- Bala, A.; Fullana, P. Comparative Assessment of Different Fruit and Vegetable Supply Options in Spain Through Life Cycle Assessment (LCA), 1st ed.; Cátedra UNESCO de Ciclo de Vida y Cambio Climático: Barcelona, Spain, 2018; Available online: https://areco.org.es/en/sustainability/ (accessed on 8 January 2025).
- Pauer, E.; Wohner, B.; Heinrich, V.; Tacker, M. Assessing the Environmental Sustainability of Food Packaging: An Extended Life Cycle Assessment Including Packaging-Related Food Losses and Waste and Circularity Assessment. Sustainability 2019, 11, 925. [Google Scholar] [CrossRef]
- Abejón, R.; Bala, A.; Vázquez-Rowe, I.; Aldaco, R.; Fullana-i-Palmer, P. When Plastic Packaging Should Be Preferred: Life Cycle Analysis of Packages for Fruit and Vegetable Distribution in the Spanish Peninsular Market. Resour. Conserv. Recycl. 2020, 155, 104666. [Google Scholar] [CrossRef]
- Lo-Iacono-Ferreira, V.G.; Viñoles-Cebolla, R.; Bastante-Ceca, M.J.; Capuz-Rizo, S.F. Transport of Spanish Fruit and Vegetables in Cardboard Boxes: A Carbon Footprint Analysis. J. Clean. Prod. 2020, 244, 118784. [Google Scholar] [CrossRef]
- Lo-Iacono-ferreira, V.G.; Viñoles-Cebolla, R.; Bastante-Ceca, M.J.; Capuz-Rizo, S.F. Carbon Footprint Comparative Analysis of Cardboard and Plastic Containers Used for the International Transport of Spanish Tomatoes. Sustainability 2021, 13, 2552. [Google Scholar] [CrossRef]
- Barthel, L.; Albrecht, S.; Deimling, S.; Baitz, M. The Sustainability of Packaging Systems for Fruit and Vegetable Transport in Europe Based on Life-Cycle-Analysis; On Behalf of Stiftung Initiative Mehrweg SIM (Foundation for Reusable Systems under German Civil Law): Berlin, Germany, 2007. [Google Scholar]
- Levi, M.; Cortesi, S.; Vezzoli, C.; Salvia, G. A Comparative Life Cycle Assessment of Disposable and Reusable Packaging for the Distribution of Italian Fruit and Vegetables. Packag. Technol. Sci. 2011, 24, 387–400. [Google Scholar] [CrossRef]
- Capuz, S.; Aucejo, S.; Hortal, M.; Vivancos, J.L.; Navarro, P.; Gómez, T.; Viñoles, R.; Bastante, M.J.; Collado, D.A. A Comparative Study of the Environmental and Economic Characteristics of Corrugated Board Boxes and Reusable Plastic Crates in the Long-Distance Transport of Fruit and Vegetables; ITENE: Valencia, Spain, 2005. [Google Scholar]
- ISO 14044; Gestión Ambiental. Análisis del Ciclo de Vida. Requisitos y Directrices. International Organization for Standardization: Geneva, Switzerland, 2006.
- ISO 14040:2006; Gestión Ambiental. Análisis del Ciclo de Vida. Principios y Marco de Referencia. International Organization for Standardization: Geneva, Switzerland, 2006.
- ISO 49051; Wood Packaging for Fruits and Vegetables. Base of 300 × 200 mm. International Organization for Standardization: Geneva, Switzerland, 2002.
- Huijbregts, M.; van Zelm, R.; Steinmann, Z.; Hollander, A.; Verones, F.; Elshout, P.M.; Stam, G.; Zijp, M.; Vieira, M. ReCiPe 2016 v1.1 A Harmonized Life Cycle Impact Assessment Method at Midpoint and Endpoint Level Report I: Characterization; RIVM Report 2016-0104; National Institute for Public Health and the Environment: Bilthoven, The Netherlands, 2017. Available online: https://www.rivm.nl/bibliotheek/rapporten/2016-0104.html (accessed on 7 January 2025).
- Bajpai, P. Recycling and Deinking of Recovered Paper; Elsevier: Amsterdam, The Netherlands, 2024; ISBN 9780443238048. [Google Scholar]
- CEPI, the Coalition for Epidemic Preparedness Innovations. Annual Statistics 2020; CEPI: London, UK, 2021. [Google Scholar]
- FEFCO European Database for Corrugated Board Life Cycle Studies. Available online: https://www.fefco.org/lca/dscription-of-production-system/corrugated-board-production (accessed on 1 March 2024).
- Twede, D.; Selke, S.E.M.; Kamdem, D.-P.; Shires, D. Cartons, Crates and Corrugated Board: Handbook of Paper and Wood Packaging Technology, 2nd ed.; DEStech Publications, Inc.: Lancaster, PA, USA, 2015; Available online: https://www.destechpub.com/wp-content/uploads/2015/01/Cartons-Crates-and-Corrugated-Board-2nd-Ed-preview.pdf?srsltid=AfmBOoqomudichWyzuX9H3zs0pzxoSbaOWyZNQBPhzyBw8oxpLxZ1Fvi (accessed on 8 January 2025).
- RD 888/1988 General Standard for Containers Holding Fresh, Perishable Foodstuffs That Are Not Wrapped or Wrapped. BOE, No. 187 of 5 August 1988. Available online: https://www.boe.es/eli/es/rd/1988/07/29/888 (accessed on 7 January 2025).
- EUROSTAT, European Statistics Office. Packaging Waste by Waste Operations and Waste Flow. Available online: https://appsso.eurostat.ec.europa.eu/nui/show.do?dataset=env_waspac&lang=en (accessed on 7 January 2025).
- Roy, P.-O.; Deschênes, L.; Margni, M. Life Cycle Impact Assessment of Terrestrial Acidification: Modeling Spatially Explicit Soil Sensitivity at the Global Scale. Environ. Sci. Technol. 2012, 46, 8270–8278. [Google Scholar] [CrossRef]
- Roy, P.-O.; Huijbregts, M.; Deschênes, L.; Margni, M. Spatially-Differentiated Atmospheric Source-Receptor Relationships for Nitrogen Oxides, Sulfur Oxides and Ammonia Emissions at the Global Scale for Life Cycle Impact Assessment. Atmos. Environ. 2012, 62, 74–81. [Google Scholar] [CrossRef]
- Azevedo, L.B.; Van Zelm, R.; Hendriks, A.J.; Bobbink, R.; Huijbregts, M.A.J. Global Assessment of the Effects of Terrestrial Acidification on Plant Species Richness. Environ. Pollut. 2013, 174, 10–15. [Google Scholar] [CrossRef] [PubMed]
- Roy, P.-O.; Azevedo, L.; Margni, M.; Zelm, R.; Deschênes, L.; Huijbregts, M. Characterization Factors for Terrestrial Acidification at the Global Scale: A Systematic Analysis of Spatial Variability and Uncertainty. Sci. Total Environ. 2014, 500–501, 270–276. [Google Scholar] [CrossRef]
- Bobbink, R.; Hornung, M.; Roelofs, J. The Effects of Air-Borne Nitrogen Pollutants on Species Diversity in Natural and Semi-Natural European Vegetation. J. Ecol. 2003, 86, 717–738. [Google Scholar] [CrossRef]
- Sutton, M.A.; Howard, C.M.; Erisman, J.W. The European Nitrogen Assessment: Sources, Effects, and Policy Perspectives; Cambridge University Press: Cambridge, UK, 2011. [Google Scholar]
- Smith, V.H.; Tilman, G.D.; Nekola, J.C. Eutrophication: Impacts of Excess Nutrient Inputs on Freshwater, Marine, and Terrestrial Ecosystems. Environ. Pollut. 1999, 100, 179–196. [Google Scholar] [CrossRef] [PubMed]
- Schindler, D.W. Recent Advances in the Understanding and Management of Eutrophication. Limnol. Oceanogr. 2006, 51, 356–363. [Google Scholar] [CrossRef]
- Carpenter, S.R.; Caraco, N.F.; Correll, D.L.; Howarth, R.W.; Sharpley, A.N.; Smith, V.H. Nonpoint Pollution of Surface Waters with Phosphorus and Nitrogen. Ecol. Appl. 1998, 8, 559–568. [Google Scholar] [CrossRef]
- Paerl, H.W. Coastal Eutrophication and Harmful Algal Blooms: Importance of Atmospheric Deposition and Groundwater as “New” Nitrogen and Other Nutrient Sources. Limnol. Oceanogr. 2003, 42, 1154–1165. [Google Scholar] [CrossRef]
- Cosme, N.; Koski, M.; Hauschild, M.Z. Exposure Factors for Marine Eutrophication Impacts Assessment Based on a Mechanistic Biological Model. Ecol. Modell. 2015, 317, 50–63. [Google Scholar] [CrossRef]
- Diaz, R.J.; Rosenberg, R. Spreading Dead Zones and Consequences for Marine Ecosystems. Science 2008, 321, 926–929. [Google Scholar] [CrossRef] [PubMed]
- Breitburg, D.; Levin, L.A.; Oschlies, A.; Grégoire, M.; Chavez, F.P.; Conley, D.J.; Zhang, J. Declining Oxygen in the Global Ocean and Coastal Waters. Science 2018, 359, eaam7240. [Google Scholar] [CrossRef] [PubMed]
- Tomatis, L.; Agthe, C.; Bartsch, H.; Huff, J.; Montesano, R.; Saracci, R.; Walker, E.; Wilbourn, J. Evaluation of the Carcinogenicity of Chemicals: A Review of the Monograph Program of the International Agency for Research on Cancer (1971 to 1977)1. Cancer Res. 1978, 38, 877–885. [Google Scholar]
- International Agency for Research on Cancer (IARC). Monographs on the Evaluation of Carcinogenic Risks to Humans, Volume 97; World Health Organization: Geneva, Switzerland, 2008.
- NTP (National Toxicology Program). Report on Carcinogens, 15th ed.; U.S. Department of Health and Human Services, Public Health Service: Research Triangle Park, NC, USA, 2021. [CrossRef]
- Nordberg, G.F.; Fowler, B.A.; Nordberg, M. Handbook on the Toxicology of Metals; Academic Press: Cambridge, MA, USA, 2014. [Google Scholar]
- van Oers, L.; Guinée, J.B. The Abiotic Resource Depletion Potential: Background, Updates, and Future. Resources 2016, 5, 16. [Google Scholar] [CrossRef]
- Del Borghi, A.; Parodi, S.; Moreschi, L.; Gallo, M. Sustainable Packaging: An Evaluation of Crates for Food through a Life Cycle Approach. Int. J. Life Cycle Assess. 2021, 26, 753–766. [Google Scholar] [CrossRef]
- Accorsi, R.; Cascini, A.; Cholette, S.; Manzini, R.; Mora, C. Economic and Environmental Assessment of Reusable Plastic Containers: A Food Catering Supply Chain Case Study. Int. J. Prod. Econ. 2014, 152, 88–101. [Google Scholar] [CrossRef]


| Theoretical Load (kg) | Actual Load (kg) | Number of Boxes | |
|---|---|---|---|
| Pitufo® WB | 2 | 2.3 | 434,783 |
| CCB | 2 | 2.3 | 434,783 |
| Dimensions (mm) | Box Weight (g) | Number of Boxes per Pallet | Pallets/Truck 24 t | Num of Boxes per Truck | Total Weight of Boxes | |
|---|---|---|---|---|---|---|
| Pitufo® WB | 280 × 190 × 110 | 280 | 420 | 26 | 10,920 | 3057 kg |
| CCB | 300 × 200 × 100 | 100 | 420 | 26 | 10,920 | 1092 kg |
| Average Distance (km) | Load (t) | Involvement by Pitufo® (tkm) | Involvement Functional Unit (tkm) | |
|---|---|---|---|---|
| Slats transport | 138 | 24 | 0.017388 | 7560 |
| Plywood transport | 80 | 24 | 0.00621 | 2700 |
| MDF treated transport | 80 | 24 | 0.008004 | 3480 |
| Roundwood transport | 300 | 24 | 0.052923 | 23,010 |
| Transport Galvanised steel clamps | 14 | 24 | 9.2 × 10⁻⁵ | 40 |
| Paint transport | 68 | 24 | Not considered | Not considered |
| MDF transport | 600 | 24 | 0.06003 | 26,100 |
| Diesel Forklift | Electric Forklift | |
|---|---|---|
| Maximum load capacity | 1500 | |
| Full load power | 2.3 l/h | 4.1 kW |
| Activity time(s) | 60 | 60 |
| Source of information for the environmental damage model | ECOINVENT v3.01 | OECD/IEA 2015 |
| Country | Germany | Spain |
|---|---|---|
| Energy recovery | 68.4% | 26.7% |
| Non-energy recovery | 0% | 0% |
| Recycling of materials | 31.6% | 54.0% |
| Other forms of recycling (including composting) | 0% | 0% |
| Unknown | 0% | 19.3% |
| Total | 100% | 100% |
| Material | Millions of Tons | Fibre Composition | |
|---|---|---|---|
| Total | Primary | Recycled | |
| Kraftliner | 4.4 | 3.2 | 1.2 |
| Testliner | 12.5 | 12.5 | |
| Another recycled liner (Schrenz) | 1.0 | 1.0 | |
| Fluting semi-chemical | 0.6 | 0.5 | 0.1 |
| Fluting recycling | 11.6 | 11.6 | |
| TOTAL | 30.1 | 3.7 | 26.4 |
| Percentage | 12% | 88% | |
| Destination | Country | |
|---|---|---|
| Germany | Spain | |
| Incineration/energy recovery | 12.28% | 0% |
| Non-energy recovery | 0% | 0% |
| Incineration with energy recovery in waste incinerators | 0.03% | 5.38% |
| Recycling of materials | 87.33% | 94.62% |
| Other forms of recycling (including composting) | 0.36% | 0% |
| Total | 100% | 100% |
| Impact Category | Pitufo® (WB) | Cardboard Packaging (CCB) |
|---|---|---|
| Global Warming Potential (kgCO2 eq.) | 48,828.33 | 99,649.65 |
| Terrestrial acidification (kgSO2 eq.) | 210.11 | 308.99 |
| Eutrophication of water (kg P eq.) | 3.22 | 14.00 |
| Marine eutrophication (kg N eq.) | 0.58 | 11.60 |
| Carcinogenic human toxicity (kg 1,4 DCB) | 936.48 | 917.75 |
| Non-carcinogenic human toxicity (kg 1,4 DCB) | 11,644.26 | 23,288.52 |
| Mineral resource scarcity (kg Cu eq.) | 115.11 | 93.24 |
| Fossil resource depletion (kg oil eq.) | 18,393.07 | 27,868.29 |
| Water Consumption (m3) | 1192.74 | 1403.22 |
Disclaimer/Publisher’s Note: The statements, opinions and data contained in all publications are solely those of the individual author(s) and contributor(s) and not of MDPI and/or the editor(s). MDPI and/or the editor(s) disclaim responsibility for any injury to people or property resulting from any ideas, methods, instructions or products referred to in the content. |
© 2025 by the authors. Licensee MDPI, Basel, Switzerland. This article is an open access article distributed under the terms and conditions of the Creative Commons Attribution (CC BY) license (https://creativecommons.org/licenses/by/4.0/).
Share and Cite
Oliver-Villanueva, J.-V.; Armengot-Carbó, B.; Lorenzo-Saéz, E.; Lerma-Arce, V. Sustainable Environmental Analysis of Wooden Boxes for Fruit and Vegetable Packaging and Transport in Comparison with Corrugated Cardboard Boxes. Sustainability 2025, 17, 557. https://doi.org/10.3390/su17020557
Oliver-Villanueva J-V, Armengot-Carbó B, Lorenzo-Saéz E, Lerma-Arce V. Sustainable Environmental Analysis of Wooden Boxes for Fruit and Vegetable Packaging and Transport in Comparison with Corrugated Cardboard Boxes. Sustainability. 2025; 17(2):557. https://doi.org/10.3390/su17020557
Chicago/Turabian StyleOliver-Villanueva, Jose-Vicente, Bruno Armengot-Carbó, Edgar Lorenzo-Saéz, and Victoria Lerma-Arce. 2025. "Sustainable Environmental Analysis of Wooden Boxes for Fruit and Vegetable Packaging and Transport in Comparison with Corrugated Cardboard Boxes" Sustainability 17, no. 2: 557. https://doi.org/10.3390/su17020557
APA StyleOliver-Villanueva, J.-V., Armengot-Carbó, B., Lorenzo-Saéz, E., & Lerma-Arce, V. (2025). Sustainable Environmental Analysis of Wooden Boxes for Fruit and Vegetable Packaging and Transport in Comparison with Corrugated Cardboard Boxes. Sustainability, 17(2), 557. https://doi.org/10.3390/su17020557