Abstract
New quality productivity (NQP) has the possibility to enhance carbon emission performance which will fortify the groundwork for long-term economic expansion even further. The research examines the panel data of 30 provinces spanning the years 2012 to 2022 for an evaluation framework for NQP and carbon emission performance at the provincial level. Employing fixed effect models, mediation effect analysis, and spatial econometrics, the study explores the effect of NQP on carbon emission performance, its mediating mechanisms, and the spatial spillover effects. The findings indicate that (1) NQP significantly lowers carbon emissions for every unit of GDP and enhances carbon emission performance, and the result holds up when the instrumental variable methods are used. (2) The NQP had a significant contribution to improving carbon emission performance via advancements in green innovation. (3) The NQP does more than directly enhance the regional carbon emission performance; in contrast, it additionally positively influences the carbon emission performance level of the adjacent regions by the spatial spillover effect. (4) The impact of NQP on carbon emission performance is particularly pronounced in eastern and innovative regions. On this basis, we should vigorously develop the NQP, strengthen cross-regional policy coordination, and promote green and sustainable development.
1. Introduction
A major contributor to global warming is carbon dioxide or CO2. It poses a significant threat to global sustainable development [1]. Carbon dioxide is a gas that holds atmospheric heat because it is a greenhouse gas. Because of this, global warming and climate change occur which can harm infrastructure, interfere with supply chains, and cause volatility in the economy [2]. Resolving climate change is not simply for the environmental, it is a matter of human survival and sustainable development for future generations [3].
Under the new development philosophy, Chinese officials established goals for the nation’s endeavors to reach carbon neutrality or peak emissions. Carbon dioxide emissions in China will reach their highest point in 2030, then level off and begin to fall. By 2060, the country will have achieved carbon neutrality and fully implemented a low-carbon, circular economy [4]. Toward this end, China outlined the 14th Five-Year Plan (2021–2025) for National Economic and Social Development and the Long-Range Objectives Through the Year 2035 [5]. From 2021 to 2025, the five-year plan aims to reduce energy intensity by 13.5 percent and carbon dioxide intensity by 18 percent [6]. Aiming to address climate issues and attain sustainable development, carbon intensity must be reduced.
Social productivity has a major role in lowering carbon intensity. Social productivity, particularly NQP, can improve social capacities to address climate issues. From the proposal of the NQP concept in 2023 to China’s implementation of its development in 2024, the outline of NQP began to be clear, and the essential element was innovation-driven. Especially driven by technological innovation, this offers a fundamental guideline and action path for accelerating the development of NQP. NQP is an advanced, high-tech, high-efficiency, and high-quality productive force that adheres to new development concepts. It is compatible with the advanced productivity concept of new development and has the ability to deviate from conventional economic growth paths and modes.
Research on whether NQP can enhance carbon emission performance and how it works to support carbon emission reduction performance is scarce. The following are the main points of this research: (1) It explores the NQP’s influence on carbon emission performance, providing evidence of a positive relationship that enhances the existing empirical research on NQP [7,8,9]. (2) This study analyzes the function of green innovation as a mediator in the connection between NQP and carbon emission performance, which elucidates the dynamics of how NQP impacts carbon emission performance. This approach enriches our comprehension of the diverse mechanisms through which NQP influences carbon emission performance [10,11,12]. (3) When economic and geographical variables are considered together, a geographic Durbin model is born, illustrating that NQP significantly boosts carbon emission performance in adjacent provinces [13]. This study presents innovative insights and methodologies aimed at reducing CO2 emissions. Furthermore, it investigates spatial heterogeneity, revealing that regions in the east and those characterized by innovation are more significantly influenced by the NQP according to carbon emission performance.
This paper’s remaining sections are structured in the following manner: in Section 2, we offer a description of earlier research, and Section 3 conducts a theoretical analysis and presents our hypotheses. Section 4 details the research strategy, variables, and data. The results and discussion are presented in Section 5 and Section 6. These two sections cover various topics such as the analyses of heterogeneity, mediating effect, spatial effect, and tests for robustness and endogeneity. In the end, Section 7 concludes by summarizing our findings and implications and making policy recommendations.
2. Literature Review
2.1. Research on Carbon Emission Performance
The issue of carbon emission performance has attracted increasing attention over the last decade, highlighting the growing sensitivity of scholars to sustainability challenges. Regarding the effectiveness and achievements of governance in environmental protection, scholars are concerned about the ways to boost carbon emission performance, which is influenced by a multitude of factors. First, digitalization possesses the capacity for enhancement carbon emission performance. Shao believed that digital finance greatly boosts urban carbon emission performance, primarily through fostering green innovation and facilitating the growth of urban tertiary industry [14,15]. Similarly, Ma’s research indicates that digitalization can substantially enhance carbon emission reduction in Chinese cities. By enhancing energy efficiency, transforming industries, and introducing new technologies, digitalization enhances the performance of urban carbon emissions [16]. Enterprise digital transformation actively helps to enhance the carbon emission performance of enterprises, particularly in manufacturing companies, state-owned enterprises, and non-polluting industries [7]. Second, technological innovation can boost carbon emission performance. Enhanced technological capabilities and innovation in clean energy sources are essential for reducing carbon emission intensity. Renewable energy options, for example, solar, wind, and hydro power, are becoming increasingly accessible and affordable, making it easier for industries and individuals to transition away from fossil fuel-dependent energy systems. Additionally, improvements in energy efficiency and conservation measures may similarly lower carbon emissions. While digital transformation helps to mitigate the harmful impact of green innovation on energy-consuming companies’ carbon emission reduction performance, green innovation itself can greatly improve this performance [17]. Innovation in environmentally friendly technologies greatly enhances the performance of carbon emissions. An additional paper confirms that the inefficient use of capital and labor reduces carbon emission performance and impedes the positive effect of innovative green technologies on this metric [18]. Third, the central role is played by government policies and regulations in driving the increase in carbon emission performance. The efficiency and efficacy of regulations have a significant impact on how well a company is able to reduce emissions [19]. By implementing strict emission standards and incentivizing the usage of sustainable practices, governments can encourage industries to invest in cleaner technologies and practices. This can be achieved through the implementation of carbon pricing mechanisms, tax incentives, and subsidies for renewable energy projects. Some scholars argue against the strict emission standards. A high level of government intervention mitigates carbon emission performance. This harmful impact intensifies when facing greater regional fiscal pressure [20]. The carbon emission performance of the pilot regions has been greatly impacted by China’s carbon trading policy. Factors like GDP per capita, urbanization level, and capital–labor ratio have played a crucial player in cutting the intensity of carbon emissions [9]. Finally, other contributing factors include development zones, urbanization, industrial intelligence, spatial distance, and corruption. Urban carbon emission performance improved after development zones were set up, and this improvement was apparent even after controlling for time lag effects. By boosting GDP and decreasing carbon emissions, development zones improve carbon emissions performance [21]. As the levels of economic development rise, urbanization is discovered to exhibit a more potent inhibitory effect on carbon emission performance [22]. Ironically, local carbon emission performance improves as industrial intelligence improves. The carbon emission performance of nearby regions is significantly impacted negatively by industrial intelligence [23]. Within a 1000 km radius, low-carbon cities significantly reduce local greenhouse gas emissions, improve emission efficiency, and boost the performance of nearby cities in terms of greenhouse gas emissions [13]. Corruption reduces energy efficiency, which exacerbates industrial carbon emissions [24].
2.2. Research on NQP
Scholars are now conducting research on NQP. NQP dramatically enhances environmental, social, and governance performance [25]. Innovation is what propels NQP, and its key motor is the development of innovative green technologies. NQP is primarily driven by breakthrough green technological innovation, which also serves as a crucial tool for its development and promotion [26]. In Chinese agricultural development, NQP plays an important role [27]. NQP can facilitate a good level of development by encouraging breakthroughs, collaboration, transparency, and joint innovation among its subsystems [28]. Policy support, market demand, and technological innovation greatly affect the green productivity of high-tech retail enterprises, assisting in the sustainable growth of their green and NQP [29]. The NQP plays an important part in green development by enhancing technology and refining industrial structure [30,31].
3. Research Hypotheses
3.1. The Mechanism by Which the NQP on Carbon Emission Performance
NQP represents advanced productivity that transcends conventional economic growth models and development paths [32]. NQP’s effectiveness lies in “new” and “quality”. The new signifies a model that fundamentally diverges from the traditional frameworks, while quality denotes the enhancement of core industry attributes through scientific and technological advancements [33]. Characterized by high technology, efficiency, and quality, NQP effectively harnesses technological innovation and sustainability, significantly boosting environmental improvement [34]. The impact of NQP on carbon emission performance is as follows:
3.1.1. The Function of NQP in Science and Technology
The function of NQP in science and technology is reflected through the three productivity elements of the laborer, subject of labor, and tools of labor.
Through technological innovation and management innovation, NQP has greatly improved labor productivity, reduced labor intensity, improved labor environment, and effectively shortened labor time [35]. For example, the application of new production tools such as robots and artificial intelligence enables workers to do more efficient and precise work, thus reducing physical burden and carbon emissions [36]. The rising awareness of the labor force to protect the environment plays a constructive role in boosting carbon emission reduction. In the working environment and production process, workers practicing the concept of environmental protection can promote carbon emission decline. In manufacturing, the labor force reduces energy consumption and waste emissions by improving production processes and optimizing production processes. In the service sector, workers reduce carbon emissions by promoting paperless offices and reducing the use of paper such as printing and photocopying. The labor force also actively participates in the environmental protection activities of enterprises, such as afforestation and waste classification, to contribute to improving the environment. As a result, new productivity changes the laborer and reduces carbon emissions.
The role of new productivity on the subject of labor is mainly reflected in expanding the types and forms of labor objects, improving the quality and utilization efficiency of labor objects, and promoting the upgrading and improvement in related industries. Firstly, the expansion of the traditional subject of labor: Driven by the new productivity, the types and forms of traditional labor objects have been expanded. With the help of emerging technologies, new substances are extracted from nature and replace traditional, energy-consuming, and polluting substances [37]. Secondly, the emergence of new labor objects: In the process of using emerging technologies, a large number of new labor objects have been produced. These new labor objects often have higher added value and wider application fields. Thirdly, quality improvement: New productivity also improves the utilization efficiency of labor objects by optimizing production processes and resource allocation. Under the circular economy model, people can reduce the exploitation and consumption of new resources by recycling and reusing waste materials [38].
The influence of new productivity on tools of labor is comprehensive. Thanks to the rapid advancements in emerging digital technologies, for example, AI, big data, and so on, labor tools are evolving in an intelligent direction [39]. Advanced labor tools, such as intelligent robots and automated production lines, not only facilitate remote control but also enable independent, precise, flexible, and safe operations. Traditional labor tools may suffer from personal errors and time lags during the use of traditional tools of labor, whereas new labor tools significantly reduce error rates and enhance production efficiency and flexibility through intelligent analysis, optimization, and autonomous decision-making capabilities. These tools often incorporate green low-carbon technology, significantly reducing fossil fuel usage and consumption, thus effectively achieving energy conservation and emission reduction. This not only aids in protecting the ecological environment but also aligns with the need for a shift in economic growth patterns amidst the global energy crisis. In summary, the influence of new productivity on labor tools is profound. It not only drives the intelligent transformation of labor tools and enhances production efficiency but also promotes the adoption of green low-carbon technology in labor tools. These changes not only bolster the economic efficiency and competitiveness of enterprises but also help the sustainable development of the entire nation.
3.1.2. NQP Can Reduce the Energy Consumption Intensity
The development of NQP can boost the enhancement of overall factor productivity and reduce the energy consumption intensity by promoting the following ways:
First, the NQP drives the transformation of production mode and the improvement in efficiencies. New quality productivity is centered on technological innovation and promotes the transformation of production mode by introducing new technologies, processes, materials, and equipment [40]. The widespread application of information technology, artificial intelligence, and big data has changed the production mode of manufacturing and service industries, driving them towards intelligent, automated, and efficient development, and promoting efficiency improvement. New quality productive promotes efficiency improvement, which reduces the resource and energy consumption per unit product of the same quality, enhances energy utilization efficiency, and lowers carbon emissions. This ultimately leads to a scenario where both the economy and carbon emissions are boosted.
Second, the NQP facilitates the optimal allocation and synergetic exertion of production factors. Through optimizing the combination of elements such as labor, capital, land, knowledge, technology, management, and data, the effectiveness of distributing resources is enhanced. The advancement of new quality productive guarantees the smooth flow and efficient allocation of production factors. Through the establishment of a unified national market and by minimizing the factors that impede development, the processes of production, distribution, circulation, and consumption are streamlined, and the efficiency of resource allocation is elevated [41].
Through the above discussion, it can be found that NQP affects carbon emissions from three aspects: laborer, subject of labor, and tools of labor, and also transforms production mode and facilitates the optimal allocation of production factors, thereby reducing carbon emission intensity, finally enhancing its carbon emission performance.
In summary, we present the following hypotheses:
Hypothesis 1.
The role of NQP in enhancing labor productivity, broadening the subject of labor, and transforming tools of labor is pivotal in reducing carbon emissions and enhancing carbon emission performance in China.Thus, the NQP has a profound impact on enhancing carbon emission performance.
3.2. Mechanisms by Which Green Innovation Influences Carbon Emission Performance
Green innovation refers to an innovative activity in the process of product development, production, service, and management, which adopts concepts and technical tools to cut environmental pollution, reduce resource consumption, and enhance energy efficiency. This innovation not only focuses on economic benefits, but also emphasizes ecological and social benefits, reflecting the needs of sustainable development and circular economy. The evolution of NQP is congruent with the trend toward environmentally friendly technological advancements [42]. NQP emphasizes green technological innovation, especially key and disruptive technological breakthroughs. These technological breakthroughs have not only promoted the upgrading and transformation of traditional industries, but also spawned green industries and emerging industries, providing strong technical support for green innovation. In terms of digital technology, digital transformation is able to greatly enhance green innovation in manufacturing enterprises, having an especially noticeable impact on substantive green innovation [43]. The reason why green technology innovation can become the core of NQP is that it can effectively solve resource and environmental issues and support the improvement and advancement of the economic structure. By increasing resource utilization efficiency and decreasing pollutant emissions, green technologies not only assist in reducing the current environmental pressures, but also create a strong basis for sustainable development in the future.
We can derive the following hypotheses from the previous discussion:
Hypothesis 2.
Green technology innovation is a key component of NQP, which also successfully addresses resource and environmental issues, supports the enhancement of economic structure, and encourages the modernization and transformation of conventional industries. Consequently, green innovation in Chinese provinces may positively moderate the relationship between NQP and carbon emission performance.
3.3. Spatial Effects of NQP on Carbon Emission Performance
NQP is often accompanied by technological innovation and industrial upgrading, which not only occur within a specific region or industry, but may also affect the surrounding areas or related industries through technology diffusion and industrial transfer. In the field of green innovation, the promotion and application of new technologies, new materials, and new processes can reduce carbon emission intensity and improve energy efficiency, which is not only limited to the place where innovation occurs, but may also spread to the surrounding areas through supply chains, industrial chains, and other channels [44]. By contrast, the establishment of a carbon emission trading market has sparked controversy among scholars. According to Quan and Duan’s study [45], the emission trading system did not result in considerable spatial spillovers, which reduces worries regarding possible carbon leakage. However, the carbon emission trading market also can prompt companies to pay more attention to carbon emission performance and adjust production strategies by buying or selling carbon emission credits, which may cross regional boundaries. Therefore, the carbon emission performance of a province is impacted not only by its own NQP but also by the surrounding areas’ carbon emission performance’s spillover effect. Both positive and negative demonstration effects and competitive effects are the possible outcomes of this spillover effect.
We can derive the following hypotheses from the previous discussion:
Hypothesis 3.
A province’s carbon emission performance is influenced by both its own NQP and the carbon emission performance of the surrounding regions. NQP may have a spatial spillover effect on carbon emission performance.
4. Variables, Model, and Data
4.1. Variables
4.1.1. Explained Variable
At the microeconomic level, most often, businesses’ carbon emission intensity is dividing the carbon emissions at the enterprise level by the operating income of enterprises. At the macroeconomic level, carbon emission intensity is expressed by dividing the carbon emissions of every province by GDP. Among them, the carbon emission accounting method adopts the emission factor method [46,47], which is specifically the sum of energy consumption at the provincial level, which is weighted with the corresponding standard coal conversion coefficient and carbon emission coefficient.
Accounting for CO2 emission is essential for evaluating carbon emission performance. Nevertheless, CO2 itself is not classified as an air pollutant, and there is no global detection system globally. Consequently, the IPCC has developed a methodology for estimating national CO2 emissions produced due to burning fossil fuels containing carbon and the carbon content inherent in that energy, which is widely implemented internationally. From this, it can be concluded that the carbon emissions from fossil fuels are equal to the energy consumption multiplied by the carbon emission factor. Due to its association with the attributes, quality, and efficiency of energy fuels, it is possible to further decompose the carbon emission factor by multiplying the fuel’s calorific value by the carbon content per unit calorific value, and then by the combustion efficiency.
Referring to the study by Aamir and Rehman [48], the formula to calculate carbon emissions from fossil energy consumption is as follows:
where C refers to the sum of carbon emissions in j province, and i refers to the sorts of fossil energy, including coke, coal, crude, kerosene, diesel, gasoline, fuel oil, and natural gas. E refers to the consumption of type i fossil energy. SSC refers to the standard coal conversion coefficient of type i and CEC is the carbon emission coefficient of type i. The ratio 44/12 is the molecular ratio of carbon dioxide to carbon.
The equation utilized to compute carbon intensity is as follows:
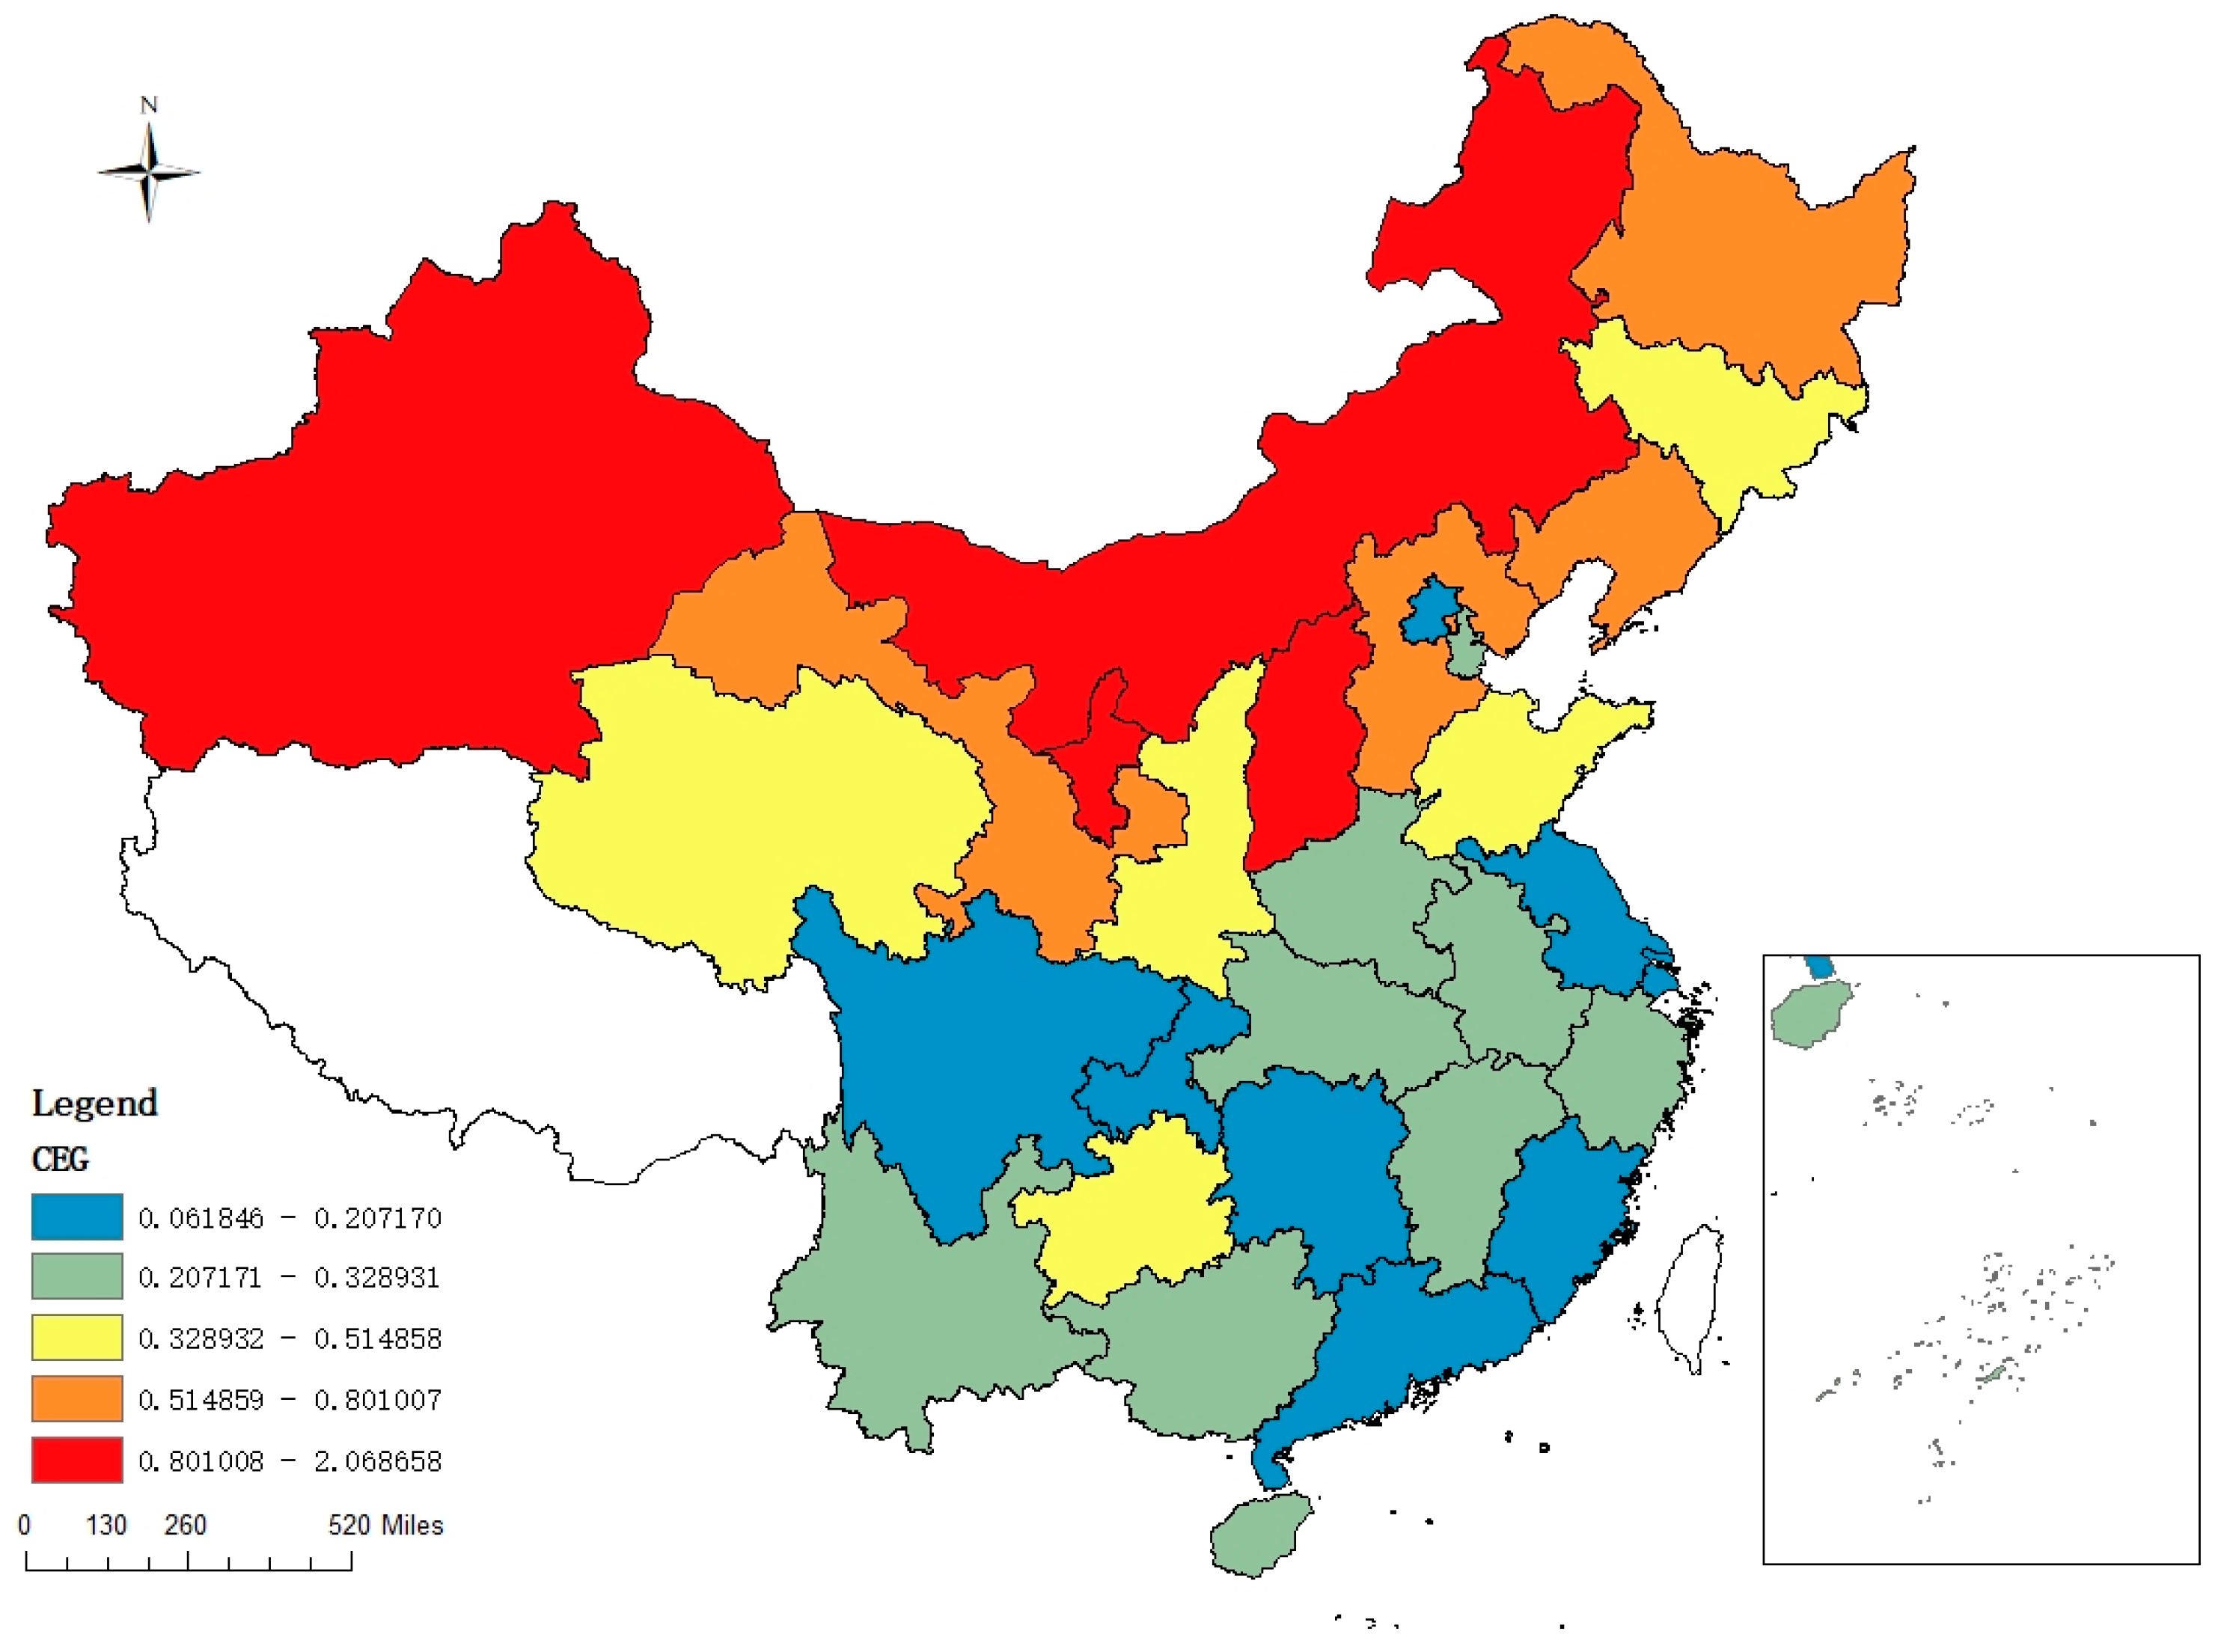
where CEG denotes the carbon emission performance in j province, calculated by dividing j province’s total annual carbon dioxide emissions by the region’s gross domestic product. The above CEG is a commonly used measurement method for carbon emission performance, and some scholars use the total factor CO2 emission performance index to measure CO2 emission performance [49]. Following Tang, Wang, and Wan [50], CEG, simple and intuitive, serves as explained variable. Based on the calculation results of the above Formula (2), we draw the spatial distribution map of CEG in 2022. As shown in Figure 1, the provinces with a high CEG index, more than 0.51, were largely involved in northern areas, while the provinces exhibiting lower CEG index, less than 0.33, were primarily distributed in the south. This means that the northern provinces consume more carbon per unit of GDP than the southern provinces. This may also be related to the fact that the energy industry was predominantly in the northern provinces, while the light industry was more in the southern provinces.

Figure 1.
Spatial distribution of CEG in China in 2022. Note: This map was produced in accordance with the standard map provided by the National Administration of Surveying, Mapping, and Geoinformation, with the map review number GS(2019)1822. The base map has undergone no modification.
4.1.2. Explanatory Variable
NQP is used as the explanatory variable. The existing techniques for assessing NQP are typically categorized into two categories including the subjective weighting method and objective weighting method. Because the former gives different weights to each indicator according to the subjective judgment of experts, it is difficult to avoid the impact of personal subjective preferences in practice. The second method can avoid the shortcomings of the former, and has the characteristics of objectivity, scientificity, and wide applicability, which provides a scientific basis for multi-indicator comprehensive evaluation. The study uses the entropy method in the objective weighting method to calculate NQP as follows: First, put together the measurement matrix, ; here, is the data for indicator j in sample i, n represents the sample size, and denotes the total quantity of indicators to be evaluated. Second, to reduce the impact of differences in indicator definitions and characteristics, the preliminary data were standardized using the extreme difference approach. To avoid logarithmic meaninglessness when calculating entropy values, a real number of a smaller scale can be added to each 0 value, such as 0.01. Positive indicators are determined by the formula . Negative indicators are formulated in a similar manner: where and refer to the maximum and minimum values of the elements in the columns where the indicator vector is located. Third, the weight is calculated as follows: . Then, information entropy is calculated, represented by the , where The difference coefficient of the jth indicator is . The jth indicator’s weight is expressed as . Fourth, the calculated results of the multi-index comprehensive score is denoted as .
To assess NQP and to find the weights, the entropy method was used [34], while the entropy weight-TOPSIS method was used to determine the index system [51]. Consequently, The entropy method was utilized to measure the NQP [52]. Referring to Han et al. and Shao et al. [51,53], most of the literature uses the entropy method as the measurement method. The evaluation index system of NQP is constructed from the three criteria of laborer, subject of labor, and tools of labor, as presented in Table 1.

Table 1.
Criteria and factor measurement method for NQP index system.
Following the application of the entropy approach to ascertain the weight of indicators at various levels, the study calculated the NQP index of each province from 2013 to 2022. As shown in Figure 2, we selected the representative year 2022 and drew the spatial distribution map of NQP in 2022. We found that NQP demonstrated a gradual downward trend from coastal to inland. Among the provinces, Guangdong, Jiangsu, and Zhejiang ranked high, more than 0.44, in NQP, while among the inland provinces, Gansu and Qinghai, less than 0.16, ranked low. The results were consistent with the study by Zhang et al. [52] that “East coast to west inland diffusion” is the spatial evolutionary trend exhibited by high-value areas. This may be related to the fact that the eastern coastal areas are active in technological innovation and the inland areas are dependent on resource industries.
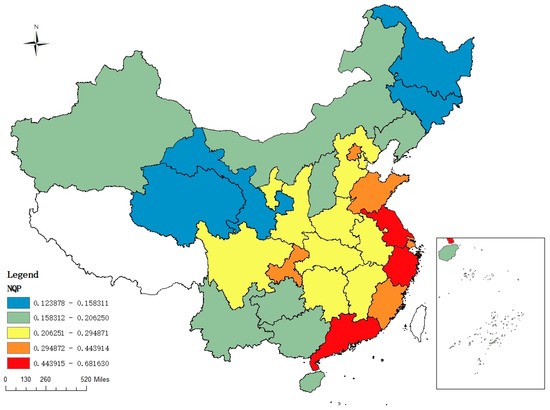
Figure 2.
Spatial distribution of NQP in China in 2022. Note: This map was produced in accordance with the standard map provided by the National Administration of Surveying, Mapping, and Geoinformation, with the map review number GS(2019)1822. The base map has undergone no modification.
4.1.3. Control Variables
The Fiscal Environment Expenditure (FEE) is calculated by taking the ratio of environmental spending to fiscal spending within a province. The rise in government funding directed towards environmental protection initiatives and sustainable technologies has had a favorable effect on green economic growth [54,55]. Government expenditure on environmental protection refers to the monetary resources allocated by the state for safeguarding the environment. Resources are primarily designated for environmental protection management, environmental monitoring and supervision, pollution control, and other aspects. Specifically, pollution control expenditure for environmental protection is directly used to mitigate the emissions of environmental pollutants, including greenhouse gases such as carbon dioxide. By investing in advanced pollution control technologies and equipment, the government may significantly boost the efficiency of its environmental governance. The Industrial Development Index (IND) is measured as the ratio of the industrial added value to GDP. Achieving peak carbon emissions in China requires the industrial sector to converge carbon emissions [56]. Industrial production demands substantial energy inputs, predominantly from fossil fuels whose combustion is the reason for significant emissions of greenhouse gases, particularly carbon dioxide. Conversely, industrial growth has driven technological advancement, enhancing production efficiency while fostering the emergence of technologies exhibiting the aim of energy conservation and emission reduction. The implementation of new energy technologies, including solar and wind power, along with energy-efficient systems, can considerably mitigate carbon emissions. CWF represents the logarithm of the exhaust gas treatment capacity. The waste gas treatment project directly diminishes greenhouse gas emissions by treating and purifying the waste gas generated in industrial production through a series of technologies and equipment. These greenhouse gases, including carbon dioxide, have an important impact on global climate change. Through waste gas treatment, the intensity of these gases can be effectively reduced against climate change. For instance, numerous studies have been conducted on the emissions from diesel exhaust pollutants and the technologies for controlling these emissions after treatment [57]. FIN is the logarithm of the added value of the financial industry. By providing green loan financial services, the financial industry can guide funds to low-carbon, environmental protection, and other fields. With the increase in the added value in the financial industry, more financial loans are invested in low-carbon areas such as environmental protection, clean energy, and green transportation to promote the rapid development of these areas, thus helping to reduce carbon emissions [58]. GCR is the green coverage of built-up areas in a province. The improvement in green coverage in the built-up areas of a province can promote emission reduction. Firstly, green plants can absorb a large amount of carbon dioxide through photosynthesis, reducing the concentration of pollutants in the air and thus lowering carbon emissions. Secondly, green vegetation can provide shading and ventilation effects, reduce heat accumulation in cities, decrease the demand for air conditioning and other refrigeration equipment, and thereby lower energy consumption and carbon emissions [59,60]. POP is the logarithmic value of the population. We can observe a close link between the population and carbon emissions in each province. As the population grows, the scope and scale of people’s activities correspondingly increase, which will lead to more energy consumption. And energy consumption is a key figure in the greenhouse gas emissions, thus an increase in the global population will cause these emissions to rise [61].
4.1.4. Mediating Variable
The mediating variable, newly applied green patent (NGP), is calculated by taking the logarithms of NGP in each province. The green patent of a province represents the technological innovation ability and achievements of the province in terms of environmental protection and sustainable development, and is a crucial indicator to evaluate the contribution of environmental protection, industrial transformation and upgrading, policy support, and market prospects of the province. Green patents are particularly linked to inventions that lessen their negative effects on the environment or help make better use of the available resources [25,62].
All the variables’ definitions can be found in Table 2.
Table 2.
Definition of variables.
4.2. Model
4.2.1. Fixed-Effects Model
Considering a more detailed assessment of the relationships between the variables, this study uses a bidirectional fixed effects model to examine the effect of NQP on CEG as follows:
CEGit stands for the ratio of carbon emissions to GDP for province i in year t. NQPit signifies the corresponding new quality productivity for the province. Controlit comprises a collection of control variables that could potentially impact the CEG. μi indicates region-fixed effects, λt denotes time-fixed effects, and εit represents a random error term.
4.2.2. Intermediary Effects Model
In order to uncover the mechanism of how the independent variable effects the dependent variable through the mediating variable, the paper employs a mediation model to assess the effect of NQP on CEG through NGP. The specific model is as follows:
In model 6, NGPit is the level of the newly applied green patent in province i of year t. The NGPit does not have a direct effect on CEGit, but is achieved through the mediating variable NGPit.
4.2.3. Spatial Durbin Model
In accordance with the possible spatial and geographic effects of NQP and CEQ in each province, the paper examines the spatial spillover impact of NQP on CEQ utilizing the Dubin model in the following way:
where ρ denotes the spatial autoregressive coefficient, which indicates how the CEG of the province is influenced by that of its neighbors. Wij stands for the spatial weight matrix, and β stands for the regression coefficient of NQP on CEG, which shows how NQP affects CEG. γ denotes the spatial effect of NQP, which may determine the influence of NQP in the adjacent regions on CEG in the province. Xit is the province i in the t year for each control variable, and θ is the spatial effect of the control variable. The spatial lag model and spatial error model can be regarded as special forms of the spatial Dubin model. When γ = θ = 0, the model is a spatial lag model. When ρ = γ = θ = 0, the model is a spatial error model.
4.3. Data
Considering the robustness, the study chooses 30 Chinese provinces’ panel data with the exclusion of Tibet between 2012 and 2022, totaling 330 samples. Raw data for the relevant indicators are the China Environmental Statistics Yearbook, the China Energy Statistics Yearbook, the China Science and Technology Statistics Yearbook, the China Statistical Yearbook, and the statistical yearbooks of each province between 2013 and 2023. Data on patent applications for green inventions in provinces come from the official website of national intellectual property rights. We utilized interpolation to decrease sample loss because there was only a small amount of missing original data. The descriptive statistics for each variable are displayed in Table 3.
Table 3.
Descriptive statistics of variables.
5. Empirical Analysis
5.1. Pearson Correlation Test and VIF Test
Correlation analysis is the premise of data regression by analyzing the dependence between the values of variables. Only relevant data can be further regressed. Table 4 presented that, the correlation coefficient between CEG and NQP is −0.471, and the two variables are negatively correlated. The correlation coefficient between CEG and NGP is −0.221, and the two variables are positively correlated.
Table 4.
Pearson correlation test.
To prevent multicollinearity of the predictive variables, the variance inflation factor (VIF) was used in this study. As Table 5 illustrates, the VIF is 2.90, and the VIF values of all the variables are below 10, excluding the possibility of multicollinearity.
Table 5.
VIF test.
5.2. Baseline Regression
Table 6 illustrates the baseline regression outcomes. Particularly, column (1) illustrates the direct regression results between NQP and CEG, while column (2) shows the regression outcomes after incorporating control variables. The baseline regression findings indicate that NQP remains consistently significant in every model at the 1% level, thereby underscoring the robust negative correlation between NQP and CEG. The findings show that NQP exerts a suppressive influence on CEG, implying that carbon emission performance is improved and thereby supporting the reliability of Hypothesis 1.
Table 6.
Baseline regression.
According to Zhang et al. [63], the level of coupling coordination between NQP and manufacturing carbon emission efficiency has shown an ongoing rising tendency. Additionally, the NQP of provinces in China has exhibited an increase over the year, as has the efficiency of manufacturing carbon emissions. Manufacturing is an integral part of all industries, and it is a key source of carbon emissions, highlighting the essential role of NQP in driving improvements in carbon emission performance. Plus, the control variable coefficients shown in Table 6 indicate that CWF exerts a positive yet modest influence on CEG, aligning with the conclusions drawn by Zhang et al. [63]. Human activities significantly contribute to the rise in CO2 levels in the atmosphere, with approximately two-thirds of the greenhouse effect attributed to such activities. The GCR coefficient is notably negative at a 5% significance level, corroborating the results of Chen et al. [59]. There exists a beneficial link between the CEG and the growth of both urban areas and ecological green spaces. Consistent with what Xu and Liu found, the FIN coefficient is negative at the 5% significance level as well [64]. As GDP per capita increases, the interplay between the real economy and financial industries has promoted the carbon emissions incline across different regions. The IND coefficient is negative at a 1% significance level, supporting the research conducted by Zhang et al. [65]. High-carbon industries greatly contribute to the escalation of carbon emissions, and at the same time, the medium- and low-carbon industries tend to have a more favorable impact on carbon emissions. The POP coefficient, which is positive at the significant level of 1%, contrasts with the findings of Zhu and Peng [66], possibly due to the fact that changes in population structure have an effect on carbon emission performance. Furthermore, the impact of control variables on CEG underscores the complex nature of CEG performance, which is shaped by a variety of indicators.
5.3. Robustness Tests and Endogenous Treatment
The baseline regression analysis outlined previously indicates that NQP plays a significant role in constraining CEG. To assess the model’s reliability, additional methodologies will be employed for robustness assessment.
5.3.1. Substitution of the Explained Variable
For the purpose of robustness testing, this paper utilizes the proxy variable approach to reduce the impact of the explained variable’s selection bias on the regression results. Table 7 details the outcomes of a new regression analysis that used the ratio of CO2 emissions to industrial value added as the principal explained variable instead of CEG. According to the results in column (1), the NQP is still statistically significant at the 5% level even after controlling for the explanatory variable.
Table 7.
Robustness tests and endogeneity treatment.
5.3.2. Excluding Special Samples
In addressing the issue of special samples, the study excludes data from municipalities such as Beijing, Tianjin, Shanghai, and Chongqing, which operate under a distinct policy framework compared to other provinces [67]. This exclusion is intended to enhance the generalizability of the findings and minimize the impact of atypical samples. The outcomes presented in column (2) of Table 7 ensure that the coefficients on NQP continue to be significant at the 10% level.
5.3.3. Lag Treatment
To address potential endogeneity arising from bidirectional causality, the study used first-order and second-order lags for the core explanatory variables, and to further find out the lag time length of NQP on CEG. Specifically, L.NQP denotes the corresponding variable lagged by one period. The regression outcomes for these lags are provided in columns (3) and (4) of Table 7, revealing that the coefficient on NQP remains significant, with both NQP and L.NQP significant at the 5% level, which denotes that NQP has a one-year time lag effect on CEG. This temporal relationship implies that productivity may initially develop, subsequently leading to improvements in carbon performance.
5.3.4. Endogenous Treatment
In order to solve the possibility of endogeneity in the regression model, the research uses a two-stage least squares (2SLS) approach. Based on previous studies [68], this research selects the full-time equivalent of R&D Personnel and the installation density of robots as instrumental variables. The instrumental variables selected for this study satisfy relevance and exclusivity. These instrumental variables are related to the endogenous variable NQP, and are independent of the latent regression results. According to Table 7, column (5), after accounting for the influence of instrumental variables, NQP has a significant effect on CEG, supporting the results of the previous study.
5.4. Heterogeneity Test
5.4.1. Heterogeneity of Geographic Location
The 30 provinces in the sample were put into 3 categories including eastern, central, and western regions in accordance with their geographical locations to investigate potential disparities between NQP and CEG across these areas. As indicated in Table 8, a significant association between NQP and CEG was observed in both the eastern and western provinces, whereas the central provinces exhibited minimal influence from NQP. This discrepancy can be linked to variations in resource availability and the levels of economic development.
Table 8.
Heterogeneity of geographic location.
5.4.2. Heterogeneity of Different NQP Levels
The study acknowledged the heterogeneity in NQP levels across provinces, leading to the classification of the sample into three distinct groups: high, medium, and low. If you look at Table 9, in provinces categorized as high and low, CEG demonstrated a 10% significance level, as presented in the NQP-High group. In contrast, the medium group showed a statistically insignificant effect of NQP, as indicated in the NQP-Mid group.
Table 9.
Heterogeneity of different NQP levels.
6. Impact Mechanism Test
6.1. Mediating Effect Test
According to Table 10, the NQP coefficient in columns (1) to (3) was statistically significant at the 5%, 1%, and 1% levels, respectively, thereby confirming that NGP had a positive effect on CEG and serves as a mediator between NQP and CEG. Hypothesis 2 is confirmed. However, in column (2), the regression coefficient sign of the main explanatory variable NGP was inverted, suggesting a masking effect.
Table 10.
Mediating effect test.
To elucidate the above complex mechanism of play and to ascertain the direct and indirect effects of NGP on CEG, the study employed mediation decomposition techniques, referencing the existing literature and utilizing the Sobel–Goodman test [69]. The findings presented in Table 11 confirmed the results of the Sobel test. The results showed that NGP indeed functions as a mediator, with an estimated indirect effect value of 0.088 and a Z-value of 1.91, which was significant at the 10% level. The acoefficient showed that the regression coefficient for the mediating variable NGP on the explanatory variable CEG was 0.966, significant at the 1% level, while the bcoefficient showed that the regression coefficient of the explanatory variable CEG on the mediator NGP was 0.091, which was significant at the 1% level. However, the coefficient of the indirect effect (0.088) failed to exceed the direct effect estimate (−0.781), and the total effect estimate (−0.693) was significantly negative. According to Arshad and Gulzar’s research [70], the results of the Sobel–Goodman test demonstrated that there was a masking effect, meaning that NGP did not directly promote the improvement in CEG. Rather, it facilitated the improvement in CEG indirectly by enhancing NQP.
Table 11.
Sobel–Goodman mediation tests.
6.2. Spatial Spillover Effects Test
6.2.1. Spatial Autocorrelation Analysis
To assess whether a variable is spatially correlated, we utilized the global Moran’s index to analyze the spatial autocorrelation. Table 12 shows the results of our annual global Moran’s index calculation, as well as our CEG and NQP Moran’s index calculations. The global Moran’s index showed a positive value from 2012 to 2022, indicating that the two variables were clustered either high–high or low–low throughout the observation period. There was also a substantial spatial autocorrelation between CEG and NEP among provinces within this timeframe, as the Z-value for each year was greater than 1.96. These results demonstrate that CEG and NEP are positively correlated with one another in space and that a spatial clustering phenomenon does in fact exist.
Table 12.
Annual global spatial autocorrelation analysis.
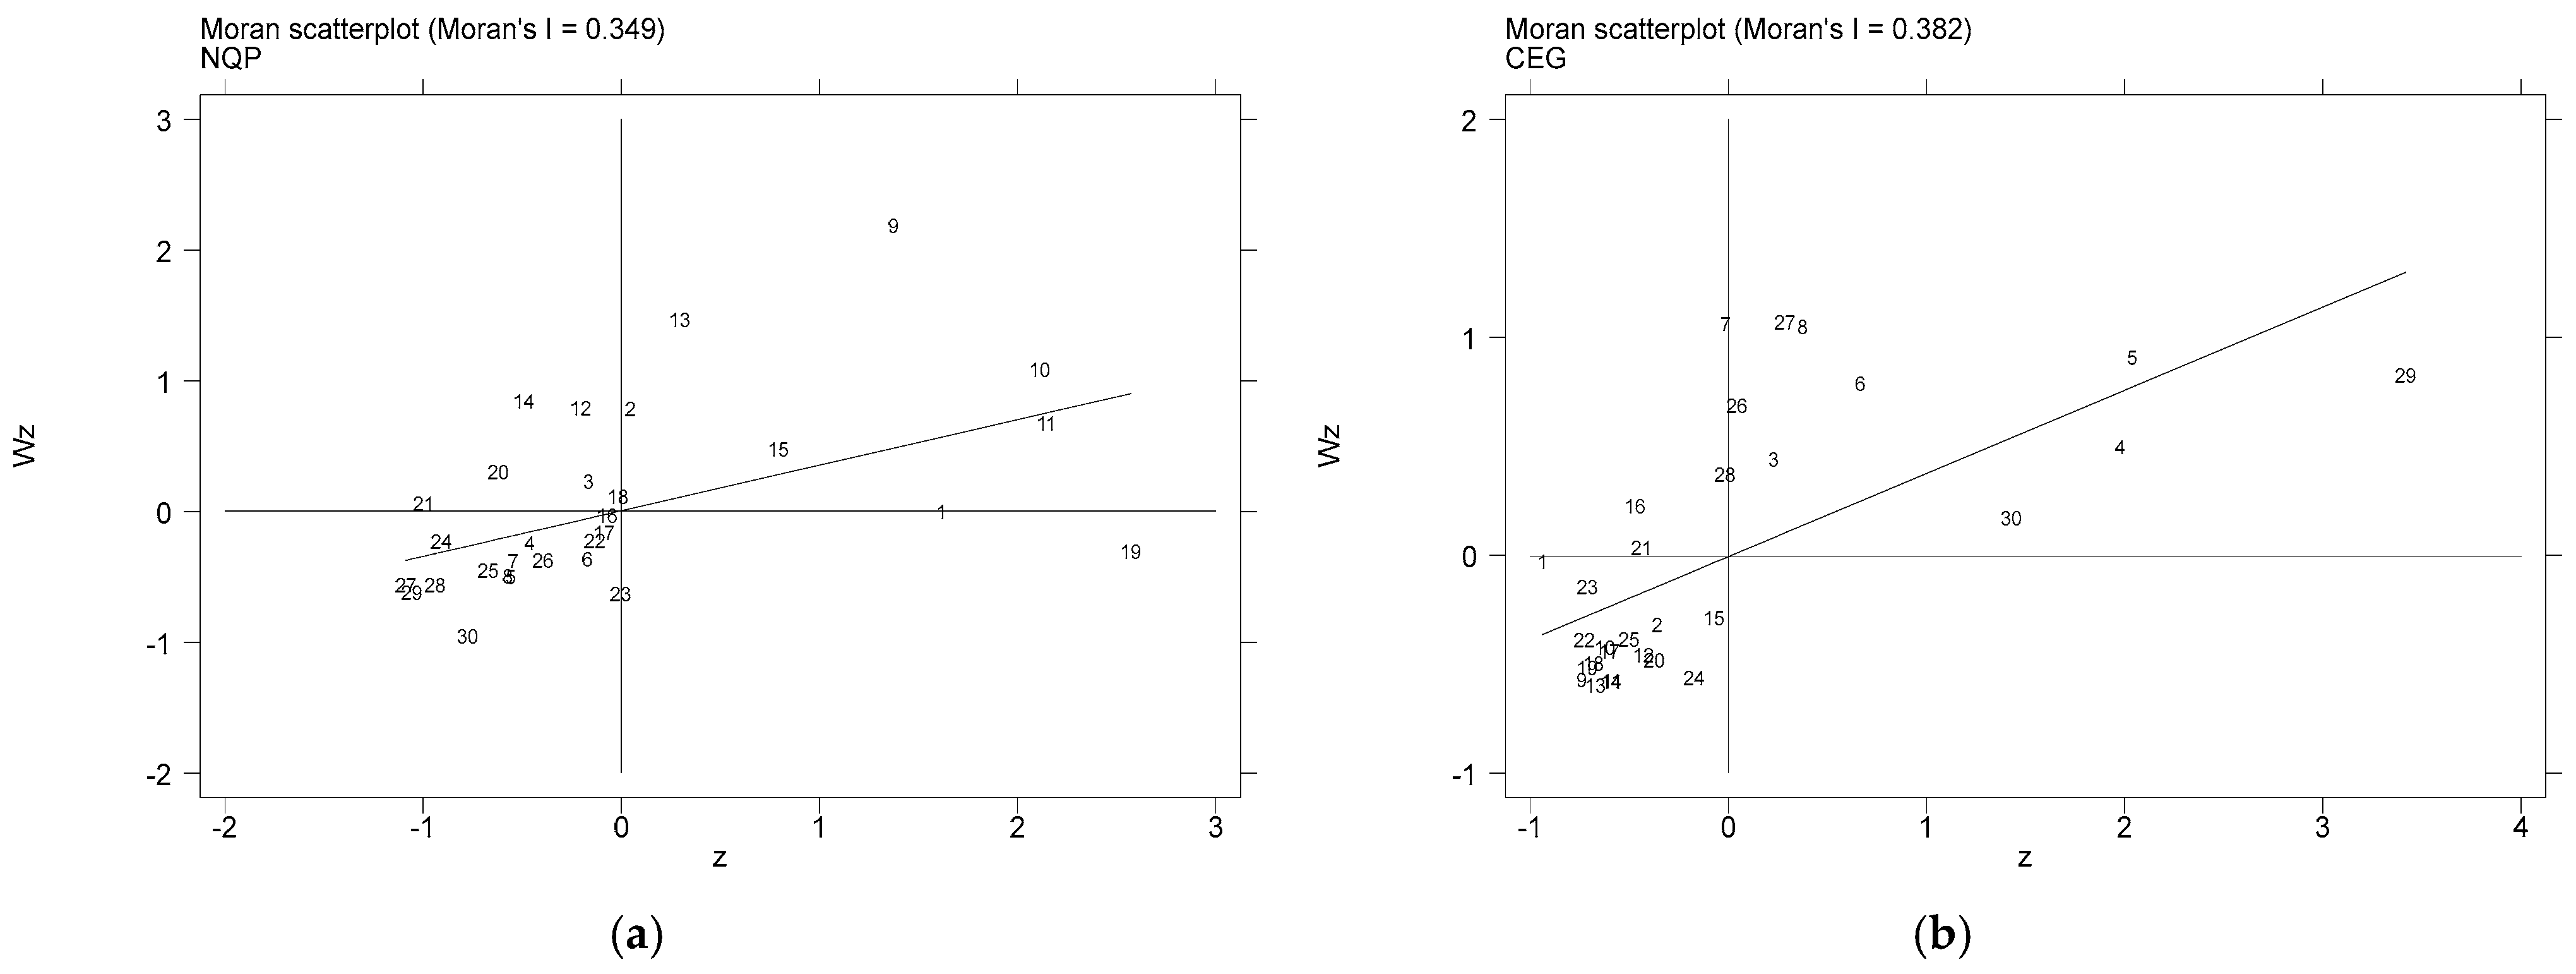
For the purpose of investigating the local spatial correlation more thoroughly, we applied the local Moran’s I method to examine the spatial autocorrelation of NQP and CEG at a local level. Figure 3 illustrates Moran’s I scatter plots for CEG and NQP across each province for 2022, demonstrating a strong positive spatial association at the local level, as the majority of provinces are concentrated in the first third quadrants.
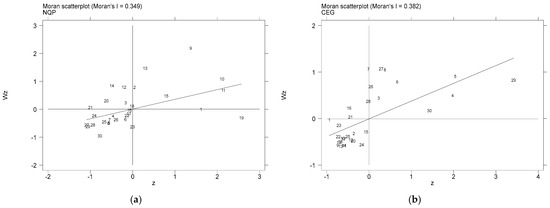
Figure 3.
Annual Local spatial autocorrelation analysis. (a) Moran’s index of NQP in 2022; (b) Moran’s index of CEG in 2022.
6.2.2. Spatial Model Suitability Tests
In order to comprehend the features of spatial correlation, particularly its presence in either the error term or the lag term, the assessment of the Lagrange Multiplier (LM) is important prior to moving forward with model estimation. Decisions between SEM and SLM (Spatial Linear Modeling) must be based on this evaluation. Table 13 shows that every single LM test result is statistically significant. The results from both the Wald and LR tests indicate that the null hypothesis, which states that SDM can be reduced to SLM or SEM, is still not challenged. For this reason, we will be conducting our spatial regression analysis using the SDM model.
Table 13.
Spatial model comparison tests.
6.2.3. Space Spillovers and Decomposition
This study investigates the relationship between NQP and CEG across neighboring provinces. As shown in Table 14, the results of column (1) present the baseline regression indicating a significantly negative coefficient for NQP’s impact on CEG. An analysis of columns (2) shows that a province’s NQP positively influences the CEG of adjacent provinces, enhancing the carbon emission performance of those neighboring provinces. This indicates a spatial interconnectedness in the overall network of carbon emission performance, which exhibits significant local clustering [71]. To further understand this phenomenon, the spatial effect is divided into three components: direct, indirect, and total effect, utilizing the spatial regression partial differentiation method. In column (5), population leads to changes in productive and consumptive activities, which significantly affect the spatial relocation of carbon emissions [72]. The spatial autocorrelation coefficient, denoted as rho, was 0.277, which was statistically significant at the 1% level. The findings indicated that the advancement of NQP in the local area has the potential to significantly lower CEG while simultaneously enhancing CEG in the adjacent areas, thereby corroborating the outcomes of earlier analyses. A closer examination of columns (3), (4), and (5) reveals a positive spatial spillover effect of NQP on CEG, lending empirical support to Hypothesis 3. In Column(2), the spatial autocorrelation coefficient of NQP of 0.695 is significant at the 1% level, indicating the presence of spatial autocorrelation in the development of NQP. From the analysis of columns (3)–(5), the total effect of NQP on CEG was −0.135, at the significant level of 10%, which means that for every 1 unit increase in NQP level, CEG decreases by 0.138 units. The direct effect of NQP on CEG was −0.508, while the indirect effect of NQP on CEG was 0.373. The direct and indirect effects were in opposite directions, indicating that the development of NQP may be that carbon leaked to the surrounding areas through supply chains, industrial chains, and other channels, leading to an increase in carbon emissions in neighboring provinces. The fact that FIN significantly reduces CO2 emissions in the area proves that green finance has a domino effect [73]. IND also has a significant inhibitory effect on local CO2 emissions. At the 1% significance level, FEE and FIN exhibit a spatial spillover total effect in the controlled variables. To summarize, the NQP in a specific region not only influences its own carbon emission behaviors but may also have spillover effects on the carbon emissions of neighboring or other regions through interconnected economic activities. Economic linkages between regions, through population movements, fiscal expenditures, investments, and other activities, often result in the transfer of carbon emissions. When a region implements policies to boost its NQP, it can create a demonstrative effect on surrounding areas. These neighboring regions might emulate such policies, leading to a broader regional impact.
Table 14.
Spatial spillover effects.
7. Conclusions and Policy Implications
This study evaluates the level of NQP utilizing panel data from 30 Chinese provinces between 2012 and 2022, exploring the mechanism and spillover effect of NQP on carbon emission performance. The conclusions are as follows: (1) NQP significantly decreases the carbon emissions per unit of GDP and improves carbon emission performance which remains valid after the robustness test applying the instrumental variable method. (2) The NQP has made a significant contribution to enhancing carbon emission performance by fostering advancements in green innovation. (3) The influence of NQP extends beyond the local region, positively affecting the carbon emission performance levels of adjacent provinces through a spatial spillover effect. (4) The eastern, non-resource-based, and innovative regions experience a greater impact from the NQP in terms of carbon emission performance.
Drawing from the theoretical analyses and empirical findings presented, we propose the following policy measures:
At first, to drive the advancement of NQP. When it comes to labor, people are the most active and significant contributor to productivity. Talent is the most critical and core element of innovation, and it is the leading force of scientific and technological innovation. The NQP puts forward higher requirements for the knowledge and skills of workers. The talent working mechanism and talent training model need to be optimized for the development of NQP. Improving NQP is also inseparable from the subject of labor, which is the foundation of NQP. The scope and fields of labor subjects already have been greatly expanded, such as digital and intelligent facilities, new materials, and new energy, driven by scientific and technological innovation. Carbon emission reduction should actively embrace and use new labor subjects to improve performance. In terms of labor tools, they are the source of power for NQP. Carbon reduction relies on new, smarter, more efficient, lower-carbon, and safer production tools that weaken the constraints of natural conditions on production activities. Therefore, improving NQP should be a top priority when developing carbon emission policies. Government regulatory agencies should create an institutional framework that is harmonious with NQP, fully leveraging the system’s functions of guarantee and restraint. To encourage businesses to invest more in environmental protection, increase resource efficiency, and lessen environmental pollution and damage, government agencies must implement more stringent environmental laws and regulations. Moreover, society as a whole should strive towards constructing a new energy system. This system should gradually establish an energy supply structure where new energy serves as the primary source, supplemented by coal and other fossil fuels. Meanwhile, the energy consumption structure of traditional industries should undergo iterative upgrades.
Secondly, to better adopt the innovation and application of green technology and improve the incentives of green systems. To further enhance the advancement and implementation of environmentally friendly technology, it is crucial to bolster the innovation and implementation of green technology. This entails not only developing cutting-edge solutions but also improving the incentives and support systems for the adoption of green systems. Promoting sustainable practices is essential in creating a greener future. By raising awareness and providing incentives, we may encourage people and businesses to act in environmentally friendly ways and help the reduction in carbon emissions. The government should foster a more flexible and inclusive environment for innovation policies and support enterprises in implementing technological, managerial, and business model innovations. The government should establish special funds to support environmental technology innovation, boost funding for green technology research and development, and encourage the commercialization of technological advancements that are efficient, clean, and low-carbon. Firms should also boost funding for scientific research, promote technological advancement and innovation, and encourage the study, creation, and use of novel materials and technologies.
Thirdly, to strengthen cross-regional policy coordination to promote the overall carbon emission reduction in different regions. It is imperative to foster effective cross-regional policy coordination. By promoting collaboration and synchronization among different regions, we can collectively work towards achieving a significant cut in carbon emissions on a larger scale. This approach will ensure a thorough and holistic approach to solving the world-wide problem of climate change. Collaborating with international organizations will enable us to leverage their expertise and resources in combating climate change. By establishing partnerships, we can promote knowledge sharing and facilitate the transfer of green technology, allowing us to accelerate progress in combating environmental challenges globally. At the same time, local governments should create unique industrial policies. Firms in the central and western regions should spend more on green technology and environmental protection equipment in addition to promoting the conversion and modernization of the industrial structure in a low-carbon and green direction. There should be more industrial collaboration between the eastern region and the central and western regions to jointly reduce the intensity of carbon emissions and advance NQP.
Author Contributions
Conceptualization, S.W.; methodology, S.W.; software, S.W.; formal analysis, F.C. and S.W.; funding acquisition, F.C.; data curation, F.C.; formal analysis, F.C.; writing—original draft preparation, F.C.; writing—review and editing, S.W.; supervision, S.W. All authors have read and agreed to the published version of the manuscript.
Funding
This research was funded by the Humanities and Social Sciences of the Ministry of Education of China, grant number 23YJA790079, and the National Social Science Foundation of China, grant numbers 22BJY076 and 22BJY111.
Institutional Review Board Statement
Not applicable.
Informed Consent Statement
Not applicable.
Data Availability Statement
The majority of the data utilized in this study was sourced from the China Statistical Yearbook (https://www.stats.gov.cn/sj/ndsj, accessed on 7 March 2024). The patent data came from China National Intellectual Property Administration (https://www.cnipa.gov.cn/col/col61/index.html, accessed on 7 March 2024). The data regarding NQP came from Beijing Gildata Resset Data Tech Co., Ltd. (RESSET) (https://www.resset.com/, accessed on 15 March 2024).
Conflicts of Interest
The authors declare no conflicts of interest.
References
- Abbas, S.; Saqib, N.; Mohammed, K.S.; Sahore, N.; Shahzad, U. Pathways towards carbon neutrality in low carbon cities: The role of green patents, R&D and energy use for carbon emissions. Technol. Forecast. Soc. Chang. 2024, 200, 123109. [Google Scholar] [CrossRef]
- Zhang, Y.; Li, L.; Sadiq, M.; Chien, F. The impact of non-renewable energy production and energy usage on carbon emissions: Evidence from China. Energy Environ. 2024, 35, 2248–2269. [Google Scholar] [CrossRef]
- Sethi, L.; Behera, B.; Sethi, N. Do green finance, green technology innovation, and institutional quality help achieve environmental sustainability? Evidence from the developing economies. Sustain. Dev. 2024, 32, 2709–2723. [Google Scholar] [CrossRef]
- Adebayo, T.S.; Ullah, S.; Kartal, M.T.; Ali, K.; Pata, U.K.; Aga, M. Endorsing sustainable development in BRICS: The role of technological innovation, renewable energy consumption, and natural resources in limiting carbon emission. Sci. Total Environ. 2023, 859, 160181. [Google Scholar] [CrossRef] [PubMed]
- Hepburn, C.; Qi, Y.; Stern, N.; Ward, B.; Xie, C.; Zenghelis, D. Towards carbon neutrality and China’s 14th Five-Year Plan: Clean energy transition, sustainable urban development, and investment priorities. Environ. Sci. Ecotechnol. 2021, 8, 100130. [Google Scholar] [CrossRef]
- Chen, X.H.; Tee, K.; Elnahass, M.; Ahmed, R. Assessing the environmental impacts of renewable energy sources: A case study on air pollution and carbon emissions in China. J. Environ. Manag. 2023, 345, 118525. [Google Scholar] [CrossRef]
- Liu, H.; Han, P.; Wang, D.; Wang, S.; Bao, H. Decoding enterprise digital transformation: External oversight and carbon emission reduction performance. J. Environ. Manag. 2024, 359, 121039. [Google Scholar] [CrossRef]
- Yang, Y.; Zhang, J.; Huang, J.; Zhao, Y.; Zhao, Q. Urban density and spatial carbon emission performance of megacities in China. Sci. Rep. 2024, 14, 23862. [Google Scholar] [CrossRef] [PubMed]
- Shi, W.; Sang, J.; Zhou, J.; Ding, X.; Li, Z. Can carbon emission trading improve carbon emission performance? Evidence from a quasi-natural experiment in China. Environ. Sci. Pollut. Res. 2023, 30, 124028–124040. [Google Scholar] [CrossRef]
- Li, H.; Du, G.; Qamri, G.M.; Li, S. Green innovation and natural resource efficiency: The role of environmental regulations and resource endowment in Chinese cities. J. Environ. Manag. 2024, 370, 122338. [Google Scholar] [CrossRef]
- Zhang, G.; Wang, Y.; Zhang, Z.; Su, B. Can green finance policy promote green innovation in cities? Evidence from pilot zones for green finance reform and innovation in China. J. Environ. Manag. 2024, 370, 122816. [Google Scholar] [CrossRef]
- Zhang, W.; Zhao, Y.; Meng, F. ESG performance and green innovation of Chinese enterprises: Based on the perspective of financing constraints. J. Environ. Manag. 2024, 370, 122955. [Google Scholar] [CrossRef] [PubMed]
- Cui, H.; Cao, Y. Low-carbon city construction, spatial spillovers and greenhouse gas emission performance: Evidence from Chinese cities. J. Environ. Manag. 2024, 355, 120405. [Google Scholar] [CrossRef] [PubMed]
- Shao, H.; Cheng, J.; Wang, Y.; Li, X. Can Digital Finance Promote Comprehensive Carbon Emission Performance? Evidence from Chinese Cities. Int. J. Environ. Res. Public Health 2022, 19, 10255. [Google Scholar] [CrossRef] [PubMed]
- Gao, J.; Hua, G.; Mahamane, F.; Li, Z. Can green transformation finance contribute to urban carbon emission performance? An empirical analysis based on a spatiotemporal bi-fixed SPDM model. Environ. Sci. Pollut. Res. 2023, 30, 102947–102971. [Google Scholar] [CrossRef]
- Ma, R.; Zhang, Z.J.; Lin, B. Evaluating the synergistic effect of digitalization and industrialization on total factor carbon emission performance. J. Environ. Manag. 2023, 348, 119281. [Google Scholar] [CrossRef]
- Liu, X.M.; Zhang, Y.Q. Digital transformation, green innovation, and carbon emission reduction performance of energy-intensive enterprises. Sci. Rep. 2024, 14, 3905. [Google Scholar] [CrossRef]
- Du, M.; Zhou, Q.; Zhang, Y.; Li, F. Towards sustainable development in China: How do green technology innovation and resource misallocation affect carbon emission performance? Front. Psychol. 2022, 13, 929125. [Google Scholar] [CrossRef]
- Handoyo, S.; Yudianto, I.; Dahlan, M. Exploring firm and country’s specific factors affecting carbon emission reduction performance: Study on selected ASEAN countries. Heliyon 2024, 10, e37036. [Google Scholar] [CrossRef]
- Miao, X.; Feng, E.; Siu, Y.L.; Li, S.; Wong, C.W.Y. Can China’s carbon intensity constraint policies improve carbon emission performance? Evidence from regional carbon emissions. J. Environ. Manag. 2023, 348, 119268. [Google Scholar] [CrossRef]
- Gao, S.; Sun, D.; Wang, S. Do development zones increase carbon emission performance of China’s cities? Sci. Total Environ. 2023, 863, 160784. [Google Scholar] [CrossRef] [PubMed]
- Zhao, Z.; Yuan, T.; Shi, X.; Zhao, L. Heterogeneity in the relationship between carbon emission performance and urbanization: Evidence from China. Mitig. Adapt. Strateg. Glob. Chang. 2020, 25, 1363–1380. [Google Scholar] [CrossRef]
- Tu, C.; Zang, C.; Wu, A.; Long, H.; Yu, C.; Liu, Y. Assessing the impact of industrial intelligence on urban carbon emission performance: Evidence from China. Heliyon 2024, 10, e30144. [Google Scholar] [CrossRef]
- Pei, Y.; Zhu, Y.; Wang, N. How do corruption and energy efficiency affect the carbon emission performance of China’s industrial sectors? Environ. Sci. Pollut. Res. 2021, 28, 31403–31420. [Google Scholar] [CrossRef]
- Li, J.; Noorliza, K.; Zhang, X. Enhancing Environmental, Social, and Governance Performance through New Quality Productivity and Green Innovation. Sustainability 2024, 16, 4843. [Google Scholar] [CrossRef]
- Zou, F.; Hu, Y.; Liu, F. Research on Regional Carbon Emission Policy and Breakthrough Green Technology Innovation Pathways: Based on the Perspective of New Quality Productivity. Glob. Nest J. 2024, 26, 06248. [Google Scholar]
- Huang, Q.; Guo, W.; Wang, Y. A Study of the Impact of New Quality Productive Forces on Agricultural Modernization: Empirical Evidence from China. Agriculture 2024, 14, 1935. [Google Scholar] [CrossRef]
- Lin, L.; Gu, T.; Shi, Y. The Influence of New Quality Productive Forces on High-Quality Agricultural Development in China: Mechanisms and Empirical Testing. Agriculture 2024, 14, 1022. [Google Scholar] [CrossRef]
- Wang, J.; Qiao, L.; Zhu, G.; Di, K.; Zhang, X. Research on the driving factors and impact mechanisms of green new quality productive forces in high-tech retail enterprises under China’s Dual Carbon Goals. J. Retail. Consum. Serv. 2025, 82, 104092. [Google Scholar] [CrossRef]
- Xu, S.; Wang, J.; Peng, Z. Study on the Promotional Effect and Mechanism of New Quality Productive Forces on Green Development. Sustainability 2024, 16, 8818. [Google Scholar] [CrossRef]
- Ale, S.B.; Brown, J.S.; Sullivan, A.T. Evolution of cooperation: Combining kin selection and reciprocal altruism into matrix games with social dilemmas. PLoS ONE 2013, 8, e63761. [Google Scholar] [CrossRef]
- Fang, C.; Sun, B. The connotation of new quality productive forces and research priorities for driving urban-rural integrated development from the geographical perspective. Acta Geogr. Sin. 2024, 79, 1357–1370. [Google Scholar]
- He, Z. New Quality Productivity: Conceptual Essence, Main Directions and Key Institutions. Sci. Focus 2024, 19, 8–13. [Google Scholar]
- Yue, S.; Bajuri, N.H.; Khatib, S.F.A.; Lee, Y. New quality productivity and environmental innovation: The hostile moderating roles of managerial empowerment and board centralization. J. Environ. Manag. 2024, 370, 122423. [Google Scholar] [CrossRef] [PubMed]
- Gu, H. Empirical Study on the Impact of New-Quality Productivity on Regional Economic Development in China. J. Econ. Public Financ. 2024, 10, 198. [Google Scholar] [CrossRef]
- Han, L.; Mao, H.; Kumi, F.; Hu, J. Development of a Multi-Task Robotic Transplanting Workcell for Greenhouse Seedlings. Appl. Eng. Agric. 2018, 34, 335–342. [Google Scholar] [CrossRef]
- Ma, R.; Abid, N.; Yang, S.; Ahmad, F. From crisis to resilience: Strengthening climate action in OECD countries through environmental policy and energy transition. Environ. Sci. Pollut. Res. 2023, 30, 115480–115495. [Google Scholar] [CrossRef]
- Naik, B.G.; Ganasen, N.; Roy, D. Recycling glass waste into concrete aggregates: Enhancing mechanical properties and sustainability. Asian J. Civ. Eng. 2024, 26, 1–19. [Google Scholar] [CrossRef]
- Zhu, X.; Chikangaise, P.; Shi, W.; Chen, W.-H.; Yuan, S. Review of intelligent sprinkler irrigation technologies for remote autonomous system. Int. J. Agric. Biol. Eng. 2023, 11, 23–30. [Google Scholar]
- Zhang, L. Understanding the new quality productive forces in the energy sector. Energy Nexus 2024, 16, 100352. [Google Scholar] [CrossRef]
- Tang, L.J.; Wang, D.Y. Optimization of County-Level Land Resource Allocation through the Improvement of Allocation Efficiency from the Perspective of Sustainable Development. Int. J. Environ. Res. Public Health 2018, 15, 2638. [Google Scholar] [CrossRef] [PubMed]
- Pokorski, P.; He, R. Advancing protein hydrolysis and phytosterol encapsulation: Emerging trends and innovations in protein-based microencapsulation techniques—A comprehensive review. Food Res. Int. 2024, 196, 115012. [Google Scholar] [CrossRef] [PubMed]
- Tao, A.; Wang, C.; Zhang, S.; Kuai, P. Does enterprise digital transformation contribute to green innovation? Micro-level evidence from China. J. Environ. Manag. 2024, 370, 122609. [Google Scholar] [CrossRef]
- Du, Q.; Deng, Y.; Zhou, J.; Wu, J.; Pang, Q. Spatial spillover effect of carbon emission efficiency in the construction industry of China. Environ. Sci. Pollut. Res. 2022, 29, 2466–2479. [Google Scholar] [CrossRef] [PubMed]
- Quan, Y.; Duan, M. Emission reductions, industrial competitiveness, and spillover effects under China’s regional emission trading systems: Evidence from the iron and steel sector. J. Environ. Manag. 2023, 344, 118481. [Google Scholar] [CrossRef] [PubMed]
- Caniani, D.; Caivano, M.; Pascale, R.; Bianco, G.; Mancini, I.M.; Masi, S.; Mazzone, G.; Firouzian, M.; Rosso, D. CO2 and N2 O from water resource recovery facilities: Evaluation of emissions from biological treatment, settling, disinfection, and receiving water body. Sci. Total Environ. 2019, 648, 1130–1140. [Google Scholar] [CrossRef] [PubMed]
- Wang, J.M.; Jeong, C.H.; Hilker, N.; Shairsingh, K.K.; Healy, R.M.; Sofowote, U.; Debosz, J.; Su, Y.; McGaughey, M.; Doerksen, G.; et al. Near-Road Air Pollutant Measurements: Accounting for Inter-Site Variability Using Emission Factors. Environ. Sci. Technol. 2018, 52, 9495–9504. [Google Scholar] [CrossRef]
- Aamir, M.; Ur Rehman, J. Dynamic nexus among fossil fuels utilization, economic growth, and urbanization: A tri-regional selected countries analysis. Environ. Sci. Pollut. Res. 2024, 31, 43381–43395. [Google Scholar] [CrossRef] [PubMed]
- Zhou, Z.; Liu, C.; Zeng, X.; Jiang, Y.; Liu, W. Carbon emission performance evaluation and allocation in Chinese cities. J. Clean. Prod. 2018, 172, 1254–1272. [Google Scholar] [CrossRef]
- Tang, X.; Liu, S.; Wang, Y.; Wan, Y. Study on carbon emission reduction countermeasures based on carbon emission influencing factors and trends. Environ. Sci. Pollut. Res. 2024, 31, 14003–14022. [Google Scholar] [CrossRef]
- Shao, C.; Dong, H.; Gao, Y. New Quality Productivity and Industrial Structure in China: The Moderating Effect of Environmental Regulation. Sustainability 2024, 16, 6796. [Google Scholar] [CrossRef]
- Zhang, J.; Shan, Y.; Jiang, S.; Xin, B.; Miao, Y.; Zhang, Y. Study on the coordinated development degree of new quality productivity and manufacturing carbon emission efficiency in provincial regions of China. Environ. Dev. Sustain. 2024, 1–35. [Google Scholar] [CrossRef]
- Han, W.; Zhang, R.; Zhao, F. The Measurement of New Quality Productivity and New Driving Force of the Chinese Economy. Quant. Tech. Econ. 2024, 41, 5–25. [Google Scholar]
- Moshiri, S.; Daneshmand, A. How effective is government spending on environmental protection in a developing country? J. Econ. Stud. 2020, 47, 789–803. [Google Scholar] [CrossRef]
- Chen, G.; Sheng, L.Q. Fiscal spending and green economic growth: Evidence from highly polluting Asian economic. Environ. Sci. Pollut. Res. 2024, 31, 834–844. [Google Scholar] [CrossRef]
- Yu, S.; Hu, X.; Fan, J.-L.; Cheng, J. Convergence of carbon emissions intensity across Chinese industrial sectors. J. Clean. Prod. 2018, 194, 179–192. [Google Scholar] [CrossRef]
- Resitoglu, I.A.; Altinisik, K.; Keskin, A. The pollutant emissions from diesel-engine vehicles and exhaust aftertreatment systems. Clean Technol. Environ. Policy 2015, 17, 15–27. [Google Scholar] [CrossRef]
- He, Q.; Jiang, H. Digital Inclusive Finance, Digital Technology Innovation, and Carbon Emission Intensity. Sustainability 2024, 16, 6407. [Google Scholar] [CrossRef]
- Chen, J.; Yu, Z.; Li, M.; Huang, X. Assessing the Spatiotemporal Dynamics of Vegetation Coverage in Urban Built-Up Areas. Land 2023, 12, 235. [Google Scholar] [CrossRef]
- Guan, W.F.; Guo, W.Z.; Chen, F.; Han, X.B.; Wang, H.G.; Sun, W.T.; Zhao, Q.; Jia, D.D.; Wei, X.M.; Zhu, Q.Z. Multi-Span Greenhouse Energy Saving by External Insulation: System Design and Implementation. Agriculture 2024, 14, 281. [Google Scholar] [CrossRef]
- Wu, L.; Jia, X.Y.; Gao, L.; Zhou, Y.Q. Effects of population flow on regional carbon emissions: Evidence from China. Environ. Sci. Pollut. Res. 2021, 28, 62628–62639. [Google Scholar] [CrossRef]
- Van Hoang, T.H.; Przychodzen, W.; Przychodzen, J.; Segbotangni, E.A. Does it pay to be green? A disaggregated analysis of U.S. firms with green patents. Bus. Strategy Environ. 2020, 29, 1331–1361. [Google Scholar] [CrossRef]
- Zhang, Z.; Liu, K.; Chong, D.; Niu, D.; Lin, P.; Liu, X.; Niu, Y.; Jing, R. Evaluation of photocatalytic micro-surfacing mixture: Road performance, vehicle exhaust gas degradation capacity and environmental impacts. Constr. Build. Mater. 2022, 345, 128367. [Google Scholar] [CrossRef]
- Xu, S.; Liu, Y. Research on the impact of carbon finance on the green transformation of China’s marine industry. J. Clean. Prod. 2023, 418, 138143. [Google Scholar] [CrossRef]
- Zhang, L.; Yan, Y.; Xu, W.; Sun, J.; Zhang, Y. Carbon emission calculation and influencing factor analysis based on industrial big data in the “double carbon” era. Comput. Intell. Neurosci. 2022, 2022, 2815940. [Google Scholar] [CrossRef]
- Zhu, Q.; Peng, X. The impacts of population change on carbon emissions in China during 1978–2008. Environ. Impact Assess. Rev. 2012, 36, 1–8. [Google Scholar] [CrossRef]
- Blom-Hansen, J.; Houlberg, K.; Serritzlew, S.; Treisman, D. Jurisdiction Size and Local Government Policy Expenditure: Assessing the Effect of Municipal Amalgamation. Am. Political Sci. Rev. 2016, 110, 812–831. [Google Scholar] [CrossRef]
- Sun, H.; Samad, S.; Rehman, S.U.; Usman, M. Clean and green: The relevance of hotels’ website quality and environmental management initiatives for green customer loyalty. Br. Food J. 2022, 124, 4266–4285. [Google Scholar] [CrossRef]
- Xu, N.; Qiao, Y.; Zhao, S.; Yang, X.; Li, J.; Fok, M. Optimizing the test locations and replicates in multi-environmental cotton registration trials in southern Xinjiang, China. Crop Sci. 2022, 63, 1866–1879. [Google Scholar] [CrossRef]
- Arshad, A.; Gulzar, O.; Shahid, O.B.; Nawaz, F. Exploring the mediating role of financial inclusion in the relationship between economic policy uncertainty and CO2 emissions: A global perspective. Environ. Sci. Pollut. Res. 2024, 31, 46965–46978. [Google Scholar] [CrossRef]
- Zhang, X.; Zhou, J.; Wu, R.; Wang, S. Spatial network analysis and driving forces of urban carbon emission performance: Insights from Guangdong Province. Sci. Total Environ. 2024, 951, 175538. [Google Scholar] [CrossRef]
- Gao, C.; Tao, S.; He, Y.; Su, B.; Sun, M.; Mensah, I.A. Effect of population migration on spatial carbon emission transfers in China. Energy Policy 2021, 156, 112450. [Google Scholar] [CrossRef]
- Sun, J.; Zhai, N.; Miao, J.; Sun, H. Can Green Finance Effectively Promote the Carbon Emission Reduction in “Local-Neighborhood” Areas—Empirical Evidence from China. Agriculture 2022, 12, 1550. [Google Scholar] [CrossRef]

Disclaimer/Publisher’s Note: The statements, opinions and data contained in all publications are solely those of the individual author(s) and contributor(s) and not of MDPI and/or the editor(s). MDPI and/or the editor(s) disclaim responsibility for any injury to people or property resulting from any ideas, methods, instructions or products referred to in the content. |
© 2025 by the authors. Licensee MDPI, Basel, Switzerland. This article is an open access article distributed under the terms and conditions of the Creative Commons Attribution (CC BY) license (https://creativecommons.org/licenses/by/4.0/).