Article

Stability Analysis of Surrounding Rock in Mining Tunnels Based on Microseismic Monitoring and Numerical Simulation

School of Resources, Environment and Safety Engineering, Hunan University of Science and Technology, Xiangtan 411201, China
*
Author to whom correspondence should be addressed.
Sustainability 2025, 17(2), 630; https://doi.org/10.3390/su17020630
Submission received: 13 December 2024 / Revised: 4 January 2025 / Accepted: 13 January 2025 / Published: 15 January 2025

Abstract

:
In response to the safety hazards and environmental impacts caused by the decrease in the stability of the surrounding rock of the roadway and the frequent occurrence of microseismic activities during coal mining, the 4331 fully mechanized mining face of Nanpingdong Coal Mine was selected as a case study. Microseismic monitoring technology was used to analyze the spatial distribution of microseismic events in the surrounding rock during mining, and by establishing a FLAC3D numerical model, the displacement of surrounding rock and the evolution law of plastic zone during mining process are studied. The results confirmed that elastic strain energy in the rock is the primary source of microseismic energy. Using FISH language, a distribution cloud map of elastic strain energy was generated and compared with the microseismic event distribution and energy results. The findings indicate that as mining advances, the frequency and energy of microseismic events increase, particularly near faults, with roadway roof rupture exacerbating the events. The distribution of microseismic events correlates strongly with the depth of mining face advancement, highlighting the significant impact of mining activities on surrounding rock stability. The numerical simulation results closely align with on-site microseismic monitoring data, validating the simulation’s accuracy. This study proposes a method for dynamic monitoring and control of roadway surrounding rock stability through real-time microseismic monitoring and numerical simulation, aiming to mitigate surface environmental damage from underground mining.

1. Introduction

With the rapid development of mining in China, the stability of the surrounding rock in tunnels during coal mining has become an increasingly critical issue. It has emerged as a significant factor influencing both the safety of mining operations and the economic efficiency of mines [1]. Traditional methods for analyzing the stability of surrounding rock mainly rely on rock mechanics theory and field observation techniques. Although these methods provide an initial theoretical framework for studying surrounding rock stability, they often have limitations, such as limited observation points, insufficient timeliness of monitoring, and inadequate spatial coverage [2,3]. These limitations often result in evaluation outcomes that do not fully reflect the actual dynamic changes in the mine, thus affecting the safety assessment and design decisions in coal mining projects [4,5]. In recent years, to overcome the shortcomings of traditional methods, microseismic monitoring technology has gradually been introduced into coal mining engineering and has become an important tool for evaluating the stability of surrounding rock [6]. Microseismic monitoring technology offers real-time, continuous monitoring capabilities, allowing it to effectively capture the small deformations and fracture processes of rock masses during mining, thus serving as a valuable tool for geological disaster early warning [7]. However, despite its growing application in surrounding rock stability studies, there are still gaps in research regarding its role in mine safety monitoring, especially in the spatial distribution patterns of microseismic events and the quantitative analysis of energy accumulation effects [8]. Most studies have focused on spectral analysis and amplitude variation of microseismic signals, often overlooking the dynamic relationship with the mining process and its long-term environmental impacts [9].
In contrast, numerical simulation techniques, as an important tool for analyzing surrounding rock stability, have made significant advances in recent years [10,11]. Through numerical methods such as FLAC3D, researchers can conduct detailed analyses of surrounding rock displacement, plastic zone evolution, and other factors during mining, providing theoretical support for coal mine design and safety management [12,13]. Representative studies include those by Song Xiefang [14], who used the SOS microseismic monitoring system to analyze the characteristics of roof rupture, providing effective methods for dynamic hazard evaluation and prediction of the roof; Jiang Fuxing [15,16], who used microseismic monitoring to establish the overlying rock structure of mining areas and analyze its relationship with stress fields; Zheng Chao [17], who proposed a dynamic calibration method for rock mass strength parameters; Xu Nuwen [18], who combined microseismic monitoring and RFPA numerical simulation to analyze the stability of slope rock masses in hydropower stations, though this research is still in its preliminary stages; Yang Yu [19] and others who studied the impact of dynamic loading on tunnel surrounding rock deformation and microseismic response; Li Zhuang [20] and others who combined convergence monitoring and numerical simulations to analyze surrounding rock crack evolution and large deformation characteristics, revealing the fracture and damage zone evolution mechanism in soft rock under high ground stress and strong unloading effects; and Yuan Guotao [21] and others, who constructed a microseismic simulation method based on matrix tensors and particle flow theory, achieving simulation of microseismic evolution characteristics of overlying rock in the mining face. A. Li [22,23] and others combined continuum medium simulations and microseismic monitoring data to quantitatively predict surrounding rock displacement in underground chambers and analyze the evolution of high-side displacement in steeply inclined chambers. However, most existing numerical simulation studies focus on static analysis, and there is limited research on the integration of simulation results with microseismic monitoring data.
Therefore, this study combines microseismic monitoring and numerical simulation technologies to propose a comprehensive analytical method based on microseismic activity and surrounding rock displacement evolution during the mining process. By comparing microseismic monitoring data and numerical simulation results for the 4331 fully mechanized mining face at Nanping Dong Coal Mine, this study not only reveals the evolution patterns of surrounding rock stability during mining but also explores the spatial characteristics of energy accumulation in microseismic activity and its potential environmental impacts. Notably, in areas where surrounding rock stability significantly deteriorates, both the frequency of microseismic events and energy accumulation show a significant increase. The innovation of this study lies in the combination of real-time microseismic monitoring and FLAC3D numerical simulation, proposing a dynamic monitoring method based on elastic strain energy. This method provides theoretical support and practical guidance for real-time monitoring and regulation of surrounding rock stability in coal mine faces.
The rest of this article is organized as follows. Section 2 provides an overview of the project, including the geological conditions of the mining site. The microseismic monitoring setup and event distribution are described in Section 3. Section 4 presents the numerical simulation methodology, detailing the displacement and plastic zone analysis. A comparison and validation of the simulation and field monitoring results are provided in Section 4. Finally, the study’s conclusions and key findings are summarized in Section 5.

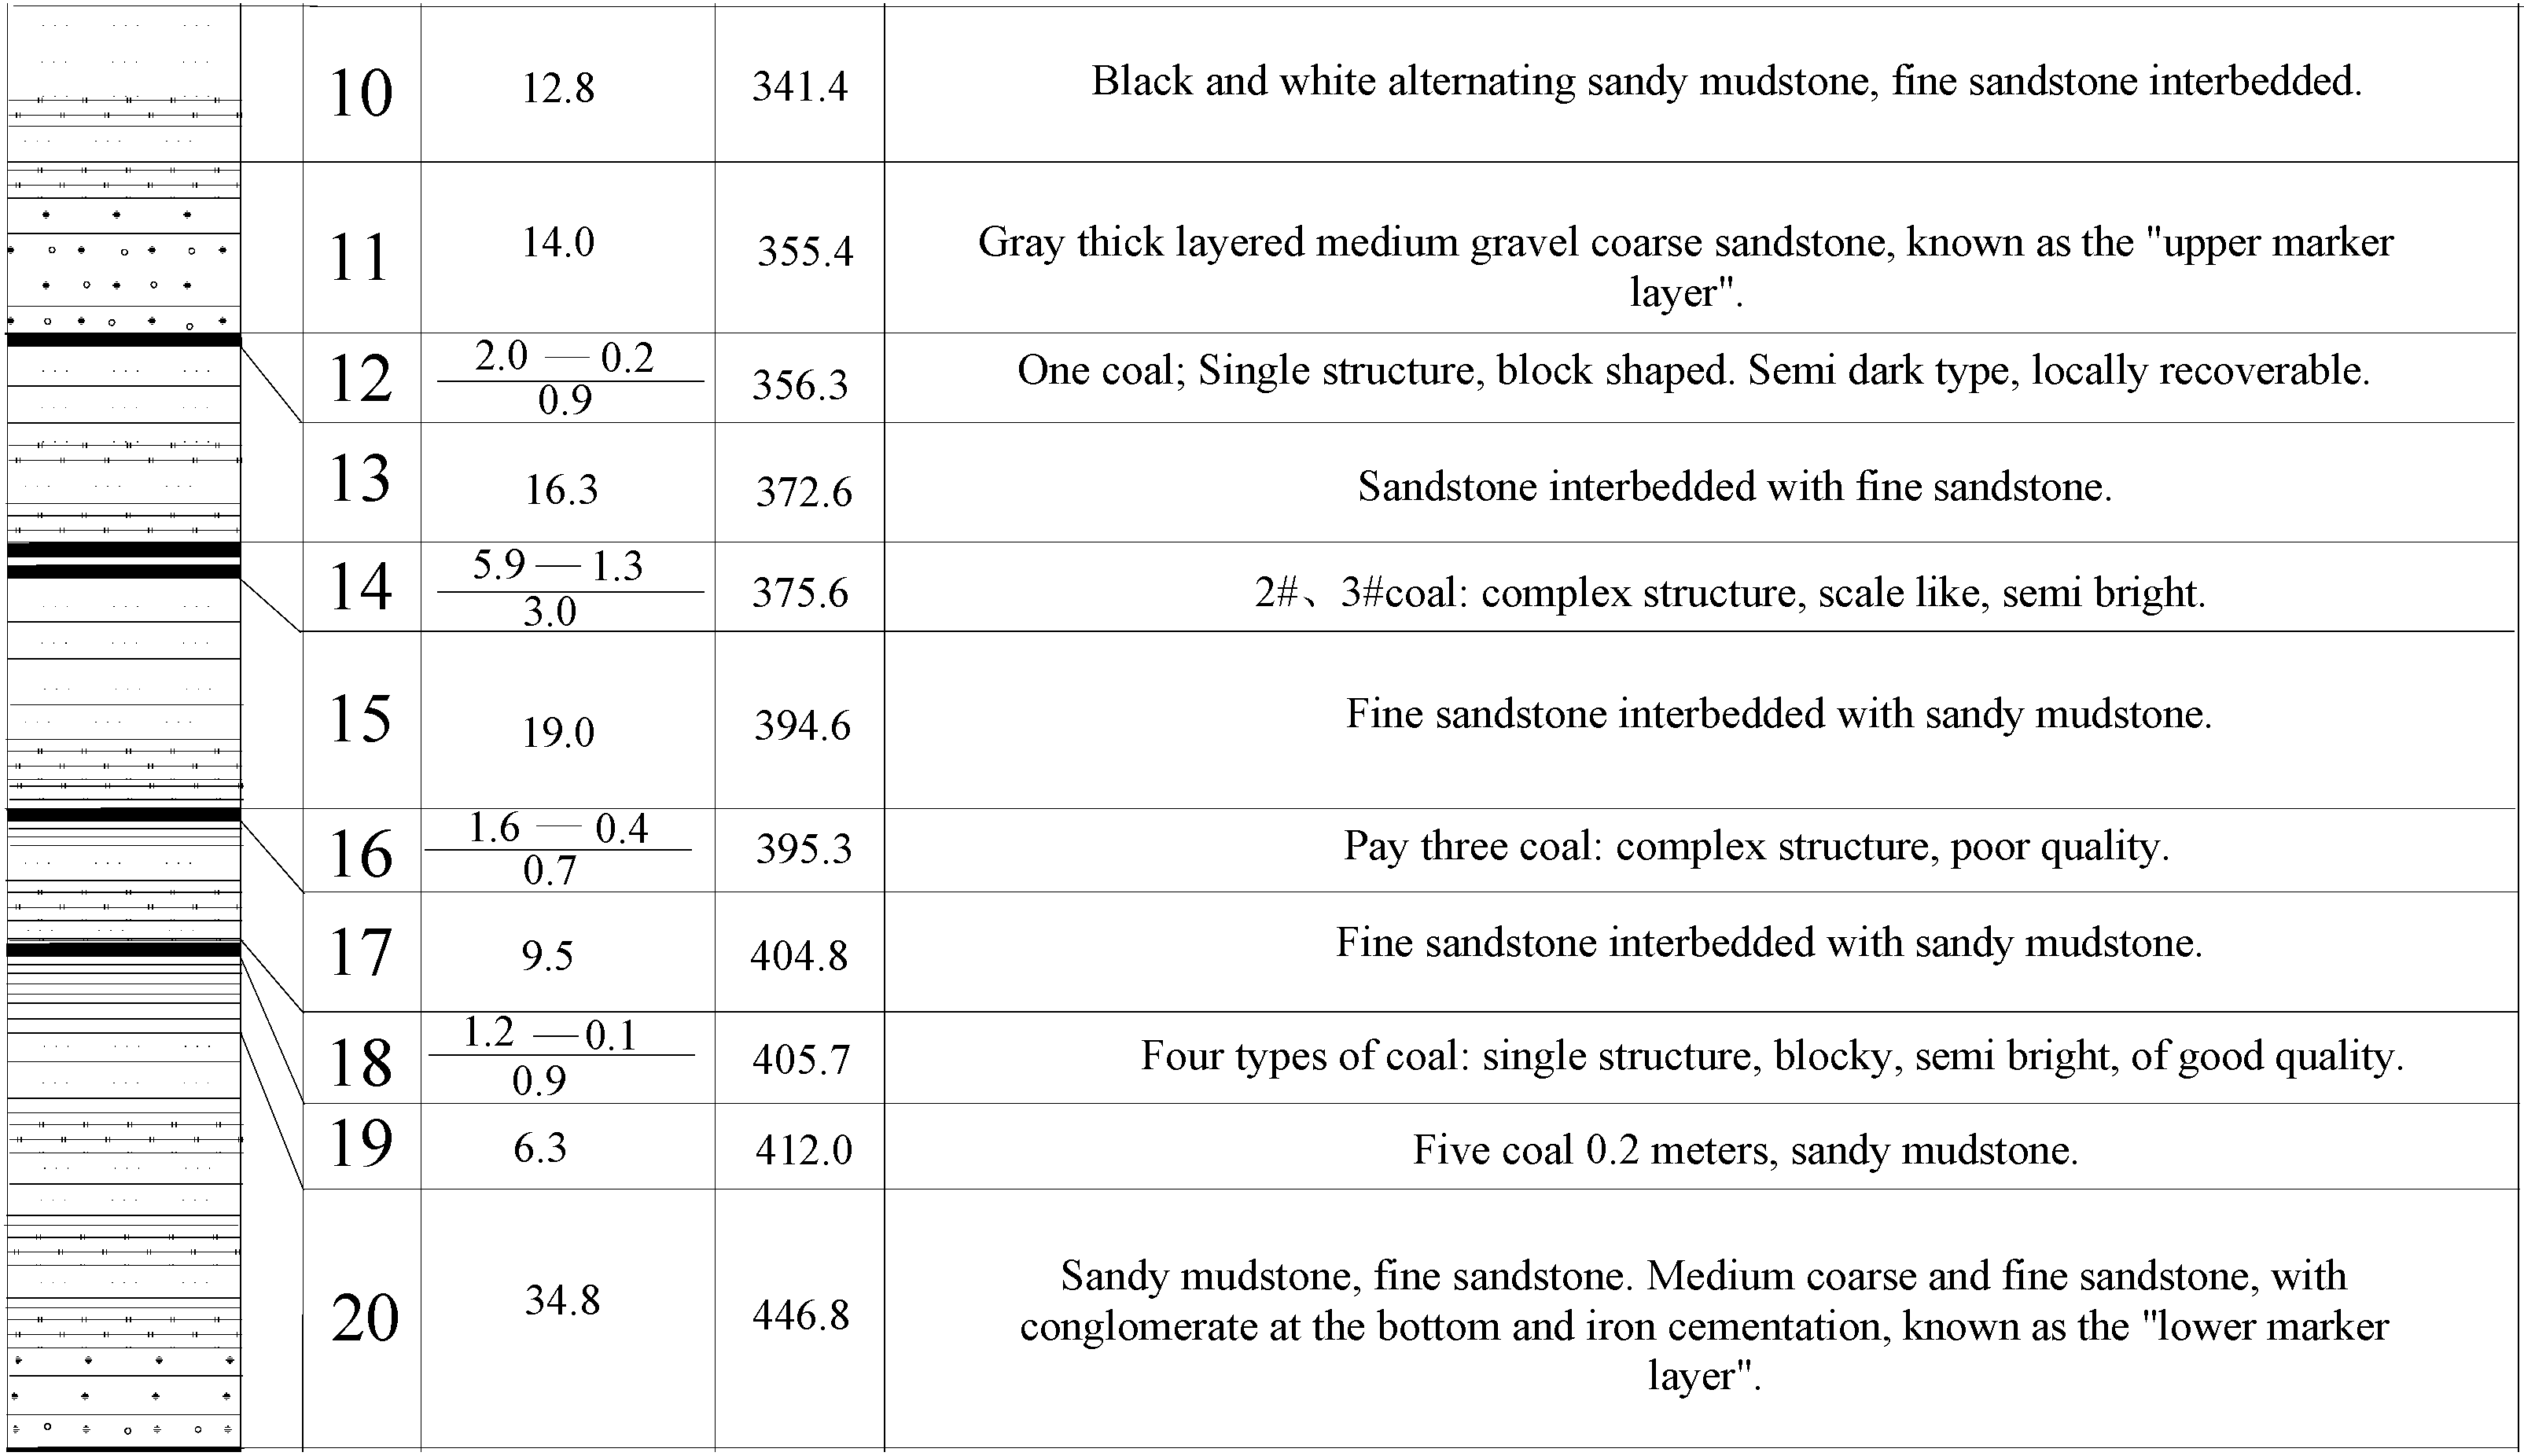
2. Research Background

The 4331 working face is a working face in 433 mining area of Nanpingdong Coal Mine, located in the north wing of the mine field, the specific underground location is to 33,313 running road in the east, 45 mining area boundary fault in the south, 4333 unmined area in the west, and 43 track downhill in the north. The ground level ranges from +250 to +323 m, while the working face level ranges from ±0 to −40 m. In terms of geological structure, the structure of 4331 working face has little change, and two faults, F1 and F2, have been revealed. The F1 fault has a drop of 1.5 m, a strike of 39°, a dip of 129°, and a dip of 78°. F2 fault has a drop of 1.2 m, strike 96°, dip 276° and dip 78°, and these two faults have little influence on coal mining in the face. The occurrence of coal seam in this working face shows that the strike length of coal seam is 260 m, the inclination length is 140 m, the thickness of coal seam is between 1.2–2.5 m, the average thickness is 1.85 m, and the inclination of coal seam is between 16°–20°, the average is 18°. The roof of coal seam is sandy mudstone with an average thickness of 16.3 m. The floor is also sandy mudstone with an average thickness of 19 m. The profile of the coal seam roof and floor is shown in Figure 1.
The return airway is excavated along the coal seam according to the waistline and arranged along the direction of the coal seam for ventilation and material transportation in the working face; The transportation roadway is excavated along the centerline and waistline, and arranged along the direction of the coal seam. The cross sections of the transportation roadway and the return airway are both trapezoidal, with a net width of 2.2 m, a net height of 2.3 m, and a net cross section of 5.05 m2. The support method is trapezoidal shed support.

3. Microseismic Characteristics of the Working Face Under the Influence of Quarrying

3.1. Introduction to Monitoring System

The microseismic monitoring and early warning system arranged on site mainly consists of specially designed sensors, acquisition instruments, ring network switches, and data servers. The main technical parameters of microseismic sensors are shown in Table 1.

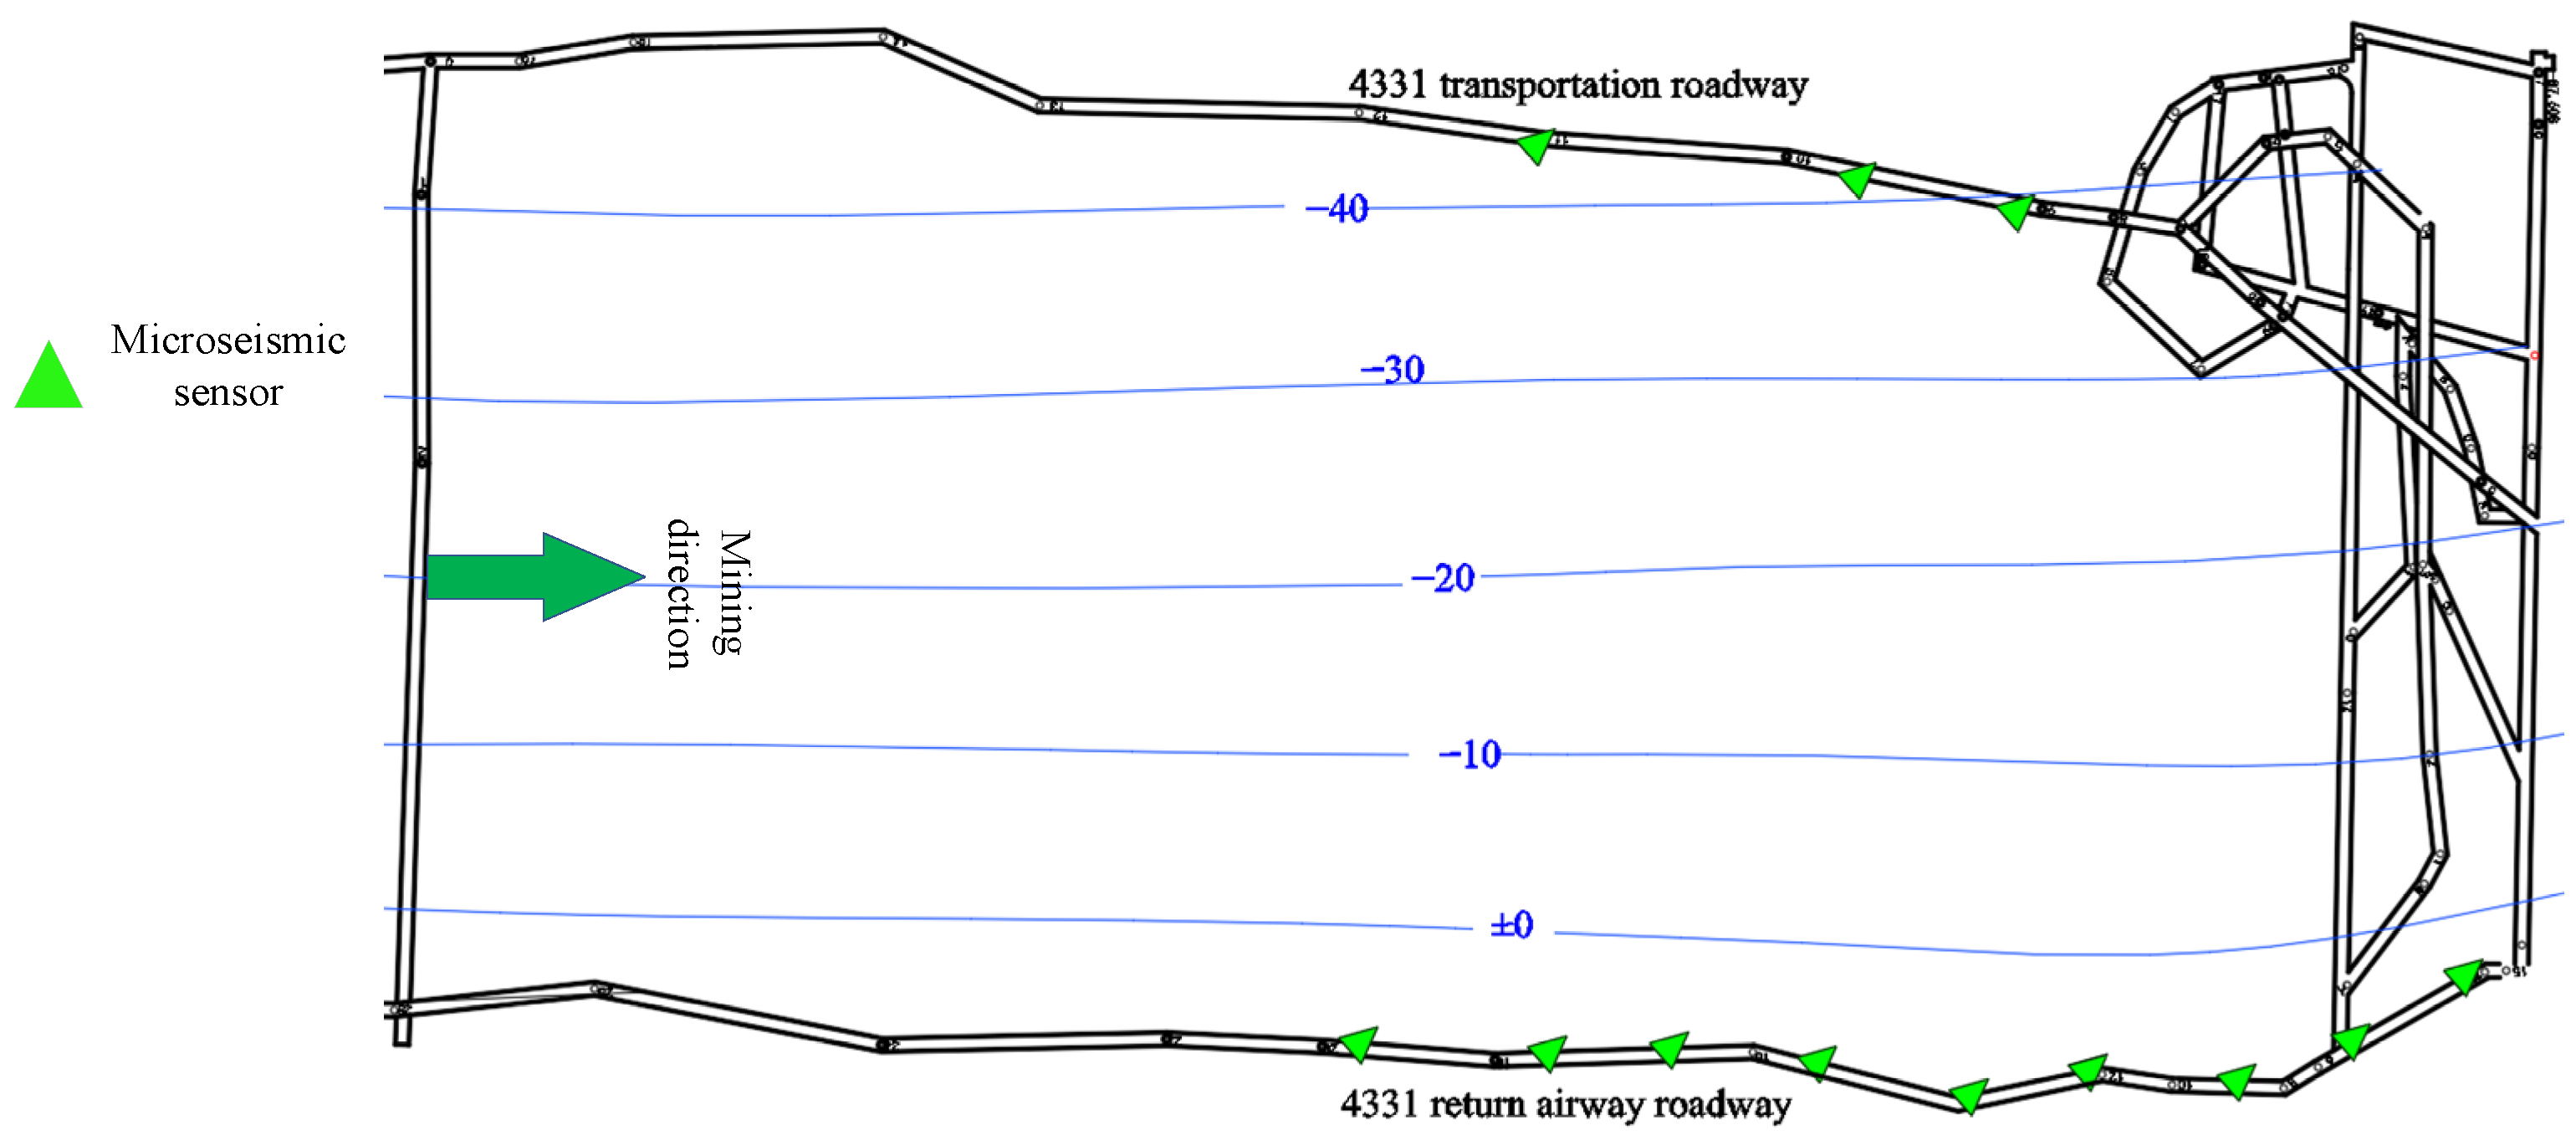
3.2. Layout of Microseismic Monitoring System

The main focus of this study is to install a microseismic monitoring system in the 4331 working face of Nanpingdong Coal Mine. The system includes 12 microseismic receiving sensors. In order to continuously collect, analyze, and process microseismic events, 9 microseismic sensors are installed in the return air roadway and 3 microseismic sensors are installed in the transportation roadway to better collect microseismic signals throughout the entire working face. The layout of microseismic sensors in the working face is shown in Figure 2.

3.3. Evolutionary Pattern of Microseismic Event Distribution During the Extraction Process

Using each compression cycle as a typical interval, the distribution of microseismic events during each monitoring period is marked on the working face plan, as shown in Figure 3, which illustrates the distribution of microseismic events for each cycle. The dark blue dots indicate that the energy released by this microseismic event is less than 104 J, the light blue dots are between 105 J–5 × 10⁵ J, the yellow dots are 5 × 10⁵ J–106 J, and the red dots are above 106 J.
The figure shows a clear positive correlation between the number of microseismic events and the advance depth of the coalface during the monitoring period. As the depth of the advance increases, the frequency of microseismic events also rises. As illustrated in Figure 3a, when the extraction area is relatively small, the energy of microseismic events remains low, with fewer high-energy events observed. During this stage, no microseismic events occur in the goaf, and some are detected ahead of the coalface. This is because the roof collapse in the goaf fills the voids with fragmented rocks, making it difficult to detect microseismic events due to the loosened state of the collapsed strata. The roadway, influenced by the advanced support pressure and being at a lower level in the transportation trough, experiences a concentration of microseismic events, particularly around the sides of the roadway, with the most notable distribution along the transportation roadway.
As the coalface advances further, large-energy events begin to appear near the coalface, as shown in Figure 3b, and the distribution of microseismic events moves closer to the coalface. The roof collapse causes damage to the articulated rock mass in front, and energy accumulated during the mining process is released, leading to these microseismic events. Additionally, there is a fault near the transportation roadway that becomes activated by the mining activities, causing a concentration of microseismic events in this area, many of which are high-energy.
The first and periodic weighting effects are critical to understanding the observed microseismic events. The first weighting, which occurs when the main roof initially breaks, leads to a large release of accumulated stress. This causes a surge in microseismic activity, particularly high-energy events near the coalface and in the immediate vicinity of the main roof. During the periodic weightings that follow, smaller but still significant microseismic events are detected, as the roof undergoes further adjustments and continued fracturing. These periodic weightings are linked to the gradual release of stress in the surrounding rock, with microseismic events occurring in response to the roof’s continued failure and re-stabilization.
Once the extraction area reaches a certain size, as shown in Figure 3c, high-energy events become more prominent, especially in front of the coalface and near the return air trough. Similarly, a significant number of microseismic events occur in the transportation trough, likely due to repeated failure of the surrounding rock with lower strength and the activation of nearby faults. As the collapsed strata in the goaf gradually compact and stress redistributes, new fractures occur in the compacted rock due to the influence of the coalface. The redistribution of stress during both the initial and periodic weightings of the main roof plays a key role in driving these microseismic events, further highlighting the importance of understanding these phases when analyzing microseismic data.

4. Numerical Simulation of the Stability of the Perimeter Rock of the Mining Tunnel

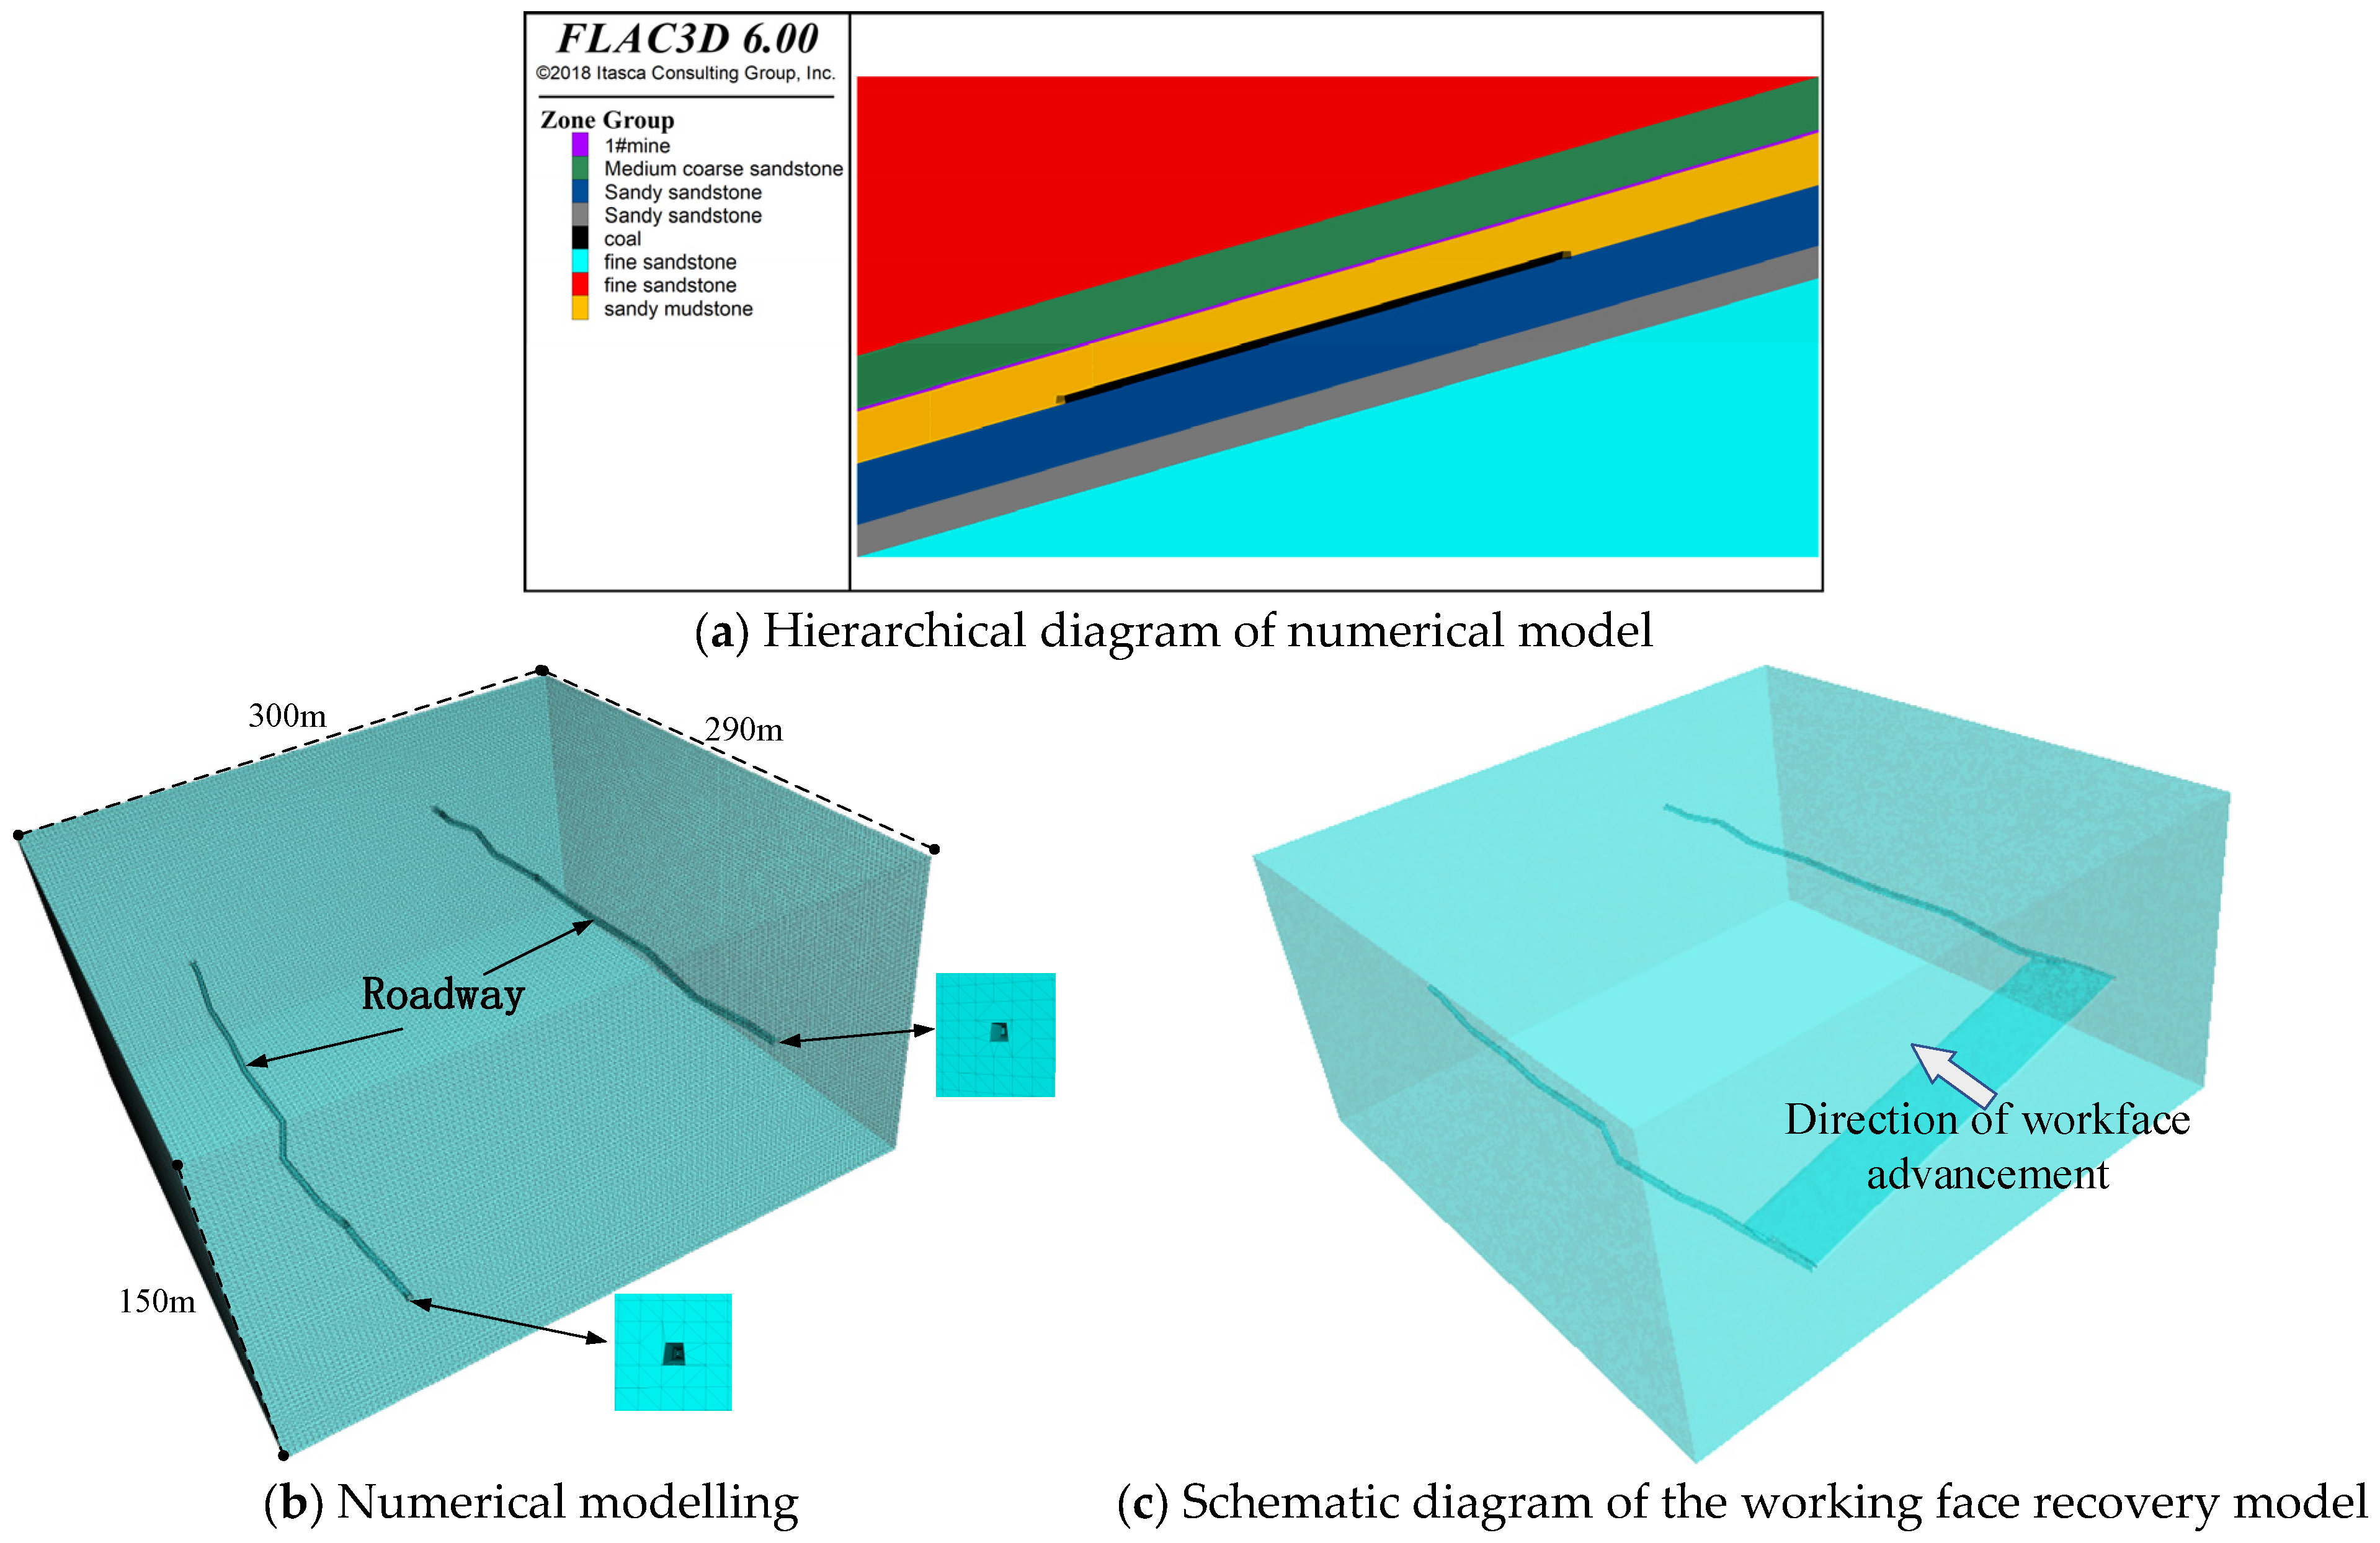
4.1. Numerical Model Establishment

The 3D numerical simulation model is configured with dimensions of 300 m × 290 m × 150 m (length × width × height), consisting of 3,054,875 blocks and 539,373 nodes. The X direction of the model is the direction of the working face. The Y direction is the direction of tunnel excavation. The Z direction is vertically upward, and the boundary conditions of the model mainly apply pressure on the upper boundary to make it equal to the weight of the overlying rock layer. The bottom boundary is fixed in the vertical direction, and the left and right perimeter boundaries are fixed in the horizontal direction. The roadway excavation has a width of 2.5 m and a height of 2.4 m. A schematic of the entire model and the retreat process is shown in Figure 4b. The mechanical properties of the rock mass are outlined in Table 2, and the model simulations incorporate the step-by-step excavation approach used in the actual engineering scenario.

4.2. Sensitivity Analysis of Model Grid

Sensitivity analysis is a crucial step in ensuring model accuracy and improving model robustness. To analyze the grid sensitivity of the model, it is divided into three grid densities. In Figure 5a, the model is divided into 441,344 grids and 80,908 nodes; The model in Figure 5b is divided into 3,323,485 grids and 591,079 nodes; The model in Figure 5c is divided into 20,931,590 grids and 3,612,540 nodes. Analyze the impact of network sensitivity on model calculation results by comparing the stress magnitude differences and their distribution ranges under different grid densities after initial equilibrium.
By comparing the above figure, it can be seen that after the model reaches initial equilibrium, as shown in Figure 5a, when the grid is relatively sparse, the stress gradient changes significantly. The regions representing different stress ranges in the entire model are relatively single, as shown in Figure 5b,c. When the grid density increases to a certain extent, the stress gradient changes relatively smoothly. The stress gradient of the entire model does not change much, and the difference between the stress distribution and gradient at the two grid densities is very small. Considering factors such as model size and computation time, the grid density shown in Figure 5b was chosen for the subsequent numerical calculations and analysis.

4.3. Analysis of Displacement Evolution of Mining Face

Selecting each mining cycle to compress the stress field of the working face for comparative analysis, revealing the evolution law of the stress field of the entire working face with the influence of mining. The cloud map of the stress field change of the 4331 working face obtained through numerical calculation is shown in Figure 6.
As shown in Figure 6a, in the early stage of mining in the working face, the stress field distribution is relatively uniform, and the main stress is concentrated around the transportation roadway in the model. However, at this time, the area of high stress is small, indicating that the stress on the surrounding rock of the roadway is not very high. This also confirms the reason why microseismic events are concentrated in the transportation roadway but have low energy in microseismic monitoring results. At this time, small-scale stress concentration is not enough to produce large-scale and high-energy rock mass fracture. As mining continues and the number of compressions increases, as shown in Figure 6b–d, the entire stress field begins to grow in an irregular trend. The entire stress field will concentrate on the surrounding rock of the roadway, mainly reflected in the concentrated stress of the surrounding rock of the two roadways being significantly greater than that of other positions. The higher the stress zone of the surrounding rock of the two roadways, the larger the area, and the stress of the rock near the transportation roadway is much greater than that of the return airway. At this time, the surrounding rock is prone to high stress release and large-scale rock fracture, resulting in a large number of high-energy microseismic events.

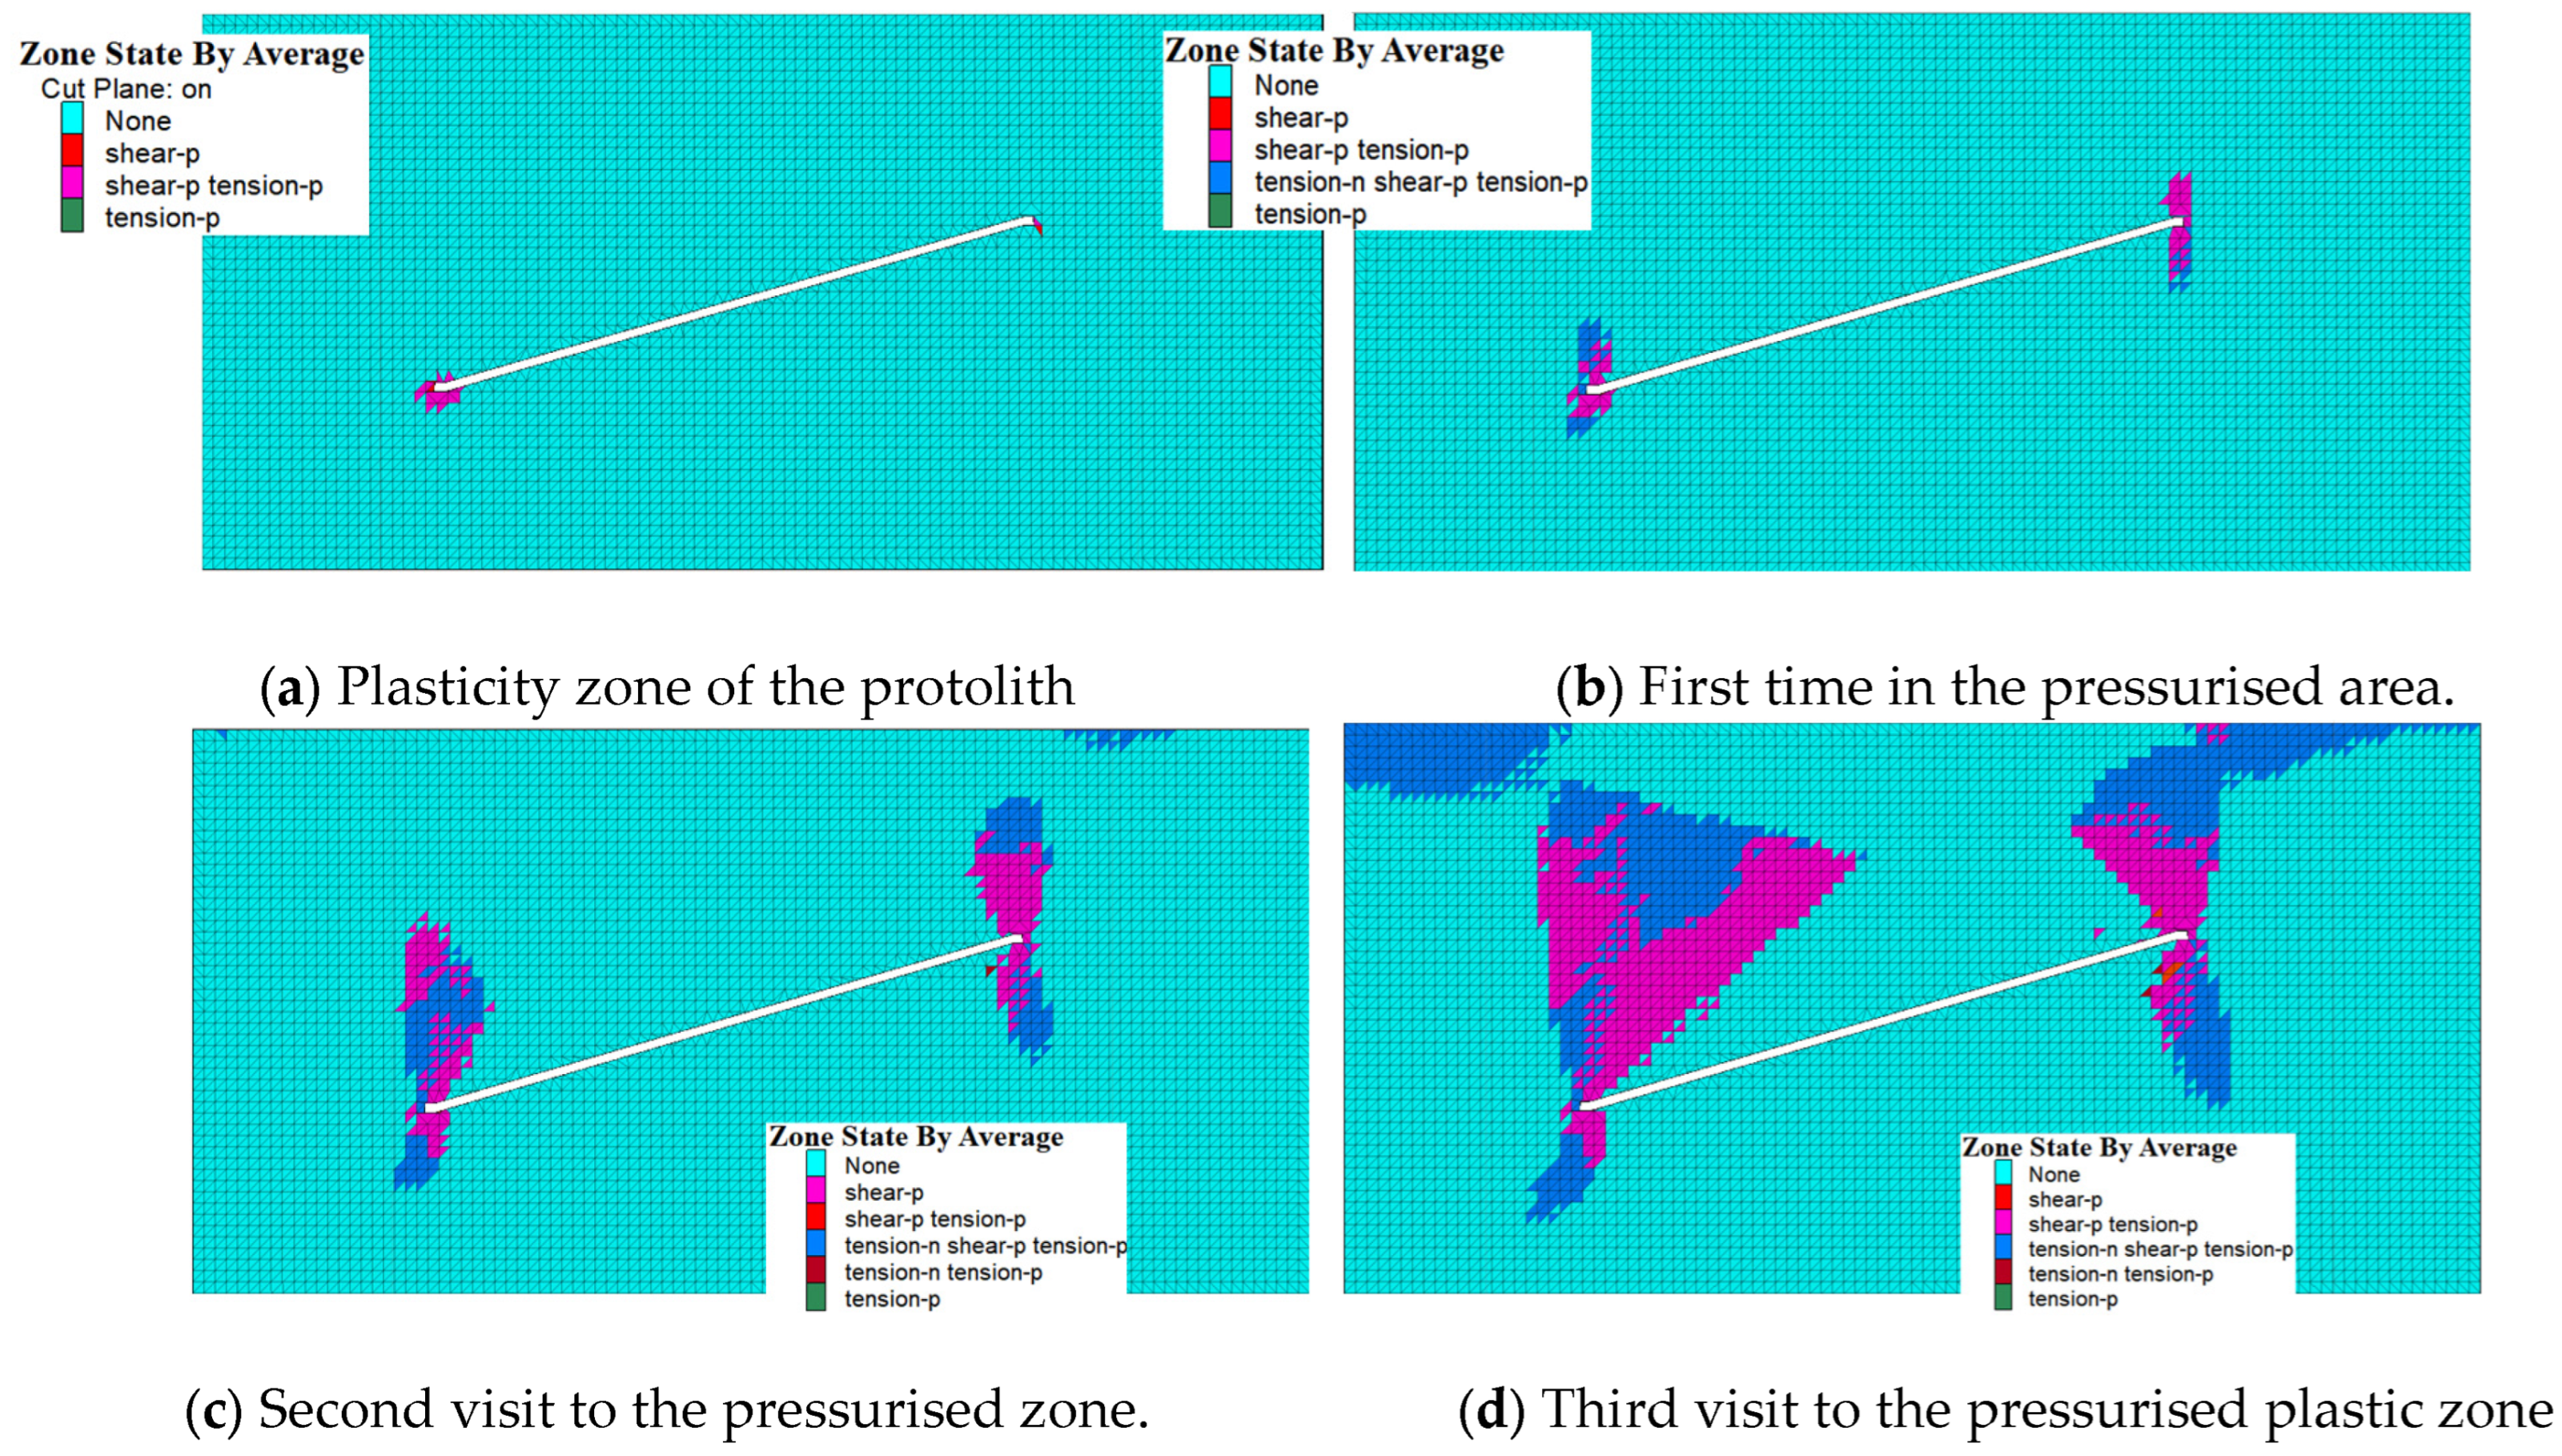
4.4. Analysis of the Development of Plastic Zones in the Peripheral Rock of the Mining Tunnel

The plastic failure of surrounding rock and the development of cracks affect the safe mining of the working face, so the distribution of plastic zone after periodic weighting of the working face is taken for analysis in the numerical simulation, as shown in Figure 7.
By analyzing Figure 7, it can be concluded that under the influence of mining, the plastic zone expansion of the surrounding rock of the working face presents the following pattern:
From Figure 7a, it can be seen that the plastic failure of the rock mass at this time is mainly manifested as elastic failure, with the failure area concentrated around the return airway (upper right airway of the model), and a small part of the failure area distributed around the transportation channel (lower left airway of the model). The surrounding rocks of both tunnels have experienced small-scale shear failure, but the form of failure at this time is relatively simple. From Figure 7b,c, it can be seen that as the working face continues to advance, the area of this multi form damage gradually expands. The plastic zone of the surrounding rock in the two tunnels has significantly expanded, especially in the transportation tunnel where the plastic zone of the surrounding rock has increased the most. This also explains why most microseismic events are concentrated around the transportation tunnel as mining progresses, as mentioned earlier. When the mining area is further expanded, as shown in Figure 7d, the plastic zone has extended to the top of the model and the plastic zone is relatively large, indicating that most of the rock mass is in the plastic failure stage. This suggests that there may be serious large-scale collapse events in the subsequent mining, which may have a certain impact on the surface. Therefore, it is necessary to reinforce the rock mass here or fill the goaf area.

4.5. Comparison of Numerical Simulation and Field Monitoring Results

4.5.1. Feasibility of Simulating Microseismicity in FLAC3D

Specifically, in rock mechanics, it is believed that when rocks fracture, the elastic strain energy stored in the rock is released and converted into microseismic energy [24,25,26]. First, the elastic strain energy density of the rock material (i.e., the elastic strain energy per unit volume) can be expressed as:
U = 1 2 σ ij ε ij
Among them, U is the elastic strain energy density; σij represents the components of the stress tensor, indicating the stress state inside the material. εij represents the components of the strain tensor, indicating the degree of deformation inside the material.
For isotropic elastomers, it is assumed that the stress-strain relationship of the material under volumetric and shear deformation is in accordance with Hooke’s law, when the elastic strain energy density can be expressed as [27,28]:
U = 1 2 K Δ V 2 + 1 2 G γ 2
where: k is the bulk modulus, which describes the ability of a material to resist volume change; G is the shear modulus, which describes the ability of a material to resist shear deformation; ΔV is the volume strain; and γ is the shear strain.
The total amount of elastic strain energy within the rock rupture volume V can be expressed by integrating the strain energy density over the rupture region [29,30]:
U total = V U d V
Substituting the strain energy density U into the above equation, we have:
U total = V ( 1 2 K ( Δ V ) 2 + 1 2 G γ 2 ) d V
This equation expresses the sum of elastic strain energy stored throughout the volume V during rock rupture.
The microseismic energy Em is usually converted from the strain energy released during rupture. Assuming conservation of energy, a fraction of the released elastic strain energy propagates as an elastic wave and is recorded as a microseismic signal. The microseismic energy can be expressed as a fraction of the total elastic strain energy:
E m = η U t o t a l
where: Em denotes the microseismic energy; η is the energy conversion efficiency coefficient, which represents the proportion of energy converted from elastic strain energy to microseismic energy, taking into account energy dissipation (e.g., heat, friction, etc.), and is usually 0 < η ≤ 1.
Assuming that the elastic strain energy density is uniformly distributed throughout the rupture process, i.e., U is approximated to be constant within the volume V, the total elastic strain energy can be simplified as:
U t o t a l = U V
where V is the volume of the rupture region. Therefore, the microseismic energy Em can be expressed as:
E m = η U V
Combined with the definition of the strain energy density U, the above equation becomes:
E m = η ( 1 2 K ( Δ V ) 2 + 1 2 G γ 2 ) V
This equation states that the microseismic energy is related to the volume within the rupture region, the volumetric strain, the shear strain, the bulk and shear moduli of the material, and the conversion efficiency factor η.
Microseismic signals are essentially caused by elastic wave propagation. The energy of an elastic wave is related to the velocity of the wave v, the density ρ, and the amplitude of the fluctuation A. For a one-dimensional elastic wave, the expression for the fluctuation energy is [31,32]:
E w a v e = 1 2 ρ V v 2 A 2
where: ρ is the density of the medium; ν is the propagation speed of the elastic wave; A is the amplitude; V and is the rupture volume.
From the perspective of elastic fluctuation energy, the microseismic energy is a square function of the amplitude during elastic wave propagation and is positively correlated with the rupture volume, density, and wave velocity [30]. Combined with the derivation of the microseismic energy, assuming that most of the strain energy released during rupture propagates through the elastic wave, the microseismic energy can be approximated to be equivalent to the fluctuation energy expression, so as to establish a connection between the two in the framework of energy conservation [33,34,35].
Through the above derivation, we obtain:
E m = η 1 2 K Δ V 2 + 1 2 G γ 2 · V
This suggests that the microseismic energy Em is the energy released from the elastic strain energy within the ruptured volume V of the rock through the fluctuating form. The conversion efficiency coefficient η reflects the possible dissipation factors (e.g., heat, friction, plastic deformation, etc.) during the conversion of strain energy to microseismic energy [32]. This theoretical derivation shows that the elastic strain energy stored in rocks can serve as the primary source of microseismic energy. In the context of energy conservation, microseismic energy can be seen as the outcome of the release of this stored strain energy via the propagation of elastic waves.
Based on the above principle that the elastic strain energy of rock is the main source of microseismic energy, the FISH language is compiled and applied to the simulation solution of FLAC3D for roadway mining to derive the elastic strain energy energy cloud.

4.5.2. Comparison and Verification of Simulation Results

To validate the reliability of the simulation results, the coordinates of the microseismic event gathering points from the distribution map were compared. A cross-sectional view was extracted from the corresponding position in the numerical model to generate an energy cloud map for comparative analysis. Simultaneously, field investigations were carried out within the corresponding range during the same period, allowing for a three-way comparison and verification between the numerical simulation, microseismic monitoring, and on-site observations.
As shown in Figure 8a, in the center of the transport roadway of the over-mining face, the surrounding rock energy in the numerical model is relatively high at 9.18 × 10⁵ J, which aligns with the microseismic monitoring results. The significant subsidence observed in field investigations at the top of this area suggests that energy is accumulating, causing small fractures in the rock and deformation of the surrounding rock. This provides a reasonable explanation for the elevated energy levels in this area and the concentration of microseismic events, as reflected in the simulation. As depicted in Figure 8b, with the continued advancement of the mining process, the energy of the surrounding rock in the numerical model corresponding to the microseismic event cluster increases further, reaching 1.2 × 10⁶ J. This rise in energy causes rock fractures and compresses the surrounding rock in the roadway, leading to damage to the roadway walls. In Figure 8c, as the mining area expands, a high-energy microseismic event occurs just ahead of the coalface, with the corresponding energy in the numerical model reaching 2.2 × 10⁶ J. During field exploration, due to the intense mining activity, some hydraulic supports were damaged and lost their load-bearing capacity under the strong mining pressure. These observations align well with the microseismic monitoring and numerical simulation results.

5. Conclusions

In this study, we have explored the effects of mining-induced stress redistribution and seismic activity in the context of a specific coal mining operation. Through numerical simulations and microseismic monitoring, we aimed to gain a better understanding of the rock mass behavior around the mining face and assess the stability of the surrounding rock. The findings provide valuable insights into the seismicity associated with the mining process and the potential use of microseismic monitoring as a tool for enhancing mine safety.
(1) As the coal mining face advances, the frequency of microseismic events is significantly positively correlated with the depth of the face’s advance. The rock strata rupture caused by the collapse of the roadway roof leads to the accumulation and release of microseismic event energy, and mining activities intensify the accumulation of microseismic events, reflecting the instability of the surrounding rock.
(2) Numerical simulations indicate that as the coal mining face advances, the displacement of the surrounding rock increases, causing the deformation zone to expand and shift towards the transport roadway. This redistribution of stress results in reduced roadway stability, an expanding plastic zone, and a shift in damage from purely elastic to a combination of shear and elastic damage. The transport roadway experiences the most significant plastic zone expansion due to the surrounding rock’s low strength, which explains the frequent microseismic events. These factors have a direct impact on mining safety, the stability of the surrounding rock, and the environmental sustainability of the mine.
(3) Theoretical derivation and numerical simulations confirm that the elastic strain energy in rock is the primary source of microseismic energy. The release of microseismic energy is closely linked to the volume, volumetric strain, and shear strain in the fracture zone.
In this study, we analyzed the stability of surrounding rock in a mining roadway using microseismic monitoring and numerical simulation. While the study provided valuable insights, several assumptions were made, such as the uniformity of geological conditions and the behavior of microseismic events based on past data. These assumptions may not fully capture the variability of real-world conditions. Additionally, limitations include the resolution of the simulation model and the specific geological features of the study site, which may not be applicable to all mining environments. Future work could focus on refining the model by incorporating more detailed geological data, improving real-time monitoring techniques, and applying the methods to a wider variety of mining scenarios. By addressing these limitations, the stability of mining roadways could be better predicted and managed in diverse conditions.

Author Contributions

Conceptualization, H.W. and Q.L.; methodology, H.W.; software, H.W.; validation, H.W., C.Z. and Q.L.; formal analysis, H.W.; investigation, H.W.; resources, Q.L.; data curation, H.W.; writing—original draft preparation, H.W.; writing—review and editing, H.W.; visualization, C.Z.; supervision, H.W.; project administration, Q.L.; funding acquisition, C.Z. and P.T. All authors have read and agreed to the published version of the manuscript.

Funding

This research was funded by the National Natural Science Foundation of China grant number 52274117.

Institutional Review Board Statement

Not applicable.

Informed Consent Statement

Not applicable.

Data Availability Statement

The data used to support the findings of this study are available upon request.

Conflicts of Interest

The authors declare no conflict of interest.

References

  1. Han, H.J.; Wang, G.F.; Li, M.Z.; Zhang, J.H.; Li, Y.P. Research status of support technology and equipment for ultra high mining height fully mechanized mining face. Coal Mine Saf. 2024, 55, 213–221. [Google Scholar] [CrossRef]
  2. Liu, Y.Y.; Su, Y.H.; Luo, B.; Yang, Z.W.; Chen, B. Principles and Methods of Tunnel Surrounding Rock Stability Analysis Based on Limit States. J. Railw. Sci. Eng. 2024, 21, 1–13. [Google Scholar] [CrossRef]
  3. Zhang, D.M.; Sun, G.Y.; Li, G. Stability analysis and maintenance scheme design of coal seam roadway under double mining influence. J. Eng. Geol. 2021, 29, 1028–1036. [Google Scholar] [CrossRef]
  4. Qiu, H.; Qiu, R.; Luo, G.; Ayasrah, M.M.; Wang, Z. Study on the Mechanical Behavior of Fluid–Solid Coupling in Shallow Buried Tunnels under Different Biased Terrain. Symmetry 2022, 14, 1339. [Google Scholar] [CrossRef]
  5. Yin, Y.; Yang, S.; He, Y.; Pan, J.; Guo, Z.; Fan, J.; Wang, Z. Stability assessment of surrounding rock in downward mining route supported by slab-wall backfill structure. Sci. Rep. 2024, 14, 13706. [Google Scholar] [CrossRef]
  6. Qin, Z.Z.; Liu, Y.T.; Wang, S.C.; Cai, H.; Wang, B.B. Research on the overlying rock movement law of deep buried “two hard” fully mechanized caving face based on microseismic monitoring. J. Min. Saf. Eng. 2017, 34, 74–78+102. [Google Scholar]
  7. Zhu, Q.; Li, Q.; Zhang, E.; Zhang, J.; Heng, X. Study on microseismic characteristics of geological anomalies in outburst coal seams under mining influence. Coal Sci. Technol. 2019, 47, 39–46. [Google Scholar]
  8. Zhang, D.Y.; Gai, Q.K.; Huang, L.; Li, Y.B.; Shen, X.Y.; Zhao, L.S.; Peng, Z.X. The spatiotemporal evolution mechanism and risk zoning of microseismic activity on the roof of abandoned roadway in working face. J. Coal Sci. 2021, 46, 3805–3818. [Google Scholar]
  9. Zhang, P.H.; Yang, T.H.; Zheng, C.; Yu, Q.L.; Liu, H.L.; Wang, P.T. Rock mass stability analysis based on mining induced stress field and microseismic activity. J. Coal Min. 2013, 38, 183–188. [Google Scholar]
  10. Wang, C.; Liu, X.; Yao, W.; Wang, E.; Hu, N.; Huang, Z.; Sun, Y. Study on rock stability and structural response of shield-driven twin tunnels crossing fault fracture zone based on 3d numerical simulation. Bull. Eng. Geol. Environ. 2024, 83, 287. [Google Scholar] [CrossRef]
  11. Xu, Z.; Xu, W.; Zhou, P.; Zhu, Z.; Zhao, J.; Gao, P. Research on Coal Mine Goaf Restoration Based on Stability of Overlying Rocks and Numerical Simulation Analysis: A Case Study of Jingmen Garden Expo Park. Sustainability 2023, 15, 1464. [Google Scholar] [CrossRef]
  12. Dong, H.L.; Gao, Q.C.; Zhang, Z.; Chen, R.; Liu, N. An approximate solution and numerical simulation of the plastic zone of the surrounding rock of a two-way unequal pressure roadway. J. Coal Sci. 2019, 44, 3360–3368. [Google Scholar]
  13. Lu, A.; Song, D.; Li, Z.; He, X.; Zhou, C.; Qiu, L. Numerical Simulation Study on Microseismic Characteristics and Rockburst Hazard Prediction in Deep Mining of Steeply Inclined Coal Seams. Rock Mech. Rock Eng. 2024, prepublish. 1–22. [Google Scholar] [CrossRef]
  14. Song, J.F.; Lu, C.P. Stress distribution characteristics and microseismic activity patterns in coal seam gangue occurrence areas. J. Min. Strat. Control. Eng. 2021, 3, 043518. [Google Scholar] [CrossRef]
  15. Jiang, F.X.; Chen, Y.; Li, D.; Wang, C.W.; Gai, D.C.; Zhu, S.T. Exploration of the Mechanism of Initial Mining induced Impact in Island Filling Working Face. J. Coal Ind. 2019, 44, 151–159. [Google Scholar] [CrossRef]
  16. Jiang, F.X.; Liu, Y.; Liu, J.; Zhang, M.; Du, J.P.; Sum, W.S.; Zhang, W.P. Research on the decompression mechanism of local protective layer mining in coal seams under impact ground pressure. J. Geotech. Eng. 2019, 41, 368–375. [Google Scholar]
  17. Zheng, C. Research on the Characterization Method of Mining Rock Mass Strength Parameters Based on Microseismic Monitoring Data. Ph.D. Thesis, Northeastern University, Shenyang, China, 2013. [Google Scholar]
  18. Xu, N.W.; Liang, Z.Z.; Tang, C.A.; Dai, F.; Zhou, Z.; Sha, C. Three dimensional feedback analysis of rock slope stability based on microseismic monitoring. J. Rock Mech. Eng. 2014, 33 (Suppl. S1), 3093–3104. [Google Scholar]
  19. Yang, Y.; Sun, Y.D.; Zhang, G.Y. Study on microseismic response characteristics and support of surrounding rock in tunnels under dynamic loads. China Saf. Prod. Sci. Technol. 2020, 16, 73–79. [Google Scholar]
  20. Li, Z.H.; Xu, N.W.; Sun, Z.Q.; Liu, J.; Li, B.; Sun, Y.P.; Zhu, J.L. Analysis of Large Deformation Characteristics of High Stress Soft Rock Tunnel Surrounding Rock Based on Microseismic Monitoring and Numerical Simulation. J. Rock Mech. Eng. 2024, 43, 2725–2737. [Google Scholar] [CrossRef]
  21. Yuan, G.; Zhang, M.; Wang, J.; Wei, J.; Yang, K. Numerical simulation study on the evolution characteristics of microseismic zoning in mining overlying strata. Coal Sci. Technol. 2023, 51, 36–46. [Google Scholar] [CrossRef]
  22. Li, A.; Dai, F.; Xu, N.; Gu, G.; Hu, Z. Analysis of a Complex Flexural Toppling Failure of Large Underground Caverns in Layered Rock Masses. Rock Mech. Rock Eng. 2019, 52, 3157–3181. [Google Scholar] [CrossRef]
  23. Li, A.; Liu, Y.; Dai, F.; Liu, K.; Wang, K. Deformation mechanisms of sidewall in layered rock strata dipping steeply against the inner space of large underground powerhouse cavern. Tunn. Undergr. Space Technol. 2022, 120, 104305. [Google Scholar] [CrossRef]
  24. Ma, C.C.; Li, T.B.; Zhang, H.; Wang, J.F. Rockburst warning method and discussion based on EMS microseismic parameters. Geotech. Mech. 2018, 39, 765–774. [Google Scholar]
  25. Wang, J.Q.; Zhu, Q.J.; Zhang, E.H. Research on Energy Expression Method and Application of Mine Microseismic Source. Coal Eng. 2020, 52, 86–91. [Google Scholar]
  26. Qin, S.Q.; Xu, X.W.; Hu, P.; Wang, Y.Y.; Huang, X.; Pan, X.H. Exploration of the multi locking segment brittle fracture mechanism of seismogenic faults and new methods for earthquake prediction. J. Geophys. 2010, 53, 1001–1014. [Google Scholar]
  27. Liu, H.Y.; Meng, F.L. Roof fracture and dynamic evolution law of energy field in thick coal seam working face. Coal Mine Saf. 2023, 54, 153–160. [Google Scholar]
  28. Zhang, Y.; Deng, X.Y.; Li, X.H.; Chen, X.M.; Qu, H.L. Research on rock burst hazard prediction based on elastic strain energy characteristics. J. Undergr. Space Eng. 2022, 18 (Suppl. S1), 305–311. [Google Scholar]
  29. Xing, S.; Pei, X.; Mei, J.; Dong, P.; Zhen, C.; Li, X.; Lu, F.; Liu, P. A novel elastic strain energy density approach for fatigue evaluation of welded components. Eng. Fract. Mech. 2023, 293, 109713. [Google Scholar] [CrossRef]
  30. Cheng, Y.; Zhang, L. Study on Rock Failure Criterion Based on Elastic Strain Energy Density. Appl. Sci. 2023, 13, 8435. [Google Scholar] [CrossRef]
  31. Kang, G.; Kim, M.; Yang, H.; Shin, J.; Sim, J.; Ahn, H.; Jang, M.; Kim, Y.; Min, H.S.; Jung, H. Latch Applicator for Efficient Delivery of Dissolving Microneedles Based on Rapid Release of Elastic Strain Energy by Thumb Force. Adv. Funct. Mater. 2023, 33, 2210805. [Google Scholar] [CrossRef]
  32. Wang, J.; Poh, L.H.; Guo, X. Localizing gradient damage model based on a decomposition of elastic strain energy density. Eng. Fract. Mech. 2023, 279, 109032. [Google Scholar] [CrossRef]
  33. Chang, D.; Yang, X.; Liu, R.; Huang, Z.; Peng, H.; Zuo, H. Experimental investigation on the correlation between critical storage of elastic strain energy and crack extension in elastic–plastic materials. Fatigue Fract. Eng. Mater. Struct. 2022, 46, 1007–1021. [Google Scholar] [CrossRef]
  34. Huang, B.; Xie, P.; Wu, Y.; Lin, W.; Luo, S.; Wang, S.; Wen, Z.; Chen, J. The effect of overlying rock fracture and stress path evolution in steeply dipping and large mining height stope. Géoméch. Geophys. Geo-Energy Geo-Resources 2024, 10, 95. [Google Scholar] [CrossRef]
  35. Huang, B.; Xie, P.; Lin, W.; Wu, Y.; Luo, S.; Ye, X.; Nan, C.; Zhao, W. Study on the evolution mechanism of gangue filling and overlying rock spatial structure in steeply dipping stope. Eng. Fail. Anal. 2024, 166, 108884. [Google Scholar] [CrossRef]
Figure 1. Comprehensive histogram of coal seams.
Sustainability 17 00630 g001
Figure 2. Microseismic sensor measurement point deployment and control map.
Sustainability 17 00630 g002
Figure 3. Distribution of microseismic events in the working face.
Sustainability 17 00630 g003
Figure 4. Schematic diagram of numerical simulation scheme.
Sustainability 17 00630 g004
Figure 5. Stress distribution cloud map under different grid densities.
Sustainability 17 00630 g005
Figure 6. Distribution diagram of stress field evolution data in the working face.
Sustainability 17 00630 g006
Figure 7. Contour map of the development of the plastic zone in the mining face.
Sustainability 17 00630 g007
Figure 8. Comparison of numerical simulation results with microseismic and field exploration results.
Sustainability 17 00630 g008
Table 1. Technical Parameters of Sensors.
Recording UnitOperating and Analyzing Software Technical Parameters
Receiver Port12Data acquisitionSampling interval: 31.25 μs
62.5 μs,125 μs
Record length: minimum 451.1 ms, maximum 1808.5 ms
Record the number of tracks12 Microseismic sensors
Sampling interval31.25 μs, 62.5 μs, 125 μs, 250 μsMicroseismic data processingNumber of lanes: 1–12
Processing procedure:
1. Data length setting
2. Bandpass filtering
3. Initial pickup
4. Pick up and process
5. Separation of P and S waves
6. Speed analysis
7. Microseismic data localization
Record bandwidth10,000 Hz, 5000 Hz
Analog-to-digital conversion24 bit
Record length2048 sample points
Maximum input signal±10 Vpp
Dynamic range120 dB
Microseismic sensitivity1000 mV/g ± 5%
Frequency range0.5~15,000 Hz
Response frequency20 kHz
Transverse sensitivity>1%
Operation temperature0 °C~+65 °C
Table 2. Coal seam top and bottom plate condition.
Nature of the FormationBulk Modulus (GPa)Shear Modulus (GPa)Cohesion (MPa)Friction Angle (°)Density (kN/m3)
1#sandy mudstone8.855.932.71322600
2#three coals3.84.214.21321400
3#siltstone2.01.31.6342700
Disclaimer/Publisher’s Note: The statements, opinions and data contained in all publications are solely those of the individual author(s) and contributor(s) and not of MDPI and/or the editor(s). MDPI and/or the editor(s) disclaim responsibility for any injury to people or property resulting from any ideas, methods, instructions or products referred to in the content.

