Abstract
The imperative for sustainable development demands innovative solutions to address the environmental impact of transportation, particularly in the context of climate change. This study explores the intersection of renewable energy and sustainability within the automotive industry by examining how restrictions on the sale of gasoline-powered vehicles affect patent filings related to automotive engine technologies. Our approach employs a factorial analysis to capture structural shifts in patent filings, utilizing the logarithmic mean Divisia index for index decomposition. We scrutinize patent trends from 1985 to 2019, with a focus on both non-green (internal combustion engine vehicles) and green technologies (battery electric, hybrid electric, and full cell vehicles), to assess the transition towards sustainable transportation. This study also scrutinizes the patenting activities of four major patent offices—China, Japan, the United States, and Germany—to unveil global trends and disparities in sustainable technology innovation. Our findings underscore how a nation’s green investment strategy is contingent upon its developmental stage, with intellectual property rights and R&D incentives playing pivotal roles in shaping R&D landscapes, especially in emerging economies with nascent intellectual property markets. This study also reveals varying strategies for developing green automotive engines across nations, indicating that the growth of green patents in developed countries is probably spurred by financial incentives and enhanced intellectual property rights to promote specific tech advancements. This research contributes to the discourse on sustainability by highlighting the critical role of policy in fostering green technology development and the importance of aligning patent strategies with environmental goals.
1. Introduction
Concerns about climate change have produced a dynamic environment in the automobile industry focused on the development of more sustainable technologies [1]. In response to the tough restrictions on gasoline-powered car sales all over the world, automobile companies’ research and development (R&D) strategies are changing rapidly. R&D is a long-term plan. Thus, there is a continuous debate among practitioners and scholars on which types of sustainable energy should be prioritized [2,3].
In the automobile industry, firms invest in electric-based green technology or hydrogen-based green technologies. There is ongoing debate about which green automotive engine technology (green AET or GAET), like hybrids, will remain competitive and advantageous in the future. Not only do entrepreneurs compete for market share, but regulators often pass legislation to encourage innovation [4]. Consequently, it is crucial to utilize accurate measurements to demonstrate the growth of GAET and give us direction.
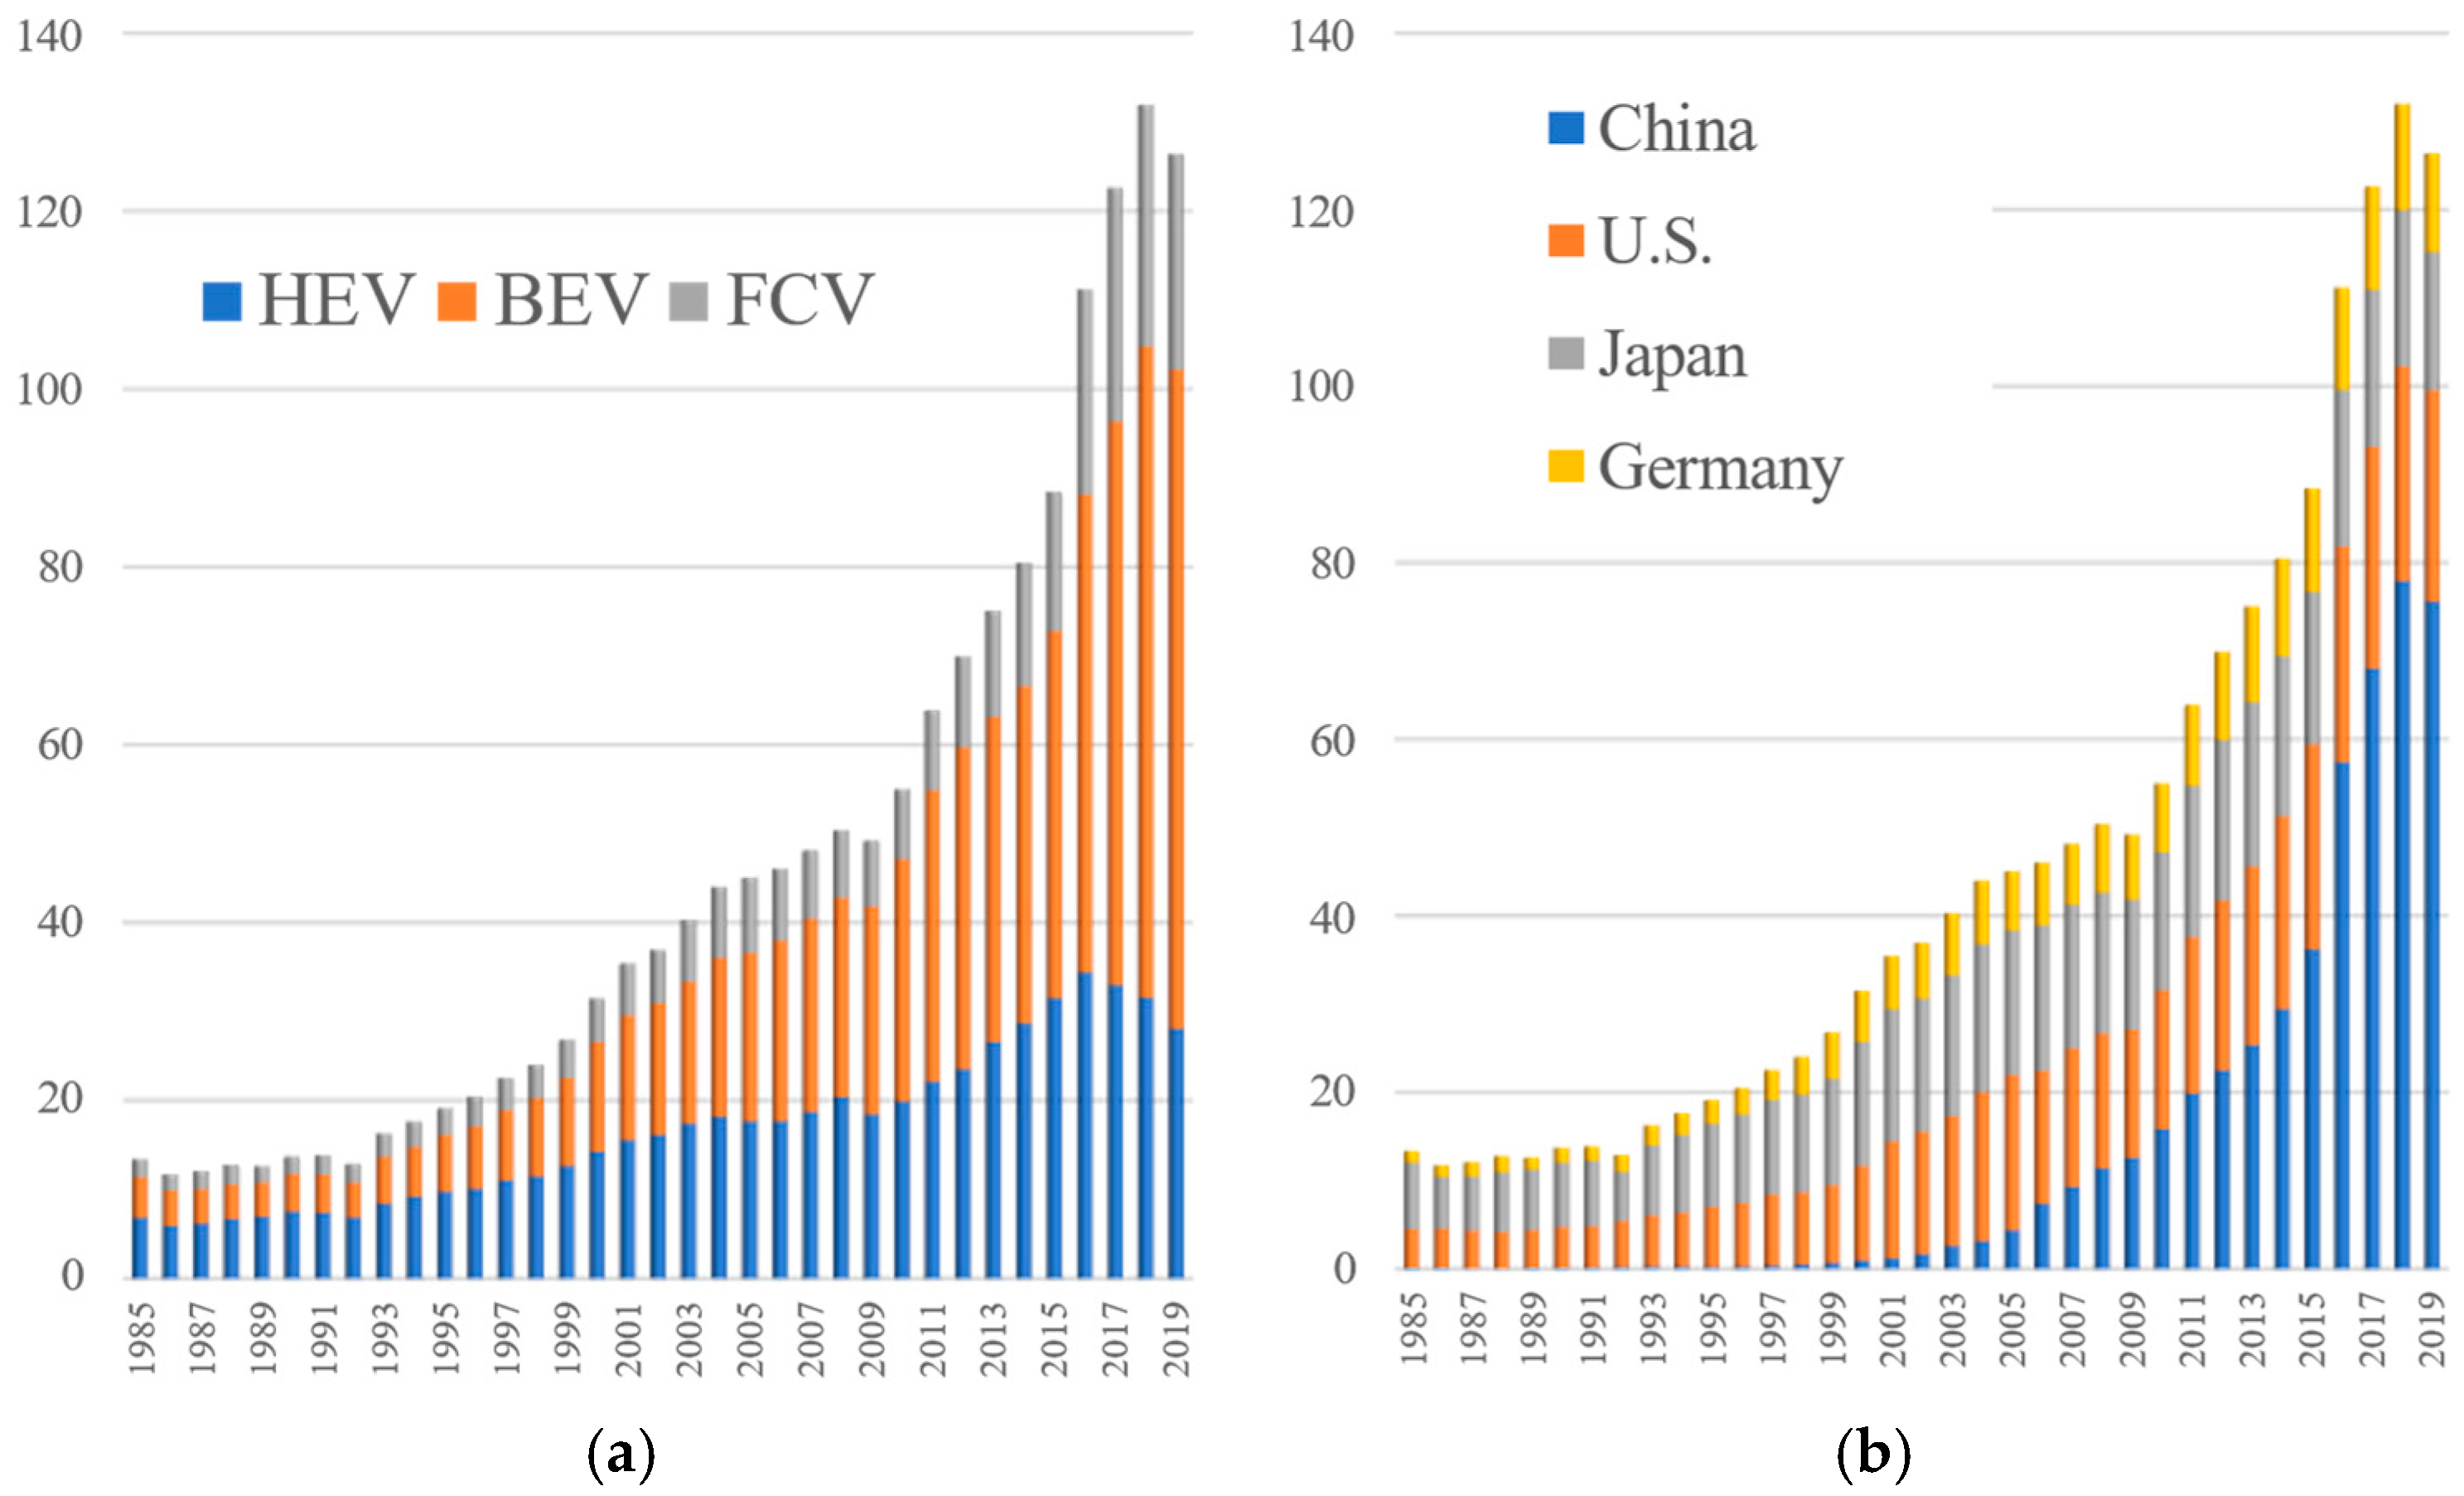
In the global markets, China currently accounts for almost 60% of total EV sales. China is at the forefront of the electric vehicle (EV) market, surpassing traditional automotive giants such as Germany and Japan. In 2022, new EV sales in China surged by 82%, representing over 60% of global EV purchases [5]. We can see that the trends of sales can be reflected by the GAETs patent applications as time goes on in Figure 1. For example, in Figure 1a, we can observe general rising tendencies. From 2000 to 2004, China had the least number of applications in all the GAET subtypes. However, it has grown fastest and finally surpassed Japan and the USA during 2015–2019. Specifically, Figure 1a indicates that the overall number of GAET patent applications in China increased dramatically, from 8186 in 2000–2004 to 460,610 in 2015–2019. Figure 1b indicates that the number of patents from all countries is increasing. China had the fewest patents in 1985 but has grown to be the largest after 2010.
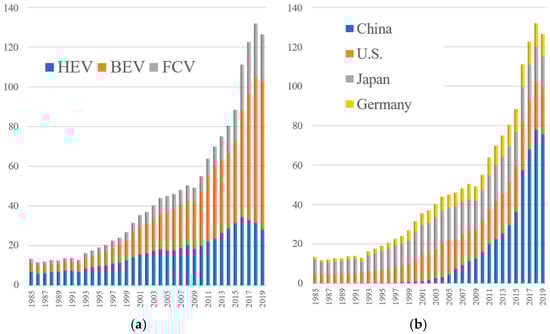
Figure 1.
(a) The trend of the number of GAET patent publications (thousand patents). HEV—Hybrid electric vehicle (HEV); BEV—Battery electric vehicle; FCV: Fuel cell vehicle. (b) The trend of the number of GAET patent publications (thousand patents) in the 4 countries.
Patent data have emerged as a pivotal resource for gauging technological progress and informing strategic technology management decisions. A wealth of research has demonstrated the utility of patent data in tracking the evolution of automotive engine technologies (AETs). For example, [6] utilized the logistic growth curve model to chart the development of fuel cell and hydrogen technologies, while [1] leveraged predictive analytics to forecast advancements in transmission systems for various electric vehicles. Ref. [7] employed patent data to dissect the sub-technologies within internal combustion engines, such as alternative fuels and direct injection. These studies underscore the diverse motivations of companies in exploring green automotive engine technologies (GAETs), which are contingent upon the specific technology being investigated. Despite the valuable insights provided by existing studies on patenting trends in the automotive industry, there is a notable gap in research that specifically analyzes Generalized Accelerated Expiration Time (GAET) patterns. Our study addresses this by employing a decomposition methodology to explore GAET patterns in relation to changes in priority and green development, a novel approach in the literature.
Globally, the automotive innovation landscape has been significantly shaped by various shocks over the past three decades, including environmental regulations, market structures, and economic conditions. As noted by [8,9,10,11], these factors have profoundly impacted the development of GAET technologies. The advancement of AET technologies may not adhere to a typical S-curve pattern in some regions due to the combined influence of these factors. Our study aims to fill the void in the literature by assessing more comprehensive structural breaks in each engine technology, as highlighted by [12], who caution against the potential for estimation errors when structural changes are not accounted for in energy markets, the natural environment, and macroeconomic factors.
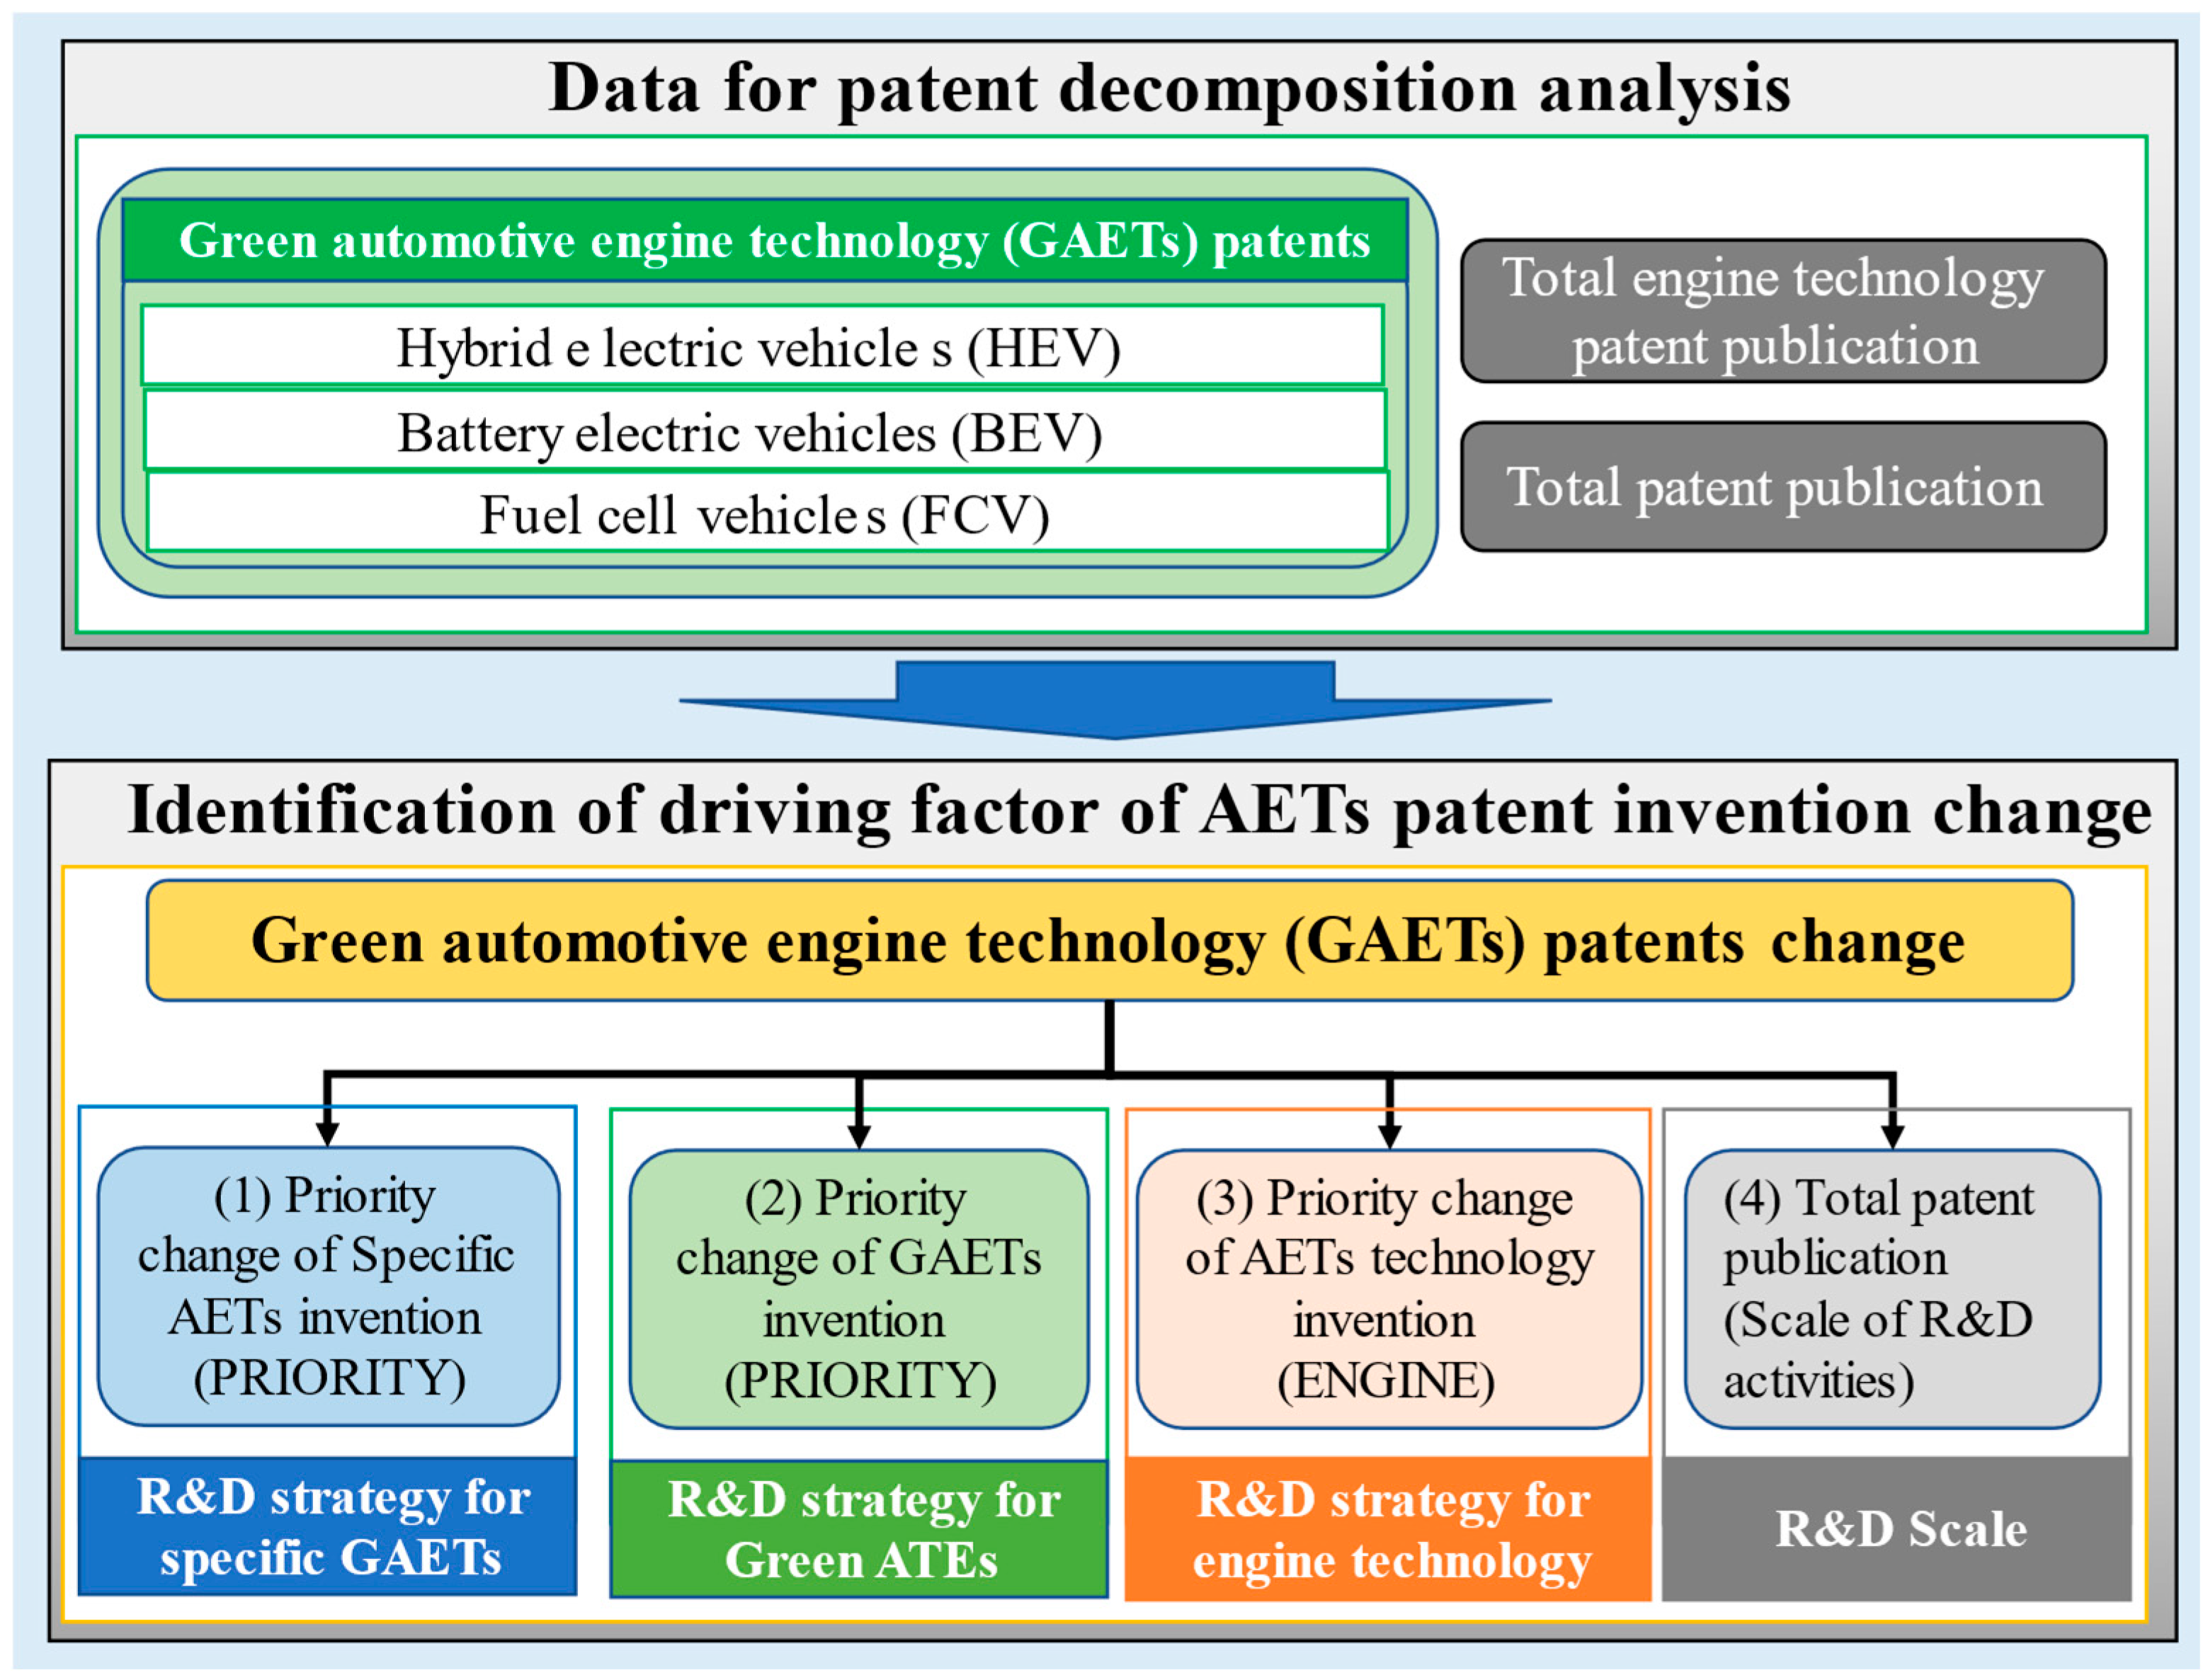
In line with these efforts, our study aims to contribute to the field by conducting a comprehensive determinant analysis of inventions. This analysis will focus on identifying shifts in priorities and the unique characteristics of each GAET, which is crucial for formulating effective research and development (R&D) strategies. Specifically, we will decompose relevant patent categories into four contributing factors that influence the patent filing hierarchy, as outlined by [13] and illustrated in Figure 2. Specifically, we collect data from the PATSTAT database, which includes more than 138 million patents in the world. We focus on 3 GAET types based on the World Intellectual Property Organization [14]: (1) BEV, (2) HEV, and (3) FCV. Meanwhile, we compile the patents for ICEVs as non-green AETs for comparison with GAETs. Our results show the trends of adopting different types of green (instead of non-green) investment patterns for each country based on its growth stage. We also find that policies on intellectual property (IP) protection and support to encourage R&D can be expected to extend the scope of R&D operations in emerging and developing nations where IP markets are not well developed. Another novelty of this study is the application of structural break identification to patent decomposition analysis, which makes it possible to quantitatively identify the main causes of major changes in R&D activities. This analytical framework has not been used in previous studies and is considered unique to this study.
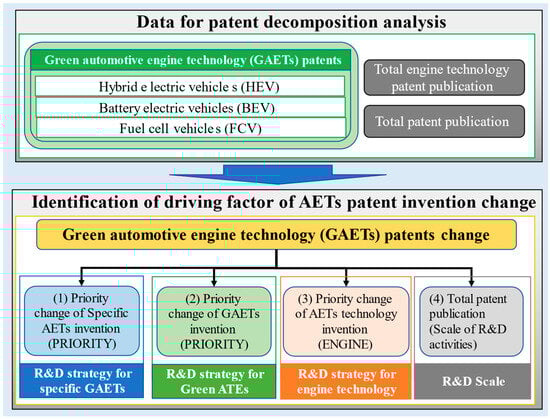
Figure 2.
The research framework.
The remainder of the paper is organized as follows: In Section 2, we review the relevant literature. Section 3 details the methodology employed in the study. We introduce the data collected in Section 4. We present the results and findings in Section 5 and conclude the paper with discussions on conclusions and policy implications in Section 6.
2. Materials and Methods
2.1. Government Regulations and Green Automobile Technology R&D
Climate change, a critical issue impacting humanity, underscores the need for rapid and effective technological adoption across various industries. In recent decades, the focus on altering production and consumption patterns has increasingly extended to sectors like transportation, which relies heavily on fossil fuels [15].
Governmental policy spurs technological innovation [16,17,18]. Non-financial policies that give enterprises the freedom to select their technologies often lead to the adoption of cheaper options. In contrast, financial policies that guarantee market prices tend to encourage the adoption of more expensive technologies [19]. Ref. [1] demonstrated that priority adjustments in green technology inventions varied across China’s five-year plans. These variations in environmentally friendly technology are useful in assessing national and global market demands and specific technologies. Similarly, launched in 2019 by the European Commission, the European Green Deal (EGD) represents an ambitious strategy for growth. It outlines a vision to address the global challenges of nature and climate change while transforming the European Union into a fair and prosperous society with a competitive, low-carbon economy [20]. For example, [21] examined the EGD by analyzing policy documents and found that while the EGD aims to promote a just and inclusive transition to a low-carbon economy, it often overlooks the negative ecological and social impacts of raw material extraction. Ref. [22] investigated the factors that influence the national adoption of the EGD based on the role of politicization. They find that public opinion, fossil fuel dependency, economic context, and party ideology influence national positions on the EGD.
The car industry, being particularly sensitive to environmental regulations, is adjusting its R&D processes in response to increasingly stringent sales limits on gasoline-powered vehicles worldwide. R&D is a long-term strategy; thus, it is critical to decide which forms of sustainable energy should be given priority [23]. There are two techniques for addressing vehicle emission issues. One way is to switch to a different fuel type (e.g., electronic, hybrid, etc.), which can be accomplished by either improving the quality of conventional fuel or utilizing alternative fuel systems. For example, [24] examines the factors influencing private investment in the automotive industry’s shift from combustion engine technology to fuel cell technology. The other option incorporates engine technology and the decrease in in-use vehicle emissions as well as new vehicle emissions requirements. Due to the diversity of technological qualities, it is difficult to determine which type of technology has the best technical performance [25]. To address this challenge, the application of Life Cycle Analysis (LCA) can provide valuable insights. LCA evaluates the environmental impacts of a product or technology from its cradle to its grave, considering all stages of its life cycle, including production, use, and disposal [26]. For instance, studies have shown that the environmental performance of BEVs is significantly influenced by the electricity mix used for charging and the efficiency of battery recycling [27].
As a result, determining unique GAETs using external indicators in accordance with government laws is difficult yet critical. This research intends to capture green automobile technology R&D at various levels of regulatory legislation.
2.2. Technological Changes and Temporal Patent Data
Patents are significant outcomes of R&D. As a result, they are one of the best tools for tracking technological advancements through time. Moreover, it offers data on the geographic distribution of certain patents, forecast insights, R&D plans, and other things [28]. They have been recognized as a valuable information resource for technology management research, as well as for the study of innovation and technological advancement.
Research on patent analysis frequently concentrates on two main areas: evaluating a nation’s technical competitiveness and the economic impacts of technological innovation [29]. The patent data can assist practitioners in determining R&D priorities [30], creating a patent map to identify technology gaps [31], investigating the consequences of technological change on company performance [32], and emphasizing the importance of patents in the innovation of maritime transportation and helping to stop patent infringement [33].
For the automobile industry, previous researchers have attempted to examine GAET systems using patent data. For example, [34] study the rivalry among several low-emission vehicle technologies and automobile manufacturers’ inventive strategies. Ref. [35] showed that pollution control legislation enacted in the US, EU, and Japan positively impacted the tendency to develop emissions control systems but not the expansion of the automobile market. Ref. [36] provided an in-depth examination of how engine systems competed and evolved with one another. Ref. [37] explored dynamic inter-powertrain connections with a focus on information diffusion. Ref. [38] found that green technology diversification affects energy intensity indirectly through vertical spillovers along the supply chain over time.
However, most studies focus solely on the number of patents, providing no insight into the fundamental drivers of innovation, such as the priority given to specific technological breakthroughs or the scale effect of R&D. This limitation can be overcome using patent decomposition analysis [39].
In brief, considering the research gaps in previous studies, we have the following objectives: (1) Identify the trends of adopting green (instead of non-green) investment patterns for each country based on its growth stage. (2) Identify which types of green automotive engine technologies for each country to research and develop during their green transformation.
3. Methodology
Although previous studies (e.g., [1,40,41]) of GAET patents filed for a specific subtype of vehicles (such as electric or other low-emission vehicles) have produced promising results about technological trends, a more thorough examination of the patenting applications is required to determine what drives innovation in various subtypes of the automotive industry. To this end, we utilize a patent analysis decomposition methodology that breaks down relevant patent categories into three factors contributing to the hierarchy of filed patents, as described by [13]. This method calculates coefficients representing changes in patent applications for each factor by comparing two different time points and using the natural logarithm of their ratio, following the Logarithmic Mean Divisia Index method [42]. This approach has been extensively applied in various fields, including climate change mitigation [43], artificial intelligence [44], and environmental protection [39].
When applied to advanced technologies, the decomposition method can identify key factors driving innovation, such as the prioritization of specific technological inventions or the scale effect of R&D activities [45]. By accounting for the scale effect, the patent decomposition approach [39] provides a more accurate measure of the relationship between patent data and actual innovations. To decompose GAET-related patents regarding green technology, we define four indicators: PRIORITYk (where k = 1 and 2), GREEN, ENGINE, and SCALE.
(1) PRIORITYk, the number of GAET-related patent applications in each subtype (Specifically, we have the PRIORITY for battery electric vehicles when k = BEV and hybrid electric vehicles when k = HEV. For more details, see Table 1) divided by the total number of GAET patent applications. This indicator rises if the targeted subtype has more patents than the other four ones. That is, as PRIORITYk increases, innovators prioritize the development of the k-th subtype of GAET-related patents over other subtypes.

Table 1.
Definition of AET subtypes.
(2) GREEN, the total number of patent applications in the development of GAET divided by the total number of patent applications in that of automotive engines, indicating the proportion of all GAET-related patents among all the AET patents. ENGINE increases when the growth rate of GAET-related patent applications exceeds the growth rate of all patent applications, indicating that scientists are concentrating their efforts on green automobile engines.
(3) ENGINE, the total number of patent applications in the development of automotive engines divided by the total number of patent applications, indicating the share of all AET-related patents among all the patents. ENGINE goes up when the number of AET-related patent applications increases faster than those of all patent applications, demonstrating that researchers are focusing their efforts on automotive engines.
(4) SCALE, the total number of patent applications to describe the scale of research and development (R&D) activities. As the overall number of patent applications rises, SCALE also increases. Since active R&D efforts usually encourage the development of new technologies, the number of AET-related patent applications increases as the SCALE expands proportionally to the expansion of all R&D activities.
The number of each GAET patent application (GAETk) can be decomposed relative to the number of patent applications for two subtypes of GAET and the total number of patent applications (TOTAL), as shown in Equation (1).
Now consider the change in each GAET-related patent from year t (i.e., ) to t + 1 (i.e., ). Following Equation (1), we can represent the change in patents by Equation (2).
Then, we can transform Equation (2) into Equation (3) by applying a natural logarithm operator.
For both the left and right hands of Equation (3), we can multiply them by to obtain Equation (4).
Consequently, changes in the number of GAET patents for each subtype over time are decomposed based on changes into four terms shown in previous equations: (1) PRIORITYk, (2) GREEN, (3) ENGINE, and (4) SCALE. We use an additive weight to estimate how many published patents there are for each GAET subtype.
4. Data
This study utilized patent application data from the European Patent Office’s PATSTAT Online database. The Orbis Intellectual Property database contains information on over 100 million patents all over the world. Patent application data were collected on 20th April 2023 from the PATSTAT database. The collection period covers 1985 to 2019. Following the scopes adopted by [37], this study focuses on 4 AET types in WIPO (2022): (1) BEV, (2) HEV, (3) FCV, and (4) ICEV, with BEV, HEV, and FCV as clean (green) technology and ICEV as dirty (non-green) technology. The patent classification code is International Patent Classification (IPC), founded by the WIPO. Table 1 provides a brief introduction. For the details of each IPC code, see Table A1 in Appendix A.
The alternative approach entails investigating patent application data [46], thereby offering valuable perspectives into the R&D efforts of innovators. The requirement of an application fee suggests that inventors generally assume their ideas will succeed in the test, even though some applications may not pass the inspection procedure, highlighting potential concerns with the invention’s quality. Therefore, compared to awarded patent data, patent application data are thought to more precisely reflect inventors’ research and development efforts and plans. Consequently, we represented inventors’ R&D strategies for automotive engine technologies using data from patent applications (Applying scientific papers to examine R&D tactics and endeavors is another method. Nevertheless, the lack of a thorough classification of automotive engine technologies in scientific publications makes it challenging to use scientific publishing data for this study. To retrieve the data, a keyword search approach must be used. Scientific journals that are not specifically relevant to AETs may be found using a keyword search technique. It is so challenging to obtain data on scientific publication counts that accurately reflect the R&D strategies of inventors). To avoid double-counting, we constructed our patent dataset using the principal IPC code and the primary applicant’s name, as [36] suggested.
5. Results and Discussion
5.1. Decomposition Analysis
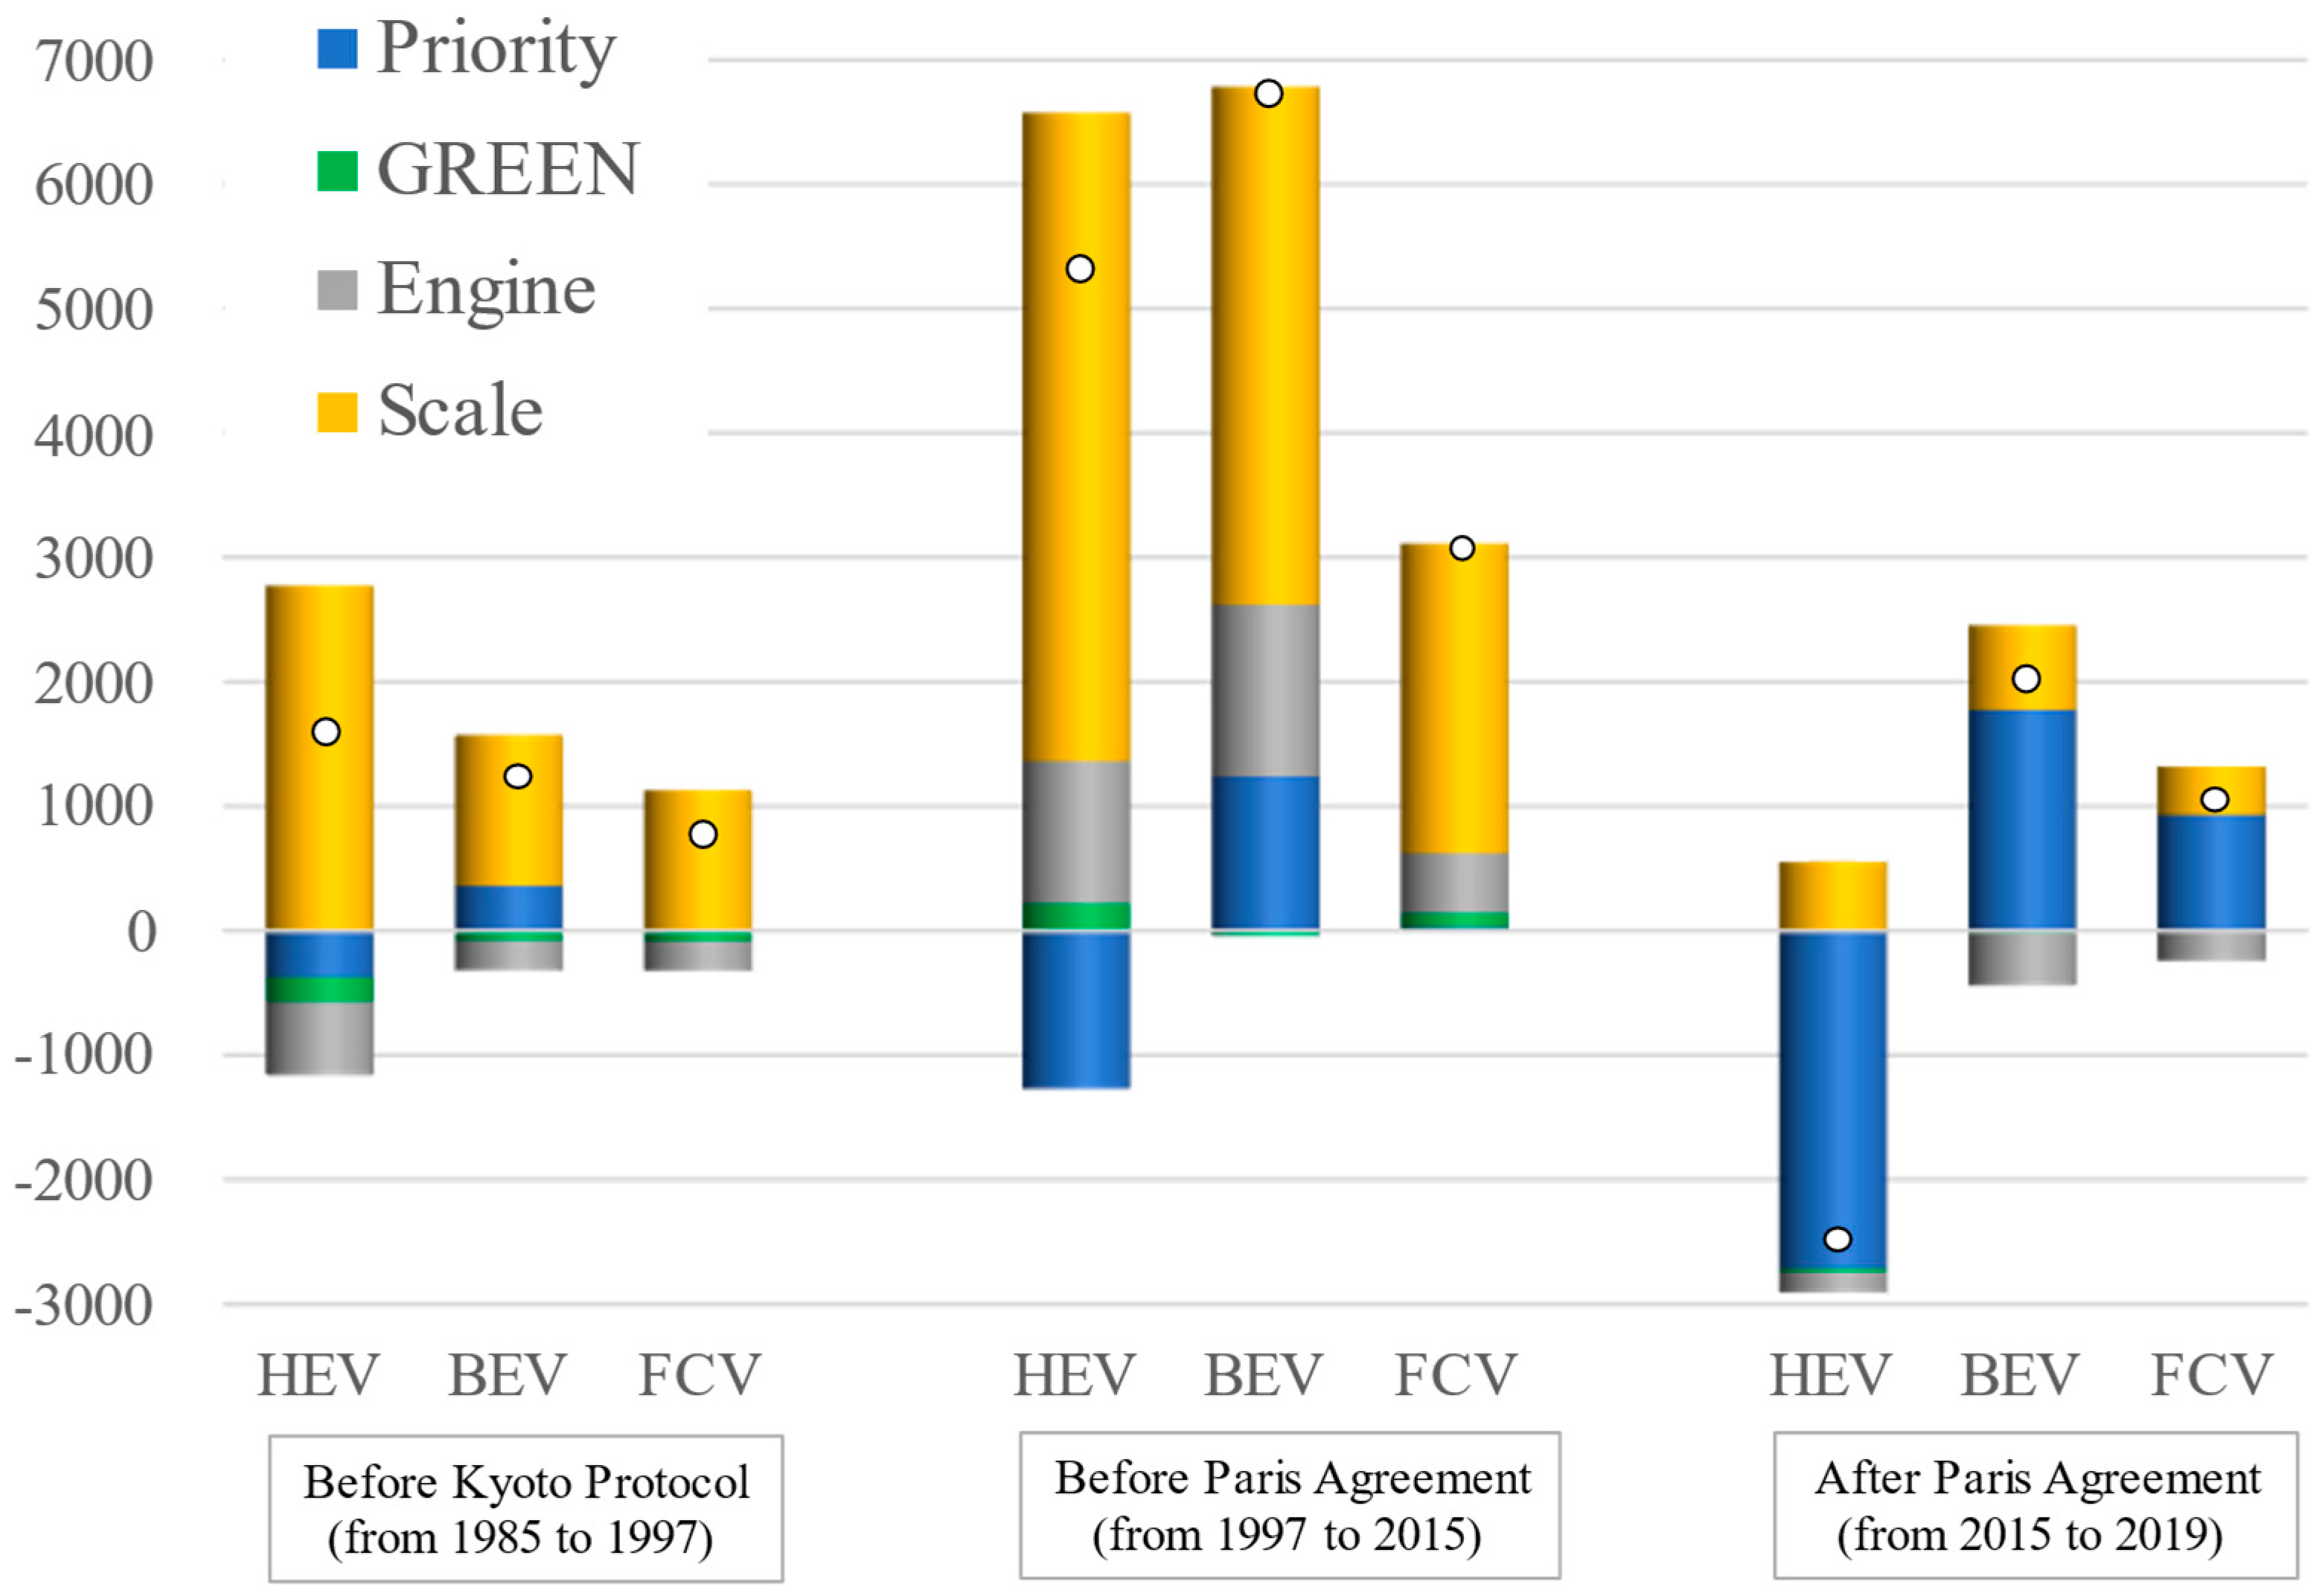
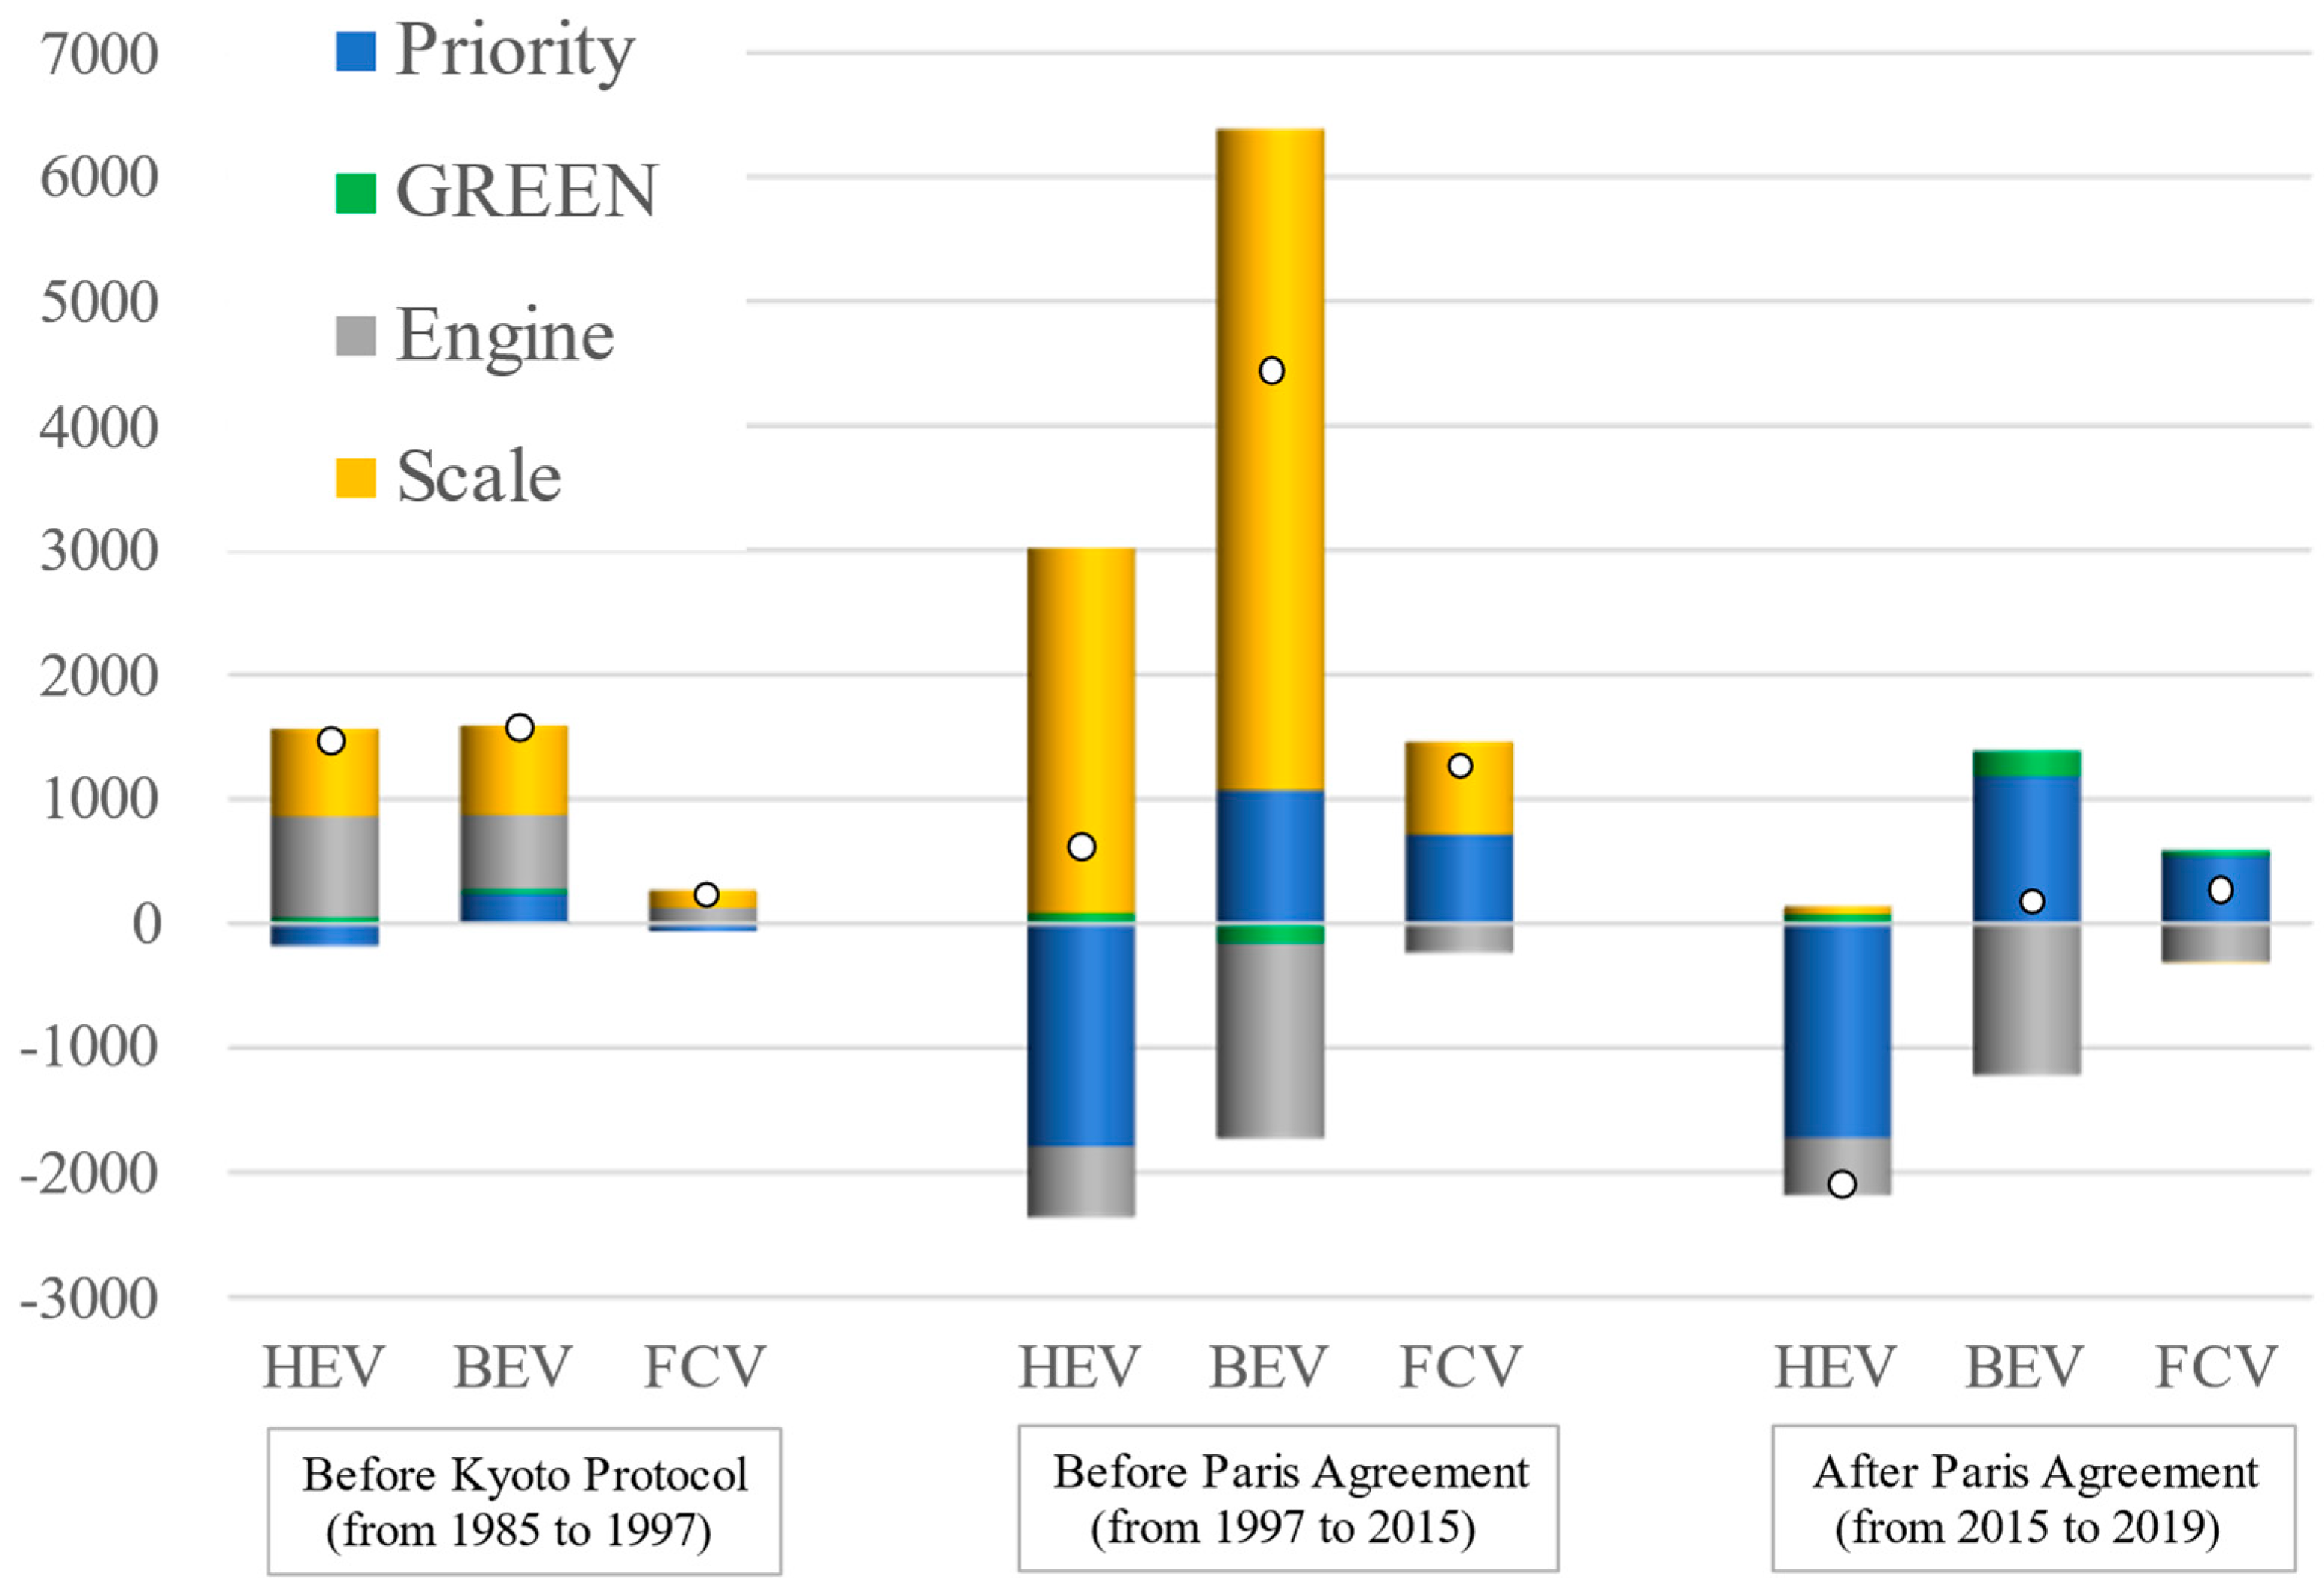
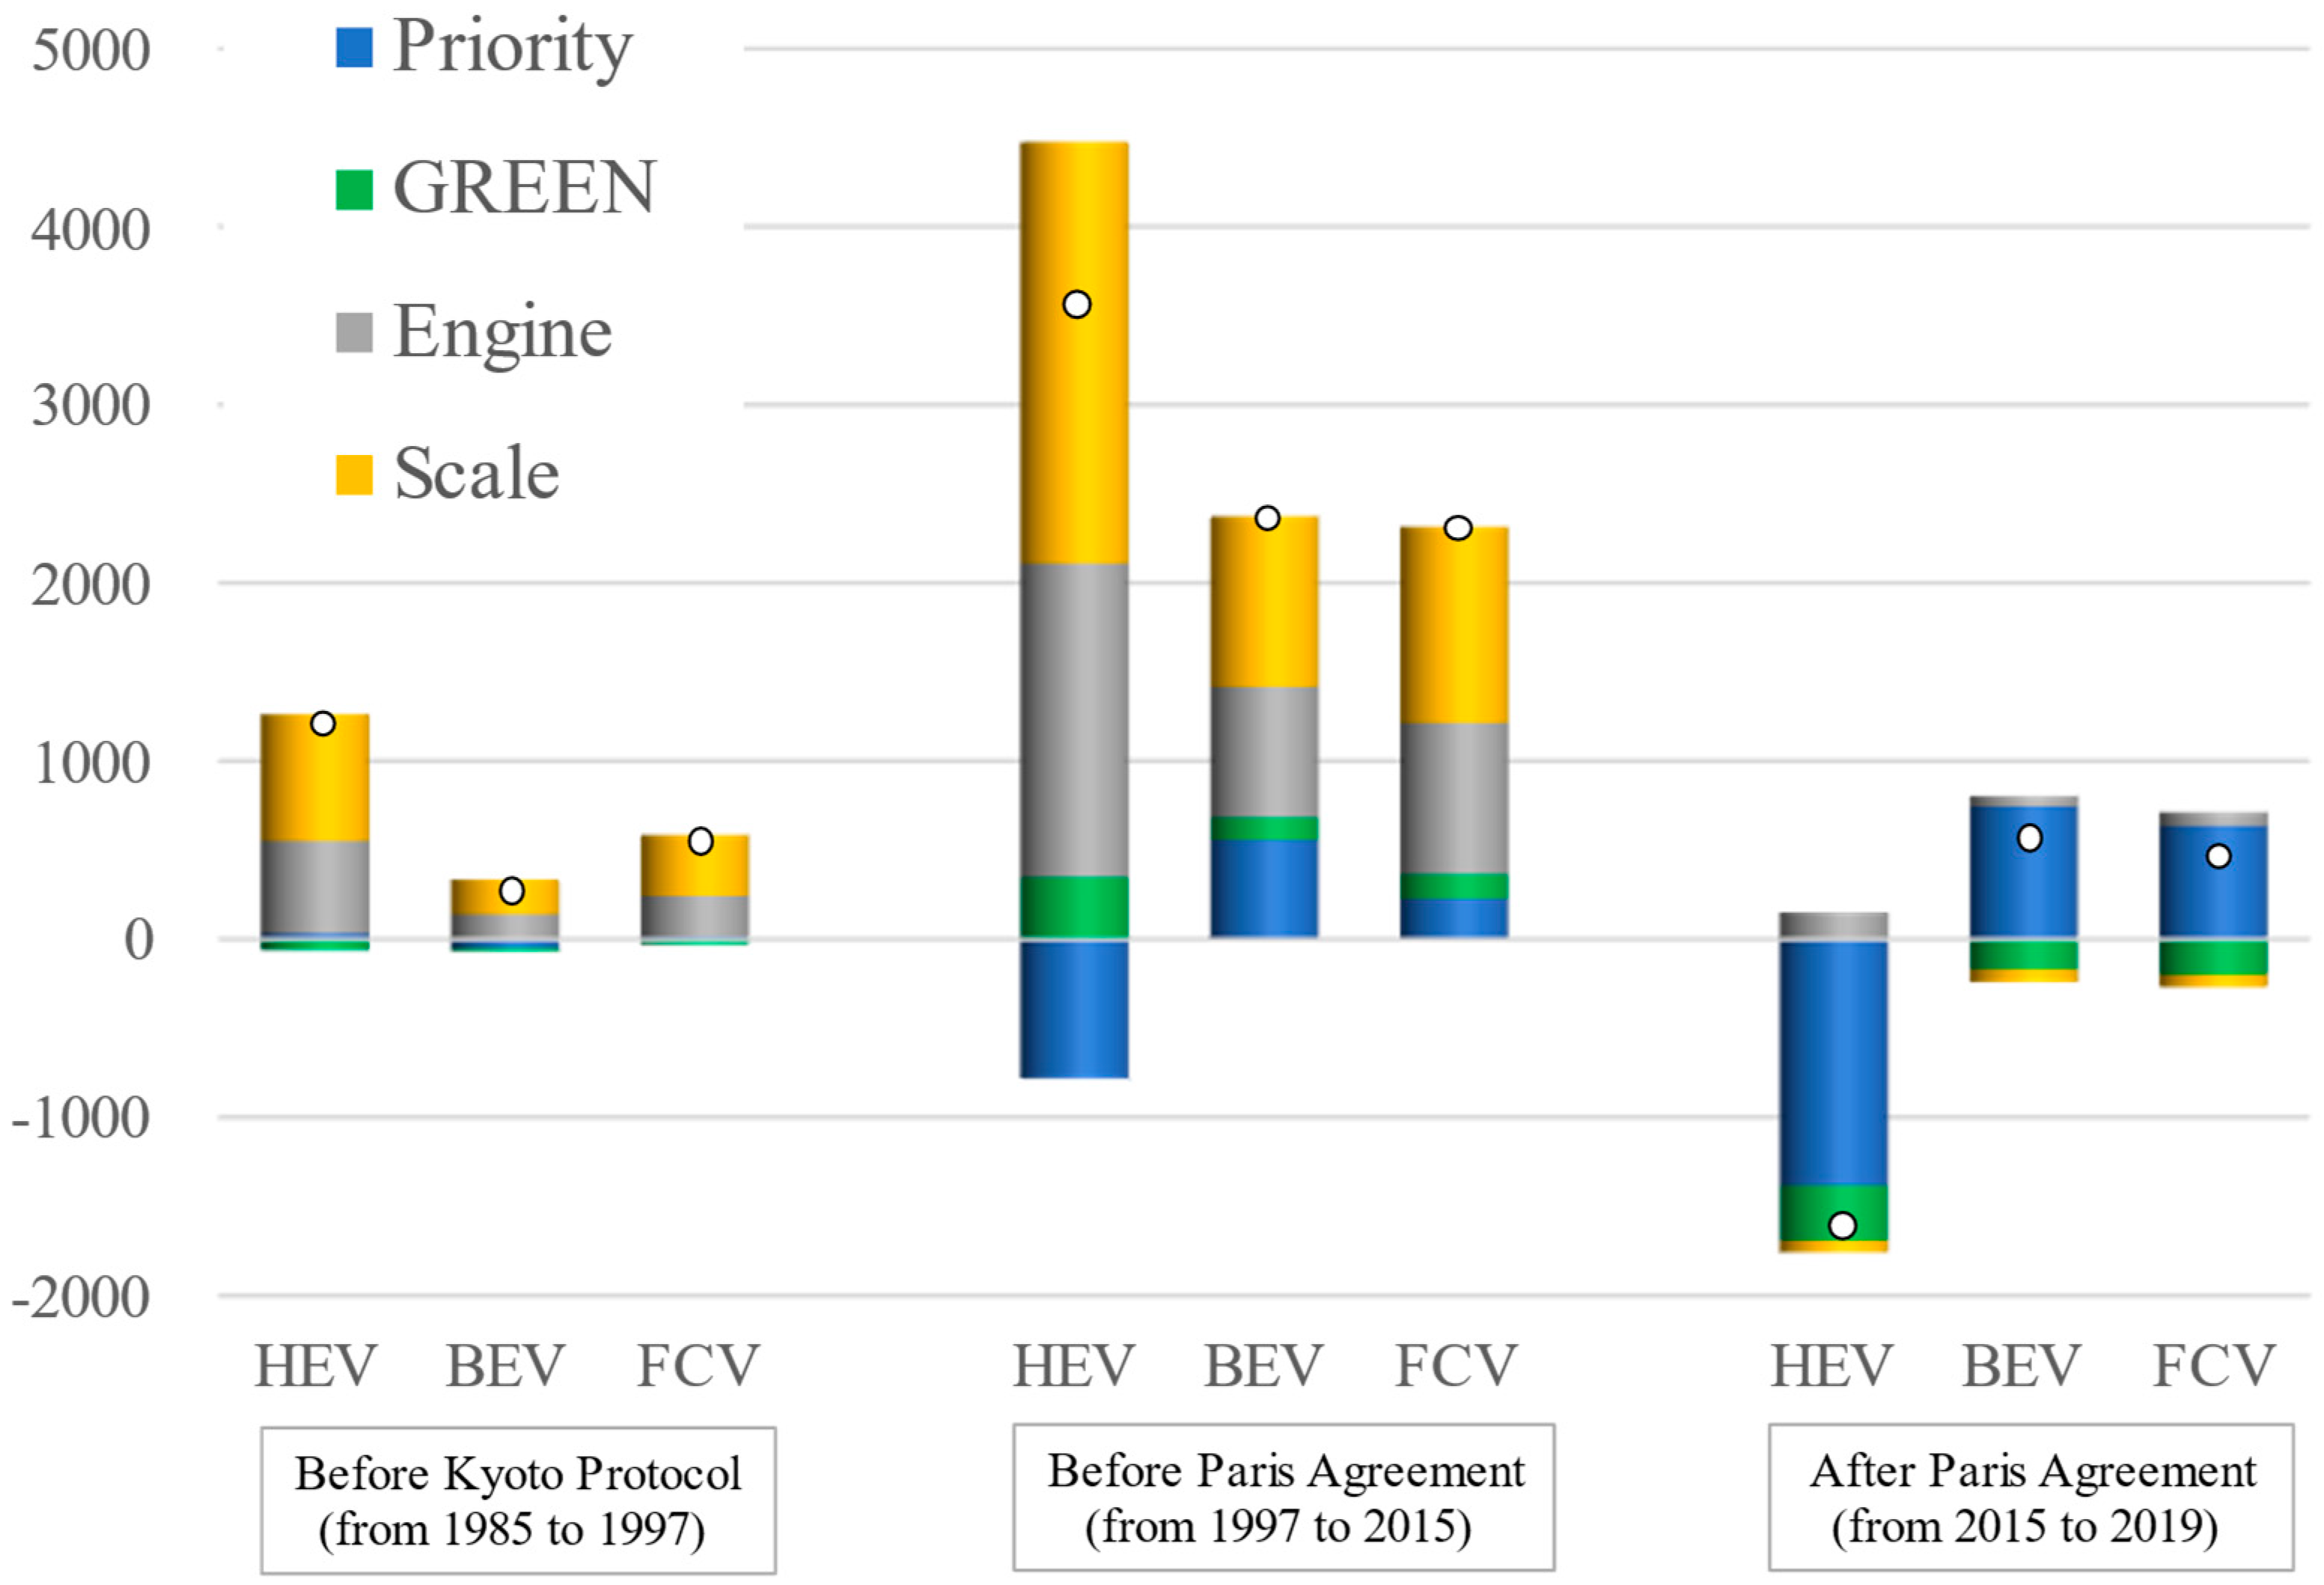
The findings of the decomposition investigation per year in the four nations from various GAET categories are displayed in Figure 3, Figure 4, Figure 5 and Figure 6. The bars (in blue, green, grey, and orange) indicate the change in priority, green engine, engine, and scale. According to these figures, all four countries reflect rising trends in all GAET subtypes. However, the change in decompositions (i.e., priority, green, engine, and scale) for each varies. For China, the increase in total numbers after the Paris Agreement was mainly due to the scale. However, in the other three countries, the key driving factor is priority, and it was shifted from HEV to BEV and FCV.
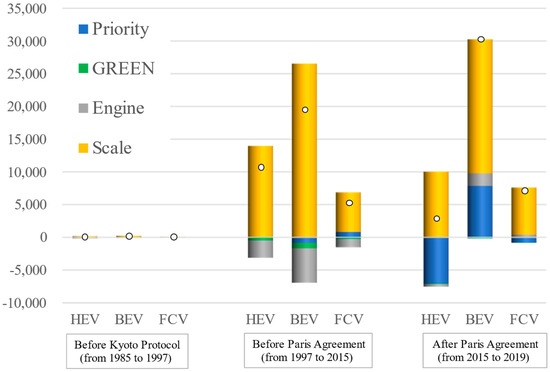
Figure 3.
Results of patent decomposition analysis of HEVs, BEVs, and FCVs in China. Note: Y-axis is standardized with the number of patent changes in the first year of each period as zero. The sum of the bars equals the value of the plotted points.

Figure 4.
Results of patent decomposition analysis of HEVs, BEVs, and FCVs in the U.S. Note: Y-axis is standardized with the number of patent changes in the first year of each period as zero. The sum of the bars equals the value of the plotted points.

Figure 5.
Results of patent decomposition analysis of HEVs, BEVs, and FCVs in Japan. Note: Y-axis is standardized with the number of patent changes in the first year of each period as zero. The sum of the bars equals the value of the plotted points.

Figure 6.
Results of patent decomposition analysis of HEVs, BEVs, and FCVs in Germany. Note: Y-axis is standardized with the number of patent changes in the first year of each period as zero. The sum of the bars equals the value of the plotted points.
For the scales, it is not surprising that as time goes on (since 2005), there are more AET-related patents for novel energy sources in China, especially for BEV (see Figure 3). We consider the following reasons for these breaks. According to [47], “China’s National Medium- and Long-Term Science and Technology Development Planning (2006–2020)” remarkably enhanced Chinese university technology transfer. Specifically, for vehicle development, it indicates low energy consumption and new energy vehicles as priority themes, together with fuel cell technology as cutting-edge technologies [48]. In 2009, China’s Patent Law was amended to make applying for patents for domestic businesses that receive government subsidies simpler [49].
However, not all of the trends in Japan, the USA, and Germany were similar to those in China. Figure 4, Figure 5 and Figure 6 show that, similar to what occurred in China, there was little change in the patents for fuel cell R&D technologies prior to 2015. However, since 2015, Japan, the USA, and Germany have seen the opposite trends from China in terms of green technologies. If we look at the priorities from Figure 3 to Figure 6, we see that China prioritizes BEVs, initially offering substantial subsidies and investing in charging infrastructure. In contrast, Japan, the U.S., and Germany have a more diverse patent focus, reflecting their distinct market strategies and technological strengths. Japan excels in hybrid technologies, the U.S. emphasizes advanced batteries and fuel cells, and Germany invests in various green technologies to maintain its automotive leadership. This variation in patent focus suggests that each country’s green tech development strategy aligns with its specific industry strengths and policy frameworks.
5.2. Regional Analysis with Structure Breaks
To study the variation in different regions, we investigate the four countries with structural break analysis [50]. Table 2 shows the findings of an investigation of structural changes in the number of patents issued and decomposition factors for HEVs, BEVs, and FCVs across the four nations. The four-digit number represents the number of years in which the structural change has occurred and is shown in two ways: upper structural break (U), which is the structural change associated with an increase, and lower structural break (L), which is the structural change associated with a decrease.
Table 2.
Structural breakpoints of patent and decomposed factors in four countries.
We see a lower break in HEV patents and an upper break in BEV patents in China in 2014–2015. As a result, we believe that China’s priority in new energy development has shifted from hybrid to battery. Since 2014, China has begun to accelerate the building of charging facilities, establish and implement charging facility development plans, and include charging facility construction into overall urban planning [51]. Consequently, more companies were motivated to develop more battery and electricity technologies. In the United States, there are higher breaks in both 1994–1995 and 2000–2001, brought about by the change to green technologies. In the United States, the upper split in 2000 was caused by both priority and scale. The green trends before and after 2000 are easily identifiable. This guideline is consistent with the stricter environmental regulations. For example, at the beginning of 2000, the United States Environmental Protection Agency (EPA) enforced a rule regulating automobile air pollution [52]. Additionally, the priority index from 2014–2015 shows that HEV technology had a lower break, while BEV technology had a higher break, similar to China. This is partly due to California’s zero-emission vehicles (ZEV) program, which mandates a specific proportion of zero-emission vehicles, including electric and fuel cell vehicles [53]. We discover that most patents’ higher structural breaks occurred before 2000 in Japan. These breaks, however, cannot be explained by priority, green, engine, or scale. There are no significant structural changes in Japan as they develop each type of technology (e.g., electric and hydrogen) unevenly [54]. In Germany, a lower break in green technology development around 2013 can be attributed to a focus on diesel engine R&D. The GREEN indicator decreased as diesel patents increased from 2001 to 2013, likely due to subsidies for high-performance diesel vehicles. Additionally, Germany’s closure of nuclear facilities in 2011 led to increased coal use, further impacting green technology development [55].
In summary, the strategic divergence among nations is largely attributed to varying environmental regulatory landscapes. China and the United States are shifting their investment from HEV to BEV, a strategic move aligned with their industrial and economic policies that prioritize the transition to cleaner energy sources. This shift is evident in the United States’ energy policy initiatives, such as the Inflation Reduction Act (IRA), which has accelerated the adoption of renewable energy technologies and electric vehicle infrastructure [56]. In China, the rapid economic growth has led to environmental degradation and energy shortages, prompting the nation to seek optimal methods for a “triple win” between energy saving, emission reduction, and economic development [57]. Japan, on the other hand, develops all technologies, both green and non-green, in an unequal manner, reflecting its industrial strategy that balances innovation with existing economic strengths [58]. Germany, which has not invested more in green technologies in recent decades due to internal and external shocks, is now focusing on its National Industrial Strategy 2030 [59]. This strategy aims to safeguard and regain competitiveness and industrial leadership by working with stakeholders to address challenges posed by new technologies and proactive industrial policies [60]. These strategic actions by each country underscore the significant role of industrial and economic policies in shaping the direction of technological investment and development.
6. Conclusions and Policy Implications
6.1. Conclusion Remarks
This study examines the key driving factors behind patent inventions in green automotive engine technology across four countries (China, the United States, Japan, and Germany) from 1985 to 2019. We developed a decomposition framework with a structural break approach to evaluate research and development efforts. This framework explicitly considers the prioritization of GAET technologies as dictated by prevailing R&D policies for sustainable development. Considering the research gaps in previous studies, we have the following objectives: (1) Identify the trends of adopting green (instead of non-green) investment patterns for each country based on its growth stage. (2) Identify which types of green automotive engine technologies for each country to research and develop during their green transformation. The key findings are summarized below.
In the context of green transformation, China and the United States are strategically redirecting their investments from hybrid electric vehicles (HEVs) to battery electric vehicles (BEVs) due to increasingly stringent environmental regulations and their commitment to sustainability goals. This shift is driven by policies such as China’s aggressive push for new energy vehicles to reduce air pollution and the United States’ Inflation Reduction Act, which provides substantial incentives for the development and adoption of clean energy technologies, including BEVs. Japan, meanwhile, adopts a more balanced yet uneven approach to technology development. It continues to invest in a wide range of technologies, both green and non-green, and across various energy sources, including electric and hydrogen. This strategy reflects Japan’s focus on maintaining a diverse technological portfolio to ensure economic stability and innovation across different sectors, allowing it to stay competitive and adaptable in the global market. Germany, known for its strong industrial base, has not made significant investments in green technologies in recent years. This could be attributed to various internal and external economic challenges that have influenced its industrial strategy. However, there are signs of a potential shift, with initiatives like increased financial support from the European Investment Bank for green and innovative projects suggesting that Germany may be poised to enhance its focus on sustainable technologies in the future.
6.2. Policy Implications
This study has several key implications for developed and emerging countries. Based on our research findings, we gain deep insights into the research priority of GAET technological invention. The main elements encouraging private enterprises to support new technological discoveries are shifts in research objectives. To be more specific, governments in emerging countries should develop supporting policies to encourage private companies to prioritize GAET as well as develop relevant patents to gain the scale effect of R&D activities. Such governmental support on IP protection and R&D is especially important for less developed intellectual property markets. Particularly in emerging and developing countries where intellectual property markets are not well developed, policies on IP protection and support to encourage R&D can be expected to increase the scale of R&D activities. On the other hand, developed countries that have already invested a large amount of budget in R&D can be expected to accelerate patent invention by shifting the allocation of money to GAET development. According to the study’s findings, PRIORITY and GREEN are significant factors in the rise of GAET patents in Germany and the US. Additionally, in developed countries, incentives such as tax breaks or subsidies for R&D expenditures for certain technological developments, as well as extended terms of intellectual property protection, can be expected to have the effect of increasing GAET patents.
As stated before, R&D for GAETs varies among countries and across time. To the best of our knowledge, this is the first study to use decomposition analysis and structural breaks on numerical data to evaluate green automotive engine patent applications. Comparing the scale effect and research activity priorities over time provides valuable insights into the variations in patent application filings.
6.3. Limitation and Future Work
This study primarily relies on patent data from 1985 to 2019, which may not capture the most recent developments and trends in green automotive engine technologies. Additionally, the analysis focuses on four major patent offices, potentially overlooking contributions from other significant regions. Future studies could incorporate more recent patent data to reflect the latest advancements in green automotive technologies. Additionally, including data from a broader range of countries and patent offices would provide a more comprehensive global perspective.
Also, the research examines a limited range of green technologies, such as battery electric, hybrid electric, and fuel cell vehicles. Other emerging technologies, like advanced combustion engines or alternative fuel systems, may also play crucial roles in sustainable transportation but are not extensively covered.
Author Contributions
Z.Z.: investigation, methodology, data curation, software, writing—original draft preparation. H.F.: conceptualization, visualization, validation, writing—reviewing and editing. All authors have read and agreed to the published version of the manuscript.
Funding
This research was funded by the Jiangsu Provincial Department of Education, grant number: 2024SJYB1013.
Institutional Review Board Statement
Not applicable.
Informed Consent Statement
Not applicable.
Data Availability Statement
The original contributions presented in the study are included in the article; further inquiries can be directed to the corresponding author.
Conflicts of Interest
The authors declare no conflicts of interest.
Appendix A. Description of Patent Data
Data were collected using the IPC code. See Table A1 for detailed information.
Table A1.
Description of IPC patent classes.
Table A1.
Description of IPC patent classes.
| IPC | Description |
|---|---|
| B60K | Arrangement or mounting of propulsion units or transmissions in vehicles; arrangement or mounting of plural diverse prime movers in vehicles; auxiliary drives for vehicles; instrumentation or dashboards for vehicles; arrangements in connection with cooling, air intake, gas exhaust or fuel supply of propulsion units in vehicles |
| B60L | Propulsion of electrically propelled vehicles |
| B60W | Conjoint control of vehicle sub-units of different types or different functions; control systems specially adapted for hybrid vehicles; road vehicle drive control systems for purposes not related to the control of a particular sub-unit |
| F02B | Internal-combustion piston engines; combustion engines in general |
| F02D | Controlling combustion engines |
| F02F | Cylinders, pistons, or casings for combustion engines; arrangements of sealings in combustion engines |
| F02M | Supplying combustion engines, in general, with combustible mixtures or constituents |
| F02N | Starting of combustion engines; starting aids for such engines, not otherwise provided for |
| F02P | Ignition, other than compression ignition, for internal combustion engines; testing of ignition timing in compression–ignition engines |
| H01M | Processes or means, e.g., batteries, for the direct conversion of chemical energy into electrical energy |
Source: World Intellectual Property Organization https://www.wipo.int/classifications/ipc/en/ (accessed on 1 May 2023). Overlapping items (i.e., a patent belonging to multiple IPC codes) will be counted multiple times.
References
- Avadikyan, A.; Llerena, P. A real options reasoning approach to hybrid vehicle investments. Technol. Forecast. Soc. Change 2010, 77, 649–661. [Google Scholar] [CrossRef]
- Ibanez-Fores, V.; Bovea, M.D.; Perez-Belis, V. A holistic review of applied methodologies for assessing and selecting the optimal technological alternative from a sustainability perspective. J. Clean. Prod. 2014, 70, 259–281. [Google Scholar] [CrossRef]
- Fujii, H.; Managi, S. Decomposition analysis of sustainable green technology inventions in China. Technol. Forecast. Soc. Change 2019, 139, 10–16. [Google Scholar] [CrossRef]
- Yuan, X.; Cai, Y. Forecasting the development trend of low emission vehicle technologies: Based on patent data. Technol. Forecast. Soc. Change 2021, 166, 120651. [Google Scholar] [CrossRef]
- Lin, C. 3 Drivers of China’s Booming Electric Vehicle Market. Operations Strategy. 2024. Available online: https://hbr.org/2024/01/3-drivers-of-chinas-booming-electric-vehicle-market (accessed on 1 February 2024).
- Chen, Y.H.; Chen, C.Y.; Lee, S.C. Technology forecasting and patent strategy of hydrogen energy and fuel cell technologies. Int. J. Hydrogen Energy 2011, 36, 6957–6969. [Google Scholar] [CrossRef]
- Sinigaglia, T.; Martins, M.E.S.; Siluk, J.C.M. The technological evolution of internal combustion engine vehicle: A patent data analysis. Appl. Energy 2022, 306, 118003. [Google Scholar] [CrossRef]
- Dijk, M.; Yarime, M. The emergence of hybrid-electric cars: Innovation path creation through co-evolution of supply and demand. Technol. Forecast. Soc. Change 2010, 77, 1371–1390. [Google Scholar] [CrossRef]
- Hashmi, A.R.; Biesebroeck, J.V. The relationship between market structure and innovation in industry equilibrium: A case study of the global automobile industry. Rev. Econ. Stat. 2016, 98, 192–208. [Google Scholar] [CrossRef]
- Bhatia, M.S.; Jakhar, S.K. The effect of environmental regulations, top management commitment, and organizational learning on green product innovation: Evidence from the automobile industry. Bus. Strategy Environ. 2021, 30, 3907–3918. [Google Scholar] [CrossRef]
- Ruoso, A.C.; Ribeiro, J.L.D. The influence of countries’ socioeconomic characteristics on the adoption of electric vehicle. Energy Sustain. Dev. 2022, 71, 251–262. [Google Scholar] [CrossRef]
- Dogan, E.; Ozturk, I. The influence of renewable and non-renewable energy consumption and real income on CO2 emissions in the USA: Evidence from structural break tests. Environ. Sci. Pollut. Res. 2017, 24, 10846–10854. [Google Scholar] [CrossRef]
- Fujii, H.; Yoshida, K.; Sugimura, K. Research and development strategy in biological technologies: A patent data analysis of Japanese manufacturing firms. Sustainability 2016, 8, 351. [Google Scholar] [CrossRef]
- WIPO. Patent Landscape Report-Hydrogen Fuel Cells in Transportation. 2022. Available online: https://www.wipo.int/publications/en/details.jsp?id=4604 (accessed on 10 April 2023).
- De Stefano, M.C.; Montes-Sancho, M.J.; Busch, T. A natural resource-based view of climate change: Innovation challenges in the automobile industry. J. Clean. Prod. 2016, 139, 1436–1448. [Google Scholar] [CrossRef]
- Fischer, C.; Newell, R.G. Environmental and technology policies for climate mitigation. J. Environ. Econ. Manag. 2008, 55, 142–162. [Google Scholar] [CrossRef]
- Zhao, J.H.; Zeng, D.L.; Che, L.P.; Zhou, T.W.; Hu, J.Y. Research on the profit change of new energy vehicle closed-loop supply chain members based on government subsidies. Environ. Technol. Innov. 2020, 19, 100937. [Google Scholar] [CrossRef]
- Burke, A.F.; Zhao, J.; Miller, M.R.; Sinha, A.; Fulton, L.M. Projections of the costs of medium-and heavy-duty battery-electric and fuel cell vehicles (2020–2040) and related economic issues. Energy Sustain. Dev. 2023, 77, 101343. [Google Scholar] [CrossRef]
- Kim, J.E. Energy security and climate change: How oil endowment influences alternative vehicle innovation. Energy Policy 2014, 66, 400–410. [Google Scholar] [CrossRef]
- Plan, R. Communication from the Commission to the European Parliament, the European Council, the Council, the European Economic and Social Committee and the Committee of the Regions; European Commission: Brussels, Belgium, 2018. [Google Scholar]
- da Silva Hyldmo, H.; Rye, S.A.; Vela-Almeida, D. A globally just and inclusive transition? Questioning policy representations of the European Green Deal. Glob. Environ. Change 2024, 89, 102946. [Google Scholar] [CrossRef]
- Witajewska-Baltvilka, B.; Helepciuc, F.E.; Mangalagiu, D.; Todor, A. Politicization of climate change and Central and Eastern European countries’ stance towards the European Green Deal. Glob. Environ. Change 2024, 89, 102932. [Google Scholar] [CrossRef]
- Gauto, M.A.; Carazzolle, M.F.; Rodrigues ME, P.; de Abreu, R.S.; Pereira, T.C.; Pereira GA, G. Hybrid vigor: Why hybrids with sustainable biofuels are better than pure electric vehicles. Energy Sustain. Dev. 2023, 76, 101261. [Google Scholar] [CrossRef]
- Van den Hoed, R. Sources of radical technological innovation: The emergence of fuel cell technology in the automotive industry. J. Clean. Prod. 2007, 15, 1014–1021. [Google Scholar] [CrossRef]
- Chan, C.C. The state of the art of electric, hybrid, and fuel cell vehicles. Proc. IEEE 2007, 95, 704–718. [Google Scholar] [CrossRef]
- Rashid, S.; Pagone, E. Cradle-to-Grave Lifecycle Environmental Assessment of Hybrid Electric Vehicles. Sustainability 2023, 15, 11027. [Google Scholar] [CrossRef]
- Koroma, M.S.; Costa, D.; Philippot, M.; Cardellini, G.; Hosen, M.S.; Coosemans, T.; Messagie, M. Life cycle assessment of battery electric vehicles: Implications of future electricity mix and different battery end-of-life management. Sci. Total Environ. 2022, 831, 154859. [Google Scholar] [CrossRef] [PubMed]
- Cho, Y. Investigating the merge of exploratory and normative technology forecasting methods. In 2013 Proceedings of PICMET’13: Technology Management in the IT-Driven Services (PICMET), San Jose, CA, USA, 28 July–1 August 2013; IEEE: New York, NY, USA, 2013; pp. 2083–2092. [Google Scholar]
- Choi, C.; Park, Y. Monitoring the organic structure of technology based on the patent development paths. Technol. Forecast. Soc. Change 2009, 76, 754–768. [Google Scholar] [CrossRef]
- Hirschey, M.; Richardson, V.J. Are scientific indicators of patent quality useful to investors? J. Empir. Financ. 2004, 11, 91–107. [Google Scholar] [CrossRef]
- Lee, C.; Kang, B.; Shin, J. Novelty-focused patent mapping for technology opportunity analysis. Technol. Forecast. Soc. Change 2015, 90, 355–365. [Google Scholar] [CrossRef]
- Levitas, E.F.; McFadyen, M.A.; Loree, D. Survival and the introduction of new technology: A patent analysis in the integrated circuit industry. J. Eng. Technol. Manag. 2006, 23, 182–201. [Google Scholar] [CrossRef]
- Nerheim, A.R. Maritime LNG fuel systems for small vessels—A survey of patents. Transp. Res. Part D Transp. Environ. 2023, 119, 103766. [Google Scholar] [CrossRef]
- Oltra, V.; Saint Jean, M. Variety of technological trajectories in low emission vehicles (LEVs): A patent data analysis. J. Clean. Prod. 2009, 17, 201–213. [Google Scholar] [CrossRef]
- Bonilla, D.; Bishop, J.D.; Axon, C.J.; Banister, D. Innovation, the diesel engine and vehicle markets: Evidence from OECD engine patents. Transp. Res. Part D Transp. Environ. 2014, 27, 51–58. [Google Scholar] [CrossRef]
- Aaldering, L.J.; Leker, J.; Song, C.H. Competition or collaboration?–analysis of technological knowledge ecosystem within the field of alternative powertrain systems: A patent-based approach. J. Clean. Prod. 2019, 212, 362–371. [Google Scholar] [CrossRef]
- Phirouzabadi, A.M.; Blackmore, K.; Savage, D.; Juniper, J. On the coexistence of positive and negative externalities in the inter-powertrain relationships. J. Clean. Prod. 2020, 277, 124118. [Google Scholar] [CrossRef]
- Lin, S.; Long, X.; Huang, J.; Gao, R. Green technology diversification, technology vertical spillovers, and energy intensity in Chinese cities. Energy Sustain. Dev. 2023, 76, 101281. [Google Scholar] [CrossRef]
- Fujii, H.; Managi, S. Research and development strategy for environmental technology in Japan: A comparative study of the private and public sectors. Technol. Forecast. Soc. Change 2016, 112, 293–302. [Google Scholar] [CrossRef]
- Wesseling, J.H.; Faber, J.; Hekkert, M.P. How competitive forces sustain electric vehicle development. Technol. Forecast. Soc. Change 2024, 81, 154–164. [Google Scholar] [CrossRef]
- Ha, S.H.; Liu, W.; Cho, H.; Kim, S.H. Technological advances in the fuel cell vehicle: Patent portfolio management. Technol. Forecast. Soc. Change 2015, 100, 277–289. [Google Scholar] [CrossRef]
- Ang, B.W.; Zhang, F.Q.; Choi, K.H. Factorizing changes in energy and environmental indicators through decomposition. Energy 1998, 23, 489–495. [Google Scholar] [CrossRef]
- Yamashita, A.S.; Fujii, H. Trend and priority change of climate change mitigation technology in the global mining sector. Resour. Policy 2022, 78, 102870. [Google Scholar] [CrossRef]
- Fujii, H.; Managi, S. Trends and priority shifts in artificial intelligence technology invention: A global patent analysis. Econ. Anal. Policy 2018, 58, 60–69. [Google Scholar] [CrossRef]
- Chen, Y.; Lin, B. Decomposition analysis of patenting in renewable energy technologies: From an extended LMDI approach perspective based on three Five-Year Plan periods in China. J. Clean. Prod. 2020, 269, 122402. [Google Scholar] [CrossRef]
- Baumann, M.; Domnik, T.; Haase, M.; Wulf, C.; Emmerich, P.; Rösch, C.; Zapp, P.; Naegler, T.; Weil, M. Comparative patent analysis for the identification of global research trends for the case of battery storage, hydrogen and bioenergy. Technol. Forecast. Soc. Change 2021, 165, 120505. [Google Scholar] [CrossRef]
- Fong, P.S.W.; Chang, X.; Chen, Q. Faculty patent assignment in the Chinese mainland: Evidence from the top 35 patent application universities. J. Technol. Transf. 2018, 43, 69–95. [Google Scholar] [CrossRef]
- SC. China’s National Medium and Long Term Science and Technology Development Planning (In Chinese), The State Council of the People’s Republic of China. 2006. Available online: http://www.gov.cn/gongbao/content/2006/content_240244.htm (accessed on 19 September 2022).
- Feng, X. The interaction between enhancing the capacity for independent innovation and patent protection: A perspective on the third amendment to the patent law of PR China. Pittsburgh J. Technol. Law Policy 2009, 9, 1. [Google Scholar]
- Bai, J.; Perron, P. Computation and analysis of multiple structural change models. J. Appl. Econom. 2003, 18, 1–22. [Google Scholar] [CrossRef]
- SC. Guiding Opinions on Accelerating the Promotion and Application of New Energy Vehicles (In Chinese), The State Council of the People’s Republic of China. 2014. Available online: http://www.gov.cn/xinwen/2014-07/21/content_2720944.htm (accessed on 19 September 2022).
- EPA. Final Rule for Control of Air Pollution from New Motor Vehicles: Tier 2 Motor Vehicle Emissions Standards and Gasoline Sulfur Control Requirements, The U.S. Environmental Protection Agency. 2000. Available online: https://www.epa.gov/regulations-emissions-vehicles-and-engines/final-rule-control-air-pollution-new-motor-vehicles-tier (accessed on 19 December 2022).
- Zhu, Y.; Wu, J.; Gaidai, O. The technology innovation of hybrid electric vehicles: A patent-based study. World Electr. Veh. J. 2024, 15, 329. [Google Scholar] [CrossRef]
- Sun, M.; Tong, T.; Jiang, M.; Zhu, J.X. Innovation trends and evolutionary paths of green fuel technologies in maritime field: A global patent review. Int. J. Hydrogen Energy 2024, 71, 528–540. [Google Scholar] [CrossRef]
- BP. BP Statistical Review of World Energy 2015. 2015. Available online: http://www.bp.com/statisticalreview (accessed on 19 September 2022).
- Bang, G. The US Inflation Reduction Act: Climate policy as economic crisis response. Environ. Politics 2024, 1–22. [Google Scholar] [CrossRef]
- Zhou, X.; Cai, Z.; Tan, K.H.; Zhang, L.; Du, J.; Song, M. Technological innovation and structural change for economic development in China as an emerging market. Technol. Forecast. Soc. Change 2021, 167, 120671. [Google Scholar] [CrossRef]
- Zhao, Z.; Huang, R.; Zhang, Y.; Shiga, Y.; Shaw, R. Assessing the Role of Climate Transition Bonds in Advancing Green Transformations in Japan. Climate 2024, 12, 201. [Google Scholar] [CrossRef]
- Germann, J. Global rivalries, corporate interests and Germany’s ‘National Industrial Strategy 2030’. Rev. Int. Political Econ. 2023, 30, 1749–1775. [Google Scholar] [CrossRef]
- Diversigy. Exploring Global Energy Investment Trends: Insights for Commercial Buyers and Stakeholders, Diversegy. 2024. Available online: https://diversegy.com/global-energy-investment-trends-2025/ (accessed on 4 January 2025).

Disclaimer/Publisher’s Note: The statements, opinions and data contained in all publications are solely those of the individual author(s) and contributor(s) and not of MDPI and/or the editor(s). MDPI and/or the editor(s) disclaim responsibility for any injury to people or property resulting from any ideas, methods, instructions or products referred to in the content. |
© 2025 by the authors. Licensee MDPI, Basel, Switzerland. This article is an open access article distributed under the terms and conditions of the Creative Commons Attribution (CC BY) license (https://creativecommons.org/licenses/by/4.0/).