
The Role of Augmented and Virtual Reality in Shaping Retail Marketing: A Meta-Analysis


Abstract
1. Introduction
2. Conceptual Framework and Hypotheses Development
2.1. Augmented Reality (AR)
2.2. Virtual Reality (VR)
2.3. Theoretical Background and Conceptual Framework
2.3.1. Consequences of the Customer Shopping Journey
2.3.2. Antecedents of the Customer Shopping Journey
2.3.3. Moderators
3. Method
3.1. Data Collection
3.2. Data Coding
3.3. Data Analysis
4. Results
4.1. TSSEM Stage 1 Results
4.2. TSSEM Stage 2 Results
4.3. Moderate Effect Analysis
5. Conclusions
5.1. Theoretical Contributions
5.2. Managerial Implications
5.3. Limitations
5.4. Future Research Agenda
Author Contributions
Funding
Conflicts of Interest
Appendix A

| Construct | Description | Common Aliases | Source | Expected Effect |
|---|---|---|---|---|
| Consequences | ||||
| Customer Experience (CX) | The subjective and internal response of customers who have direct (e.g., purchasing, service, and use) or indirect (e.g., WOM recommendations, criticisms, and advertisements) contact with companies [53]. | User experience, rapport experience, flow experience | Positive | |
| Attitude (ATT) | The extent to which a person has a favorable or unfavorable evaluation or assessment of the behavior under discussion [56]. | Attractiveness, satisfaction, wow effect, trust | [56] | Positive |
| Intention (INT) | Thought to capture the motivational factors that affect the behavior [56]. | Willingness to pay | [56] | Positive |
| Loyalty (LOY) | Customers become or remain loyal to a brand [26]. | [26] | ||
| Antecedents | ||||
| Perceived system quality (PSQ) | The perceived quality of the technology system, including augmented quality, display fidelity, and immersion degree. | Vividness, immersive, display fidelity, virtuality, media richness, sensory pleasantness, anthropomorphism, interface design, aesthetic quality, perceived store prestige, graphic style, esthetic | [3] | Positive |
| Presence (PRE) | The increased intimacy, social interaction [60], and the sense of being together [61]. | Tele-presence, socializing, customization, and personalization, consumer engagement | [60,61] | Positive |
| Perceived novelty (PN) | The extent to which each response was rated unique, new, and different [63]. | Curiosity, innovativeness; inspiration | [63] | Positive |
| Perceived ease of use (PEU) | Customers’ beliefs about the ease of using the information technology and whether the effort they put into the usage is higher than the performance improved by using it [65]. | Complexity [93] | [65] | Positive |
| Perceived usefulness (PU) | Customers’ beliefs about the usefulness of information technology enhancing their performance or not [65]. | [65] | Positive | |
| Informativeness (INF) | Customers search for information about the product, aiming to increase their confidence. | Perceived informativity, WOM, branding, advertisement, media richness | ||
| Perceived enjoyment (PE) | The degree to which an activity using an information system is enjoyable [67]. | Pleasure, predicted happiness, emotional engagement | [67] | Positive |
| Hedonic values (HV) | The extent of pleasure derived from the multi-sensory, fantastical, and emotional aspects of the product usage experience [68,69] | Entertainment, hedonic benefits, hedonic gratification | [68,69] | Positive |
| Perceived risk (PR) | Perceived risk with adopting interactive technologies in metaverse retailing, including perceived product risk and privacy issues. | [94,95,96] | Negative | |
| Utilitarian values (UV) | The functional values from using technology [5]. | Pragmatic quality, functional value, utilitarian gratification | [5] | Positive |
| Moderator | Category | Dummy Variables | Description |
|---|---|---|---|
| Tech type | AR VR and others | AR = 1 VR and others = 0 | Whether participants experience through VR or AR or other technologies. |
| Product type | Non-digital Digital | Non-digital = 1 Digital and others = 0 | Whether participants experience digital or non-digital or no products. |
| Year | 2021 and after 2021 Before 2021 | 2021 and after 2021 = 1 Before 2021 = 0 | Whether this paper published before 2021 or not. |
| Journal ranking | Group 1 (Relative higher ranking) Group 2 (Others) | Relative higher ranking = 1 Others = 0 | Whether this paper published in higher ranked journal (i.e., ABDC-A and above, ABS-3 and above) or not. |
| Sample type | Only student Not only and non-student | Only student = 1 Not only and non-student = 0 | Whether the participants are only students or not only and non-students. |
| ID | Title | Author | Year | Journal |
|---|---|---|---|---|
| 1 | The personalization-privacy paradox: Consumer interaction with smart technologies and shopping mall loyalty | Ameen, Hosany & Paul [94] | 2022 | Computers in Human Behavior |
| 2 | Role of augmented reality in changing consumer behavior and decision making: Case of Pakistan | Kazmi et al. [72] | 2021 | Sustainability (Switzerland) |
| 3 | The mediation effect of marketing activities toward augmented reality: the perspective of extended customer experience | Chen et al. [97] | 2022 | Journal of Hospitality and Tourism Technology |
| 4 | Retail consumers’ behavioral intention to use augmented reality mobile apps in Pakistan | Saleem et al. [73] | 2022 | Journal of Internet Commerce |
| 5 | Mechanism linking AR-based presentation mode and consumers’ responses: A moderated serial mediation model | Han et al. [96] | 2021 | Journal of Theoretical and Applied Electronic Commerce Research |
| 6 | Enhancing brick-and-mortar store shopping experience with an augmented reality shopping assistant application using personalized recommendations and explainable artificial intelligence | Zimmermann et al. [98] | 2022 | Journal of Research in Interactive Marketing |
| 7 | The effect of augmented reality on purchase intention of beauty products: The roles of consumers’ control | Whang et al. [36] | 2021 | Journal of Business Research |
| 8 | The adoption of virtual reality devices: The technology acceptance model integrating enjoyment, social interaction, and strength of the social ties | Lee, Kim & Choi [99] | 2019 | Telematics and Informatics |
| 9 | How augmented reality media richness influences consumer behavior | de Amorim et al. [32] | 2022 | International Journal of Consumer Studies |
| 10 | Augmented reality’s perceived immersion effect on the customer shopping process: Decision-making quality and privacy concerns | Sengupta & Cao [100] | 2022 | International Journal of Retail and Distribution Management |
| 11 | Extending the technology acceptance model to explain how perceived augmented reality affects consumers’ perceptions | Oyman, Bal & Ozer [101] | 2022 | Computers in Human Behavior |
| 12 | Shopping in the digital world: Examining customer engagement through augmented reality mobile applications | McLean & Wilson [102] | 2019 | Computers in Human Behavior |
| 13 | Virtual reality in new product development: Insights from prelaunch sales forecasting for durables. | Harz, Hohenberg & Homburg [103] | 2022 | Journal of Marketing |
| 14 | Blending the real world and the virtual world: Exploring the role of flow in augmented reality experiences | Brannon Barhorst et al. [104] | 2021 | Journal of Business Research |
| 15 | The impact of representation media on customer engagement in tourism marketing among millennials | Willems, Brengman & Van Kerrebroeck [39] | 2019 | European Journal of Marketing |
| 16 | Enhancing the online decision-making process by using augmented reality: A two country comparison of youth markets | Pantano, Rese & Baier [105] | 2017 | Journal of Retailing and Consumer Services |
| 17 | The effects of augmented reality mobile app advertising: Viral marketing via shared social experience | Sung (Christine) [106] | 2021 | Journal of Business Research |
| 18 | Understanding the diffusion of virtual reality glasses: The role of media, fashion and technology | Herz & Rauschnabel [5] | 2019 | Technological Forecasting and Social Change |
| 19 | How mobile augmented reality applications affect continuous use and purchase intentions: A cognition-affect-conation perspective | Qin, Osatuyi & Xu [107] | 2021 | Journal of Retailing and Consumer Services |
| 20 | User interfaces and consumer perceptions of online stores: The role of telepresence. | Suh & Chang [108] | 2006 | Behavior and Information Technology |
| 21 | “Yes, we do. Why not use augmented reality?” Customer responses to experiential presentations of AR-based applications | Hsu, Tsou & Chen [71] | 2021 | Journal of Retailing and Consumer Services |
| 22 | Enhancing the sneakers shopping experience through virtual fitting using augmented reality | Rhee & Lee [109] | 2021 | Sustainability (Switzerland) |
| 23 | Mobile augmented reality in electronic commerce: Investigating user perception and purchase intent amongst educated young adults | Haile & Kang [110] | 2020 | Sustainability (Switzerland) |
| 24 | Augmented reality advertising via a mobile app | Sung, Han & Choi [111] | 2022 | Psychology and Marketing |
| 25 | Telepresence, time distortion, and consumer traits of virtual reality shopping | Han et al. [112] | 2020 | Journal of Business Research |
| 26 | Beyond the gimmick: How affective responses drive brand attitudes and intentions in augmented reality marketing | Zanger, Meißner & Rauschnabel [113] | 2022 | Psychology and Marketing |
| 27 | Virtual try-on: How to enhance consumer experience? | Bialkova & Barr [114] | 2022 | 2022 IEEE Conference on Virtual Reality and 3D User Interfaces Abstracts and Workshops (VRW), Virtual Reality and 3D User Interfaces Abstracts and Workshops (VRW), 2022 IEEE Conference on, VRW |
| 28 | A virtual market in your pocket: How does mobile augmented reality (MAR) influence consumer decision-making? | Qin, Peak & Prybutok [115] | 2021 | Journal of Retailing and Consumer Services |
| 29 | An adoption framework for mobile augmented reality games: The case of Pokémon Go | Rauschnabel, Rossmann & tom Dieck [116] | 2017 | Computers in Human Behavior |
| 30 | Perception is reality… How digital retail environments influence brand perceptions through presence | Cowan et al. [117] | 2021 | Journal of Business Research |
| 31 | Nostalgia beats the wow-effect: Inspiration, awe and meaningful associations in augmented reality marketing | Hinsch, Felix & Rauschnabel [33] | 2020 | Journal of Retailing and Consumer Services |
| 32 | Effects of physical, non-immersive virtual, and immersive virtual store environments on consumers’ perceptions and purchase behavior | Lombart et al. [118] | 2020 | Computers in Human Behavior |
| 33 | Gathering pre-purchase information for a cruise vacation with virtual reality: the effects of media technology and gender | Martínez-Molés et al. [119] | 2022 | International Journal of Contemporary Hospitality Management |
| 34 | Measuring the content characteristics of videos featuring augmented reality advertising campaigns | Feng & Xie [93] | 2018 | Journal of Research in Interactive Marketing |
| 35 | Shopping with augmented reality: How wow-effect changes the equations! | Arghashi [120] | 2022 | Electronic Commerce Research and Applications |
| 36 | The influence of flow experience in the augmented reality context on psychological ownership | Yuan et al. [64] | 2021 | International Journal of Advertising |
| 37 | Does virtual reality attract visitors? The mediating effect of presence on consumer response in virtual reality tourism advertising | Lo & Cheng [121] | 2020 | Information Technology and Tourism |
| 38 | A holistic analysis towards understanding consumer perceptions of virtual reality devices in the post-adoption phase | Dehghani et al. [122] | 2022 | Behavior and Information Technology |
| 39 | Discernible impact of augmented reality on retail customer’s experience, satisfaction and willingness to buy | Poushneh & Vasquez-Parraga [123] | 2017 | Journal of Retailing and Consumer Services |
| 40 | Augmented reality shopping application usage: The influence of attitude, value, and characteristics of innovation | Jiang, Wang & Yuen [124] | 2021 | Journal of Retailing and Consumer Services |
| 41 | Exploring store atmospherics of FMCG brands flagship stores with an immersive 180-degree dome-shaped display | Duong et al. [125] | 2022 | Journal of Global Scholars of Marketing Science |
| 42 | Can augmented reality satisfy consumers’ need for touch? | Gatter, Hüttl-Maack & Rauschnabel [126] | 2022 | Psychology and Marketing |
| 43 | How nostalgic feelings impact Pokémon Go players—integrating childhood brand nostalgia into the technology acceptance theory | Harborth & Pape [127] | 2020 | Behavior and Information Technology |
| 44 | Effects of perceived interactivity of augmented reality on consumer responses: A mental imagery perspective | Park & Yoo [128] | 2020 | Journal of Retailing and Consumer Services |
| 45 | Is augmented reality technology an effective tool for e-commerce? An interactivity and vividness perspective | Yim, Chu & Sauer [19] | 2017 | Journal of Interactive Marketing |
| 46 | Cognitive, affective, and behavioral consumer responses to augmented reality in e-commerce: A comparative study | Kowalczuk, Siepmann, née & Adler [129] | 2021 | Journal of Business Research |
| 47 | How augmented reality apps are accepted by consumers: A comparative analysis using scales and opinions | Rese et al. [130] | 2017 | Technological Forecasting and Social Change |
| 48 | How mobile augmented reality digitally transforms the retail sector: Examining trust in augmented reality apps and online/offline store patronage intention | Kang et al. [131] | 2022 | Journal of Fashion Marketing and Management |
| 49 | Consumer response to virtual CSR experiences | Lee, Zhao & Chen [132] | 2021 | Journal of Current Issues and Research in Advertising |
| 50 | Relationships between the “Big Five” personality types and consumer attitudes in Indian students toward augmented reality advertising | Srivastava et al. [133] | 2021 | Aslib Journal of Information Management |
| 51 | Augmented reality filters on social media: Analyzing the drivers of playability based on uses and gratifications theory | Ibáñez-Sánchez, Orús & Flavián [134] | 2022 | Psychology and Marketing |
| 52 | User perceptions of 3D online store designs: An experimental investigation | Krasonikolakis et al. [135] | 2021 | Information Systems and e-Business Management |
| 53 | How 3D virtual reality stores can shape consumer purchase decisions: The roles of informativeness and playfulness | Kang, Shin & Ponto [136] | 2020 | Journal of Interactive Marketing |
| 54 | The impact of experiential augmented reality applications on fashion purchase intention | Watson, Alexander & Salavati [137] | 2020 | International Journal of Retail and Distribution Management |
| 55 | Immersive multisensory virtual reality technologies for virtual tourism: A study of the user’s sense of presence, satisfaction, emotions, and attitudes | Melo et al. [138] | 2022 | Multimedia Systems |
| 56 | Augmented reality interactive technology and interfaces: A construal-level theory perspective | Chiang (Luke), Huang & Chung [139] | 2022 | Journal of Research in Interactive Marketing |
| 57 | Augmented reality (AR) app use in the beauty product industry and consumer purchase intention | Wang, Ko & Wang [140] | 2022 | Asia Pacific Journal of Marketing and Logistics |
| 58 | A model of acceptance of augmented-reality interactive technology: The moderating role of cognitive innovativeness | Huang & Liao [44] | 2015 | Electronic Commerce Research |
| 59 | A hierarchical model of virtual experience and its influences on the perceived value and loyalty of customers | Piyathasanan et al. [61] | 2015 | International Journal of Electronic Commerce |
| 60 | Examining the antecedents and consequences of perceived shopping value through smart retail technology | Adapa et al. [52] | 2020 | Journal of Retailing and Consumer Services |
| 61 | Privacy threats with retail technologies: A consumer perspective | Pizzi & Scarpi [95] | 2020 | Journal of Retailing and Consumer Services |
| 62 | Consumer-computer interaction and in-store smart technology (IST) in the retail industry: The role of motivation, opportunity, and ability | Roy, Balaji, & Nguyen [141] | 2020 | Journal of Marketing Management |
| 63 | Shopping intention at AI-powered automated retail stores (AIPARS) | Pillai, Sivathanu & Dwivedi [6] | 2020 | Journal of Retailing and Consumer Services |
| 64 | Anthropomorphism and augmented reality in the retail environment | Van Esch et al. [142] | 2019 | Journal of Retailing and Consumer Services |
| 65 | Chatbots in retailers’ customer communication: How to measure their acceptance? | Rese, Ganster & Baier [29] | 2020 | Journal of Retailing and Consumer Services |
| 66 | Touch it, swipe it, shake it: Does the emergence of haptic touch in mobile retailing advertising improve its effectiveness? | Mulcahy & Riedel [143] | 2020 | Journal of Retailing and Consumer Services |
| 67 | Me or just like me? The role of virtual try-on and physical appearance in apparel M-retailing | Plotkina & Saurel [144] | 2019 | Journal of Retailing and Consumer Services |
| 68 | Understanding the virtual tours of retail stores: How can store brand experience promote visit intentions | Baek et al. [145] | 2020 | International Journal of Retail and Distribution Management |
| 69 | Building e-commerce satisfaction and boosting sales: The role of social commerce trust and its antecedents | Lin, Wang & Hajlj [146] | 2019 | International Journal of Electronic Commerce |
| 70 | A study on the reciprocal relationship between user perception and retailer perception on platform-based mobile payment service | Lee, Ryu & Lee [147] | 2019 | Journal of Retailing and Consumer Services |
| 71 | Augmented reality in smart retailing: A (n) (A) symmetric approach to continuous intention to use retail brands’ mobile AR apps | Nikhashemi et al. [148] | 2021 | Journal of Retailing and Consumer Services |
| 72 | Can a retail environment be simulated by photographs? | Willems, Doucé & Petermans [149] | 2021 | Journal of Marketing Management |
| 73 | Interactivity, inspiration, and perceived usefulness! How retailers’ AR-apps improve consumer engagement through flow | Arghashi & Yuksel [150] | 2022 | Journal of Retailing and Consumer Services |
| 74 | How augmented reality (AR) experience affects purchase intention in sport E-commerce: Roles of perceived diagnosticity, psychological distance, and perceived risks | Uhm et al. [151] | 2022 | Journal of Retailing and Consumer Services |
| 75 | UTAUT in metaverse: An “Ifland” case | Lee & Kim [46] | 2022 | Journal of Theoretical and Applied Electronic Commerce Research |
| 76 | How close do we feel to virtual product to make a purchase decision? Impact of perceived proximity to virtual product and temporal purchase intention | Poushneh [152] | 2021 | Journal of Retailing and Consumer Services |
| 77 | Consumer switching behavior to an augmented reality (AR) beauty product application: Push-pull mooring theory framework | Nugroho & Wang [153] | 2023 | Computers in Human Behavior |
| 78 | Using augmented reality to reduce cognitive dissonance and increase purchase intention | Barta, Gurrea & Flavián [154] | 2023 | Computers in Human Behavior |
| 79 | Consumer engagement via interactive artificial intelligence and mixed reality | Sung (Christine) et al. [155] | 2021 | International Journal of Information Management |
| 80 | Living the experience before you go… but did it meet expectations? The role of virtual reality during hotel bookings | McLean & Barhorst [156] | 2022 | Journal of Travel Research |
| 81 | Smarter real estate marketing using virtual reality to influence potential homebuyers’ emotions and purchase intention | Azmi et al. [157] | 2022 | Smart and Sustainable Built Environment |
| 82 | Augmented reality generalizations: A meta-analytical review on consumer-related outcomes and the mediating role of hedonic and utilitarian values | Vieira, Rafael & Agnihotri [4] | 2022 | Journal of Business Research |
| 83 | Augment yourself through virtual mirror: The impact of self-viewing and narcissism on consumer responses | Baek, Yoo & Yoon [158] | 2018 | International Journal of Advertising |
| 84 | The effect of augmented reality experience on loyalty and purchasing intent: An application on the retail sector | Eru, Topuz & Cop [159] | 2022 | Sosyoekonomi |
| 85 | Technologically empowered? Perception and acceptance of AR glasses and 3D printers in new generations of consumers | Ponzoa et al. [160] | 2021 | Technological Forecasting and Social Change |
| 86 | Beyond presence: Creating attractive online retailing stores through the cool AR technology | Zhang et al. [161] | 2023 | International Journal of Consumer Studies |
| 87 | The effect of augmented reality in mobile applications on consumers’ online impulse purchase intention: The mediating role of perceived value | Trivedi et al. [162] | 2022 | Journal of Consumer Behavior |
| 88 | Can consumers’ gamified, personalized, and engaging experiences with VR fashion apps increase in-app purchase intention by fulfilling needs? | Oiyan Lau & Chung-Wha (Chloe) Ki [163] | 2021 | Fashion and Textiles |
| 89 | WOW, the make-up AR app is impressive: A comparative study between China and South Korea | Butt et al. [164] | 2022 | Journal of Services Marketing |
| 90 | Branding in the time of virtual reality: Are virtual store brand perceptions real? | Pizzi, Vannucci & Aiello [165] | 2020 | Journal of Business Research |
| 91 | An analysis of the impact of personality traits towards augmented reality in online shopping | Lixăndroiu et al. [166] | 2021 | Symmetry |
| 92 | As if the product is already mine: How augmented reality improves the digital product presentation | Alt, Esch & Krause [167] | 2020 | Transfer: Zeitschrift für Kommunikation & Markenmanagement |
| 93 | Innovation and promotion activities in the internet to increase sales volume of music product using augmented reality technology | Kusumawati, Purnamasari & Sardiyo [168] | 2013 | Egitania Sciencia |
| 94 | Consumer behavior in an augmented reality environment: Exploring the effects of flow via augmented realism and technology fluidity | Chen & Lin [169] | 2022 | Telematics and Informatics |
| 95 | Value-based adoption of augmented reality: A study on the influence on online purchase intention in retail | Erdmann, Mas & Arilla [170] | 2021 | Journal of Consumer Behavior |
| 96 | Effects of diffusion of innovations, spatial presence, and flow on virtual reality shopping | Lu & Hsiao [171] | 2022 | Frontiers in Psychology |
| 97 | Effects of mobile augmented reality apps on impulse buying behavior: An investigation in the tourism field | Do, Shih & Ha [172] | 2020 | Heliyon |
| 98 | When brands come to life: Experimental research on the vividness effect of virtual reality in transformational marketing communications | Kerrebroeck, Brengman & Willems [173] | 2017 | Virtual Reality |
| 99 | The virtual reality leisure activities experience on elderly people | Jeng, Pai & Yeh [174] | 2017 | Applied Research in Quality of Life |
| 100 | Feeling the service product closer: Triggering visit intention via virtual reality | Yuce et al. [175] | 2020 | Sustainability (Switzerland) |
| 101 | The power of affection: Exploring the key drivers of customer loyalty in virtual reality-enabled services | Yan et al. [176] | 2022 | Frontiers in Psychology |
| 102 | An empirical study on the impact of online travel consumers’ brand loyalty: The mediating effect of flow experience | Xie & Yuan [177] | 2021 | E3S Web of Conferences |
| 103 | The impact of augmented reality on overall service satisfaction in elaborate servicescapes | Gäthke [178] | 2020 | Journal of Service Management |
| 104 | The effects of perceived quality of augmented reality in mobile commerce—an application of the information systems success model | Yoo [179] | 2020 | Informatics |
| 105 | Consumers’ self-congruence with a “Liked” brand | Wallace, Buil & de Chernatony [180] | 2017 | European Journal of Marketing |
| 106 | Influence of augmented reality product display on consumers’ product attitudes: A product uncertainty reduction perspective | Sun et al. [181] | 2022 | Journal of Retailing and Consumer Services |
| 107 | A new reality: Fan perceptions of augmented reality readiness in sport marketing | Goebert & Greenhalgh [182] | 2020 | Computers in Human Behavior |
| 108 | Augmented reality marketing: How mobile AR-apps can improve brands through inspiration | Rauschnabel, Felix & Hinsch [183] | 2019 | Journal of Retailing and Consumer Services |
| 109 | The impact of “e-atmospherics” on physical stores | Poncin & Ben Mimoun [184] | 2014 | Journal of Retailing and Consumer Services |
| 110 | A new reality: Exploring continuance intention to use mobile augmented reality for entertainment purposes | Hung, Chang & Ma [185] | 2021 | Technology in Society |
| 111 | On m-commerce adoption and augmented reality: A study on apparel buying using m-commerce in Indian context | Manchanda & Deb [186] | 2021 | Journal of Internet Commerce |
| General Topic | Specific Coding Items | Notes |
|---|---|---|
| General study information | Paper ID | |
| Title | ||
| Author | ||
| Publication year | ||
| Journal/Proceedings Journal ranking | Referring to ABS and ABDC ranking list | |
| Dataset characteristics | Sample size Product types Sample types | |
| Model characteristics | Independent variable (IV) | Corresponding to the construct |
| Dependent variable (DV) | Corresponding to the construct | |
| Effect size information | Effect size | Pearson’s product-moment correlation coefficient [3]; standardized regression coefficients [85] |
| Page number | The page number of effect size |
| Journal/Proceeding | N | Journal/Proceeding | N |
|---|---|---|---|
| Journal of Retailing and Consumer Services | 23 | Smart and Sustainable Built Environment | 1 |
| Journal of Business Research | 8 | Multimedia Systems | 1 |
| Computers in Human Behavior | 8 | Journal of Travel Research | 1 |
| Psychology and Marketing | 4 | Journal of Services Marketing | 1 |
| Technological Forecasting and Social Change | 3 | Journal of Service Management | 1 |
| Sustainability (Switzerland) | 3 | Journal of Marketing | 1 |
| Journal of Research in Interactive Marketing | 3 | Journal of Hospitality and Tourism Technology | 1 |
| International Journal of Retail and Distribution Management | 3 | Journal of Global Scholars of Marketing Science | 1 |
| Behavior and Information Technology | 3 | Journal of Fashion Marketing and Management | 1 |
| Telematics and Informatics | 2 | Journal of Current Issues and Research in Advertising | 1 |
| Journal of Theoretical and Applied Electronic Commerce Research | 2 | International Journal of Information Management | 1 |
| Journal of Marketing Management | 2 | Information Technology and Tourism | 1 |
| Journal of Internet Commerce | 2 | Information Systems and e-Business Management | 1 |
| Journal of Interactive Marketing | 2 | Informatics | 1 |
| Journal of Consumer Behavior | 2 | Heliyon | 1 |
| International Journal of Electronic Commerce | 2 | Fashion and Textiles | 1 |
| International Journal of Consumer Studies | 2 | Electronic Commerce Research and Applications | 1 |
| International Journal of Advertising | 2 | Electronic Commerce Research | 1 |
| Frontiers in Psychology | 2 | Egitania Sciencia | 1 |
| European Journal of Marketing | 2 | E3S Web of Conferences | 1 |
| Virtual Reality | 1 | Aslib Journal of Information Management | 1 |
| Transfer: Zeitschrift für Kommunikation & Markenmanagement | 1 | Asia Pacific Journal of Marketing and Logistics | 1 |
| Technology in Society | 1 | Applied Research in Quality of Life | 1 |
| Symmetry | 1 | 2022 IEEE Conference on Virtual Reality and 3D User Interfaces Abstracts and Workshops (VRW), Virtual Reality and 3D User Interfaces Abstracts and Workshops (VRW), 2022 IEEE Conference on, VRW | 1 |
| Sustainability (Switzerland) | 1 | International Journal of Contemporary Hospitality Management | 1 |
| Sosyoekonomi | 1 |
| Moderator | N. Articles | % Articles | N. Effect Sizes | % Effect Sizes | |
|---|---|---|---|---|---|
| Journal Ranking | Group 1 (relative higher rank) | 79 | 58% | 711 | 65% |
| Group 2 (others) | 57 | 42% | 388 | 35% | |
| Tech Type | AR | 84 | 62% | 739 | 67% |
| VR and others | 52 | 38% | 360 | 33% | |
| Product Type | Non-digital | 113 | 83% | 903 | 82% |
| Digital and others | 23 | 17% | 196 | 18% | |
| Sample Type | Only student | 50 | 37% | 402 | 37% |
| Non/not only student | 86 | 63% | 697 | 63% | |
| Year | Before 2021 | 56 | 41% | 515 | 47% |
| 2021 and After 2021 | 80 | 59% | 584 | 53% |
| CX | ATT | INT | LOY | PSQ | PRE | PN | PEU | PU | INF | PE | HV | PR | UV | |
|---|---|---|---|---|---|---|---|---|---|---|---|---|---|---|
| CX | CX | 13 | 20 | 3 | 16 | 14 | 13 | 8 | 7 | 9 | 12 | 7 | 6 | 6 |
| ATT | 8931 | ATT | 53 | 7 | 29 | 33 | 15 | 20 | 17 | 24 | 32 | 9 | 12 | 8 |
| INT | 515,329 | 523,534 | INT | 1 | 38 | 35 | 13 | 19 | 26 | 34 | 38 | 13 | 15 | 10 |
| LOY | 893 | 3708 | 338 | LOY | 4 | 4 | 1 | 1 | 1 | 2 | 1 | 1 | 3 | 1 |
| PSQ | 8474 | 13,329 | 12,697 | 3149 | PSQ | 27 | 14 | 15 | 16 | 21 | 20 | 9 | 5 | 6 |
| PRE | 5744 | 11,993 | 10,649 | 3060 | 9083 | PRE | 7 | 11 | 11 | 22 | 23 | 6 | 9 | 5 |
| PN | 3768 | 4806 | 4372 | 338 | 3478 | 3337 | PN | 8 | 5 | 13 | 13 | 4 | 5 | 3 |
| PEU | 2694 | 5944 | 5504 | 266 | 2745 | 4730 | 2636 | PEU | 26 | 12 | 17 | 2 | 2 | 1 |
| PU | 2490 | 4704 | 7316 | 266 | 3330 | 4345 | 2339 | 7264 | PU | 14 | 21 | 1 | 4 | 1 |
| INF | 2511 | 5827 | 7564 | 757 | 5162 | 6547 | 3593 | 2629 | 3386 | INF | 23 | 9 | 5 | 5 |
| PE | 9089 | 15256 | 16,051 | 319 | 10,479 | 8653 | 5021 | 6682 | 7093 | 6572 | PE | 2 | 8 | 2 |
| HV | 507,453 | 507,518 | 3500 | 338 | 1897 | 2541 | 988 | 307 | 253 | 2486 | 357 | HV | 3 | 7 |
| PR | 1835 | 5566 | 4881 | 2616 | 3169 | 5548 | 2555 | 1470 | 1750 | 1070 | 3644 | 979 | PR | 2 |
| UV | 507,308 | 507,326 | 2351 | 338 | 1387 | 1858 | 843 | 162 | 253 | 1251 | 285 | 2091 | 949 | UV |
| CX | ATT | INT | LOY | PSQ | PRE | PEU | PU | INF | PE | PN | HV | PR | UV | |
|---|---|---|---|---|---|---|---|---|---|---|---|---|---|---|
| CX | 1 | |||||||||||||
| ATT | 0.468 | 1 | ||||||||||||
| INT | 0.356 | 0.626 | 1 | |||||||||||
| LOY | 0.346 | 0.424 | 0.599 | 1 | ||||||||||
| PSQ | 0.540 | 0.415 | 0.411 | 0.459 | 1 | |||||||||
| PRE | 0.436 | 0.515 | 0.411 | 0.465 | 0.474 | 1 | ||||||||
| PEU | 0.319 | 0.346 | 0.364 | 0.506 | 0.434 | 0.419 | 1 | |||||||
| PU | 0.396 | 0.401 | 0.322 | 0.588 | 0.476 | 0.482 | 0.396 | 1 | ||||||
| INF | 0.465 | 0.637 | 0.467 | 0.557 | 0.530 | 0.482 | 0.338 | 0.547 | 1 | |||||
| PE | 0.471 | 0.494 | 0.501 | 0.607 | 0.458 | 0.446 | 0.422 | 0.373 | 0.652 | 1 | ||||
| PN | 0.583 | 0.574 | 0.466 | 0.229 | 0.582 | 0.499 | 0.398 | 0.493 | 0.599 | 0.554 | 1 | |||
| HV | 0.536 | 0.485 | 0.450 | 0.435 | 0.536 | 0.484 | 0.597 | 0.537 | 0.285 | 0.456 | 0.563 | 1 | ||
| PR | 0.146 | 0.146 | 0.270 | 0.453 | 0.538 | 0.296 | 0.141 | 0.330 | 0.351 | 0.302 | 0.227 | 0.060 | 1 | |
| UV | 0.490 | 0.499 | 0.535 | 0.436 | 0.542 | 0.567 | 0.591 | 0.529 | 0.287 | 0.449 | 0.387 | 0.603 | 0.015 | 1 |
| No Moderator | Journal Ranking | Tech Type | Product Type | Sample Type | Year | |||||||
|---|---|---|---|---|---|---|---|---|---|---|---|---|
| Estimate (S.E.) | Pr (>|z|) | Estimate (S.E.) | Pr (>|z|) | Estimate (S.E.) | Pr (>|z|) | Estimate (S.E.) | Pr (>|z|) | Estimate (S.E.) | Pr (>|z|) | Estimate (S.E.) | Pr (>|z|) | |
| CX→ATT | 0.762 (0.073) | 0.000 | −0.137 (0.112) | 0.221 | −0.451 (0.023) | 0.000 | −0.121 (0.143) | 0.397 | −0.267 (130.833) | 0.998 | −0.204 (102.542) | 0.998 |
| ATT→INT | 0.677 (0.022) | 0.000 | 0.41 (0.147) | 0.005 | 0.304 (0.132) | 0.021 | 0.796 (0.158) | 0.000 | 0.288 (144.516) | 0.998 | 0.085 (77.176) | 0.999 |
| PSQ→CX | 0.62 (0.055) | 0.000 | 0.108 (0.082) | 0.187 | 0.955 (0.055) | 0.000 | 0.322 (0.144) | 0.025 | 0.059 (195.702) | 1.000 | 0.141 (65.362) | 0.998 |
| PRE→CX | 0.655 (0.07) | 0.000 | −0.073 (0.066) | 0.270 | 1.19 (0.064) | 0.000 | 0.056 (0.133) | 0.672 | 0.186 (127.551) | 0.999 | −0.041 (80.814) | 1.000 |
| PN→CX | 0.444 (0.071) | 0.000 | 0.084 (0.152) | 0.579 | −0.58 (0.127) | 0.000 | 0.341 (0.111) | 0.002 | −0.309 (309.121) | 0.999 | 0.473 (34.468) | 0.989 |
| PEU→ATT | 0.098 (0.058) | 0.090 | 0.511 (0.124) | 0.000 | 0.609 (NA) | NA | 0.941 (0.082) | 0.000 | 0.42 (50.523) | 0.993 | 0.782 (63.772) | 0.990 |
| PEU→PU | 0.533 (0.036) | 0.000 | −0.582 (0.126) | 0.000 | −0.198 (0.03) | 0.000 | −0.394 (0.106) | 0.000 | 0.774 (106.974) | 0.994 | −0.638 (123.16) | 0.996 |
| PU→ATT | 0.588 (0.061) | 0.000 | 0.051 (0.148) | 0.732 | 0.901 (0.018) | 0.000 | 0.806 (0.108) | 0.000 | −0.199 (175.597) | 0.999 | 0.149 (152.502) | 0.999 |
| INF→ATT | 0.588 (0.045) | 0.000 | 0.413 (0.119) | 0.001 | 0.581 (0.034) | 0.000 | 0.831 (0.085) | 0.000 | 1.023 (245.331) | 0.997 | 0.545 (63.016) | 0.993 |
| PE→INT | 0.461 (0.036) | 0.000 | 0.806 (0.1) | 0.000 | 1.051 (0.053) | 0.000 | 0.985 (0.068) | 0.000 | 0.501 (152.132) | 0.997 | 1.019 (24.268) | 0.967 |
| HV→INT | 0.444 (0.06) | 0.000 | 0.934 (0.103) | 0.000 | 0.9 (0.074) | 0.000 | 1.091 (0.139) | 0.000 | −0.142 (133.209) | 0.999 | 0.418 (36.772) | 0.991 |
| PR→INT | 0.26 (0.073) | 0.000 | 0.259 (0.108) | 0.017 | 0.658 (0.105) | 0.000 | 0.549 (0.095) | 0.000 | 0.506 (189.361) | 0.998 | 0.746 (26.741) | 0.978 |
| UV→INT | 0.526 (0.058) | 0.000 | 0.982 (0.17) | 0.000 | 1.072 (0.08) | 0.000 | 0.949 (0.1) | 0.000 | −0.498 (96.56) | 0.996 | 0.417 (40.114) | 0.992 |
References
- Palmatier, R.W.; Dant, R.P.; Grewal, D.; Evans, K.R. Factors influencing the effectiveness of relationship marketing: A meta-analysis. J. Mark. 2006, 70, 136–153. [Google Scholar] [CrossRef]
- de Oliveira Santini, F.; Ladeira, W.J.; Pinto, D.C.; Herter, M.M.; Sampaio, C.H.; Babin, B.J. Customer engagement in social media: A framework and meta-analysis. J. Acad. Mark. Sci. Off. Publ. Acad. Mark. Sci. 2020, 48, 1211–1228. [Google Scholar] [CrossRef]
- Luceri, B.; Bijmolt, T.T.; Bellini, S.; Aiolfi, S. What drives consumers to shop on mobile devices? Insights from a meta-analysis. J. Retail. 2022, 98, 178–196. [Google Scholar] [CrossRef]
- Vieira, V.A.; Rafael, D.N.; Agnihotri, R. Augmented reality generalizations: A meta-analytical review on consumer-related outcomes and the mediating role of hedonic and utilitarian values. J. Bus. Res. 2022, 151, 170. [Google Scholar] [CrossRef]
- Herz, M.; Rauschnabel, P.A. Understanding the diffusion of virtual reality glasses: The role of media, fashion and technology. Technol. Forecast. Soc. Chang. 2019, 138, 228–242. [Google Scholar] [CrossRef]
- Pillai, R.; Sivathanu, B.; Dwivedi, Y.K. Shopping intention at AI-powered automated retail stores (AIPARS). J. Retail. Consum. Serv. 2020, 57, 102207. [Google Scholar] [CrossRef]
- Babić Rosario, A.; Sotgiu, F.; De Valck, K.; Bijmolt, T.H. The effect of electronic word of mouth on sales: A meta-analytic review of platform, product, and metric factors. J. Mark. Res. 2016, 53, 297–329. [Google Scholar] [CrossRef]
- Kumar, H.; Gupta, P.; Chauhan, S. Meta-analysis of augmented reality marketing. Mark. Intell. Plan. 2023, 41, 110–123. [Google Scholar] [CrossRef]
- Fan, X.; Jiang, X.; Deng, N. Immersive technology: A meta-analysis of augmented/virtual reality applications and their impact on tourism experience. Tour. Manag. 2022, 91, 104534. [Google Scholar] [CrossRef]
- Zhou, Y.; Chen, J.; Wang, M. A meta-analytic review on incorporating virtual and augmented reality in museum learning. Educ. Res. Rev. 2022, 36, 100454. [Google Scholar] [CrossRef]
- Jak, S. Methods for Meta-Analytic Structural Equation Modeling; Springer International Publishing: Cham, Switzerland, 2015. [Google Scholar] [CrossRef]
- Glass, G.V. Primary, secondary, and meta-analysis of research. Educ. Res. 1976, 5, 3–8. Available online: https://search.ebscohost.com/login.aspx?direct=true&db=edsjsr&AN=edsjsr.1174772&site=eds-live&scope=site (accessed on 6 April 2023). [CrossRef]
- Viswesvaran, C.; Ones, D.S. Theory testing: Combining psychometric meta-analysis and structural equations modeling. Pers. Psychol. 1995, 48, 865–885. [Google Scholar] [CrossRef]
- Cheung, M.W.L.; Chan, W. Meta-analytic structural equation modeling: A two-stage approach. Psychol. Methods 2005, 10, 40. [Google Scholar] [CrossRef] [PubMed]
- Cheung, M.W.L.; Chan, W. A two-stage approach to synthesizing covariance matrices in meta-analytic structural equation modeling. Struct. Equ. Model. 2009, 16, 28–53. [Google Scholar] [CrossRef]
- Landis, R.S. Successfully combining meta-analysis and structural equation modeling: Recommendations and strategies. J. Bus. Psychol. 2013, 28, 251–261. [Google Scholar] [CrossRef]
- Jak, S.; Li, H.; Kolbe, L.; de Jonge, H.; Cheung, M.W.L. Meta-analytic structural equation modeling made easy: A tutorial and web application for one-stage MASEM. Res. Synth. Methods 2021, 12, 590–606. [Google Scholar] [CrossRef] [PubMed]
- Cheung, M.W.L. Meta-Analysis: A Structural Equation Modeling Approach; John Wiley & Sons, Inc.: Hoboken, NJ, USA, 2015. [Google Scholar]
- Yim, M.Y.-C.; Chu, S.C.; Sauer, P.L. Is augmented reality technology an effective tool for e-commerce? An interactivity and vividness perspective. J. Interact. Mark. 2017, 39, 89–103. [Google Scholar] [CrossRef]
- Heller, J.; Chylinski, M.; de Ruyter, K.; Mahr, D.; Keeling, D.I. Touching the untouchable: Exploring multisensory augmented reality in the context of online retailing. J. Retail. 2019, 95, 219–234. [Google Scholar] [CrossRef]
- Golf-Papez, M.; Heller, J.; Hilken, T.; Chylinski, M.; de Ruyter, K.; Keeling, D.I.; Mahr, D. Embracing falsity through the metaverse: The case of synthetic customer experiences. Bus. Horiz. 2022, 65, 739–749. [Google Scholar] [CrossRef]
- Caboni, F.; Hagberg, J. Augmented reality in retailing: A review of features, applications, and value. Int. J. Retail Distrib. Manag. 2019, 47, 1125–1140. [Google Scholar] [CrossRef]
- Rejeb, A.; Rejeb, K.; Treiblmaier, H. How augmented reality impacts retail marketing: A state-of-the-art review from a consumer perspective. J. Strateg. Mark. 2021, 31, 718–748. [Google Scholar] [CrossRef]
- Shankar, V.; Kalyanam, K.; Setia, P.; Golmohammadi, A.; Tirunillai, S.; Douglass, T.; Hennessey, J.; Bull, J.S.; Waddoups, R. How technology is changing retail. J. Retail. 2021, 97, 13–27. [Google Scholar] [CrossRef]
- Poushneh, A. Augmented reality in retail: A trade-off between user’s control of access to personal information and augmentation quality. J. Retail. Consum. Serv. 2018, 41, 169–176. [Google Scholar] [CrossRef]
- Rauschnabel, P.A.; Babin, B.J.; tom Dieck, M.C.; Krey, N.; Jung, T. What is augmented reality marketing? Its definition, complexity, and future. J. Bus. Res. 2022, 142, 1140. [Google Scholar] [CrossRef]
- Thomas, P.C.; David, W.M. Augmented reality: An application of heads-up display technology to manual manufacturing processes. In Hawaii International Conference on System Sciences; ACM SIGCHI Bulletin: New York, NY, USA, 1992; pp. 659–669. [Google Scholar]
- Chen, R.; Perry, P.; Boardman, R.; McCormick, H. Augmented reality in retail: A systematic review of research foci and future research agenda. Int. J. Retail Distrib. Manag. 2022, 50, 498–518. [Google Scholar] [CrossRef]
- Rese, A.; Ganster, L.; Baier, D. Chatbots in retailers’ customer communication: How to measure their acceptance? J. Retail. Consum. Serv. 2020, 56, 102176. [Google Scholar] [CrossRef]
- Fritz, W.; Hadi, R.; Stephen, A. From tablet to table: How augmented reality influences food desirability. J. Acad. Mark. Sci. Off. Publ. Acad. Mark. Sci. 2023, 51, 503–529. [Google Scholar] [CrossRef] [PubMed]
- Smink, A.R.; van Reijmersdal, E.A.; van Noort, G. Consumers’ use of augmented reality apps: Prevalence, user characteristics, and gratifications. J. Advert. 2022, 51, 85–94. [Google Scholar] [CrossRef]
- de Amorim, I.P.; Guerreiro, J.; Eloy, S.; Loureiro, S.M.C. How augmented reality media richness influences consumer behavior. Int. J. Consum. Stud. 2022, 46, 2351–2366. [Google Scholar] [CrossRef]
- Hinsch, C.; Felix, R.; Rauschnabel, P.A. Nostalgia beats the wow-effect: Inspiration, awe and meaningful associations in augmented reality marketing. J. Retail. Consum. Serv. 2020, 53, 101987. [Google Scholar] [CrossRef]
- Yang, S.; Carlson, J.R.; Chen, S. How augmented reality affects advertising effectiveness: The mediating effects of curiosity and attention toward the ad. J. Retail. Consum. Serv. 2020, 54, 102020. [Google Scholar] [CrossRef]
- Yang, H.P.; Fan, W.S.; Tsai, M.C. Applying Stimulus–Organism–Response Theory to Explore the Effects of Augmented Reality on Consumer Purchase Intention for Teenage Fashion Hair Dyes. Sustainability 2024, 16, 2537. [Google Scholar] [CrossRef]
- Whang, J.B.; Song, J.H.; Choi, B.; Lee, J.H. The effect of Augmented Reality on purchase intention of beauty products: The roles of consumers’ control. J. Bus. Res. 2021, 133, 275–284. [Google Scholar] [CrossRef]
- Hoffmann, S.; Joerß, T.; Mai, R.; Akbar, P. Augmented reality-delivered product information at the point of sale: When information controllability backfires. J. Acad. Mark. Sci. 2022, 50, 743–776. [Google Scholar] [CrossRef] [PubMed]
- Steuer, J. Defining virtual reality: Dimensions determining telepresence. J. Commun. 1992, 42, 73–93. [Google Scholar] [CrossRef]
- Willems, K.; Brengman, M.; Van Kerrebroeck, H. The impact of representation media on customer engagement in tourism marketing among millennials. Eur. J. Mark. 2019, 53, 1988–2017. [Google Scholar] [CrossRef]
- Cowan, K.; Ketron, S. Prioritizing marketing research in virtual reality: Development of an immersion/fantasy typology. Eur. J. Mark. 2019, 53, 1585–1611. [Google Scholar] [CrossRef]
- Bonetti, F.; Montecchi, M.; Plangger, K.; Schau, H.J. Practice co-evolution: Collaboratively embedding artificial intelligence in retail practices. J. Acad. Mark. Sci. 2023, 51, 867–888. [Google Scholar] [CrossRef] [PubMed]
- Suh, K.-S.; Lee, Y.E. The effects of virtual reality on consumer learning: An empirical investigation. MIS Q. 2005, 29, 673–697. [Google Scholar] [CrossRef]
- Meißner, M.; Pfeiffer, J.; Peukert, C.; Dietrich, H.; Pfeiffer, T. How virtual reality affects consumer choice. J. Bus. Res. 2020, 117, 219–231. [Google Scholar] [CrossRef]
- Huang, T.-L.; Liao, S. A model of acceptance of augmented-reality interactive technology: The moderating role of cognitive innovativeness. Electron. Commer. Res. 2015, 15, 269–295. [Google Scholar] [CrossRef]
- Kumar, A.; Mehra, A.; Kumar, S. Why do stores drive online sales? Evidence of underlying mechanisms from a multichannel retailer. Inf. Syst. Res. 2019, 30, 319–338. [Google Scholar] [CrossRef]
- Lee, U.-K.; Kim, H. UTAUT in Metaverse: An “Ifland” case. J. Theor. Appl. Electron. Commer. Res. 2022, 17, 613–635. [Google Scholar] [CrossRef]
- Roggeveen, A.L.; Sethuraman, R. Customer-interfacing retail technologies in 2020 & beyond: An integrative framework and research directions. J. Retail. 2020, 96, 299–309. [Google Scholar] [CrossRef]
- Kotler, P. Marketing Management, An Asian Perspective; Pearson Education Limited: Harlow, UK, 2018. [Google Scholar]
- Farah, M.F.; Ramadan, Z.B.; Harb, D.H. The examination of virtual reality at the intersection of consumer experience, shopping journey, and physical retailing. J. Retail. Consum. Serv. 2019, 48, 136–143. [Google Scholar] [CrossRef]
- Grewal, D.; Roggeveen, A.L. Understanding retail experiences and customer journey management. J. Retail. 2020, 96, 3–8. [Google Scholar] [CrossRef]
- Timoumi, A.; Gangwar, M.; Mantrala, M.K. Cross-channel effects of omnichannel retail marketing strategies: A review of extant data-driven research. J. Retail. 2022, 98, 133–151. [Google Scholar] [CrossRef]
- Adapa, S.; Choudhury, A.; Shukla, A. Examining the antecedents and consequences of perceived shopping value through smart retail technology. J. Retail. Consum. Serv. 2020, 52, 101901. [Google Scholar] [CrossRef]
- Meyer, C.; Schwager, A. Understanding customer experience. Harv. Bus. Rev. 2007, 85, 116–126. [Google Scholar] [PubMed]
- Anshu, K.; Gaur, L.; Singh, G. Impact of customer experience on attitude and repurchase intention in online grocery retailing: A moderation mechanism of value co-creation. J. Retail. Consum. Serv. 2022, 64, 102798. [Google Scholar] [CrossRef]
- Keng, C.-J.; Liao, T.-H.; Yang, Y.-I. The effects of sequential combinations of virtual experience, direct experience, and indirect experience: The moderating roles of need for touch and product involvement. Electron. Commer. Res. 2012, 12, 177–199. [Google Scholar] [CrossRef]
- Ajzen, I. The theory of planned behavior. Organ. Behav. Hum. Decis. Process. 1991, 50, 179–211. [Google Scholar] [CrossRef]
- Watson, G.F.; Beck, J.T.; Henderson, C.M.; Palmatier, R.W. Building, measuring, and profiting from customer loyalty. J. Acad. Mark. Sci. 2015, 43, 790–825. [Google Scholar] [CrossRef]
- Tyrväinen, O.; Karjaluoto, H.; Saarijärvi, H. Personalization and hedonic motivation in creating customer experiences and loyalty in omnichannel retail. J. Retail. Consum. Serv. 2020, 57, 102233. [Google Scholar] [CrossRef]
- Hassouneh, D.; Brengman, M. Retailing in social virtual worlds: Developing a typology of virtual store atmospherics. J. Electron. Commer. Res. 2015, 16, 218–241. [Google Scholar]
- Srivastava, S.C.; Chandra, S. Social presence in virtual world collaboration: An uncertainty reduction perspective using a mixed methods approach. MIS Q. 2018, 42, 779–803. [Google Scholar] [CrossRef]
- Piyathasanan, B.; Mathies, C.; Wetzels, M.; Patterson, P.G.; de Ruyter, K. A hierarchical model of virtual experience and its influences on the perceived value and loyalty of customers. Int. J. Electron. Commer. 2015, 19, 126–158. [Google Scholar] [CrossRef]
- MacInnes, I. Property rights, legal issues, and business models in virtual world communities. Electron. Commer. Res. 2006, 6, 39–56. [Google Scholar] [CrossRef]
- Massetti, B. An empirical examination of the value of creativity support systems on idea generation. MIS Q. 1996, 20, 83–97. [Google Scholar] [CrossRef]
- Yuan, C.; Wang, S.; Yu, X.; Kim, K.H.; Moon, H. The influence of flow experience in the augmented reality context on psychological ownership. Int. J. Advert. 2021, 40, 922–944. [Google Scholar] [CrossRef]
- Davis, F.D. Perceived usefulness, perceived ease of use, and user acceptance of information technology. MIS Q. 1989, 13, 319–340. [Google Scholar] [CrossRef]
- Heller, J.; Chylinski, M.; de Ruyter, K.; Mahr, D.; Keeling, D.I. Let me imagine that for you: Transforming the retail frontline through augmenting customer mental imagery ability. J. Retail. 2019, 95, 94–114. [Google Scholar] [CrossRef]
- Davis, F.D.; Bagozzi, R.P.; Warshaw, P.R. Extrinsic and intrinsic motivation to use computers in the workplace. J. Appl. Soc. Psychol. 1992, 22, 1111. [Google Scholar] [CrossRef]
- Hirschman, E.C.; Holbrook, M.B. Hedonic consumption: Emerging concepts, methods, and propositions. J. Mark. 1982, 46, 92–101. [Google Scholar] [CrossRef]
- Iyer, P.; Davari, A.; Mukherjee, A. Investigating the effectiveness of retailers’ mobile applications in determining customer satisfaction and patronage intentions: A congruency perspective. J. Retail. Consum. Serv. 2018, 44, 235–243. [Google Scholar] [CrossRef]
- Mishra, A.; Shukla, A.; Rana, N.P.; Dwivedi, Y.K. From “touch” to a “multisensory” experience: The impact of technology interface and product type on consumer responses. Psychol. Mark. 2021, 38, 385–396. [Google Scholar] [CrossRef]
- Hsu, S.H.-Y.; Tsou, H.-T.; Chen, J.-S. “Yes, we do. Why not use augmented reality?” Customer responses to experiential presentations of AR-based applications. J. Retail. Consum. Serv. 2021, 62, 102649. [Google Scholar] [CrossRef]
- Kazmi, S.H.A.; Ahmed, R.R.; Soomro, K.A.; Hashem, E.A.R.; Akhtar, H.; Parmar, V. Role of augmented reality in changing consumer behavior and decision making: Case of Pakistan. Sustainability 2021, 13, 14064. [Google Scholar] [CrossRef]
- Saleem, M.; Kamarudin, S.; Shoaib, H.M.; Nasar, A. Retail consumers’ behavioral intention to use augmented reality mobile apps in Pakistan. J. Internet Commer. 2022, 21, 497–525. [Google Scholar] [CrossRef]
- Rosenthal, R. The file drawer problem and tolerance for null results. Psychol. Bull. 1979, 86, 638–641. [Google Scholar] [CrossRef]
- Dulebohn, J.H.; Bommer, W.H.; Liden, R.C.; Brouer, R.L.; Ferris, G.R. A meta-analysis of antecedents and consequences of leader-member exchange: Integrating the past with an eye toward the future. J. Manag. 2012, 38, 1715–1759. [Google Scholar] [CrossRef]
- Schamp, C.; Heitmann, M.; Bijmolt, T.H.; Katzenstein, R. The effectiveness of cause-related marketing: A meta-analysis on consumer responses. J. Mark. Res. 2023, 60, 189–215. [Google Scholar] [CrossRef]
- Zhao, H.; Seibert, S.E.; Lumpkin, G.T. The relationship of personality to entrepreneurial intentions and performance: A meta-analytic review. J. Manag. 2010, 36, 381–404. [Google Scholar] [CrossRef]
- Moher, D.; Liberati, A.; Tetzlaff, J.; Altman, D.G.; PRISMA Group. Preferred reporting items for systematic reviews and meta-analyses: The PRISMA statement. Ann. Intern. Med. 2009, 151, 264–269. [Google Scholar] [CrossRef]
- Page, M.J.; McKenzie, J.E.; Bossuyt, P.M.; Boutron, I.; Hoffmann, T.C.; Mulrow, C.D.; Shamseer, L.; Tetzlaff, J.M.; Akl, E.A.; Brennan, S.E.; et al. The PRISMA 2020 statement: An updated guideline for reporting systematic reviews. BMJ 2021, 372, n71. [Google Scholar] [CrossRef]
- Chen, B.; Wang, Y.; Wang, L. The effects of virtual reality-assisted language learning: A meta-analysis. Sustainability 2022, 14, 3147. [Google Scholar] [CrossRef]
- Sung, H.; Kim, M.; Park, J.; Shin, N.; Han, Y. Effectiveness of Virtual Reality in Healthcare Education: Systematic Review and Meta-Analysis. Sustainability 2024, 16, 8520. [Google Scholar] [CrossRef]
- Bonfrer, A.; Chintagunta, P.; Dhar, S. Retail store formats, competition, and shopper behavior: A systematic review. J. Retail. 2022, 98, 71–91. [Google Scholar] [CrossRef]
- Landis, J.R.; Koch, G.G. The measurement of observer agreement for categorical data. Biometrics 1977, 33, 159–174. [Google Scholar] [CrossRef] [PubMed]
- Kelley, K.; Preacher, K.J. On effect size. Psychol. Methods 2012, 17, 137–152. [Google Scholar] [CrossRef] [PubMed]
- Peterson, R.A.; Brown, S.P. On the use of beta coefficients in meta-analysis. J. Appl. Psychol. 2005, 90, 175–181. [Google Scholar] [CrossRef] [PubMed]
- Schulze, R. Meta-Analysis: A Comparison of Approaches; Hogrefe & Huber Publishers: Toronto, ON, Canada, 2004. [Google Scholar]
- Tucker, L.R.; Lewis, C. A reliability coefficient for maximum likelihood factor analysis. Psychometrika 1973, 38, 1–10. [Google Scholar] [CrossRef]
- Hogreve, J.; Iseke, A.; Derfuss, K.; Eller, T. The service-profit chain: A meta-analytic test of a comprehensive theoretical framework. J. Mark. 2017, 81, 41–61. [Google Scholar] [CrossRef]
- Gursoy, D.; Melodia, S.; Dhir, A. The Metaverse in the hospitality and tourism industry: An overview of current trends and future research directions. J. Hosp. Mark. Manag. 2022, 31, 527–534. [Google Scholar] [CrossRef]
- Ball, M. The Metaverse: And How It Will Revolutionize Everything; Liveright Publishing: New York, NY, USA, 2022. [Google Scholar]
- Ahn, S.J.; Kim, J.; Kim, J. The Bifold Triadic Relationships Framework: A Theoretical Primer for Advertising Research in the Metaverse. J. Advert. 2022, 51, 592–607. [Google Scholar] [CrossRef]
- MacInnes, I. Dynamic business model framework for emerging technologies. Int. J. Serv. Technol. Manag. 2005, 6, 3. [Google Scholar] [CrossRef]
- Feng, Y.; Xie, Q. Measuring the content characteristics of videos featuring augmented reality advertising campaigns. J. Res. Interact. Mark. 2018, 12, 489–508. [Google Scholar] [CrossRef]
- Ameen, N.; Hosany, S.; Paul, J. The personalisation-privacy paradox: Consumer interaction with smart technologies and shopping mall loyalty. Comput. Hum. Behav. 2022, 126, 106976. [Google Scholar] [CrossRef]
- Pizzi, G.; Scarpi, D. Privacy threats with retail technologies: A consumer perspective. J. Retail. Consum. Serv. 2020, 56, 102160. [Google Scholar] [CrossRef]
- Han, X.; Wang, F.; Lv, S.; Han, W. Mechanism linking AR-based presentation mode and consumers’ responses: A moderated serial mediation model. J. Theor. Appl. Electron. Commer. Res. 2021, 16, 2694–2707. [Google Scholar] [CrossRef]
- Chen, S.C.; Chou, T.H.; Hongsuchon, T.; Ruangkanjanases, A.; Kittikowit, S.; Lee, T.C. The mediation effect of marketing activities toward augmented reality: The perspective of extended customer experience. J. Hosp. Tour. Technol. 2022, 13, 461–480. [Google Scholar] [CrossRef]
- Zimmermann, R.; Mora, D.; Cirqueira, D.; Helfert, M.; Bezbradica, M.; Werth, D.; Weitzl, W.J.; Riedl, R.; Auinger, A. Enhancing brick-and-mortar store shopping experience with an augmented reality shopping assistant application using personalized recommendations and explainable artificial intelligence. J. Res. Interact. Mark. 2023, 17, 273–298. [Google Scholar] [CrossRef]
- Lee, J.; Kim, J.; Choi, J.Y. The adoption of virtual reality devices: The technology acceptance model integrating enjoyment, social interaction, and strength of the social ties. Telemat. Inform. 2019, 39, 37–48. [Google Scholar] [CrossRef]
- Sengupta, A.; Cao, L. Augmented reality’s perceived immersion effect on the customer shopping process: Decision-making quality and privacy concerns. Int. J. Retail. Distrib. Manag. 2022, 50, 1039–1061. [Google Scholar] [CrossRef]
- Oyman, M.; Bal, D.; Ozer, S. Extending the technology acceptance model to explain how perceived augmented reality affects consumers’ perceptions. Comput. Hum. Behav. 2022, 128, 107127. [Google Scholar] [CrossRef]
- McLean, G.; Wilson, A. Shopping in the digital world: Examining customer engagement through augmented reality mobile applications. Comput. Hum. Behav. 2019, 101, 210–224. [Google Scholar] [CrossRef]
- Harz, N.; Hohenberg, S.; Homburg, C. Virtual reality in new product development: Insights from prelaunch sales forecasting for durables. J. Mark. 2022, 86, 157–179. [Google Scholar] [CrossRef]
- Barhorst, J.B.; McLean, G.; Shah, E.; Mack, R. Blending the real world and the virtual world: Exploring the role of flow in augmented reality experiences. J. Bus. Res. 2021, 122, 423–436. [Google Scholar] [CrossRef]
- Pantano, E.; Rese, A.; Baier, D. Enhancing the online decision-making process by using augmented reality: A two-country comparison of youth markets. J. Retail. Consum. Serv. 2017, 38, 81–95. [Google Scholar] [CrossRef]
- Sung, E.C. The effects of augmented reality mobile app advertising: Viral marketing via shared social experience. J. Bus. Res. 2021, 122, 75–87. [Google Scholar] [CrossRef]
- Qin, H.; Osatuyi, B.; Xu, L. How mobile augmented reality applications affect continuous use and purchase intentions: A cognition-affect-conation perspective. J. Retail. Consum. Serv. 2021, 63, 102680. [Google Scholar] [CrossRef]
- Suh, K.-S.; Chang, S. User interfaces and consumer perceptions of online stores: The role of telepresence. Behav. Inform. Technol. 2006, 25, 99–113. [Google Scholar] [CrossRef]
- Rhee, H.-L.; Lee, K.-H. Enhancing the sneakers shopping experience through virtual fitting using augmented reality. Sustainability 2021, 13, 6336. [Google Scholar] [CrossRef]
- Haile, T.T.; Kang, M. Mobile augmented reality in electronic commerce: Investigating user perception and purchase intent amongst educated young adults. Sustainability 2020, 12, 19185. [Google Scholar] [CrossRef]
- Sung, E.; Han, D.D.; Choi, Y.K. Augmented reality advertising via a mobile app. Psychol. Mark. 2022, 39, 543–558. [Google Scholar] [CrossRef]
- Han, S.L.; An, M.; Han, J.J.; Lee, J. Telepresence, time distortion, and consumer traits of virtual reality shopping. J. Bus. Res. 2020, 118, 311–320. [Google Scholar] [CrossRef]
- Zanger, V.; Meißner, M.; Rauschnabel, P.A. Beyond the gimmick: How affective responses drive brand attitudes and intentions in augmented reality marketing. Psychol. Mark. 2022, 39, 1285–1301. [Google Scholar] [CrossRef]
- Bialkova, S.; Barr, C. Virtual try-on: How to enhance consumer experience? In Proceedings of the 2022 IEEE Conference on Virtual Reality and 3D User Interfaces Abstracts and Workshops (VRW), Christchurch, New Zealand, 12–16 March 2022. [Google Scholar]
- Qin, H.; Peak, D.A.; Prybutok, V. A virtual market in your pocket: How does mobile augmented reality (MAR) influence consumer decision making? J. Retail. Consum. Serv. 2021, 58, 102337. [Google Scholar] [CrossRef]
- Rauschnabel, P.A.; Rossmann, A.; tom Dieck, M.C. An adoption framework for mobile augmented reality games: The case of Pokémon Go. Comput. Hum. Behav. 2017, 76, 276–286. [Google Scholar] [CrossRef]
- Cowan, K.; Spielmann, N.; Horn, E.; Griffart, C. Perception is reality… How digital retail environments influence brand perceptions through presence. J. Bus. Res. 2021, 123, 86–96. [Google Scholar] [CrossRef]
- Lombart, C.; Millan, E.; Normand, J.M.; Verhulst, A.; Labbé-Pinlon, B.; Moreau, G. Effects of physical, non-immersive virtual, and immersive virtual store environments on consumers’ perceptions and purchase behavior. Comput. Hum. Behav. 2020, 110, 106374. [Google Scholar] [CrossRef]
- Martínez-Molés, V.; Jung, T.H.; Pérez-Cabañero, C.; Cervera-Taulet, A. Gathering pre-purchase information for a cruise vacation with virtual reality: The effects of media technology and gender. Int. J. Contemp. Hosp. Manag. 2022, 34, 407–429. [Google Scholar] [CrossRef]
- Arghashi, V. Shopping with augmented reality: How wow-effect changes the equations! Electron. Commer. Res. Appl. 2022, 54, 101166. [Google Scholar] [CrossRef]
- Lo, W.H.; Cheng, K.L.B. Does virtual reality attract visitors? The mediating effect of presence on consumer response in virtual reality tourism advertising. Inf. Technol. Tourism 2020, 22, 537–562. [Google Scholar] [CrossRef]
- Dehghani, M.; Acikgoz, F.; Mashatan, A.; Lee, S.H. A holistic analysis towards understanding consumer perceptions of virtual reality devices in the post-adoption phase. Behav. Inf. Technol. 2022, 41, 1453–1471. [Google Scholar] [CrossRef]
- Poushneh, A.; Vasquez-Parraga, A.Z. Discernible impact of augmented reality on retail customer’s experience, satisfaction and willingness to buy. J. Retail. Consum. Serv. 2017, 34, 229–234. [Google Scholar] [CrossRef]
- Jiang, Y.; Wang, X.; Yuen, K.F. Augmented reality shopping application usage: The influence of attitude, value, and characteristics of innovation. J. Retail. Consum. Serv. 2021, 63, 102720. [Google Scholar] [CrossRef]
- Duong, V.C.; Sung, B.; Barber, M.; Regolini, E.; Teah, M. Exploring store atmospherics of FMCG brands flagship stores with an immersive 180-degree dome-shaped display. J. Glob. Sch. Mark. Sci. 2022, 32, 554–578. [Google Scholar] [CrossRef]
- Gatter, S.; Hüttl-Maack, V.; Rauschnabel, P.A. Can augmented reality satisfy consumers’ need for touch? Psychol. Mark. 2022, 39, 508–523. [Google Scholar] [CrossRef]
- Harborth, D.; Pape, S. How nostalgic feelings impact Pokémon Go players—Integrating childhood brand nostalgia into the technology acceptance theory. Behav. Inf. Technol. 2020, 39, 1276–1296. [Google Scholar] [CrossRef]
- Park, M.; Yoo, J. Effects of perceived interactivity of augmented reality on consumer responses: A mental imagery perspective. J. Retail. Consum. Serv. 2020, 52, 101912. [Google Scholar] [CrossRef]
- Kowalczuk, P.; Siepmann, C.; Adler, J. Cognitive, affective, and behavioral consumer responses to augmented reality in e-commerce: A comparative study. J. Bus. Res. 2021, 124, 357–373. [Google Scholar] [CrossRef]
- Rese, A.; Baier, D.; Geyer-Schulz, A.; Schreiber, S. How augmented reality apps are accepted by consumers: A comparative analysis using scales and opinions. Technol. Forecast. Soc. Chang. 2017, 124, 306–319. [Google Scholar] [CrossRef]
- Kang, J.Y.M.; Kim, J.E.; Lee, J.Y.; Lin, S.H. How mobile augmented reality digitally transforms the retail sector: Examining trust in augmented reality apps and online/offline store patronage intention. J. Fash. Mark. Manag. 2023, 27, 161–181. [Google Scholar] [CrossRef]
- Lee, Y.-J.; Zhao, W.; Chen, H. Consumer response to virtual CSR experiences. J. Curr. Issues Res. Advert. 2021, 42, 102–122. [Google Scholar] [CrossRef]
- Srivastava, A.; Dasgupta, S.A.; Ray, A.; Bala, P.K.; Chakraborty, S. Relationships between the “Big Five” personality types and consumer attitudes in Indian students toward augmented reality advertising. Aslib J. Inf. Manag. 2021, 73, 967–991. [Google Scholar] [CrossRef]
- Ibáñez-Sánchez, S.; Orús, C.; Flavián, C. Augmented reality filters on social media: Analyzing the drivers of playability based on uses and gratifications theory. Psychol. Mark. 2022, 39, 559–578. [Google Scholar] [CrossRef]
- Krasonikolakis, I.; Vrechopoulos, A.; Dimitriadis, S.; Pouloudi, N. User perceptions of 3D online store designs: An experimental investigation. Inf. Syst. e-Bus. Manag. 2021, 19, 1321–1354. [Google Scholar] [CrossRef]
- Kang, H.J.; Shin, J.; Ponto, K. How 3D virtual reality stores can shape consumer purchase decisions: The roles of informativeness and playfulness. J. Interact. Mark. 2020, 49, 70–85. [Google Scholar] [CrossRef]
- Watson, A.; Alexander, B.; Salavati, L. The impact of experiential augmented reality applications on fashion purchase intention. Int. J. Retail. Distrib. Manag. 2020, 48, 433–451. [Google Scholar] [CrossRef]
- Melo, M.; Coelho, H.; Gonçalves, G.; Losada, N.; Jorge, F.; Teixeira, M.S.; Bessa, M. Immersive multisensory virtual reality technologies for virtual tourism: A study of the user’s sense of presence, satisfaction, emotions, and attitudes. Multimed. Syst. 2022, 28, 1027–1037. [Google Scholar] [CrossRef]
- Chiang, L.L.; Huang, T.-L.; Chung, H.F.L. Augmented reality interactive technology and interfaces: A construal-level theory perspective. J. Res. Interact. Mark. 2022, 16, 683–698. [Google Scholar] [CrossRef]
- Wang, Y.; Ko, E.; Wang, H. Augmented reality (AR) app use in the beauty product industry and consumer purchase intention. Asia Pac. J. Mark. Logist. 2022, 34, 110–131. [Google Scholar] [CrossRef]
- Roy, S.K.; Balaji, M.S.; Nguyen, B. Consumer-computer interaction and in-store smart technology (IST) in the retail industry: The role of motivation, opportunity, and ability. J. Mark. Manag. 2020, 36, 299–333. [Google Scholar] [CrossRef]
- Van Esch, P.; Arli, D.; Gheshlaghi, M.H.; Andonopoulos, V.; von der Heidt, T.; Northey, G. Anthropomorphism and augmented reality in the retail environment. J. Retail. Consum. Serv. 2019, 49, 35–42. [Google Scholar] [CrossRef]
- Mulcahy, R.F.; Riedel, A.S. “Touch it, swipe it, shake it”: Does the emergence of haptic touch in mobile retailing advertising improve its effectiveness? J. Retail. Consum. Serv. 2020, 54, 101613. [Google Scholar] [CrossRef]
- Plotkina, D.; Saurel, H. Me or just like me? The role of virtual try-on and physical appearance in apparel M-retailing. J. Retail. Consum. Serv. 2019, 51, 362–377. [Google Scholar] [CrossRef]
- Baek, E.; Choo, H.J.; Wei, X.; Yoon, S.Y. Understanding the virtual tours of retail stores: How can store brand experience promote visit intentions? Int. J. Retail Distrib. Manag. 2020, 48, 649–666. [Google Scholar] [CrossRef]
- Lin, X.; Wang, X.; Hajli, N. Building E-Commerce Satisfaction and Boosting Sales: The Role of Social Commerce Trust and Its Antecedents. Int. J. Electron. Commer. 2019, 23, 328–363. [Google Scholar] [CrossRef]
- Lee, J.; Ryu, M.H.; Lee, D. A study on the reciprocal relationship between user perception and retailer perception on platform-based mobile payment service. J. Retail. Consum. Serv. 2019, 48, 7–15. [Google Scholar] [CrossRef]
- Nikhashemi, S.R.; Knight, H.H.; Nusair, K.; Liat, C.B. Augmented reality in smart retailing: A (n) (A) Symmetric Approach to continuous intention to use retail brands’ mobile AR apps. J. Retail. Consum. Serv. 2021, 60, 102464. [Google Scholar] [CrossRef]
- Willems, K.; Doucé, L.; Petermans, A. Can a retail environment be simulated by photographs? J. Mark. Manag. 2021, 37, 1514–1549. [Google Scholar] [CrossRef]
- Arghashi, V.; Yuksel, C.A. Interactivity, Inspiration, and Perceived Usefulness! How retailers’ AR-apps improve consumer engagement through flow. J. Retail. Consum. Serv. 2022, 64, 102756. [Google Scholar] [CrossRef]
- Uhm, J.P.; Kim, S.; Do, C.; Lee, H.W. How augmented reality (AR) experience affects purchase intention in sport E-commerce: Roles of perceived diagnosticity, psychological distance, and perceived risks. J. Retail. Consum. Serv. 2022, 67, 103027. [Google Scholar] [CrossRef]
- Poushneh, A. How close do we feel to virtual product to make a purchase decision? Impact of perceived proximity to virtual product and temporal purchase intention. J. Retail. Consum. Serv. 2021, 63, 102717. [Google Scholar] [CrossRef]
- Nugroho, A.; Wang, W.-T. Consumer switching behavior to an augmented reality (AR) beauty product application: Push-pull mooring theory framework. Comput. Hum. Behav. 2023, 142, 107646. [Google Scholar] [CrossRef]
- Barta, S.; Gurrea, R.; Flavián, C. Using augmented reality to reduce cognitive dissonance and increase purchase intention. Comput. Hum. Behav. 2023, 140, 107564. [Google Scholar] [CrossRef]
- Sung, E.C.; Bae, S.; Han, D.I.D.; Kwon, O. Consumer engagement via interactive artificial intelligence and mixed reality. Int. J. Inf. Manag. 2021, 60, 102382. [Google Scholar] [CrossRef]
- McLean, G.; Barhorst, J.B. Living the experience before you go… but did it meet expectations? The role of virtual reality during hotel bookings. J. Travel Res. 2022, 61, 1233–1251. [Google Scholar] [CrossRef]
- Azmi, A.; Ibrahim, R.; Abdul Ghafar, M.; Rashidi, A. Smarter real estate marketing using virtual reality to influence potential homebuyers’ emotions and purchase intention. Smart Sustain. Built Environ. 2022, 11, 870–890. [Google Scholar] [CrossRef]
- Baek, T.H.; Yoo, C.Y.; Yoon, S. Augment yourself through virtual mirror: The impact of self-viewing and narcissism on consumer responses. Int. J. Advert. 2018, 37, 421–439. [Google Scholar] [CrossRef]
- Eru, O.; Topuz, Y.V.; Cop, R. The effect of augmented reality experience on loyalty and purchasing intent: An application on the retail sector. Sosyoekonomi 2022, 30, 129–154. [Google Scholar] [CrossRef]
- Ponzoa, J.M.; Gómez, A.; Villaverde, S.; Díaz, V. Technologically empowered? Perception and acceptance of AR glasses and 3D printers in new generations of consumers. Technol. Forecast. Soc. Chang. 2021, 173, 121166. [Google Scholar] [CrossRef]
- Zhang, M.; Li, Y.; Li, Y.; Ren, X. Beyond presence: Creating attractive online retailing stores through the cool AR technology. Int. J. Consum. Stud. 2023, 47, 1139–1156. [Google Scholar] [CrossRef]
- Trivedi, J.; Kasilingam, D.; Arora, P.; Soni, S. The effect of augmented reality in mobile applications on consumers’ online impulse purchase intention: The mediating role of perceived value. J. Consum. Behav. 2022, 21, 896–908. [Google Scholar] [CrossRef]
- Lau, O.; Ki, C.-W. Can consumers’ gamified, personalized, and engaging experiences with VR fashion apps increase in-app purchase intention by fulfilling needs? Fash. Text. 2021, 8, 36. [Google Scholar] [CrossRef]
- Butt, A.; Ahmad, H.; Muzaffar, A.; Ali, F.; Shafique, N. WOW, the make-up AR app is impressive: A comparative study between China and South Korea. J. Serv. Mark. 2022, 36, 73–88. [Google Scholar] [CrossRef]
- Pizzi, G.; Vannucci, V.; Aiello, G. Branding in the time of virtual reality: Are virtual store brand perceptions real? J. Bus. Res. 2020, 119, 502–510. [Google Scholar] [CrossRef]
- Lixăndroiu, R.; Cazan, A.M.; Maican, C.I. An analysis of the impact of personality traits towards augmented reality in online shopping. Symmetry 2021, 13, 416. [Google Scholar] [CrossRef]
- Alt, T.; Esch, F.R.; Krause, F. As if the product is already mine: How augmented reality improves the digital product presentation. Transf. Z. Kommun. Markenmanag. 2020, 66, 12. [Google Scholar]
- Kusumawati, R.D.; Purnamasari, D. Innovation and promotion activities in the internet to increase sales volume of music product using augmented reality technology. Egitania Sci. 2013, 243. [Google Scholar] [CrossRef]
- Chen, Y.; Lin, C.A. Consumer behavior in an augmented reality environment: Exploring the effects of flow via augmented realism and technology fluidity. Telemat. Inform. 2022, 71, 101833. [Google Scholar] [CrossRef]
- Erdmann, A.; Mas, J.M.; Arilla, R. Value-based adoption of augmented reality: A study on the influence on online purchase intention in retail. J. Consum. Behav. 2023, 22, 912–932. [Google Scholar] [CrossRef]
- Lu, X.; Hsiao, K.L. Effects of diffusion of innovations, spatial presence, and flow on virtual reality shopping. Front. Psychol. 2022, 13, 941248. [Google Scholar] [CrossRef] [PubMed]
- Do, H.N.; Shih, W.; Ha, Q.A. Effects of mobile augmented reality apps on impulse buying behavior: An investigation in the tourism field. Heliyon 2020, 6, e04667. [Google Scholar] [CrossRef]
- Kerrebroeck, H.; Brengman, M.; Willems, K. When brands come to life: Experimental research on the vividness effect of Virtual Reality in transformational marketing communications. Virtual Real. 2017, 21, 177–191. [Google Scholar] [CrossRef]
- Jeng, M.-Y.; Pai, F.-Y.; Yeh, T.-M. The Virtual Reality Leisure Activities Experience on Elderly People. Appl. Res. Qual. Life 2017, 12, 49–65. [Google Scholar] [CrossRef]
- Yuce, A.; Arasli, H.; Ozturen, A.; Daskin, M. Feeling the service product closer: Triggering visit intention via virtual reality. Sustainability 2020, 12, 6632. [Google Scholar] [CrossRef]
- Yan, J.; Ali, I.; Ali, R.; Chang, Y. The power of affection: Exploring the key drivers of customer loyalty in virtual reality-enabled services. Front. Psychol. 2022, 13, 850896. [Google Scholar] [CrossRef] [PubMed]
- Xie, S.; Yuan, Y. An Empirical Study on the Impact of Online Travel Consumers’ Brand Loyalty: The Mediating Effect of Flow Experience. E3S Web Conf. 2021, 253, 03043. [Google Scholar] [CrossRef]
- Gäthke, J. The impact of augmented reality on overall service satisfaction in elaborate servicescapes. J. Serv. Manag. 2020, 31, 227–246. [Google Scholar] [CrossRef]
- Yoo, J. The effects of perceived quality of augmented reality in mobile commerce—An application of the Information Systems Success Model. Informatics 2020, 7, 14. [Google Scholar] [CrossRef]
- Wallace, E.; Buil, I.; de Chernatony, L. Consumers’ self-congruence with a “liked” brand. Eur. J. Mark. 2017, 51, 367–390. [Google Scholar] [CrossRef]
- Sun, C.; Fang, Y.; Kong, M.; Chen, X.; Liu, Y. Influence of augmented reality product display on consumers’ product attitudes: A product uncertainty reduction perspective. J. Retail. Consum. Serv. 2022, 64, 102828. [Google Scholar] [CrossRef]
- Goebert, C.; Greenhalgh, G.P. A new reality: Fan perceptions of augmented reality readiness in sport marketing. Comput. Hum. Behav. 2020, 106, 106231. [Google Scholar] [CrossRef]
- Rauschnabel, P.A.; Felix, R.; Hinsch, C. Augmented reality marketing: How mobile AR-apps can improve brands through inspiration. J. Retail. Consum. Serv. 2019, 49, 43–53. [Google Scholar] [CrossRef]
- Poncin, I.; Ben Mimoun, M.S. The impact of “e-atmospherics” on physical stores. J. Retail. Consum. Serv. 2014, 21, 851–859. [Google Scholar] [CrossRef]
- Hung, S.W.; Chang, C.W.; Ma, Y.C. A new reality: Exploring continuance intention to use mobile augmented reality for entertainment purposes. Technol. Soc. 2021, 67, 101757. [Google Scholar] [CrossRef]
- Manchanda, M.; Deb, M. On m-Commerce Adoption and Augmented Reality: A Study on Apparel Buying Using m-Commerce in Indian Context. J. Internet Commer. 2021, 20, 84–112. [Google Scholar] [CrossRef]


| Bivariate Correlation | K | Cumulative N | r | Estimate | S.E. | 95% CI | Z-Value | Significance | df. | I2 (Q Statistic) | FsN | |
|---|---|---|---|---|---|---|---|---|---|---|---|---|
| Lower | Higher | |||||||||||
| CX-ATT | 13 | 8931 | 0.460 | 0.468 | 0.053 | 0.364 | 0.571 | 8.844 | *** | 12 | 0.980 | 4871 |
| ATT-INT | 53 | 523,534 | 0.627 | 0.626 | 0.022 | 0.583 | 0.670 | 28.076 | *** | 52 | 0.956 | 818,229 |
| INT-LOY | 1 | 338 | 0.610 | 0.599 | 0.034 | 0.532 | 0.665 | 17.723 | *** | 0 | 0.000 | 115 |
| CX-LOY | 3 | 893 | 0.346 | 0.346 | 0.131 | 0.090 | 0.602 | 2.646 | ** | 2 | 0.974 | 20 |
| PSQ-CX | 16 | 8474 | 0.544 | 0.540 | 0.061 | 0.421 | 0.660 | 8.841 | *** | 15 | 0.990 | 7378 |
| PRE-CX | 14 | 5744 | 0.431 | 0.436 | 0.045 | 0.348 | 0.525 | 9.662 | *** | 13 | 0.960 | 6747 |
| PN-CX | 12 | 3768 | 0.314 | 0.319 | 0.084 | 0.155 | 0.482 | 3.814 | *** | 11 | 0.984 | 762 |
| PEU-ATT | 20 | 5944 | 0.401 | 0.401 | 0.037 | 0.330 | 0.473 | 10.960 | *** | 19 | 0.955 | 17,736 |
| PEU-PU | 26 | 7264 | 0.543 | 0.547 | 0.035 | 0.479 | 0.615 | 15.756 | *** | 25 | 0.972 | 61,993 |
| PU-ATT | 17 | 4704 | 0.638 | 0.637 | 0.044 | 0.551 | 0.723 | 14.526 | *** | 16 | 0.978 | 22,518 |
| INF-ATT | 24 | 5827 | 0.503 | 0.494 | 0.039 | 0.419 | 0.570 | 12.792 | *** | 23 | 0.971 | 34,807 |
| PE-INT | 38 | 16,051 | 0.472 | 0.466 | 0.035 | 0.397 | 0.535 | 13.267 | *** | 37 | 0.979 | 93,887 |
| HV-INT | 13 | 3500 | 0.452 | 0.450 | 0.060 | 0.333 | 0.568 | 7.538 | *** | 12 | 0.980 | 3535 |
| PR-INT | 15 | 4881 | 0.262 | 0.270 | 0.072 | 0.130 | 0.410 | 3.771 | *** | 14 | 0.981 | 1167 |
| UV-INT | 10 | 2351 | 0.536 | 0.535 | 0.058 | 0.422 | 0.648 | 9.265 | *** | 9 | 0.975 | 3162 |
| 95% CI | |||||
|---|---|---|---|---|---|
| Hypothesis | Path | Estimate | Lower | Higher | |
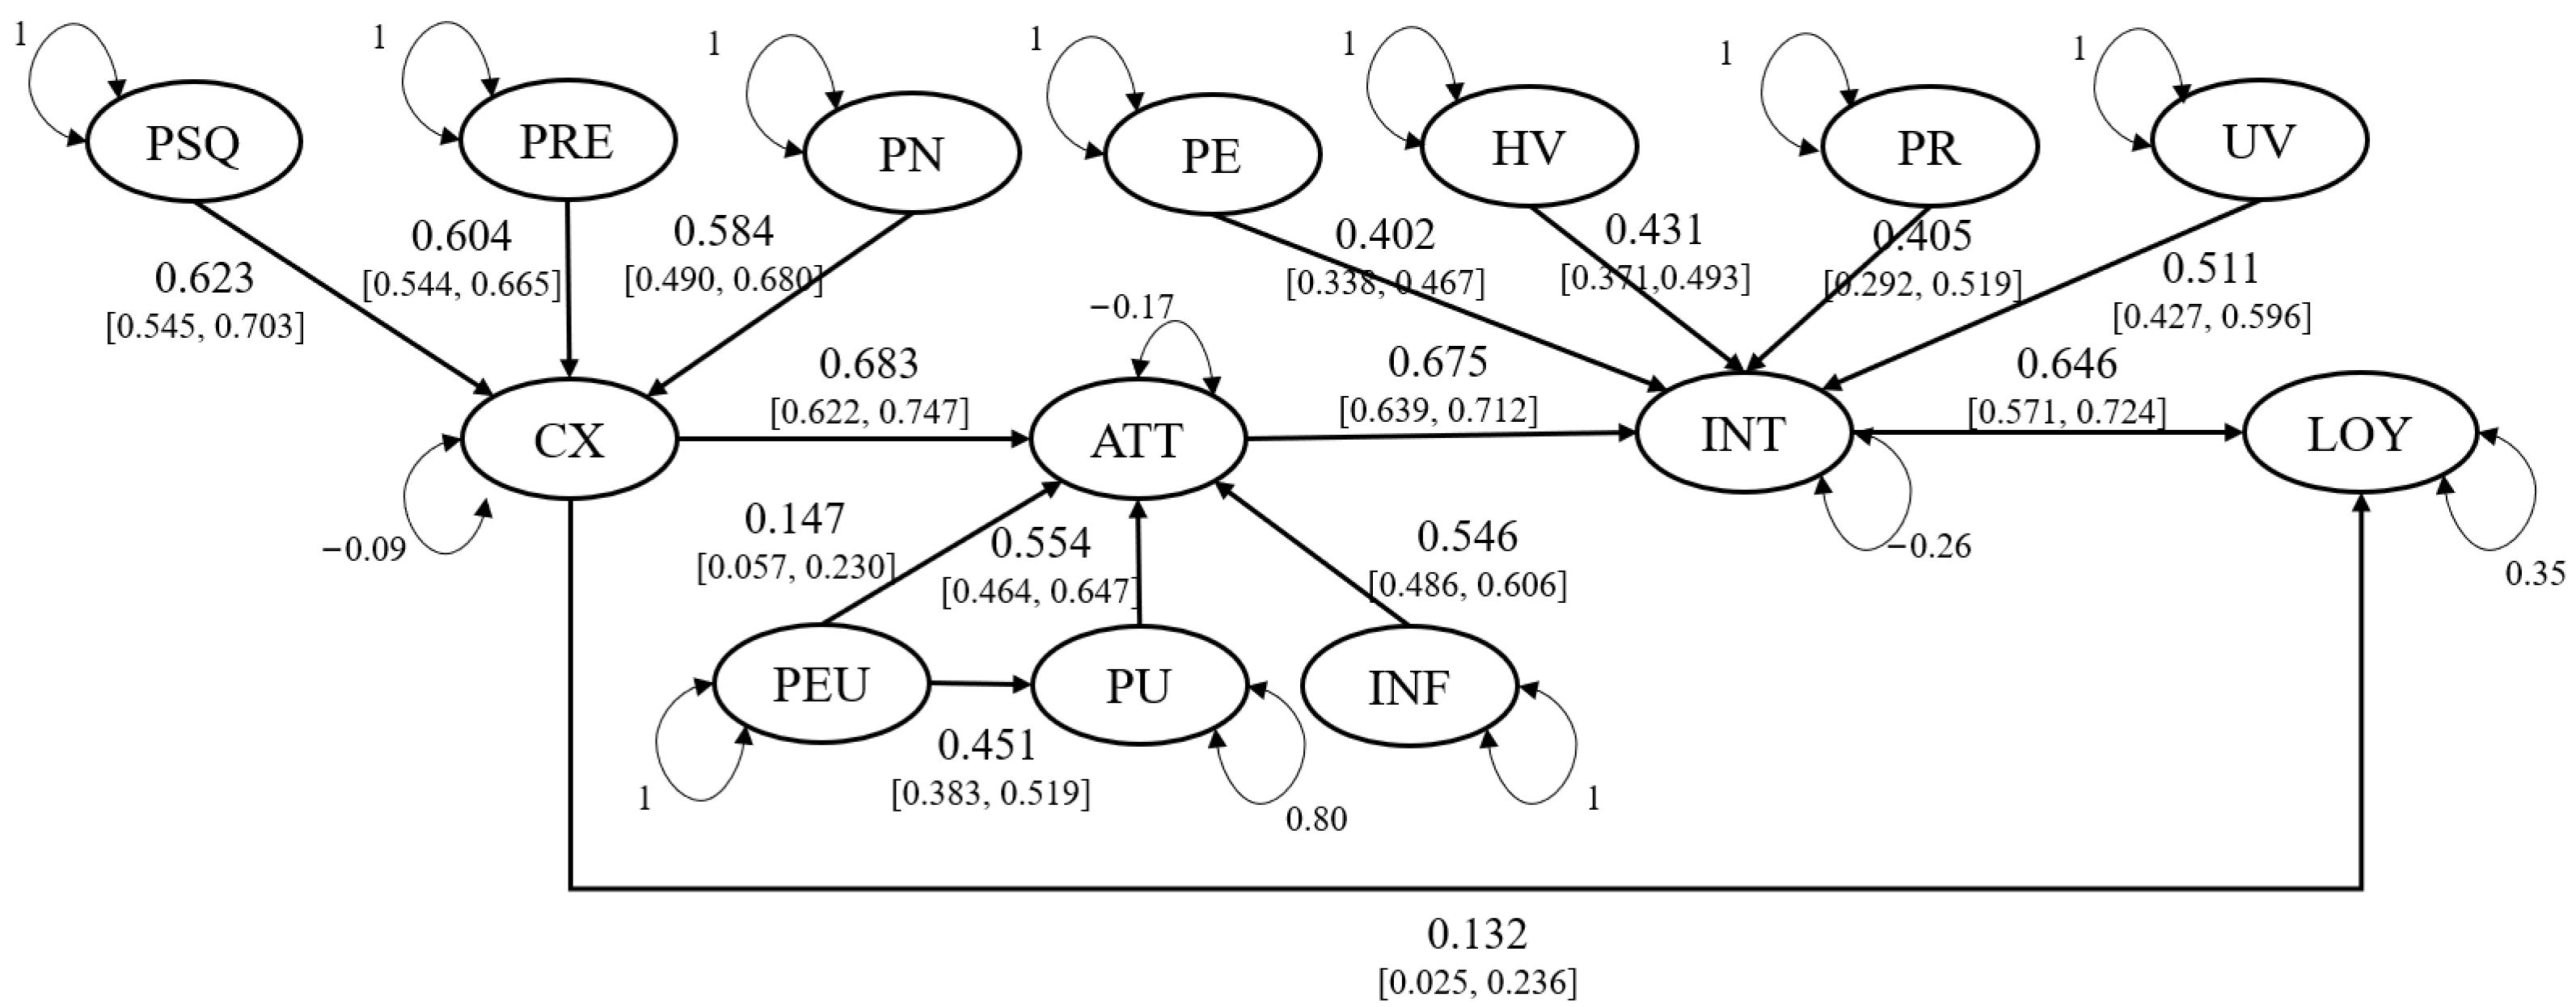
| 1 | CX→ATT | 0.683 | 0.622 | 0.747 | Support |
| 2 | ATT→INT | 0.675 | 0.639 | 0.712 | Support |
| 3 | INT→LOY | 0.646 | 0.571 | 0.724 | Support |
| 4 | CX→LOY | 0.132 | 0.025 | 0.236 | Support |
| 5 | PSQ→CX | 0.623 | 0.545 | 0.703 | Support |
| 6 | PRE→CX | 0.604 | 0.544 | 0.665 | Support |
| 7 | PN→CX | 0.584 | 0.490 | 0.680 | Support |
| 8 | PEU→ATT | 0.147 | 0.057 | 0.230 | Support |
| 9 | PEU→PU | 0.451 | 0.383 | 0.519 | Support |
| 10 | PU→ATT | 0.554 | 0.464 | 0.647 | Support |
| 11 | INF→ATT | 0.546 | 0.486 | 0.606 | Support |
| 12 | PE→INT | 0.402 | 0.338 | 0.467 | Support |
| 13 | HV→INT | 0.467 | 0.383 | 0.553 | Support |
| 14 | PR→INT | 0.405 | 0.292 | 0.519 | Not Support |
| 15 | UV→INT | 0.511 | 0.427 | 0.596 | Support |
| Key Findings | Managerial Implications |
|---|---|
| Antecedents | |
| All the proposed correlations are significantly and positively correlated. | Retailers should consider the factors that influence customer decision-making. |
| The hedonic and utilitarian values have a significant and positive impact on customers’ intentions, with utilitarian values exerting a stronger influence than hedonic values. | It is crucial for retailers to consider the hedonic values and perceived enjoyment of their customers. However, rather than solely emphasizing one type of value, retailers should place equal emphasis on both hedonic and utilitarian values in order to attract a larger customer base and optimize profitability. |
| Perceived system quality has the greatest impact on customer experience. | To enhance customer experience, retailers should employ atmospherics to recreate the atmospherics of a physical shopping environment and create an immersive virtual shopping experience. |
| Informativeness and perceived usefulness are critical factors that affect customers’ attitudes. | Retailers can utilize WOM marketing, advertising, brand strategies, and interactive product design to enhance customers’ perception of product informativeness in AR- or VR-supported retailing. |
| The perceived risk significantly and positively affects the intention. | New or advanced technology brings both challenges and opportunities for retailers. It offers a unique and innovative experience for customers. Therefore, it is crucial for retailers to effectively navigate these challenges and transform them into opportunities to maximize their profits. |
| The perceived presence of customers plays a vital role in AR/VR retailing. | Retailers should develop interactive advertising and distribution strategies that aim to encourage and engage more users to actively participate in AR/VR retailing. |
| Consequences | |
| The customer experience significantly and positively affects attitude, purchasing intentions, and loyalty (linear customer journey). Customer experience significantly and positively affects loyalty (non-linear customer journey). | Retailers should create experiences that facilitate turning linear customer journeys into non-linear ones. |
| Moderators | |
| Journal ranking, technology, and product types show significant moderating effects. | Retailers should set different marketing strategies for different technology and product types. |
| Sample type and publication years have non-significant moderating effects on the proposed correlations. | In light of the global ageing trend, retailers should also consider digital inclusion for the oldest to maximize profits. |
| Stages | Items | Research Agenda |
|---|---|---|
| Stage 1: Technical | Technology acceptance | To investigate the different degrees of technology acceptance in different purchase stages (i.e., pre-purchase, purchase, and post-purchase) of metaverse retailing. To explore the customer decision process through mixed reality. |
| Sensory marketing | To investigate the influence of sensory marketing on customer purchasing decisions in metaverse retailing for hedonic and utilitarian motivation. | |
| Crowdsourcing or co-creation | To explore whether co-creation in the metaverse would enhance the customers’ presence in metaverse retailing. | |
| Stage 2: Environmental | Policy and regulation | To explore the property and privacy security in metaverse retailing. To investigate how metaverse retailers can achieve carbon neutrality when utilizing omnichannel distribution. |
| Stage 3: Revenue | Avatar | To examine the user’s preference for building their avatar’s shape and customer preference for AR or VR in metaverse retailing. |
| Advertisement Branding | To explore the influence of falsity experience in the metaverse on customers’ purchasing decisions. To investigate how retailers build a brand and sustain a competitive advantage in metaverse retailing. To investigate how brand affects customer purchasing intention and the continuous purchasing intention in metaverse retailing. | |
| Geography | To investigate the influence on customer attractiveness by different geographical factors in the virtual and real world. To investigate the influence of the retailing cluster in metaverse retailing. To investigate the cross-impact of geographical factors in metaverse retailing for non-digital products from the perspective of omnichannel. | |
| Stage 4: Sustaining | Omnichannel | To investigate the realization of the omnichannel in metaverse retailing. To investigate the realization of the seamless/smooth experience in omnichannel retailing to shorten the customer journey. |
| WOM | To compare the word-of-mouth (WOM) difference between social media influencers in e-commerce and metaverse retailing and explore a sustainable way for WOM. | |
| Digital inclusion | To investigate how metaverse retailers realize digital inclusion for elders. |
Disclaimer/Publisher’s Note: The statements, opinions and data contained in all publications are solely those of the individual author(s) and contributor(s) and not of MDPI and/or the editor(s). MDPI and/or the editor(s) disclaim responsibility for any injury to people or property resulting from any ideas, methods, instructions or products referred to in the content. |
© 2025 by the authors. Licensee MDPI, Basel, Switzerland. This article is an open access article distributed under the terms and conditions of the Creative Commons Attribution (CC BY) license (https://creativecommons.org/licenses/by/4.0/).
Share and Cite
Fan, X.; Xun, J.; Dolega, L.; Xiong, L. The Role of Augmented and Virtual Reality in Shaping Retail Marketing: A Meta-Analysis. Sustainability 2025, 17, 728. https://doi.org/10.3390/su17020728
Fan X, Xun J, Dolega L, Xiong L. The Role of Augmented and Virtual Reality in Shaping Retail Marketing: A Meta-Analysis. Sustainability. 2025; 17(2):728. https://doi.org/10.3390/su17020728
Chicago/Turabian StyleFan, Xiaowei, Jiyao Xun, Les Dolega, and Lin Xiong. 2025. "The Role of Augmented and Virtual Reality in Shaping Retail Marketing: A Meta-Analysis" Sustainability 17, no. 2: 728. https://doi.org/10.3390/su17020728
APA StyleFan, X., Xun, J., Dolega, L., & Xiong, L. (2025). The Role of Augmented and Virtual Reality in Shaping Retail Marketing: A Meta-Analysis. Sustainability, 17(2), 728. https://doi.org/10.3390/su17020728