Abstract
Currently, around 60% of the world’s population lives in cities, with about half of Portugal’s population concentrated in the Metropolitan Areas of Lisbon and Porto. In this context, urban spaces need to be planned and managed to accommodate more inhabitants while preserving the urban quality of life and ensuring sustainability for future generations. Responding to these challenges, new urban models are emerging, such as the 15-Minute City model defined by Carlos Moreno. This model is based on four pillars: proximity, diversity, density, and ubiquity, aiming to enable residents to complete daily activities within a maximum of 15 min on foot or by other active transport modes. Through an analysis of two neighborhoods in Lisbon using specific indicators, this research aims to understand how urban planning influences each area’s alignment with the 15-Minute City model. This analysis will guide measures to improve residents’ quality of life by applying the principles of the 15-Minute City while broadening the discussion to include other relevant dimensions beyond travel distances and access, identifying areas that require further urban planning or intervention.
1. Introduction
Currently, it is estimated that about 60% of the world’s population lives in cities [1], with this value in Portugal being about 50%, concentrated mainly in the Metropolitan Areas of Lisbon and Oporto [2].
Throughout the 20th century, several authors formulated models to address the problems resulting from the industrial city of the 19th century. With the turn of the century, the work of the United Nations stands out, particularly in 2015, with the elaboration of two significant documents: the 17 Sustainable Development Goals (SDGs) and the Paris Agreement [3,4]. Both documents emphasize the urgent need to preserve and promote sustainability in urban centers. In this context, several city models have been proposed with the aim of making the city more sustainable: Tactical Urbanism [5], New Urbanism [6], Smart Cities [7], Superblock [8], and the 15-Minute City [9] are some of them. All of them converge on the principles of the population’s right to accessibility to goods and services as well as the need to promote mixed uses of urban fabrics and to reduce dependence on the car. In some way, all these models constitute a critical opposition to the postulates of the Modern Movement. Likewise, the need for community spaces in different neighborhoods and the participation of the population in the processes of transformation of the city seem to be unavoidable.
The 15-Minute City model, named by Carlos Moreno in 2016, emerged as being simultaneously holistic and pragmatic as an assessment tool. According to Moreno, this city model is based on four fundamental principles: proximity, density, diversity, and ubiquity [3]. The concept has since been studied by other authors and applied to various cities.
So far, no study on the application of the model as an element of evaluation of the quality of urban space has been carried out in Lisbon.
This paper has two main objectives: the first is to assess two different neighborhoods in Lisbon—Alvalade and Marvila—in terms of their alignment with the 15-Minute City model. This involves evaluating aspects such as accessibility to essential services, population density, diversity of amenities, and overall integration within the urban fabric. Secondly, this paper aims to identify and propose urban improvements that can enhance these neighborhoods’ functionality and sustainability. By focusing on these objectives, this paper seeks to contribute to the broader goal of promoting urban resilience, ensuring that these areas can adapt to and thrive amidst changing environmental, social, and economic conditions.
To achieve the proposed objectives, the different indicators used within the framework of the 15-Minute City were identified after the literature review. From this set of indicators, the relevant ones were grouped into three dimensions: population, housing, and accessibility.
After this, we proceeded with the choice and delimitation of the case studies. Two adjacent areas in the city of Lisbon, with distinct urban forms, and significantly different planning and development processes were chosen. Finally, we proceeded to suggest improvement measures adapted to the needs and potential of each of the areas in this study. It is expected that the application of the proposed methodology can be replicated in urban areas of different cities or even countries so that we can have urban areas that are more sustainable and that can provide a better quality of life to their inhabitants.
1.1. Origin and Concept of Sustainable Urbanism
Since the beginning of the 20th century, several events have led urban planners and architects from various parts of the world to develop and discuss different city models.
At the end of the 19th century, Ebenezer Howard presented the proposal of the Garden City. This utopian model, developed during a period of intense demographic growth, aimed to combine the experience of country life with the advantages of urban community living. Associated with this model is the work of Clarence Perry, who, in 1923, defined the neighborhood unit model. This model sought to bridge social inequalities and foster a sense of community by promoting physical proximity to services and facilities. Thus, each resident of each neighborhood unit could, just by walking 400 m, complete all their daily life needs [4].
Simultaneously, the emergence of the model that became known as Modern Urbanism [10]. This proposal by Le Corbusier emerged as a response to the need for quick and inexpensive reconstruction of cities destroyed during World War II. Although this model can be considered a fusion of the two previous models, since it has the same main goals, its materialization is quite different.
Despite the good intentions stated by the proposal, it soon began to receive criticism, which argued that it harmed not only residents but also the urban environment since it contributed to the deterioration of social conditions and segregation [4].
The paradigm changed with the introduction of the concept of “Sustainable Development”, which was stated later in the document Brundtland Report—Our Common Future of 1987. Sustainable development is understood as “the process of change in which the exploitation of resources, the targeting of investments, technological development and institutions are in harmony and enhance the achievement of present and future needs and aspirations” [11]. When it comes to urbanism, it is considered that there are four main and essential symbiotic dimensions: environmental, social, economic, and institutional [12].
Furthermore, in 2015, the United Nations member states adopted a document called “The 2030 Agenda for Sustainable Development”, which aimed to “establish a comprehensive plan of action to achieve peace and prosperity for all individuals and the planet, both now and in the future” [13]. This document lists seventeen well-defined goals that seek to end poverty and other deprivations, coupled with strategies that promote improved health, education, reduction in inequalities, and stimulation of the economy while developing methods to combat climate change and protect oceans and forests [13]. As a form of continuous evaluation, the implementation of these measures is annually assessed in a document called the “Progress Towards the Sustainable Development Goals Report”.
In addition, different strategies of promoting sustainable development have emerged and have been implemented over the past few years. Among these strategies, the European Green Deal and the New European Bauhaus promoted by the European Commission stand out. These initiatives seek in a symbiotic way to make life more beautiful, sustainable, and inclusive through projects designed and submitted by inhabitants or European entities [14].
In recent years, given the recent pandemic situation, the results stated in the document “Progress Towards the Sustainable Development Goals Report” have shown quite large setbacks in all the defined goals.
1.2. The 15-Minute City: Concepts of Proximity, Diversity, Density, and Ubiquity
The 15-Minute City model was first enunciated in 2016 by researcher Carlos Moreno [3]. This proposal is based on the concept of “chrono-urbanism”, which consists of believing that “the quality of urban life is inversely proportional to the amount of time that is invested in travel, especially if this is done by car” [9]. Thus, the author argues that residents should be able to access the services and amenities necessary for their daily lives within a maximum of 15 min, either on foot or by bicycle. The definition of the spaces that this 15-minute radius should cover is based on the definition of six main needs: housing, work, commerce, health, education, and leisure [9] (Figure 1).
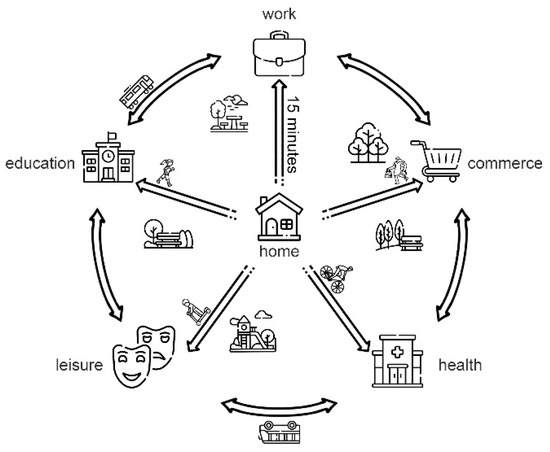
Figure 1.
Schematic of the 15-Minute City model. Adapted from Groupe Paris en Commun (2021) [15].
Currently, the need to design a new urban planning model has become even more critical. These new models should ensure, above all, the preservation of the habitability and well-being of a given city and its residents while seeking to minimize the social inequalities experienced [16]. In this sense, the advantages of adopting an urban model such as the one proposed by Carlos Moreno become even more evident since this could become fundamental to mitigating the problems that are arising or could arise in the future.
We can conclude that the main goal of this model is to build more cohesive, more sustainable, and more resilient communities. To fulfil this goal, we intend to change the current paradigm of urban space in its different aspects, including environmental, social, economic, and institutional aspects, enabling this space to enhance the quality of life of its different users.
1.3. Examples of Applications of the 15-Minute City Model
We analyzed different case studies to understand how this model can be applied. The first example is the Paris en Commun plan, which aims to transform Paris into a 15-Minute City by 2024. Paris was one of the first cities to start this process, and its plan was assisted by the researcher Carlos Moreno himself. The basic principles of the plan are the intent to significantly reduce greenhouse gas emissions and the ambition to improve the quality of life of its inhabitants [17,18]. To achieve the proposed goals, a five-pronged strategy is defined: promote the mixed use of pre-existing buildings, encourage active mobility, promote affordable housing, and strengthen local promotion and participation initiatives [19].
The Paris en Commun plan is based on the concept of the 15-Minute City seeking to improve proximity to the different services and equipment needed to complete the different activities of daily life, to foster the diversity of uses and cultures of its residents, to enable a greater density of residents with good quality of life, and to encourage ubiquity by offering equal conditions and upgradeability to all residents.
The second project under analysis is the one carried out for the city of Milan: Milan 2020 Adaptation Strategy. This is a strategic post-pandemic recovery plan that intends to start the transformation of the Italian city according to some of the principles of the model. This strategy aims to intervene in public transportation networks and public spaces. In this way, it is intended to improve the accessibility of all inhabitants to quality services and public spaces, properly connected through a network of infrastructure for active and inclusive mobility [18]. Thus, to meet these objectives, the plan suggests three measures to be implemented: create a road and pedestrian infrastructure such that residents prefer active mobility, radically reduce car traffic, and identify reversible measures to immediately combat the consequences resulting from the COVID-19 pandemic [17,20].
The strategy to be applied in Milan seeks a city focused on the social and economic spheres, designed to create permeable spaces that contribute to its residents’ physical and psychological well-being [17,20].
1.4. Indicators for Evaluating the Implementation of the 15-Minute City Model
To evaluate the implementation of the 15-Minute City model, it is necessary to identify which dimensions need to be assessed and which indicators allow for this evaluation.
Recent studies have explored indicators to assess the implementation of the 15-Minute City concept in various urban contexts, focusing primarily on European cities and mostly on the dimension of proximity (e.g., Murgante et al. [21]; J. Carot & Villalba [22]; or Staricco [23]). In this paper, the selection of indicators for evaluating two neighborhoods in Lisbon—Alvalade and Marvila—in terms of their alignment with the 15-Minute City model aims to address the four pillars and is primarily based on the works of G. Pozoukidou and Z. Chatziyiannaki [19], Gaglione et al. [24], and L. Abdelfattah et al. [25].
G. Pozoukidou and Z. Chatziyiannaki focused their study on assessing three dimensions of the 15-Minute City: inclusion, health, and safety. From their work, it was possible to establish the connection between these dimensions and the four pillars defined by Carlos Moreno, which aim to evaluate proximity to various facilities and services, diversity of uses and transportation, density of housing, services, and facilities, as well as the ubiquity of collaborative processes and equal access (see Table 1).

Table 1.
Overview of key indicators from the literature for evaluating the 15-Minute City model.
Gaglione et al. [24] focused their research on the evaluation of the city of Napoles, according to the definition of a set of indicators related to socioeconomic characteristics, characteristics of the urban fabric, and characteristics of pedestrian infrastructure [24]. From this paper, it is possible to conclude that it only relates to two of the pillars defined by Carlos Moreno: proximity when assessing the connectivity and walkability of pedestrian infrastructure and density when gauging it for population and construction.
Finally, the last authors use three levels of analysis: (i) mapping the resident population and the density of workers in their workplaces to understand which areas attract more residents and which ones generate more commuting; (ii) mapping daily services, which are indispensable for carrying out the activities of daily life; and (iii) using the Walk Score metric (combinability assessment method) to get a more holistic view of the results [25]. These dimensions can be transposed to the proximity, diversity, and density pillars defined by Carlos Moreno as they seek to assess the proximity of residents to the services they need on a daily basis.
Table 1 summarizes the literature review on the various key indicators used to evaluate the 15-Minute City model.
2. Materials and Methods
2.1. Dimensions Under Analysis
To apply the 15-Minute City Model, it is suggested that the urban landscape be restructured to ensure the presence of 4 components: proximity, diversity, density, and ubiquity [3]. The first pillar, proximity, encompasses both spatial and temporal dimensions. This component is central to promoting the quality of life, as it enables residents of a given area to meet their basic needs within 15 min [3]. In relation to this pillar, it is also essential to consider the walkability of each area, which refers to how effectively an area supports and encourages pedestrian mobility.
This concept was broadly explored by Jeff Speck [26], who developed the General Theory of Walkability. Speck argues that, for an area to be conducive to pedestrian mobility, it must strive to be useful, safe, comfortable, and interesting. These principles align with the research conducted by the London Planning Advisory Committee, which introduced a multi-dimensional 5C framework [27]. This framework has been widely adopted and remains influential in contemporary studies [28,29].
In this context, Moura et al. [30], in the IAAPE project (Indicators of Pedestrian Accessibility and Attractiveness), define a set of indicators that seek to measure walkability on each street, according to seven criteria of distinct nature, called the 7Cs: connectivity, comfort, convenience, conviviality, clarity, co-existence and commitment. Regarding the work carried out within the framework of this model, specific to the city of Lisbon, we would like to highlight the work of Banza, who created an interactive map of some of Lisbon’s parishes. The aim of this interactive map is to survey the various facilities and services in each parish in order to see if they are within a 15-minute radius of the parish’s geometric center [31].
Diversity is related to the physical space and those living in it. Thus, an urban space should not only offer a diversity of facilities and activities but also seek a mixture of cultures and social backgrounds to build a more efficient and productive population. As a result, it has become a more harmonious and peaceful urban environment, minimizing the segregation and marginalization of different cultures [9].
The third pillar is density, which, for this model, means the number of inhabitants who can live comfortably and sustainably, considering the resources and infrastructure available. This component’s completeness ensures an adequate supply for the needs of each population, allowing generalized and equal access to different infrastructures and services [9].
Finally, ubiquity arises from the importance of ensuring that the other three pillars remain up to date. Furthermore, this component ensures that the facilities provided by technological advances are not only within the reach of the wealthy. In this way, it is intended to promote a cohesive and equitable city, also based on access to the technological resources themselves to encourage harmonious co-existence [3].
Based on the survey of indicators analyzed in the articles listed in Table 1, we proceeded to the definition of a new set of indicators, divided into three dimensions: population, housing, and accessibility. These dimensions are considered fundamental to fulfilling the needs for proximity, diversity, density, and ubiquity, as stated by Carlos Moreno.
To evaluate the population dimension, we sought to use indicators that analyze its social and economic characteristics. The chosen indicators were density, average age, aging index, educational level, literacy rate, and unemployment rate.
To measure the housing dimension, indicators have been selected to characterize it from different perspectives, studying how access to housing is made possible and the conservation conditions of buildings. The chosen indicators were housing diversity, construction period, occupancy scheme (owner-occupied, rented out, vacant, or used for other purposes, such as housing), and average sale price of housing units.
Finally, to evaluate the accessibility dimension, a set of indicators based on the literature review [19,21,22,23,24,25] was established. For most indicators, the goal was to estimate the percentage of the resident population served by key travel destinations or points of interest essential for daily activities within a specific time threshold. These destinations include workplaces, local public amenities (such as community facilities and public spaces), local commercial and service areas, and connections to public transport networks (see Table 2).
Table 2.
Definitions of all indicators, measurement units, and sources for data collection.
To obtain these values, isochrones associated with the key travel destinations mentioned earlier were first defined. Isochrones are lines connecting all points equidistant in time or distance—in this case, within a 5-minute or 15-minute walking distance—from a central point representing the points of interest essential for daily activities. The next step involved cross-referencing data from the 2021 Census statistical subsections (corresponding to the size of a city block) with the area defined by the isochrone to estimate the percentage of the population covered within certain walking distances from important services and community facilities.
All the indicators applied in this work are listed in Table 2 below, along with their definitions, units of measurement, and sources for data collection.
2.2. Case Studies
“The site of Lisbon answered perfectly to the requirements for building a city” [40]. This is mainly due to its privileged location near the Tagus River, which led to the development of the city along its banks until the end of the 19th century. In 1938, during the period of Estado Novo, Étienne de Gröer defined a General Plan for the Urbanization and Expansion of Lisbon that had three main objectives: define the structuring roads, the urban limits, and the strategy of articulation of the city as a whole [40]. Since then, the city of Lisbon has developed in all directions, assuming a fundamental role towards its peripheral areas.
The selection of the two case studies, Alvalade and Marvila, was based on the fact that, despite being contiguous (Figure 2), they have quite different planning and development processes in their genesis, leading to different urban forms.
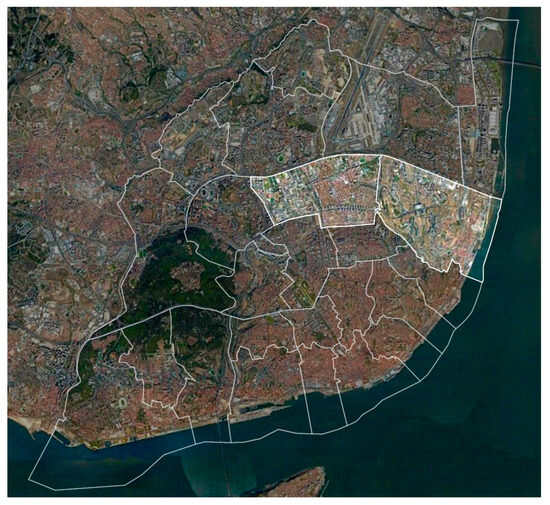
Figure 2.
Orthophotomap with indications of the study cases, Alvalade (in the center) and Marvila (on the right). Adapted from Câmara Municipal de Lisboa (2016) [37].
2.2.1. Alvalade
Until the mid-twentieth century, the parish of Alvalade was characterized by the presence of small farms owned by the aristocracy. This area changed little in its characteristics until the end of the 19th century, when it became an expectant place due to the expansion plan for the northern part of Lisbon (the Avenidas Novas Plan) proposed by Frederico Ressano Garcia. Significant development occurred in the 1940s with the Alvalade Urban Plan (Plan for the South Area of Avenida Alferes Malheiro), prepared by João Guilherme Faria da Costa in 1945.
Ideologically, the urban plan for the Alvalade neighborhood represents a significant moment of urban rupture on a city-wide scale, encouraged by the climate of opposition to the dictatorship of the Estado Novo regime. In this context, the Alvalade neighborhood was designed, assuming multidisciplinary and global planning and promoting the city’s development towards the east in an irreversible way [40].
The neighborhood comprised eight structural cells that developed around a main public facility, the elementary school. In this way, the distance from this amenity to each dwelling was in accordance with the distance a child could walk. Thus, the plan proposed a hierarchy of amenities, positioning the higher-ranking ones on the main roads and the streets bordering the cells.
The buildings erected were developed in height and sought to house different social classes, promoting interaction between them. The plan also stands out for the provision of other types of collective equipment, as well as for the creation of areas for commerce and small industry. In addition, a transport network based on railroads, electric rails, and buses was designed, to which the subway was added in the 1960s when its expansion took place [40].
It is possible to draw a parallel between this plan and the 15-Minute City model since the latter contemplates proximity (physical proximity between residents and the equipment and services needed in their daily lives), diversity (both social and physical), density (of housing, community facilities, and services) and ubiquity (ensuring equal opportunities across different socioeconomic classes).
Furthermore, in 1952, the northwestern area was developed with the construction of the National Library and the beginning of the construction of the new Lisbon University Campus (Cidade Universitária) by Porfírio Pardal Monteiro [41]. This area underwent further development in the 1980s with the construction of the National Archive of Torre do Tombo and new university faculties.
In 2012, following an administrative reorganization, the new parish of Alvalade was formed through the merger of three adjacent former parishes: Alvalade, Campo Grande, and São João de Brito. It now encompasses a total area of 534 hectares and has a population of 33,309 inhabitants [2]. Maintaining essentially the same pattern of mixed uses proposed in the original Alvalade Urban Plan, this residential neighborhood in Lisbon is a centrally located, well-consolidated urban area with a significant presence of important public facilities and amenities. Currently, the largest investments in this area focus on major projects for the requalification of public spaces and the creation of new infrastructure, such as bike paths and leisure and recreational spaces [28]. Currently, the largest investments made in this area are related to major projects for the requalification of public space, as well as in the creation of new infrastructure, such as bike paths and leisure and recreational spaces [42].
2.2.2. Marvila
Due to its favorable natural conditions, especially due to the presence of a riverfront, the area of Marvila has always been important to the people who have inhabited it over the years. In the 12th century, the area of Marvila was given to the Mitra of Lisbon, which resulted in the properties being given to the Cathedral’s canons. Later, during the 15th century, these lands and buildings took on the function of housing for the aristocracy or as the headquarters of conventual orders. With the expulsion of the religious orders in 1834, the convent spaces were left uninhabited, which promoted the establishment of more spaces for industry and housing for its workers [43]. This industrial and port character was reaffirmed with the creation of the railway in 1856 and the building of the future Santa Apolónia station during the 1860s, making it possible to transport goods both by land and by sea.
In the 1960s, development in the northwestern part of the current parish focused on building affordable housing to address the growing housing shortage. To achieve this, the Technical Housing Office (Gabinete Técnico de Habitação-GTH) was established to impose social and urban order in the city and reduce subletting and the prevalence of slums [41].
The urban form was heavily influenced by the principles of the Charter of Athens, which largely neglected the role of empty urban spaces. This approach emphasized the separation of uses and functions and contributed to the isolation of the traditional city due to surrounding boundaries (in the Lynchian sense), including the railway line, Av. Marechal Gomes da Costa, and Av. Gago Coutinho. These factors resulted in a morphologically fragmented and socially marginalized district.
In the 1990s, the extension of Av. dos Estados Unidos da América to Marvila improved connectivity between this neighborhood and the traditional city.
The Chelas Urban Plan, developed in 1964 by the GTH, continued the urbanization of the eastern area with the primary objective of providing residents with “bands of intense urban life.
These strips were intended to combine several programs, associating housing with places of commerce, culture, schools, sports, social amenities, and workplaces [44]. However, given the need for the expropriation of land for the implementation of the plan and the consequent need to rehouse its former inhabitants, this new neighborhood ended up taking on the role of housing families in situations of social vulnerability. Thus, in addition to not fulfilling the purpose of being a point of diversity, it also failed to materialize the “bands of intense urban life” due to the difficulty of settling commerce and consequent re-appropriation for housing.
Currently, with an area of 712 hectares and 35,479 inhabitants [2], this parish continues to experience worsening socioeconomic conditions, highlighting the need for initiatives aimed at mitigating this issue. Among these initiatives, the “Viver Marvila” program, an Integrated Rehabilitation and Development Program promoted by the Lisbon City Council and the Housing and Urban Rehabilitation Institute, created in 2009, stands out.
In addition, recent years have seen significant development along the eastern riverfront, driven by private investment, such as high-end housing complexes and the conversion of former industrial spaces into venues for cultural activities and businesses.
2.3. Data Collection
2.3.1. Population Dimension
A set of indicators, as described in the methodology, are enumerated in Table 3 to measure the population dimension.
Table 3.
Indicators referring to the population dimension, measurement units, and sources for data collection.
Through the analysis of this table, it is possible to see that both parishes have an average age of 45 years, along with similar values for the dependency index (0.61 in Alvalade and 0.56 in Marvila) and the aging index (0.19 in Alvalade and 0.18 in Marvila). However, it is important to note the disparity between the population density values, with Alvalade having a higher value (62 inhabitants/ha) compared to Marvila (50 inhabitants/ha).
The indicators evaluating the academic level of each parish show that the population of Alvalade has a higher level of development compared to Marvila. This is highlighted by the difference in the percentage of individuals with higher education (42% in Alvalade and 11% in Marvila), the illiteracy rate (1% in Alvalade and 5% in Marvila), and the unemployment rate (6% in Alvalade and 14% in Marvila). These data also reflect the socioeconomic differences in the 2 areas.
2.3.2. Housing Dimension
To assess the housing dimension, a set of indicators was defined to characterize the typological variety, the state of conservation of the dwellings in each case study, and their occupation regime and purchase value (Table 4).
Table 4.
Indicators referring to the housing dimension, measurement units, and sources for data collection.
Regarding the indicators related to housing diversity, in both cases, multifamily buildings (69% in Alvalade and 73% in Marvila) and privately developed buildings (94% in Alvalade and 56% in Marvila) are the most present. However, in comparing the latter, it should be noted that despite the predominance of private development in Marvila, there is a more balanced distribution (44% state development and 56% private development) between state-owned and privately developed buildings compared to Alvalade.
Furthermore, it is worth noting the difference in the most characteristic occupation regime of the two parishes, owner-occupied housing in Alvalade (with 52%) and rented housing in Marvila (corresponding to 50%), even though the average sale price of dwellings in Alvalade (on average, 3944 €/m2) is higher than that registered in Marvila (on average, 3493 €/m2).
Finally, with the analysis of the state of the dwellings, we realize that, in both cases, there is a predominance of dwellings without need of repair.
2.3.3. Accessibility Dimension
Evaluating the accessibility dimension involves determining the percentage of inhabitants in the neighborhoods of Alvalade and Marvila who have access to key travel destinations or points of interest essential for daily activities within a specific time threshold [19,21,22,23,24,25]. These destinations include workplaces, local public amenities (such as community facilities and public spaces), local commercial and service areas, and connections to public transport networks (see Table 5).
Table 5.
Indicators referring to the accessibility dimension, measurement units, and sources for data collection.
The accessibility of inhabitants in each neighborhood to workplaces is based on data from the 2021 Census. In Alvalade and Marvila, the differences are not significant: the average commute time for the employed population in Alvalade is approximately 19.0 min, while in Marvila, it is 22.3 min. At the national level, more than half of the employed population (57.7%) commuted up to 15 min from home to work. Additionally, 30.4% required between 16 and 30 min, and 3.9% needed over an hour to complete their journey. The longest average commute times were recorded in the Lisbon Metropolitan Area, with an average duration of 25.9 min. [2].
To evaluate the accessibility of the resident population to community facilities and public spaces relevant to daily life, as listed in Table 5, the first step involved mapping their locations in each neighborhood. These destinations included, namely, health centers, educational facilities (categorized by typology, such as elementary schools, middle schools, and high schools), cultural facilities, sports facilities, social and community facilities, children’s playgrounds, and open-door fitness facilities.
For each different type of community facility, a separate map was developed, where isochrones from each point were defined (see Figure 3, Figure 4, Figure 5, Figure 6, Figure 7, Figure 8, Figure 9, Figure 10 and Figure 11). Isochrones, represented as lines connecting points of equal travel time from a given location, provide a temporal and spatial visualization of accessibility. This approach goes beyond traditional measurements of physical distance to capture the areas effectively reachable from critical locations—a particularly important consideration when evaluating the quality of access in urban contexts [45,46].
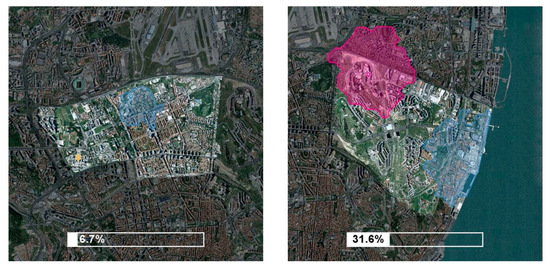
Figure 3.
Isochrones showing the boundaries of areas reachable within a 15-minute walking distance from each local public healthcare facility, along with the estimated percentage of the resident population within these areas, i.e., those who can access these facilities within 15 min from their homes.
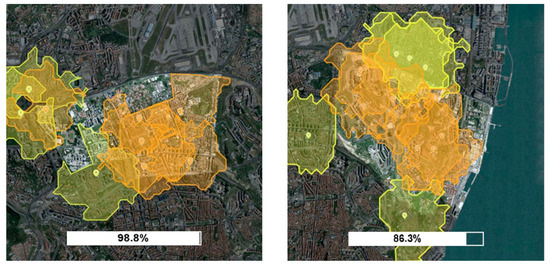
Figure 4.
Isochrones showing the boundaries of areas reachable within a 15-minute walking distance from each elementary school (represented in dark yellow, while the isochrones corresponding to nearby high schools are shown in light yellow), along with the estimated percentage of the resident population in the age cohort of 6–9 years within these areas, i.e., those who can access these facilities within 15 min from their homes.
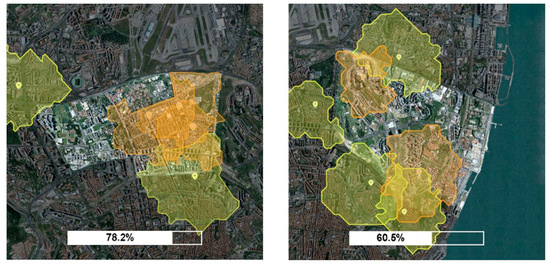
Figure 5.
Isochrones showing the boundaries of areas reachable within a 15-minute walking distance from each middle school (represented in dark yellow, while the isochrones corresponding to nearby high schools are shown in light yellow), along with the estimated percentage of the resident population in the age cohort of 10–14 years within these areas, i.e., those who can access these facilities within 15 min from their homes.
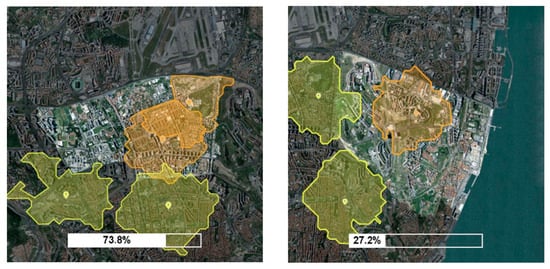
Figure 6.
Isochrones showing the boundaries of areas reachable within a 15-minute walking distance from each elementary school (represented in dark yellow, while the isochrones corresponding to nearby high schools are shown in light yellow), along with the estimated percentage of the resident population in the age cohort of 15–18 years within these areas, i.e., those who can access these facilities within 15 min from their homes.
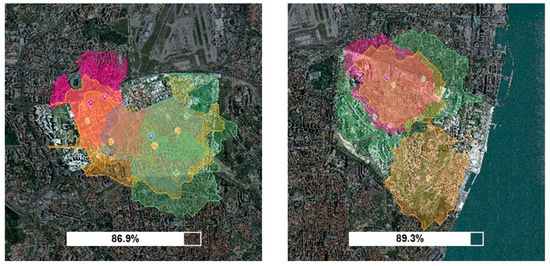
Figure 7.
Isochrones showing the boundaries of areas reachable within a 15-minute walking distance from cultural facilities (each color represents a different type, such as cinemas or libraries), along with the estimated percentage of the resident population within these areas, i.e., those who can access these facilities within 15 min from their homes.
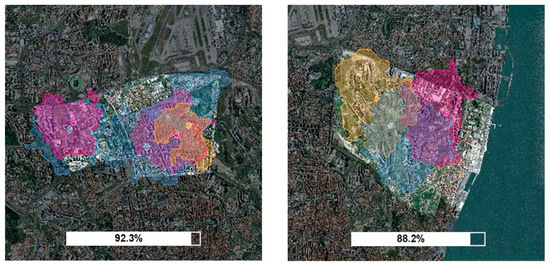
Figure 8.
Isochrones showing the boundaries of areas reachable within a 15-minute walking distance from sport facilities, along with the estimated percentage of the resident population within these areas, i.e., those who can access these facilities within 15 min from their homes.
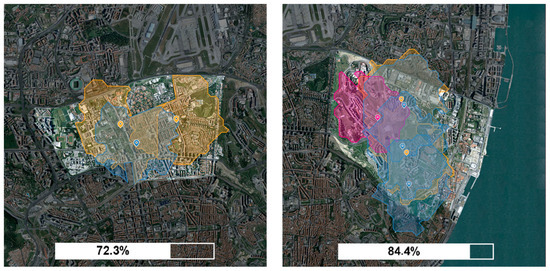
Figure 9.
Isochrones showing the boundaries of areas reachable within a 15-minute walking distance from social action facilities (each color represents a different type), along with the estimated percentage of the resident population within these areas, i.e., those who can access these facilities within 15 min from their homes.
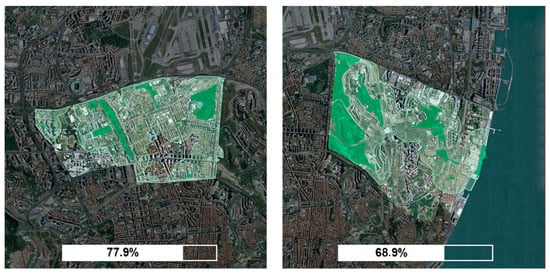
Figure 10.
Isochrones showing the boundaries of areas reachable within a 5-minute walking distance from gardens or parks, along with the estimated percentage of the resident population within these areas, i.e., those who can access these facilities within 5 min from their homes.
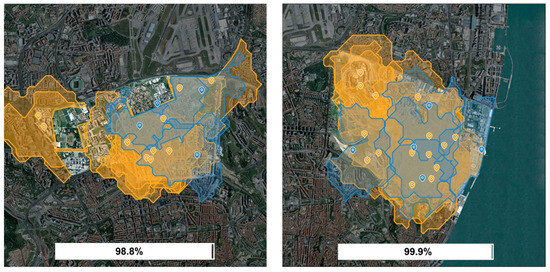
Figure 11.
Isochrones showing the boundaries of areas reachable within a 15-minute walking distance from children’s playgrounds (yellow) and outdoor fitness facilities (blue), along with the estimated percentage of the resident population within these areas, i.e., those who can access these facilities within 15 min from their homes.
To calculate the isochrones, TravelTime software (https://traveltime.com) was used [34]. Conceptually, in this type of software, transportation infrastructure networks, such as roads and public transit systems, are incorporated into an algorithm through detailed geospatial data. These data include the locations, types, and attributes of transport routes, as well as schedules and travel speeds for different transport modes, such as walking, cycling, private cars, and public transit. By accounting for the infrastructure and operational characteristics of transport networks, the algorithm calculates isochrones that reflect realistic accessibility based on the available transport options. In this paper, since the purpose was to evaluate and compare the quality of access to local public amenities relevant to daily life at the neighborhood scale, the isochrones were calculated based on walking distances and speeds.
The second step was to estimate the resident population in each neighborhood that has access to these facilities and public spaces within a walking 15-minute distance.
By overlaying the spatial areas defined by the isochrone lines with the resident population data from the 2021 Census, which is organized into statistical spatial subsections (small geographic units corresponding to building city blocks), it is possible to estimate the percentage of the population within these areas, i.e., those who can access these facilities or services within 15 min. In the case of access to school facilities, the population data from the 2021 Census considered correspond to the age cohorts relevant to each type of school.
The implementation of this methodology reveals some differences in accessibility between the two neighborhoods. In Figure 3, it is shown that in Alvalade, only around 6% of the resident population has access to local healthcare facilities within a 15-minute walking distance, while in Marvila, the value is about 32%. This suggest that Marvila has better performance in terms of accessibility to local healthcare facilities within a short walking distance, which is partially explained by the fact that, in Marvila, the healthcare facility (isochrone in blue) has an extension in the northern area of the parish (isochrone in blue in pink)."
Figure 6, for example, shifts the focus to high schools, illustrating the areas reachable within a 15-minute walking distance from each high school in both neighborhoods (represented in dark yellow, while the isochrones corresponding to nearby high schools are shown in light yellow). In this case, Alvalade performs better: almost 74% of the population has access to this type of facility within a 15-minute walking distance, whereas in Marvila, less than 30% does.
For the other types of community facilities analyzed, such as cultural centers, sports facilities, and social action facilities, the results indicate more balanced performance between the two neighborhoods (see Table 5 and Figure 3, Figure 4, Figure 5, Figure 6, Figure 7, Figure 8 and Figure 9). These findings suggest that, overall, access to the analyzed community facilities, as measured by this indicator, tends to be fairly equitable across Alvalade and Marvila.
In the calculation of the isochrones for gardens and parks, we followed the 3-30-300 rule [47], an urban planning guideline designed to enhance accessibility to green spaces. This rule emphasizes that every resident should be able to see at least three trees from their home, live in an area with 30% tree canopy cover, and have access to public green spaces within 300 m (an approximately 5-minute walk). To apply this rule, all green spaces in both neighborhoods were mapped, and then, the isochrones corresponding to the 300 m distance from these public green spaces were calculated (Figure 10).
Regarding children’s playgrounds and outdoor fitness facilities, the method applied was the same as for the other facilities. Therefore, the walking distance considered to calculate the isochrones was 15 min (Figure 11).
In the context of the 15-Minute City, accessibility to local commerce and services is also a key factor in evaluating the overall performance of urban neighborhoods. Therefore, the main commercial streets and other key commercial hubs were initially mapped. This approach focused purely on the spatial distribution of commercial activity, without considering the range of goods and services offered in terms of size, scope, and target market. Along the commercial streets, a central point was assumed, from which the isochrones were calculated. The results show that, in both cases, almost the entire area is covered (Figure 12).
Figure 12.
Associated isochrones showing the boundaries of areas reachable within a 15-minute walking distance from commercial areas (represented in orange), along with the estimated percentage of the resident population within these areas, i.e., those who can access these activities within 15 min from their homes.
In addition, accessibility to public and active transport modes was also considered. In Figure 13, bus lines and stops, subway lines, and train stations are mapped, while Figure 14 represents the cycling network. From this analysis, it is evident that Alvalade is well served by public transport, with significant multimodality provided by several bus lines, two distinct subway lines, and a train service. However, the cycling network remains insufficient, as it does not provide comprehensive coverage across all key routes. Similarly, Marvila is also well served by public transportation. Regarding the cycling network, although it is more extensive in terms of distance compared to Alvalade, it is limited by the pronounced slopes, which make it more challenging to use the bike paths (Figure 14). Additionally, Marvila lacks a bike sharing service, while in Alvalade, bike parking stations are strategically placed near key destinations, such as public transport hubs, commercial centers, educational institutions, parks, and recreational areas.
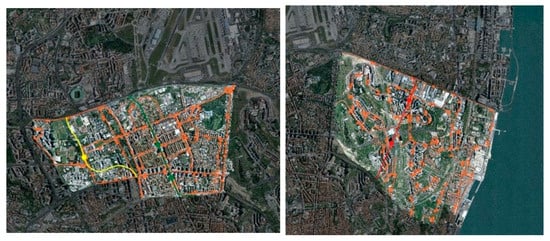
Figure 13.
Cartography with representation of the stops and routes of public transport in the parishes of Alvalade and Marvila (yellow, green, and red underground lines and orange bus lines).
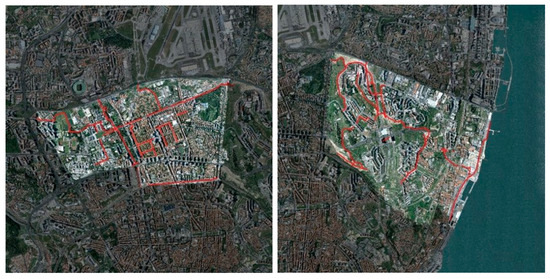
Figure 14.
Cartography showing the bicycle path network in the parishes of Alvalade and Marvila. Adapted from Câmara Municipal de Lisboa (n.d.) [48].
Data from the 2021 Census were used to analyze the modal distribution, which refers to the number of trips by each mode of transport relative to the total number of trips in Alvalade and Marvila. In both cases, trips by private car are significantly predominant, accounting for around 79% of all trips, while trips by walking and bicycle are minimal.
Finally, to enhance the analysis of the accessibility dimension, based on the isochrone results and the spatial analysis of existing public and active transport infrastructure (systematized in Table 5), additional factors that influence walkability and mobility but were not fully captured by the previous methods were considered at a qualitative level, namely, terrain elevation and the typological and morphological characteristics of the built environment.
Figure 15 represents the Digital Terrain Model (DTM). The model was generated using the 3D Analyst tools of ArcGIS software (https://www.arcgis.com), based on the elevation points and contour lines found in a Digital Elevation Model of the municipality. The difference between the relief of the two study cases is significant. Alvalade presents more constant relief without major changes in elevation, while Marvila, in opposition, is characterized by large slopes. Thus, we can conclude that the parish of Alvalade presents more characteristics favorable toward pedestrian mobility, thus making it more walkable.
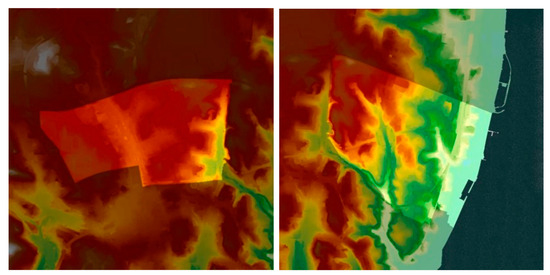
Figure 15.
Digital Terrain Model of the parishes of Alvalade and Marvila. The green areas represent the lowest elevation values, while the brown-red areas correspond to the highest elevation values. Adapted from Câmara Municipal de Lisboa (n.d.) [37].
Through the analysis of the typological and morphological maps for each case study, significant differences become evident. The parish of Alvalade exhibits a more regular and hierarchical morphology, which enhances both public spaces and street layouts. In contrast, the parish of Marvila features a more dispersed and irregular morphology, leading to poorly defined public spaces and weak connectivity within the area. Based on this analysis, it can be concluded that Alvalade offers characteristics such as comfort, connectivity, and cohesion, making it more walkable than Marvila (see Figure 16).
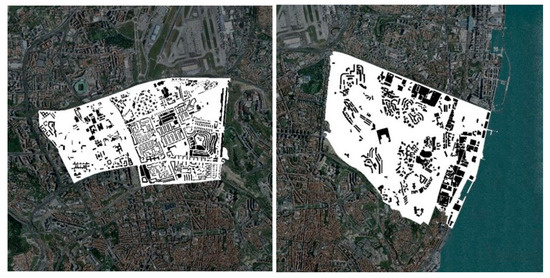
Figure 16.
Typomorphological cartography of the parishes of Alvalade and Marvila. Adapted from Câmara Municipal de Lisboa (n.d.) [37].
Figure 17 shows maps from a predictive model in raster format, developed by the Municipality of Lisbon, indicating where pedestrians are most likely to be in the city. The model was created using the GIS network analyst and multi-criteria techniques and considers three key variables: (i) traffic generators: fixed points that attract pedestrians to use the pedestrian network, such as public facilities, shopping areas, or transit stations; (ii) hierarchy of the road network: pedestrian movement is, by definition, prohibited on first-level roads; however, on some second-level roads, although pedestrian circulation is theoretically allowed (with segregation), current conditions often make it impractical and therefore less frequent (e.g., due to a lack of sidewalks); and (iii) population density: since the resident population uses the sidewalks in their neighborhood daily, it is natural that areas with higher population densities have greater concentrations of pedestrian flows.
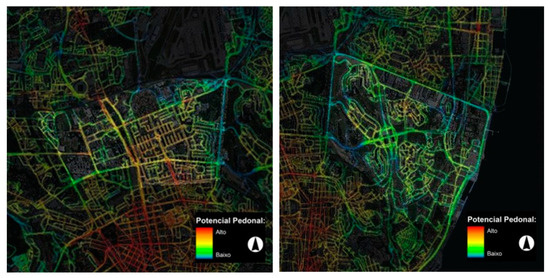
Figure 17.
Pedestrian Potential Map of the parishes of Alvalade and Marvila (in red, the highest values, and in blue, the lowest values). Adapted from MAPPe—Mapa de Potencial Pedonal de Lisboa, Câmara Municipal de Lisboa (2022) [49].
From the analysis of these maps, and in line with previous observations, it is clear that the pedestrian network in Alvalade has characteristics that make it more walkable (as seen mostly in yellow and orange), whereas in Marvila, the predominant green and blue areas indicate lower pedestrian potential.
This is likely due to factors related to its modernist-inspired genesis, such as the presence of larger, isolated residential blocks and public spaces that may not prioritize pedestrians. Specifically, the road network in Marvila is less integrated and more car-centric, which limits pedestrian accessibility and comfort. These morphological and infrastructural elements combine to reduce the overall walkability of the area, contributing to its lower pedestrian potential compared to Alvalade.
Overall, from the results obtained and summarized in Table 5, it is evident that, although Marvila performs better in certain aspects—such as a higher percentage of residents covered by isochrones for cultural, social, and community welfare facilities—the parish of Alvalade, due to its physical, urban, and social characteristics, demonstrates greater walkability. As discussed in Section 2.2.2 and shown in Figure 16, the Marvila neighborhood has historically suffered from a lack of integration within the city, whereas Alvalade supports pedestrian mobility in a connected, comfortable, convenient, convivial, clear, co-existent, and committed manner, as outlined by the 7C framework for accessing walkability proposed by Moura et al. [40] or in other works with similar approaches, such as Santos et al. [50], and earlier studies, including the Quality of Pedestrian Level of Service (Q-PLOS) method [51].
3. Results: Comparative Analysis
In what specifically concerns the parish of Marvila, the worst-performing case study, quite profound changes are needed, and a serious discussion is required.
In the characterization of the population, the differences in education and unemployment levels are clear, revealing Marvila as an area of great social and economic fragility.
As for the data related to the characterization of housing, the comparison between the two neighborhoods seems balanced. It is not. The data collected do not characterize the lack of quality of building designs and the inadequacy of the architectural design. In fact, the design of the buildings in Marvila suffers, in our point of view, from the vicissitudes already widely debated, and that can be attributed to modernist architecture not being able to respond to the desires of its inhabitants. Indicators that can describe the satisfaction of the inhabitants with the spaces they inhabit should be introduced in future studies. In the same way, the monofunctionality of residential use does not contribute, unlike the case of Alvalade, to the urban qualification of this area. Also, at this point, new indicators will need to be introduced for a deeper urban analysis.
With regard to the indicators related to access to green spaces and other facilities that reflect the “superiority of Marvila”, they will also have to be better framed in future studies. What is the point of having many green spaces if they are not properly maintained and are unsafe? Indicators related to the maintenance of spaces and their safety should be introduced in future analyses.
The indicators that have been used so far to assess the proximity of urban areas to the 15-Minute City model need to be framed and accompanied by new indicators that can fine-tune the model, such as indicators related to the population’s satisfaction with housing and indicators related to the safety and maintenance of public spaces. Any of these factors is important enough to change the reading of the data collected.
Specifically, regarding accessibility, this paper presents a methodology to identify which parts of the neighborhoods and what percentage of the population can access points of interest for daily life on foot within 15 min. However, the results suggest that, in both Alvalade and Marvila, the 15-minute threshold may not be sufficiently accurate to compare both neighborhoods or to evaluate the quality of the urban environment, as many services can already be reached on foot within this time—or even less—by the majority of the population, aligning with findings from other European cities (e.g., B. Murgante et al. [21]; J. Carot & Villalba [22]; Staricco [23]).
As discussed, walkability is a complex, multifactorial concept that encompasses both physical environmental factors and human perceptions of public spaces. Therefore, a broader set of indicators and methods, such as those outlined in the 7C framework [30]—which identifies seven factors influencing pedestrian accessibility and provides a comprehensive approach to evaluating the attractiveness and accessibility of walking environments—is necessary to fully assess the potential for walking in the urban environment and to examine the correlation between estimated walkability and observed pedestrian travel patterns. These factors go beyond time and include elements like connectivity, comfort, convenience, and social factors that influence pedestrian mobility.
However, if the indicators that have been used need to be complemented with others for a faithful portrayal of the areas under analysis, they appear to be efficient to describe the potential of the areas to achieve the 15-Minute City model, since they describe and quantify objective realities.
4. Discussion: Guidelines for Improvement in Light of the 15-Minute City Model
The importance of proximity between housing, work, and leisure in the promotion of more inclusive communities is clearly a stimulus to the application of measures that allow an approximation to what is proposed by the 15-Minute City model [6,52,53,54].
It is assumed that some changes will have to be made by the responsible entities, both in the urban planning of the parishes and in the approach to the resident population.
Firstly, improving walkability in this parish through the infrastructure of interesting, safe, and pleasant pedestrian paths is fundamental. Architectural porosity needs to be improved (although we are aware this is an extremely complex process). Services must be located on buildings’ ground floors whenever possible.
Following this proposal, it is necessary to reinforce, for the case of Marvila, the need to requalify public spaces and give them the identity they currently lack in the search for these spaces to be at the stage for creating a harmonious community. The Municipality of Lisbon has already developed projects of this nature, among which we highlight the project “Uma Praça em Cada Bairro”, whose purpose is to create or adapt public spaces to assume the role of a meeting place and “Requalificação das Envolventes das Escolas”, with the purpose of improving the pedestrian and bicycle paths in areas adjacent to schools [55].
Furthermore, as an alternative to pedestrian mobility, there is an urgent need to introduce new infrastructure and services associated with the remaining means of active mobility or public transport. In the context of the city of Lisbon, some measures have already been implemented, such as the “AMARELO” project, whose goal is to take students to school by bus, not only teaching them how to do so but also combating school dropout [56].
In relation to housing, it is necessary to implement practices that guarantee affordable and decent housing. In addition, since Marvila has a modernist concept of cells in its genesis, it is fundamental to adapt the supply of services and facilities to these same cells so that each of these units is as self-sufficient as possible. Finally, and as a way of updating the status of the resident population, it is crucial to give more responsibility to the entities that work directly with the community, of which the “Rés do Chão” association is an example. Thus, through these associations, it is possible to establish a direct relationship with the resident population, tailoring the different proposals to their specific needs. An example of this is the implementation of the project “Secundário para Tod@s”, whose goal is to combat failure and early school leaving and give the entire population equal educational opportunities [57].
Regarding the parish of Alvalade, the measures to be adopted are related to more specific issues, the first of which is to improve access to health facilities, since accessibility to these is the worst among those studied, through the implementation of Family Health Units throughout the parish. To respond more effectively to these needs, the Municipality of Lisbon has already developed projects that seek to improve access to health care for the elderly, such as “Lisboa +65” and “Lisboa +55” [55].
The implementation of these proposals should be properly monitored by entities that are in direct contact with residents to assess and adjust them according to the needs of each community.
5. Conclusions
Currently, most of the world’s population resides in cities, and this number is estimated to increase greatly in the coming years, so it is important to seek urban adaptation models. Of these new models, the one addressed in this article stands out: the 15-Minute City model, described by Carlos Moreno. This model is based on the concept of “chrono-urbanism”, defining four pillars: proximity, diversity, density, and ubiquity.
The study carried out in this article is based on the definition of a set of indicators divided into three distinct dimensions: population, housing, and accessibility.
In this case, the indicators were applied to two contiguous parishes, Alvalade and Marvila, located in the city of Lisbon. These two parishes were chosen because, despite being contiguous, they have, at their genesis, two very different urban planning models, as well as different construction periods and resident populations.
The results obtained show that the parish of Alvalade presents, in general, better results when compared with the parish of Marvila but that other indicators must be added to the ones used in the literature and in the present study.
After studying the potential and weaknesses of both case studies, solutions were sought to bring both parishes closer to the 15-Minute City model by improving their performance in the different dimensions analyzed.
Thus, it is proposed for the parish of Marvila to take actions to improve specific walkability, enhance the public transport network and the green network, and ensure that the provision of services and facilities meets the needs of the population.
Regarding the parish of Alvalade, it is advisable to increase the number of health facilities in proximity.
From the perspective of further development of the work, it is fundamental to add new indicators that work together with the ones used here and improve measurements of the isochrones, merging them with the concept of walkability through the Pedestrian Accessibility and Attractiveness Indicators.
Author Contributions
Conceptualization, J.B.d.S., A.R.d.C. and A.M.d.S.; methodology, J.B.d.S., A.R.d.C. and A.M.d.S.; validation, A.R.d.C. and A.M.d.S.; investigation, J.B.d.S., A.R.d.C. and A.M.d.S.; writing—original draft, J.B.d.S.; writing—review & editing, J.B.d.S., A.R.d.C. and A.M.d.S.; visualization, J.B.d.S.; supervision, A.R.d.C. and A.M.d.S. All authors have read and agreed to the published version of the manuscript.
Funding
This work has been funded by national funds through Fundação para a Ciência e a Tecnologia (FCT), in the framework of project UIDB/05703/2020 from the research unit CiTUA.
Institutional Review Board Statement
Not applicable.
Informed Consent Statement
Not applicable.
Data Availability Statement
The original contributions presented in the study are included in the article, further inquiries can be directed to the corresponding author.
Conflicts of Interest
The authors declare no conflict of interest.
Correction Statement
This article has been republished with a minor correction to the Funding statement. This change does not affect the scientific content of the article.
References
- World Bank. Urban Development. Available online: https://www.worldbank.org/en/topic/urbandevelopment (accessed on 31 July 2024).
- INE. Censos 2021; INE, Instituto Nacional de Estatística: Lisbon, Portugal, 2021. [Google Scholar]
- Allam, Z.; Moreno, C.; Chabaud, D.; Pratlong, F. Proximity-Based Planning and the ‘15-Minute City’: A Sustainable Model for the City of the Future. In The Palgrave Handbook of Global Sustainability; Springer International Publishing: Cham, Switzerland, 2022; pp. 1–20. [Google Scholar] [CrossRef]
- Sharifi, A. From Garden City to Eco-urbanism: The quest for sustainable neighborhood development. Sustain. Cities Soc. 2016, 20, 1–16. [Google Scholar] [CrossRef]
- Lydon, M.; Garcia, A. Tactical Urbanism; Island Press/Center for Resource Economics: Washington, DC, USA, 2015. [Google Scholar] [CrossRef]
- Calthorpe, P. Urbanism in the Age of Climate Change; Island Press: Washington, DC, USA, 2010. [Google Scholar]
- Townsend, A.M. SMART CITIES: Big Data, Civic Hackers, and the Quest for a New Utopia; Stanford Social Innovation Review: Stanford, CA, USA, 2013. [Google Scholar]
- Rojas-Rueda, D.; Nieuwenhuijsen, M.J.; Gascon, M.; Perez-Leon, D.; Mudu, P. Green spaces and mortality: A systematic review and meta-analysis of cohort studies. Lancet Planet. Health 2019, 3, 469–477. [Google Scholar] [CrossRef]
- Moreno, C.; Allam, Z.; Chabaud, D.; Gall, C.; Pratlong, F. Introducing the ‘15-Minute City’: Sustainability, Resilience and Place Identity in Future Post-Pandemic Cities. Smart Cities 2021, 4, 93–111. [Google Scholar] [CrossRef]
- Watson, V. ‘The planned city sweeps the poor away…’: Urban planning and 21st century urbanisation. Prog. Plan. 2009, 72, 151–193. [Google Scholar] [CrossRef]
- Brundtland, G.H. Our Common Future: Report of the World Commission on Environment and Development; UN: Geneva, Switzerland, 1987.
- Sharifi, A.; Murayama, A. Viability of using global standards for neighbourhood sustainability assessment: Insights from a comparative case study. J. Environ. Plan. Manag. 2015, 58, 1–23. [Google Scholar] [CrossRef]
- United Nations. 17 GOALS. Available online: https://sdgs.un.org/goals (accessed on 31 July 2024).
- European Urban Initiative. The New European Bauhaus. Available online: https://www.urban-initiative.eu/new-european-bauhaus-topic-first-call#:~:text=for%20urban%20authorities-,What%20is%20the%20New%20European%20Bauhaus%3F,products%20and%20ways%20of%20living (accessed on 31 July 2024).
- Groupe Paris en Commun. Groupe Paris en Commun au conseil de Paris: Accueil. Available online: https://www.groupepec.paris/ (accessed on 31 July 2024).
- Gonçalves, J.; da Costa, A.R.; Abreu, R. Starting over: A focused vision for the old suburbs of Lisbon. Urban Des. Int. 2015, 20, 130–143. [Google Scholar] [CrossRef]
- Bocca, A. Public Space and 15-minute city. A conceptual exploration for the functional reconfiguration of proximity city. TeMA J. Land Use Mobil. Environ. 2021, 14, 395–410. [Google Scholar]
- C40 Cities Climate Leadership Group; C40 Knowledge Hub. 15-Minute Cities: How to Develop People Centres Streets and Mobility. Available online: https://www.c40knowledgehub.org/s/article/15-minute-cities-How-to-develop-people-centred-streets-and-mobility?language=en_US (accessed on 31 July 2024).
- Pozoukidou, G.; Chatziyiannaki, Z. 15-Minute City: Decomposing the New Urban Planning Eutopia. Sustainability 2021, 13, 928. [Google Scholar] [CrossRef]
- Pisano, C. Strategies for Post-COVID Cities: An Insight to Paris En Commun and Milano 2020. Sustainability 2020, 12, 5883. [Google Scholar] [CrossRef]
- Murgante, B.; Patimisco, L.; Annunziata, A. Developing a 15-minute city: A comparative study of four Italian Cities-Cagliari, Perugia, Pisa, and Trieste. Cities 2024, 146, 104765. [Google Scholar] [CrossRef]
- Carot, J.M.; Villalba, A. A quantitative model of the city in 15 minutes for decision-making. J. Sustain. Dev. Energy Water Environ. Syst. 2024, 12, 1–12. [Google Scholar] [CrossRef]
- Staricco, L. 15-, 10- or 5-minute city? A focus on accessibility to services in Turin, Italy. J. Urban Mobil. 2022, 2, 100030. [Google Scholar] [CrossRef]
- Gaglione, F.; Gargiulo, C.; Zucaro, F.; Cottrill, C. Urban accessibility in a 15-minute city: A measure in the city of Naples, Italy. Transp. Res. Procedia 2022, 60, 378–385. [Google Scholar] [CrossRef]
- Abdelfattah, L.; Deponte, D.; Fossa, G. The 15-minute city: Interpreting the model to bring out urban resiliencies. Transp. Res. Procedia 2022, 60, 330–337. [Google Scholar] [CrossRef]
- Speck, J. A General Theory of Walkability. In Walkable City: How Downtown Can Save America, One Step at a Time; D&M Publishers Inc.: New York, NY, USA, 2012; pp. 7–11. [Google Scholar]
- Gardner, K.; Johnson, T.; Buchan, K.; Pharaoh, T. Developing a pedestrian strategy for London. In Transport Policy and Its Implementation: Proceedings of the Seminar B Held at the 24th European Transport Forum, Brunel University, England, 2–6 September 1996; PTRC Education and Research Services: Northamptonshire, UK, 1996; Volume P402. [Google Scholar]
- Cost Action 358. Pedestrian Quality Needs; COST Foundation: Brussels, Belgium, 2010. [Google Scholar]
- Atef Elhamy Kamel, M. Encouraging walkability in GCC cities: Smart urban solutions. Smart Sustain. Built Environ. 2013, 2, 288–310. [Google Scholar] [CrossRef]
- Moura, F.; Cambra, P.; Gonçalves, A.B. Measuring walkability for distinct pedestrian groups with a participatory assessment method: A case study in Lisbon. Landsc. Urban Plan. 2017, 157, 282–296. [Google Scholar] [CrossRef]
- Banza, M.; Lisboa. Será uma Cidade dos 15 Minutos? Available online: https://manuelbanza.github.io/lisboa-cidade-15-mins/ (accessed on 31 July 2024).
- Ministry of Labor. Quadros de Pessoal 2009; Ministry of Labor: Lisboa, Portugal, 2009.
- INE. Censos 2011; Instituto Nacional de Estatística: Lisboa, Portugal, 2011. [Google Scholar]
- TravelTime. Create a Travel Time Map. Available online: https://traveltime.com (accessed on 31 July 2024).
- INE. Subsecção Estatística Marvila 2021; Instituto Nacional de Estatística: Lisboa, Portugal, 2021. [Google Scholar]
- INE. Subsecção Estatística Alvalade 2021; Instituto Nacional de Estatística: Lisboa, Portugal, 2021. [Google Scholar]
- Lisboa Interativa (Lxi); Câmara Municipal de Lisboa: Lisboa, Portugal, 2022.
- Ciclovias. Available online: www.ciclovias.pt (accessed on 1 June 2024).
- EMEL. Descobre as Estações; EMEL: Lisboa, Portugal, 2022. [Google Scholar]
- Tostões, A. Lisboa Moderna; Circo de Ideias: Lisbon, Portugal, 2021. [Google Scholar]
- Pascoal, A.M. A Cidade do Saber: Estudo do Património Artístico Integrado nos Edifícios Projectados pelo Arquitecto Porfírio Pardal Monteiro para a Cidade Universitária de Lisboa (1934–1961); Faculdade de Letras, Universidade de Lisboa: Lisbon, Portugal, 2010. [Google Scholar]
- Junta de Freguesia de Alvalade. História. Available online: https://www.jf-alvalade.pt/alvalade/historia/ (accessed on 31 July 2024).
- Junta de Freguesia de Marvila. História. Available online: https://jf-marvila.pt/historia/ (accessed on 31 July 2024).
- Gaspar, R.L. Plano de Urbanização de Chelas. Estud. Prévio 2022, 20, 123–133. [Google Scholar] [CrossRef]
- Levinson, D.M.; Marshall, W.; Axhausen, K. Elements of Access: Transport Planning for Engineers, Transport Engineering for Planners; Network Design Lab: Lexington, KY, USA, 2017. [Google Scholar]
- Logan, T.M.; Hobbs, M.H.; Conrow, L.C.; Reid, N.L.; Young, R.A.; Anderson, M.J. The x-minute city: Measuring the 10, 15, 20-minute city and an evaluation of its use for sustainable urban design. Cities 2022, 131, 103924. [Google Scholar] [CrossRef]
- Konijnendijk, C.C. Evidence-based guidelines for greener, healthier, more resilient neighbourhoods: Introducing the 3–30–300 rule. J. For. Res. 2023, 34, 821–830. [Google Scholar] [CrossRef]
- Câmara Municipal de Lisboa. MAPPe—Mapa de Potencial Pedonal de Lisboa; Câmara Municipal de Lisboa: Lisbon, Portugal, 2022. [Google Scholar]
- Cambra, P. Pedestrian Accessibility and Atractiveness Indicators for Walkability Assessment; Instituto Superior Técnico: Lisbon, Portugal, 2012. [Google Scholar]
- Santos, T.; Ramalhete, F.; Julião, R.P.; Soares, N.P. Sustainable living neighbourhoods: Measuring public space quality and walking environment in Lisbon. Geogr. Sustain. 2022, 3, 289–298. [Google Scholar] [CrossRef]
- Talavera-Garcia, R.; Soria-Lara, J.A. Q-PLOS, developing an alternative walking index. A method based on urban design quality. Cities 2015, 45, 7–17. [Google Scholar] [CrossRef]
- Jacobs, J. The Death and Life of Great American Cities; Random House: New York, NY, USA, 1961. [Google Scholar]
- Krier, L.; Thadani, D. The Architecture of Community; Island Press: Washington, DC, USA, 2009. [Google Scholar]
- Gehl, J. Cities for People; Island Press: Washington, DC, USA, 2010. [Google Scholar]
- Câmara Municipal de Lisboa. Urbanismo. Available online: https://www.lisboa.pt/temas/urbanismo/entrada (accessed on 31 July 2024).
- Câmara Municipal de Lisboa. Mobilidade. Available online: https://www.lisboa.pt/temas/mobilidade/entrada (accessed on 31 July 2024).
- Câmara Municipal de Lisboa. Educação. Available online: https://www.lisboa.pt/temas/educacao/entrada (accessed on 31 July 2024).


Disclaimer/Publisher’s Note: The statements, opinions and data contained in all publications are solely those of the individual author(s) and contributor(s) and not of MDPI and/or the editor(s). MDPI and/or the editor(s) disclaim responsibility for any injury to people or property resulting from any ideas, methods, instructions or products referred to in the content. |
© 2025 by the authors. Licensee MDPI, Basel, Switzerland. This article is an open access article distributed under the terms and conditions of the Creative Commons Attribution (CC BY) license (https://creativecommons.org/licenses/by/4.0/).