
Does Carbon Trading Policy Enhance the Autonomy and Controllability of Green Enterprises in Supply Chains? A Study of the Chain-Mediating Effects of Green Ambidextrous Innovation


Abstract
1. Introduction
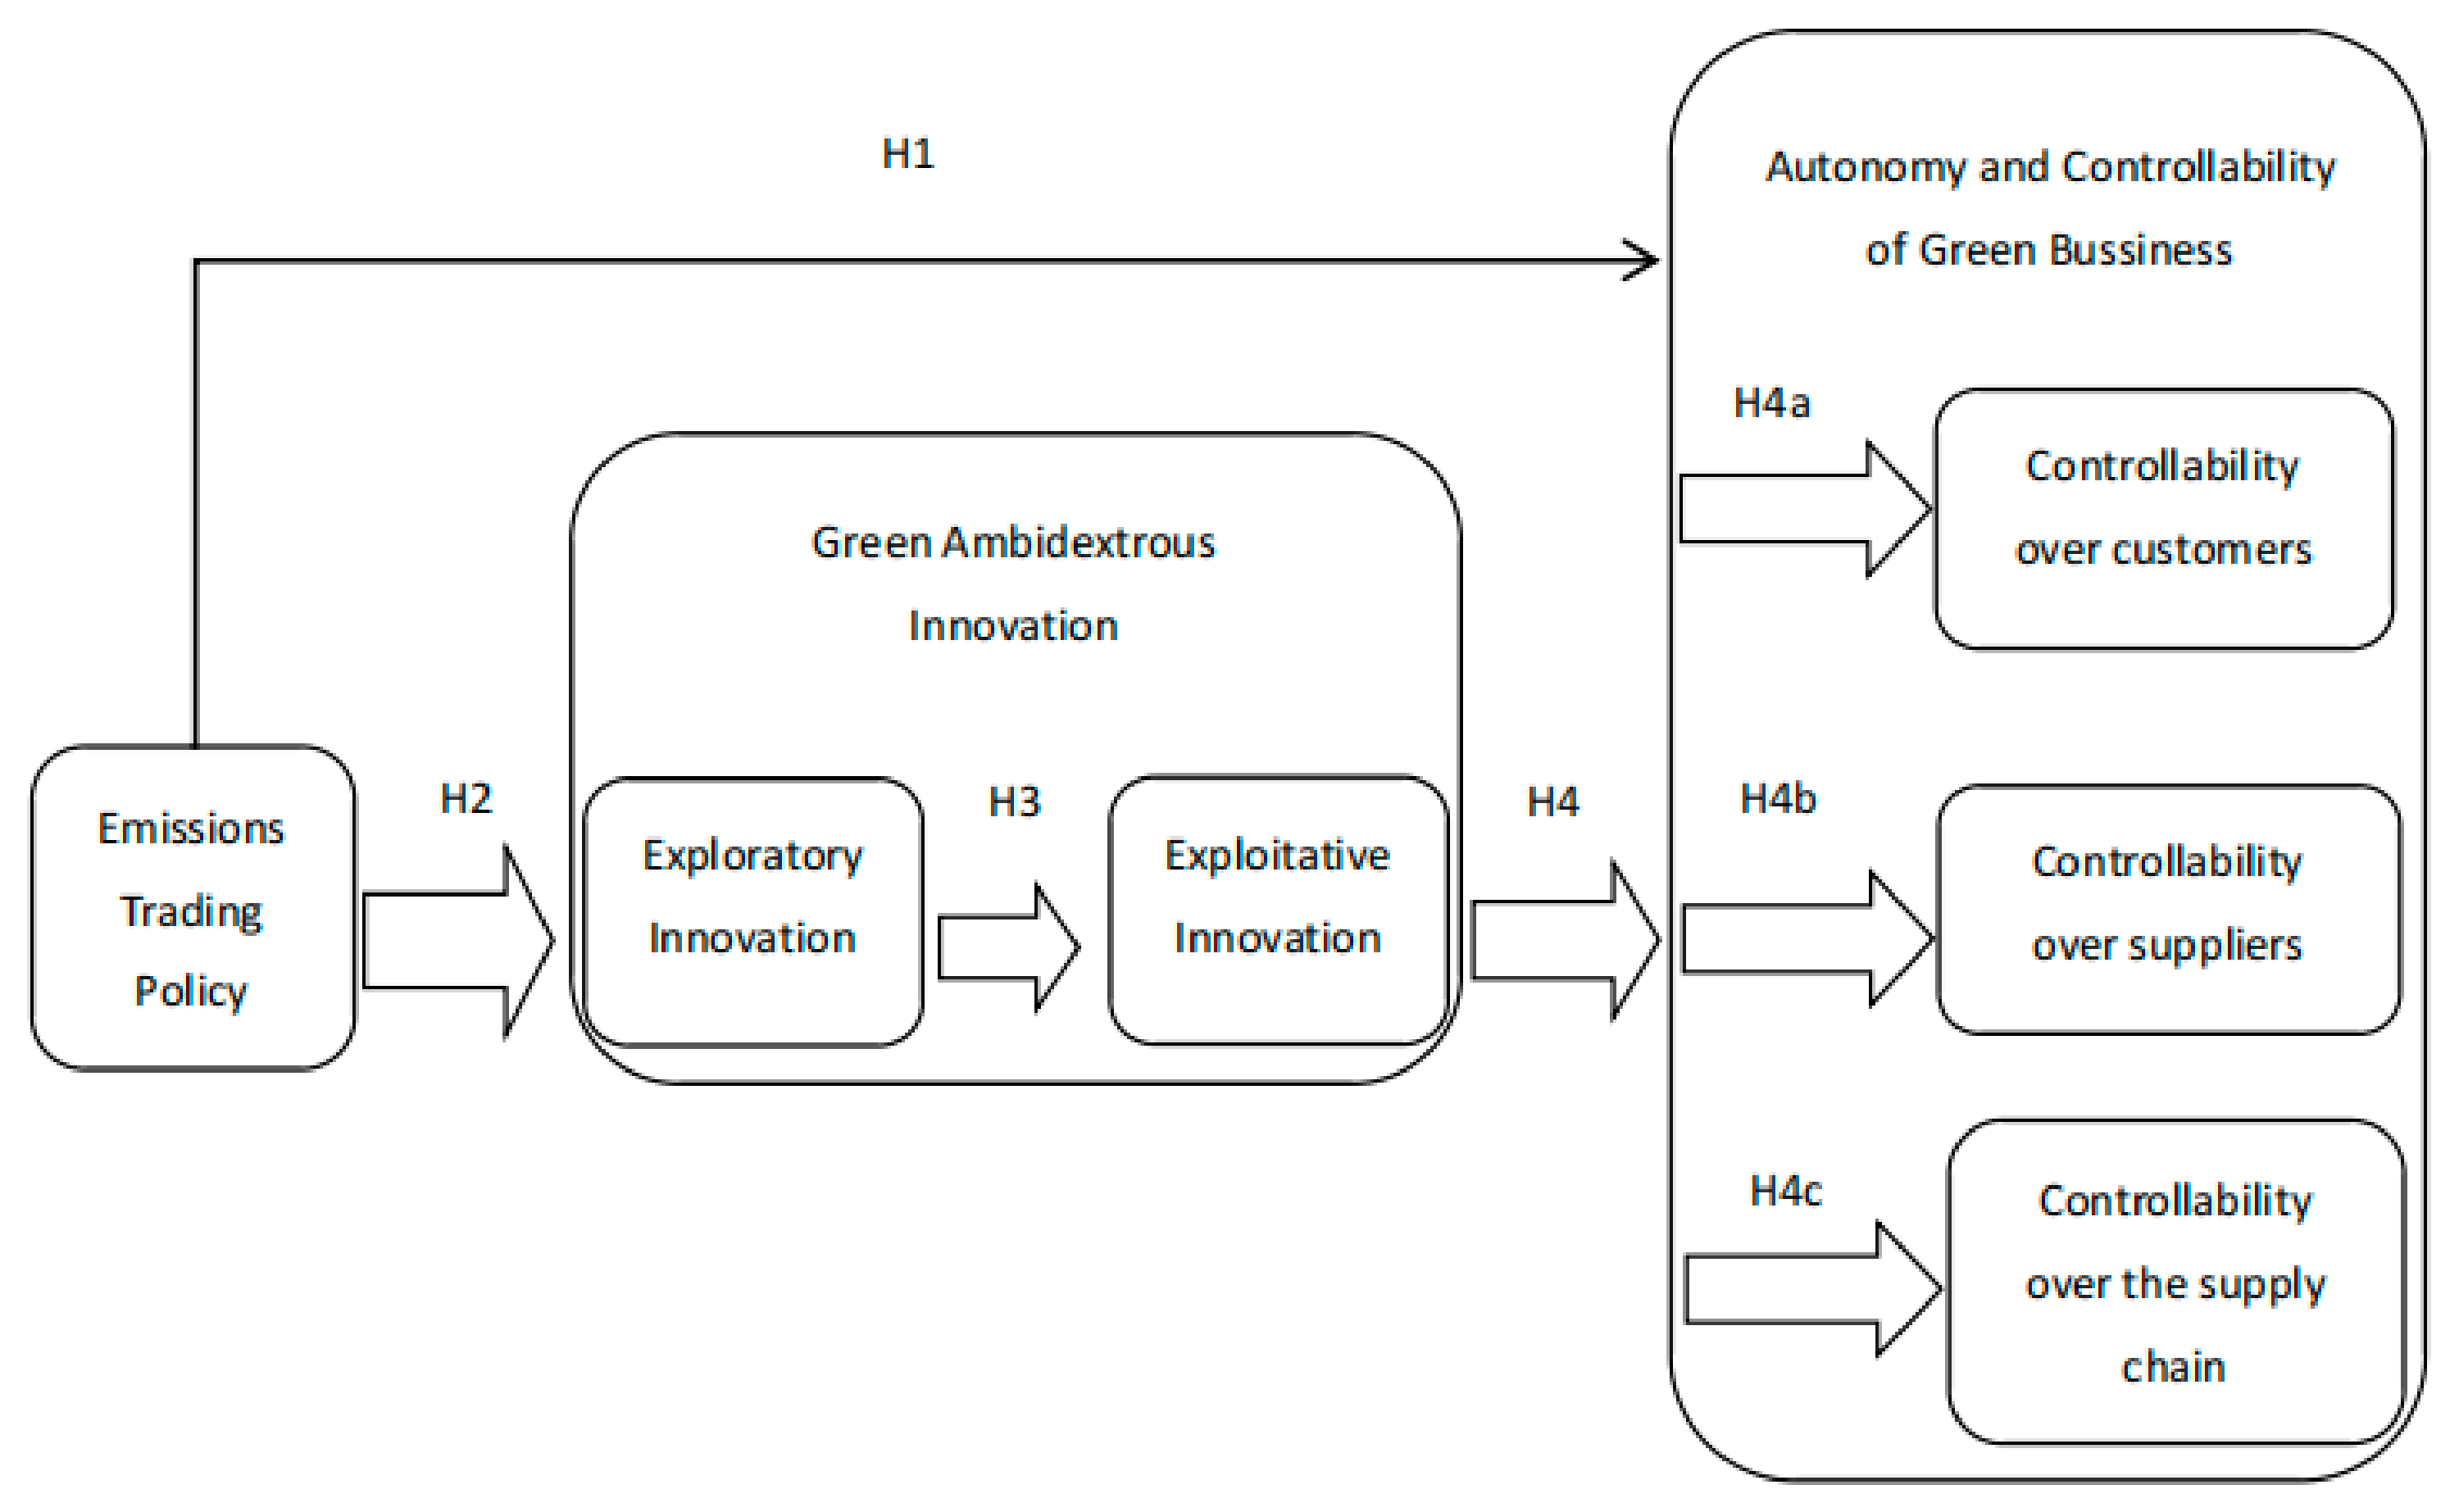
2. Theoretical Hypotheses
2.1. Carbon Trading Policy and the Autonomy and Controllability of Green Enterprises
2.2. Carbon Trading Policy and Green Exploratory Innovation
2.3. Green Exploratory Innovation and Green Exploitative Innovation
2.4. Green Ambidextrous Innovation and the Autonomy and Controllability of Green Enterprises
3. Materials and Methods
3.1. Data Sources and Processing
3.2. Variable Definitions
- 1.
- Dependent variable: Autonomy and Controllability of Green Enterprises (CAP). Building on the theoretical analysis and following the methods used by Wu Qiang and other scholars [42], this study attempts to measure the Autonomy and Controllability of green enterprises using customer concentration (Cen_con), supplier concentration (Cen_sup), and supply chain concentration (Cen_chain). The concentration of the supply chain is measured by the sum of customer and supplier concentrations, where customer concentration is measured by the revenue percentage generated by the top five customers, and supplier concentration is measured by the procurement expenditure from the top five suppliers. It is noteworthy that, according to the study [42], in conjunction with the theoretical analysis mentioned earlier, all three categories of supply chain concentration are negatively correlated with the Autonomy and Controllability of green enterprises.
- 2.
- Explanatory Variable: Carbon Trading Policy (DID). This study investigates the impact of carbon emission policies on the Autonomy and Controllability of green enterprises. Therefore, the core explanatory variable is the interaction term (DID) between the policy group dummy variable (Treat) and the time dummy variable (Time). If a green enterprise participates in the carbon trading policy, it is part of the treatment group, and the Treat value is set to 1; otherwise, it is part of the control group, and the Treat value is set to 0. If the year is 2013 or later, which marks the post-policy implementation phase, Time is set to 1; otherwise, it is set to 0.
- 3.
- Mediating Variable: Green ambidextrous innovation. In this paper, Green ambidextrous innovation is defined as green exploratory innovation (inno_ex) and green exploitative innovation (inno_ap). One of the primary green innovation activities of enterprises is the application of green technology patents, which can be further divided into joint and independent applications. Therefore, following the method used by [7], the number of green patent applications by green enterprises is used as a proxy for ambidextrous innovation. Exploratory innovation is represented by the sum of the number of green invention patents applied independently and jointly in a given year; exploitative innovation is represented by the sum of the number of green utility model patents applied independently and jointly in a given year.
- 4.
- Control Variables: This study selects the following control variables: Leverage (Lev)—Leverage = Total liabilities at the end of the period/Total assets × 100%; Return on Assets (ROA)—Return on Assets = Net profit/Total assets × 100%; Accounts Receivable Ratio (REC)—Accounts Receivable Ratio = Net accounts receivable/Total assets × 100%; Current Ratio (CR)—Current Ratio = Current assets/Current liabilities × 100%; Quick Ratio (Quick)—Quick Ratio = (Current assets − Inventories)/Current liabilities × 100%; Book-to-Market Ratio (BM)—Book-to-Market Ratio = Book value/Market value × 100%; Firm Age (Firmage); Board Size (Board)—Number of board members; and the Shareholding Ratio of the Top Three Shareholders (Top3).
3.3. Model Setup
4. Results
4.1. Descriptive Statistics
4.2. Baseline Regression Results
4.3. Robustness Tests
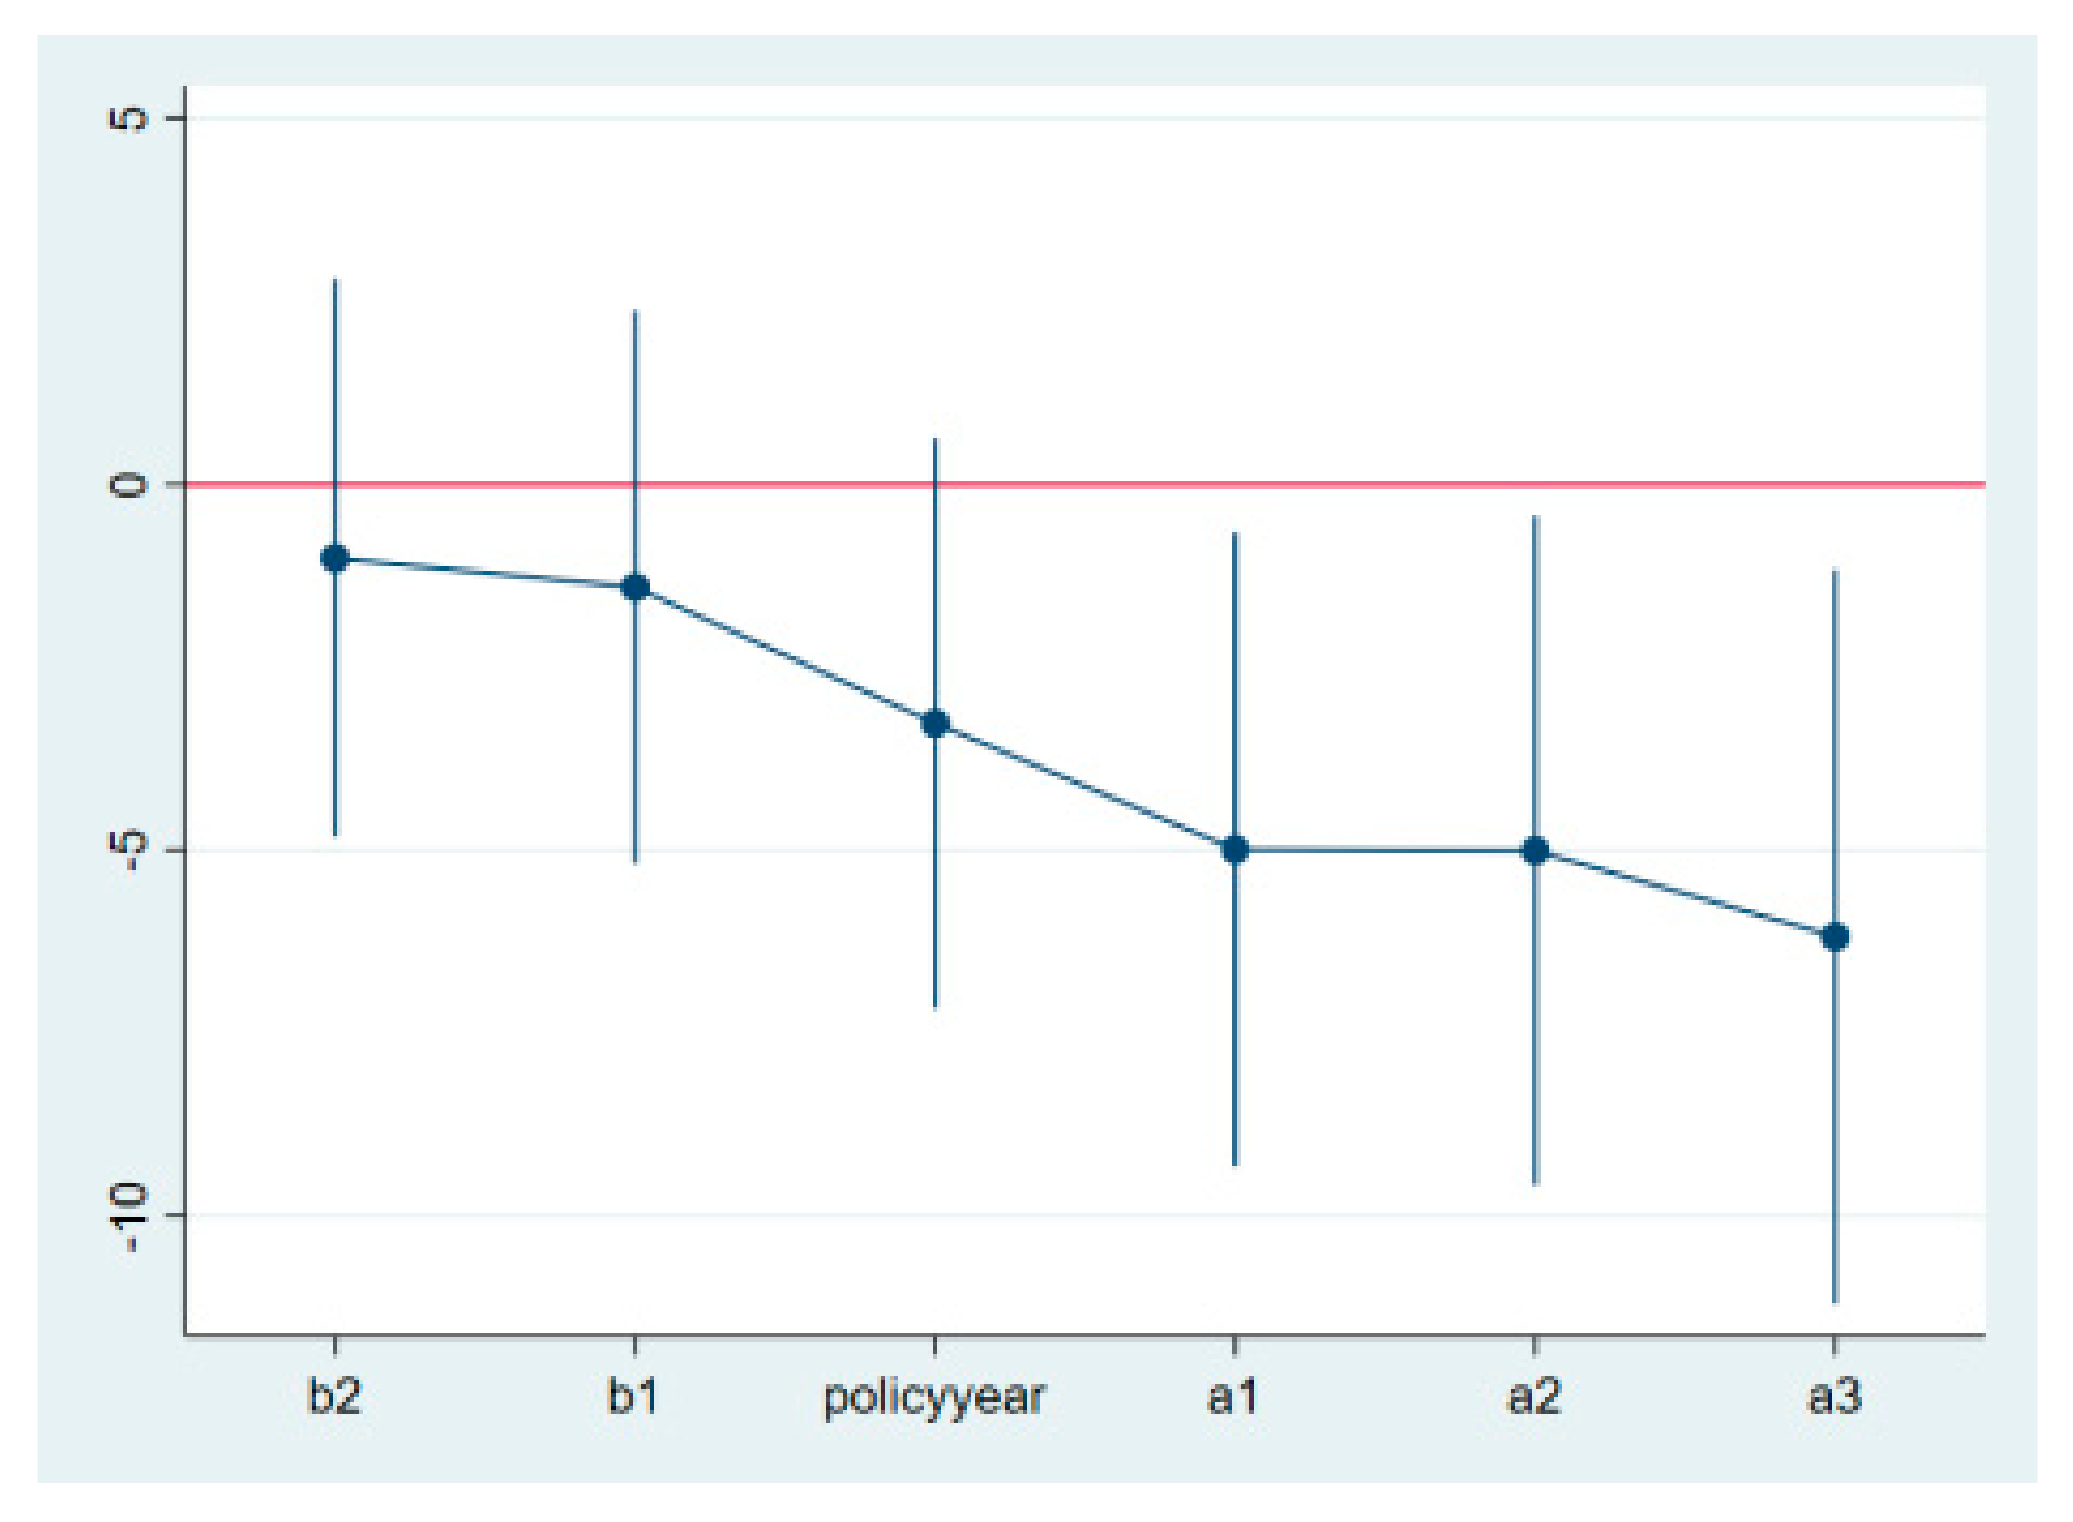
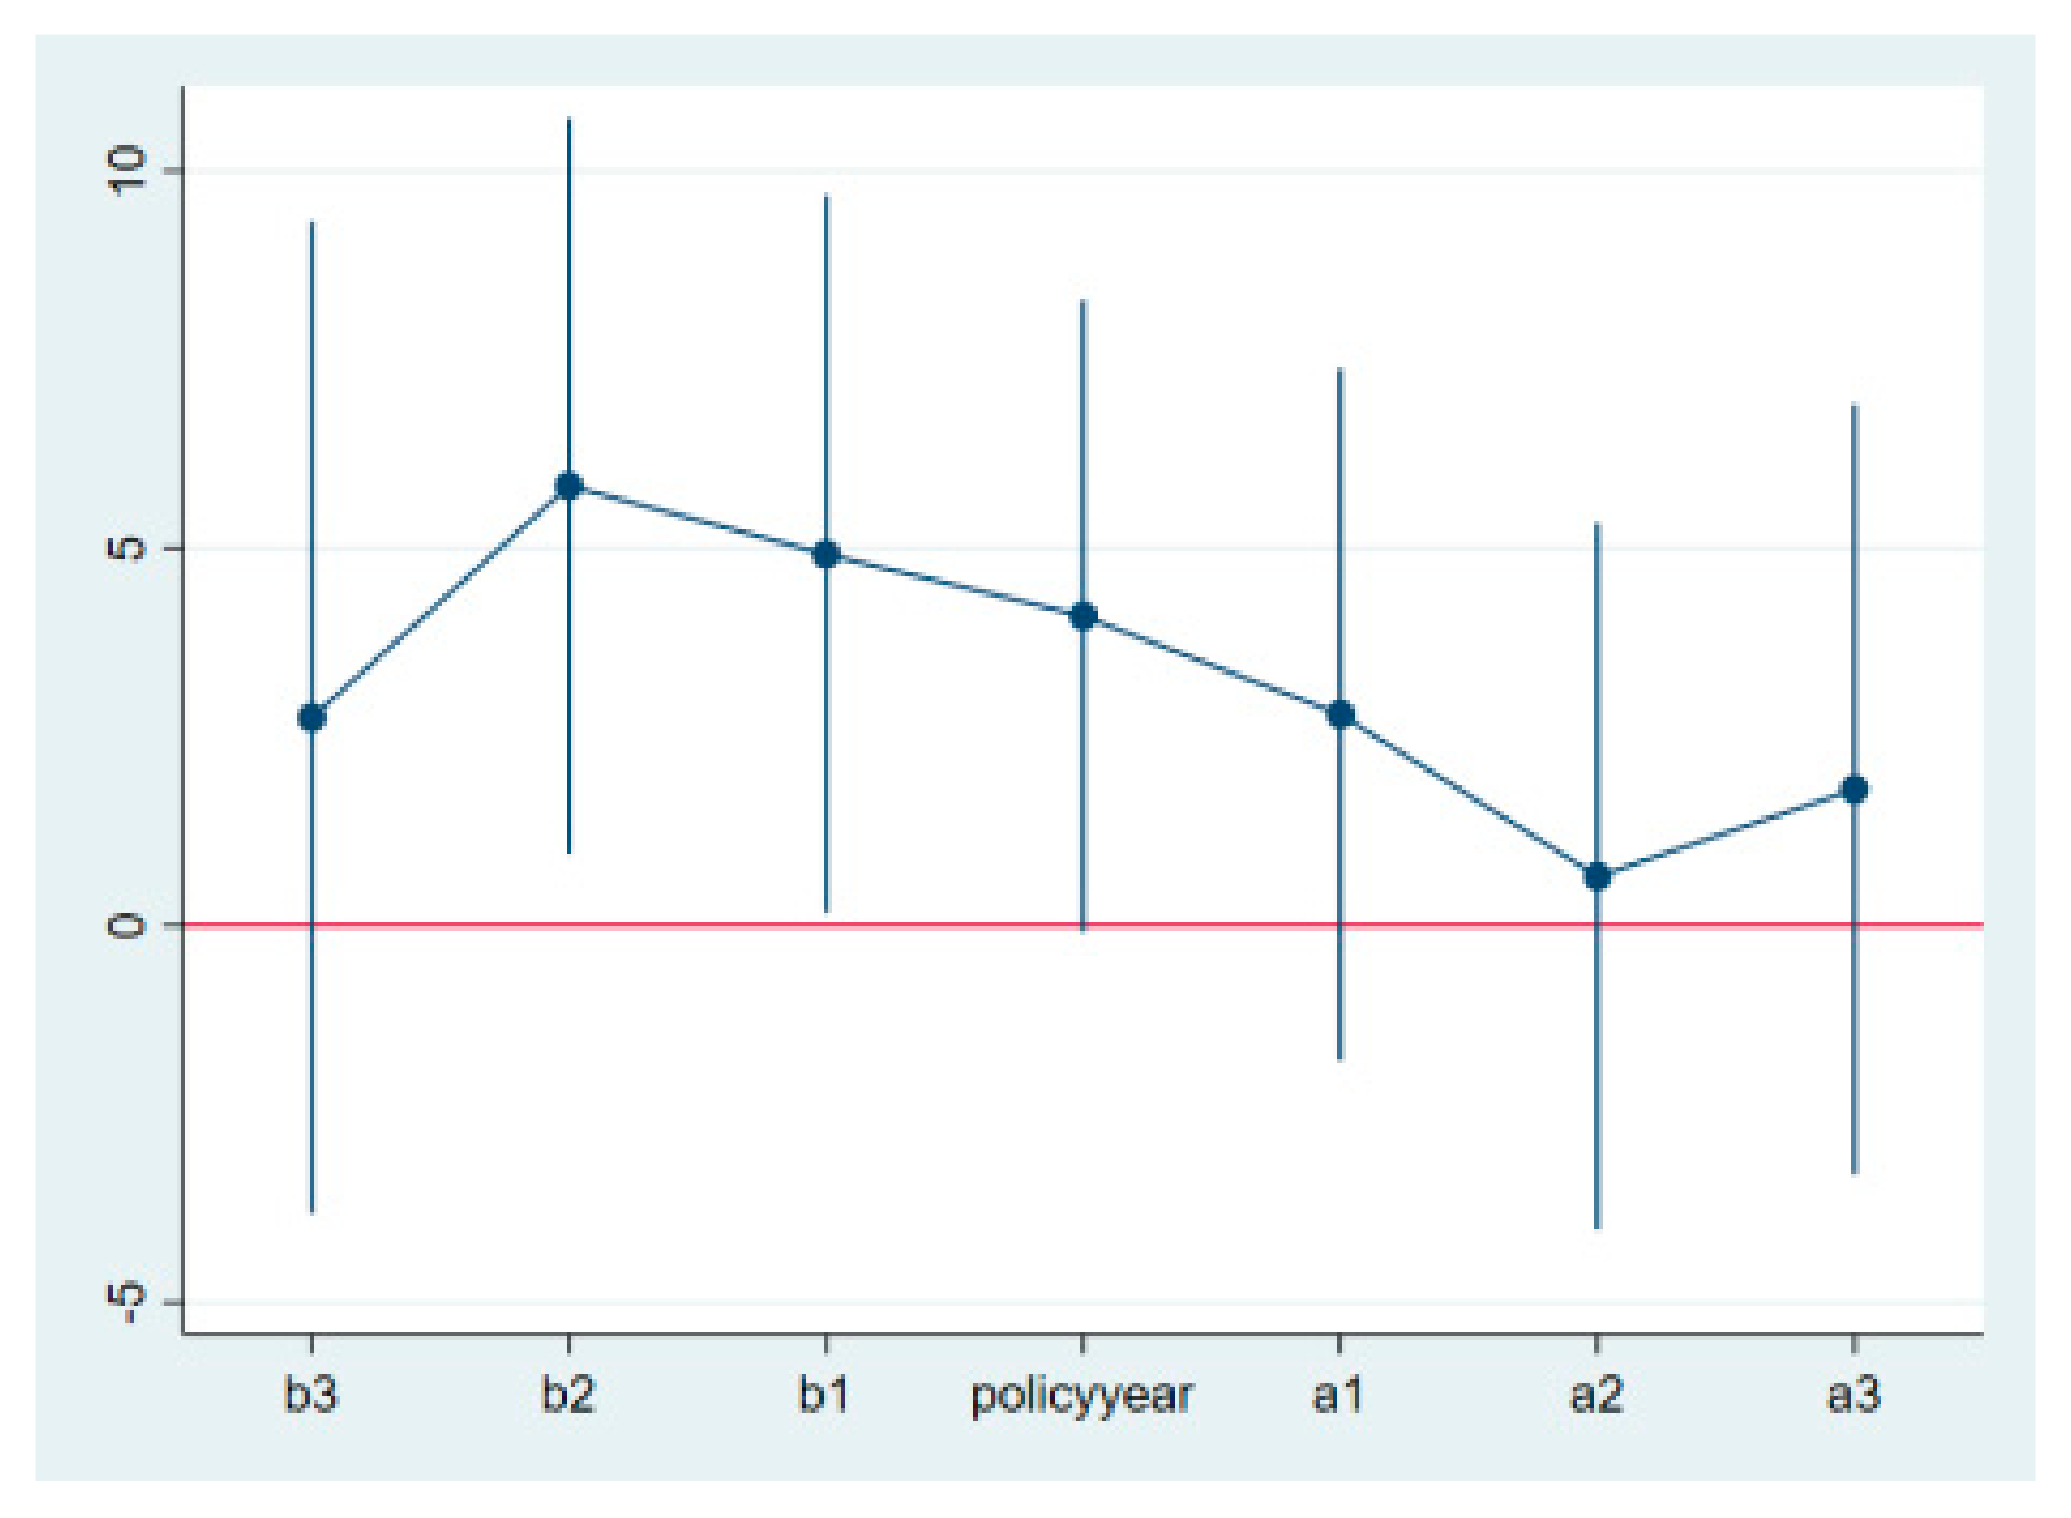
4.3.1. Parallel Trends Test
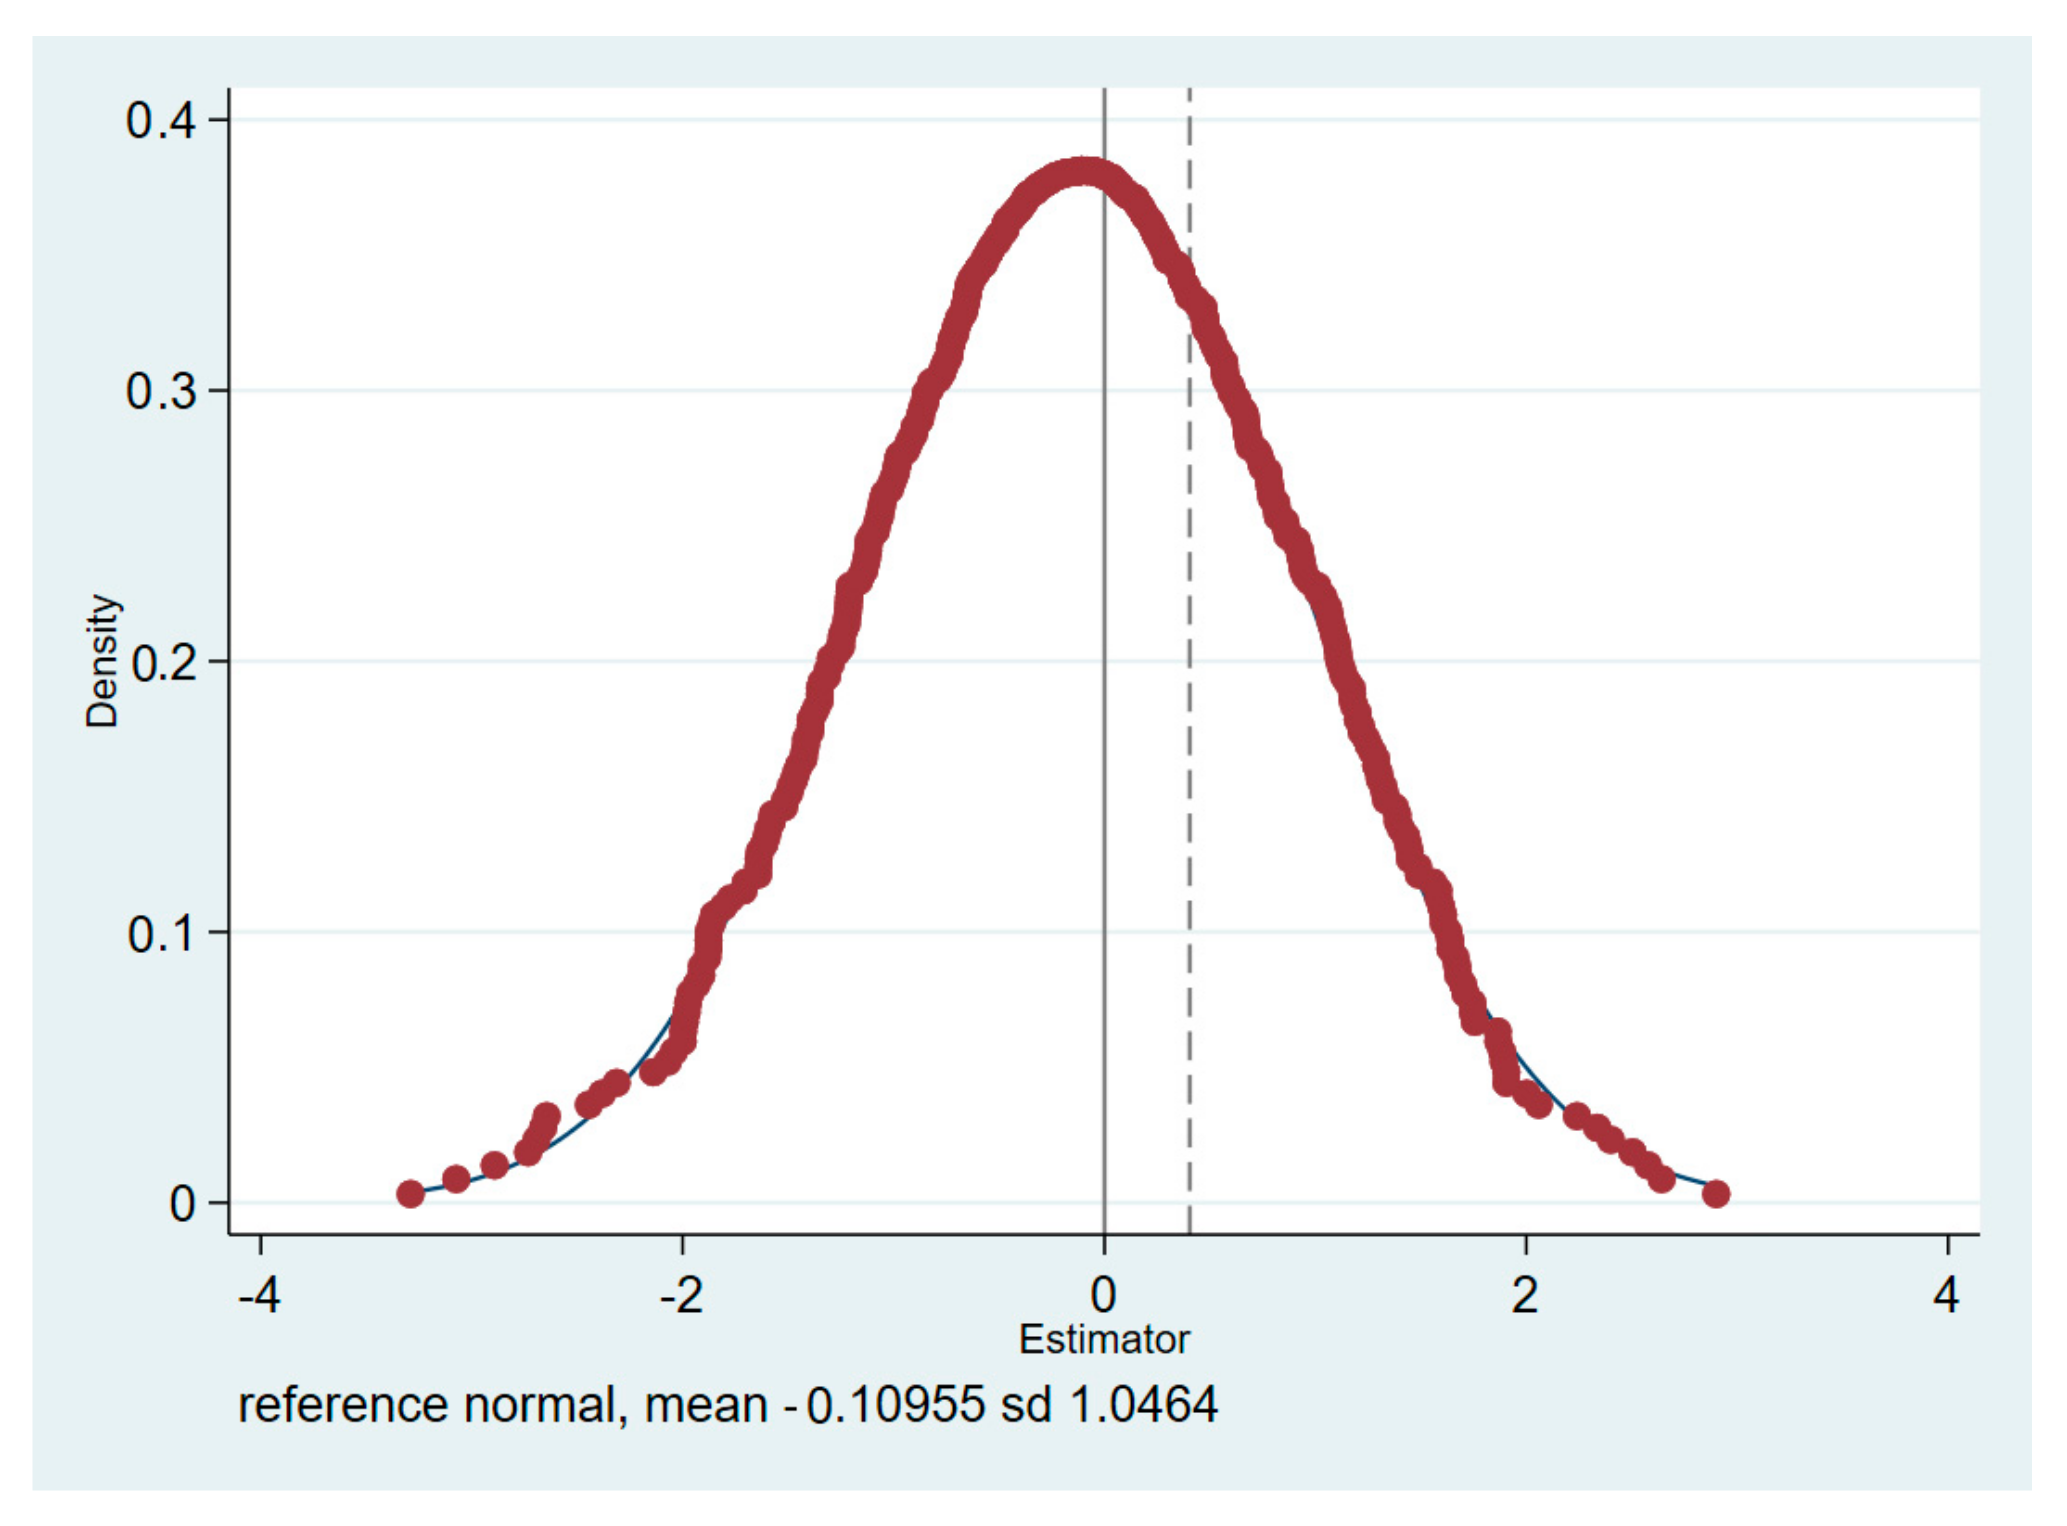
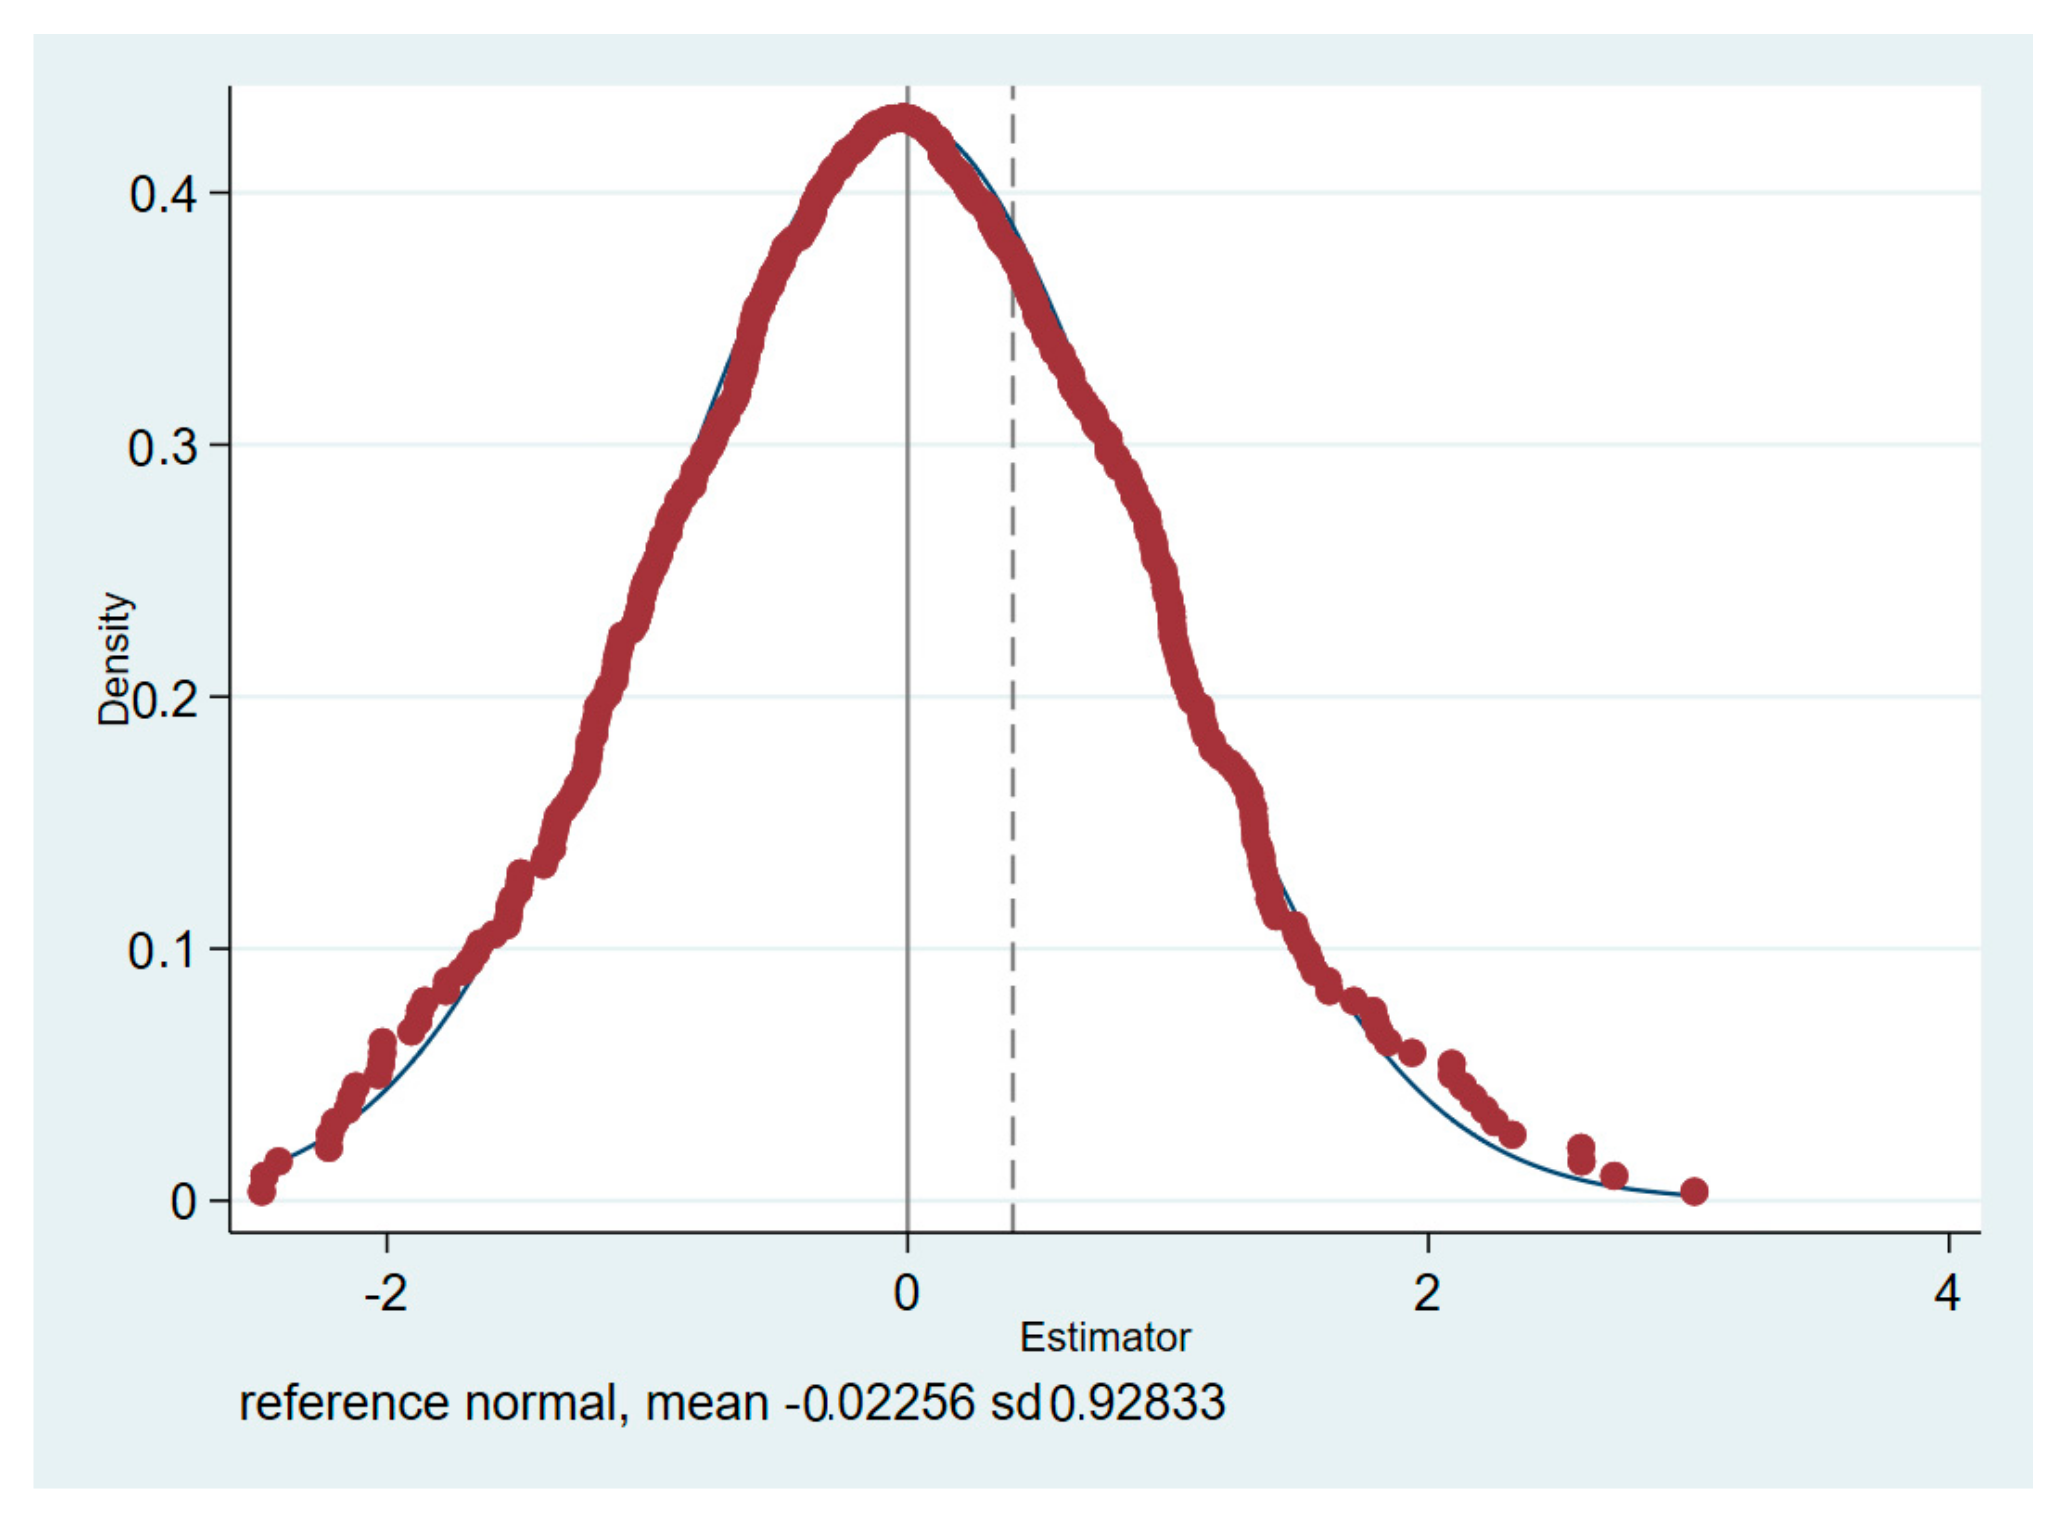
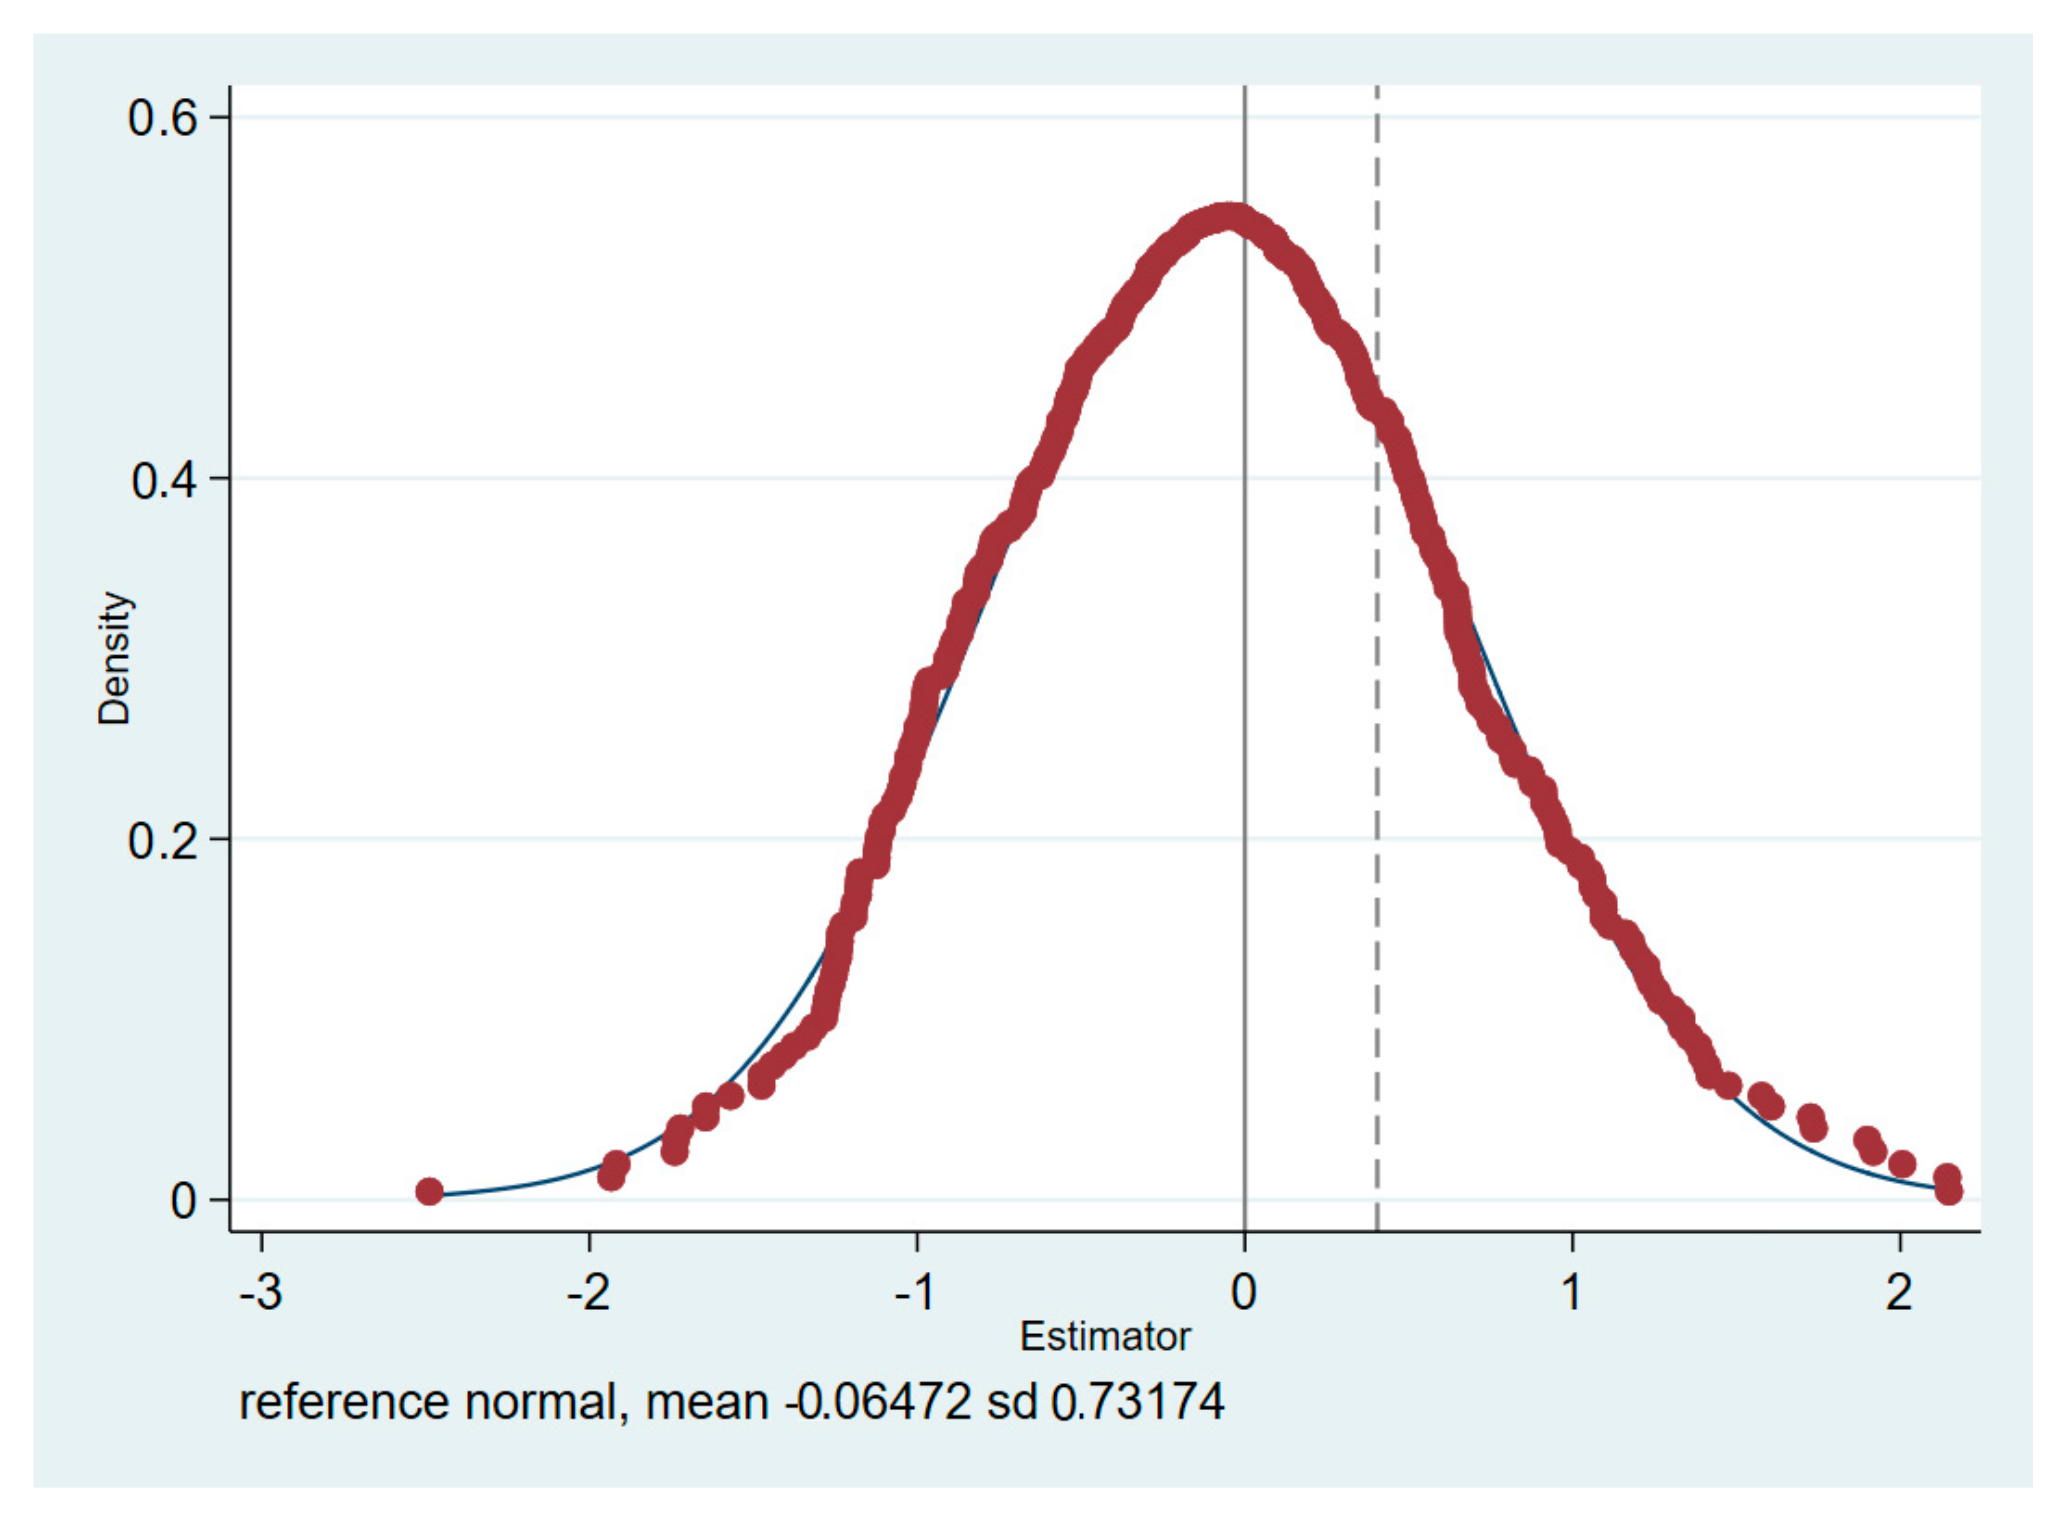
4.3.2. Placebo Test
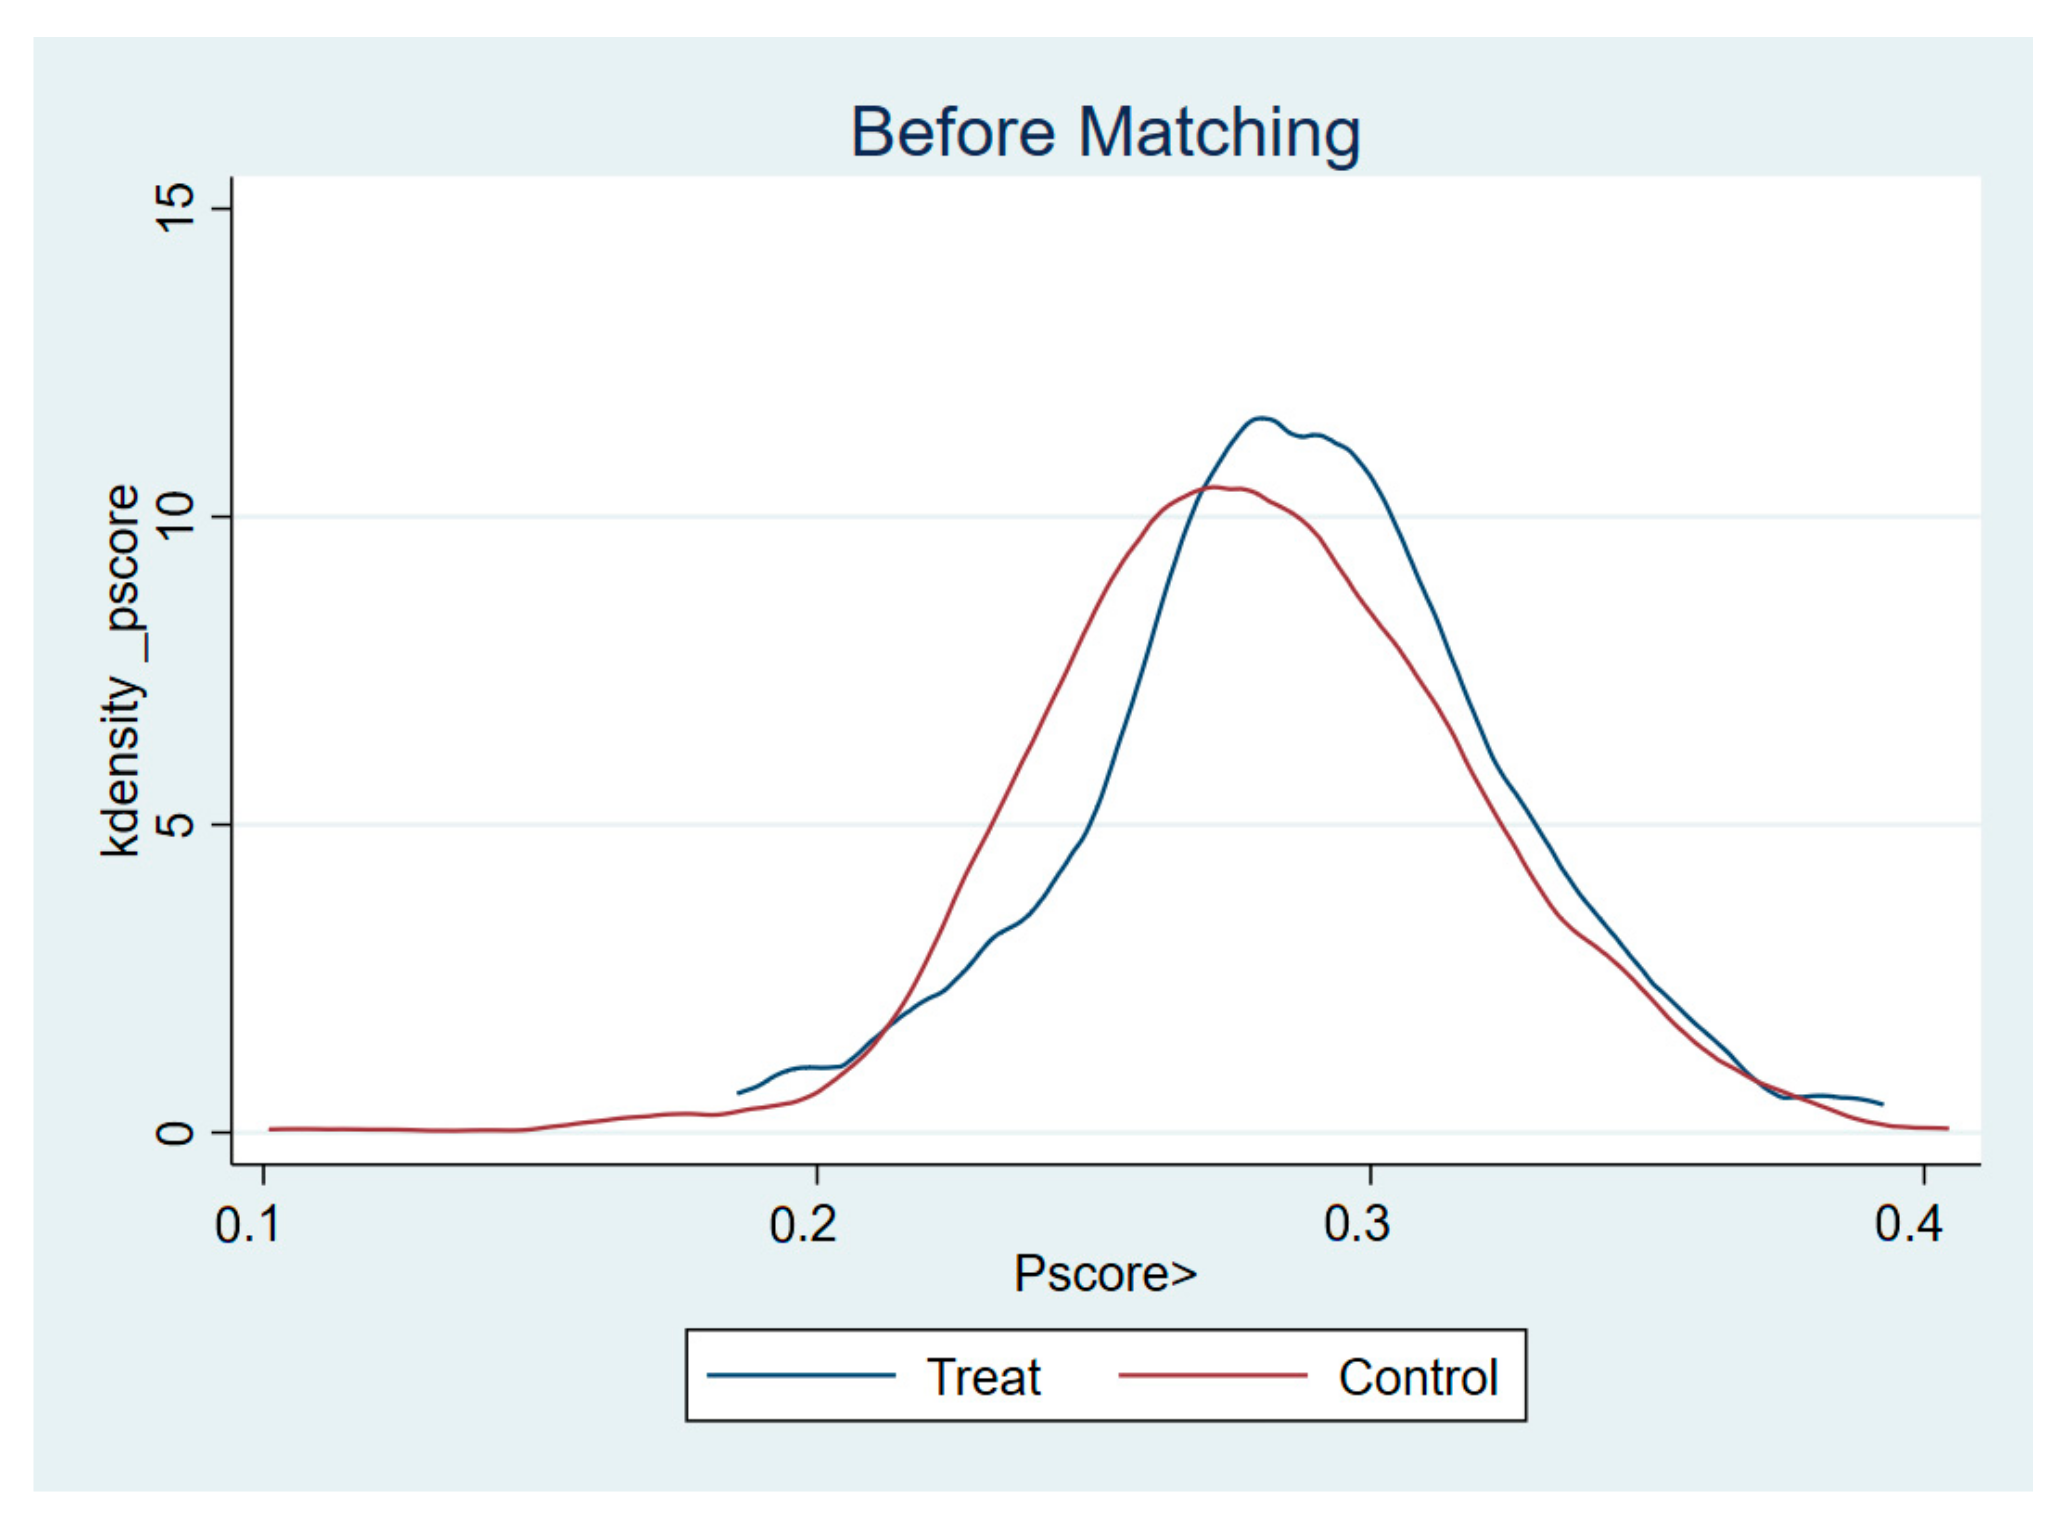
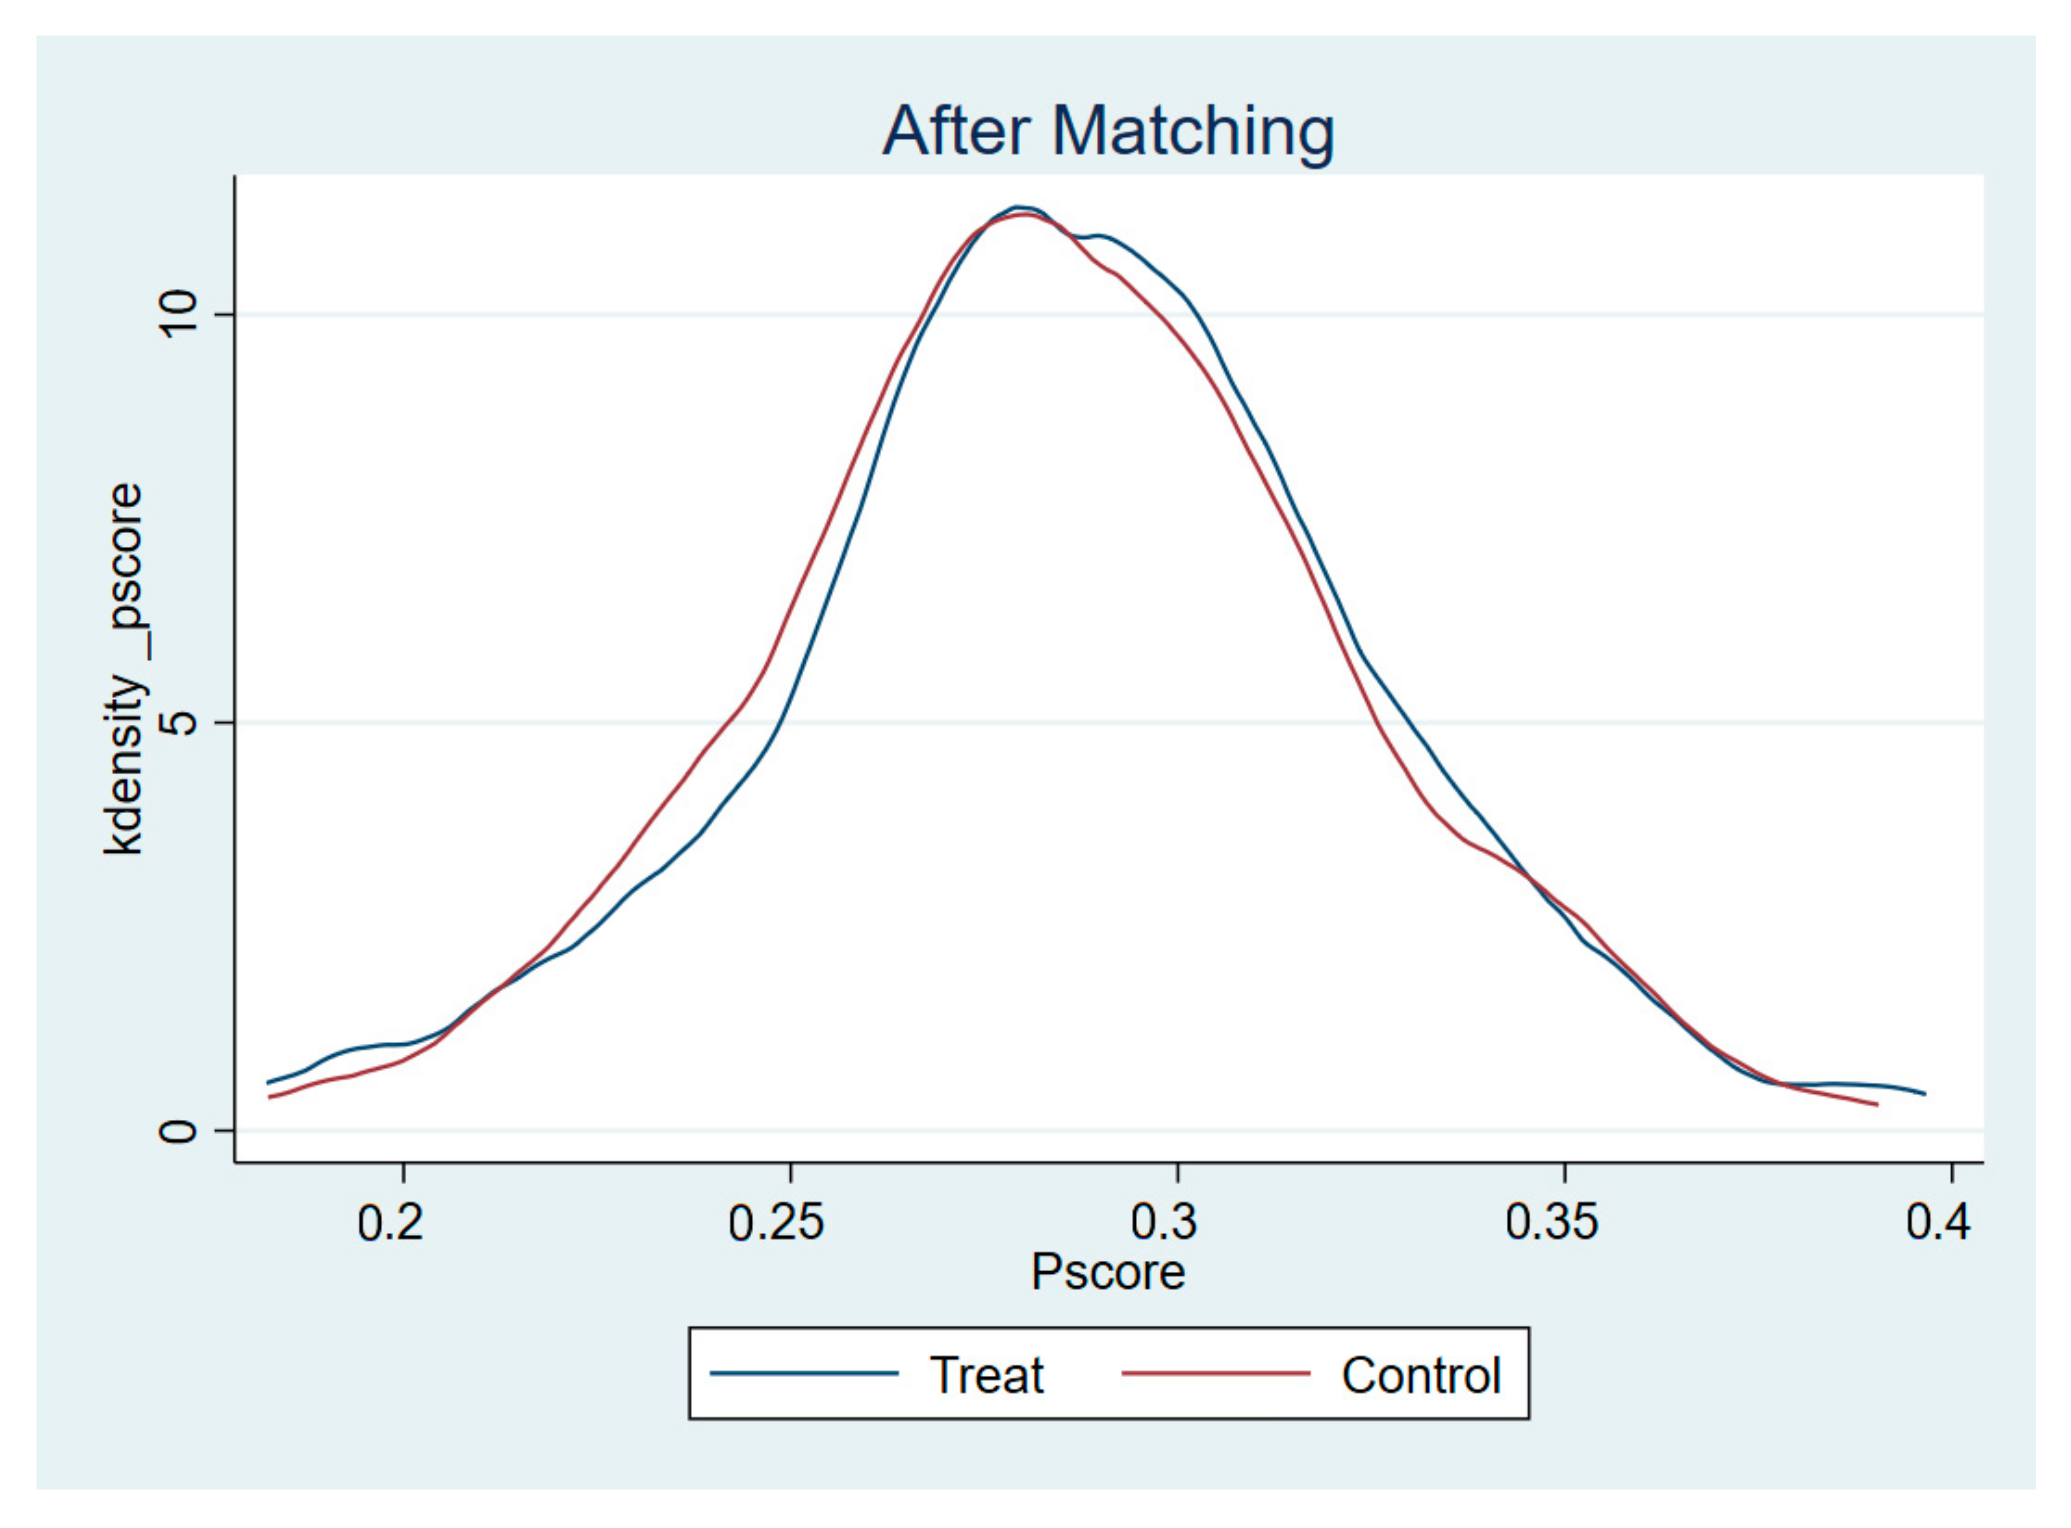
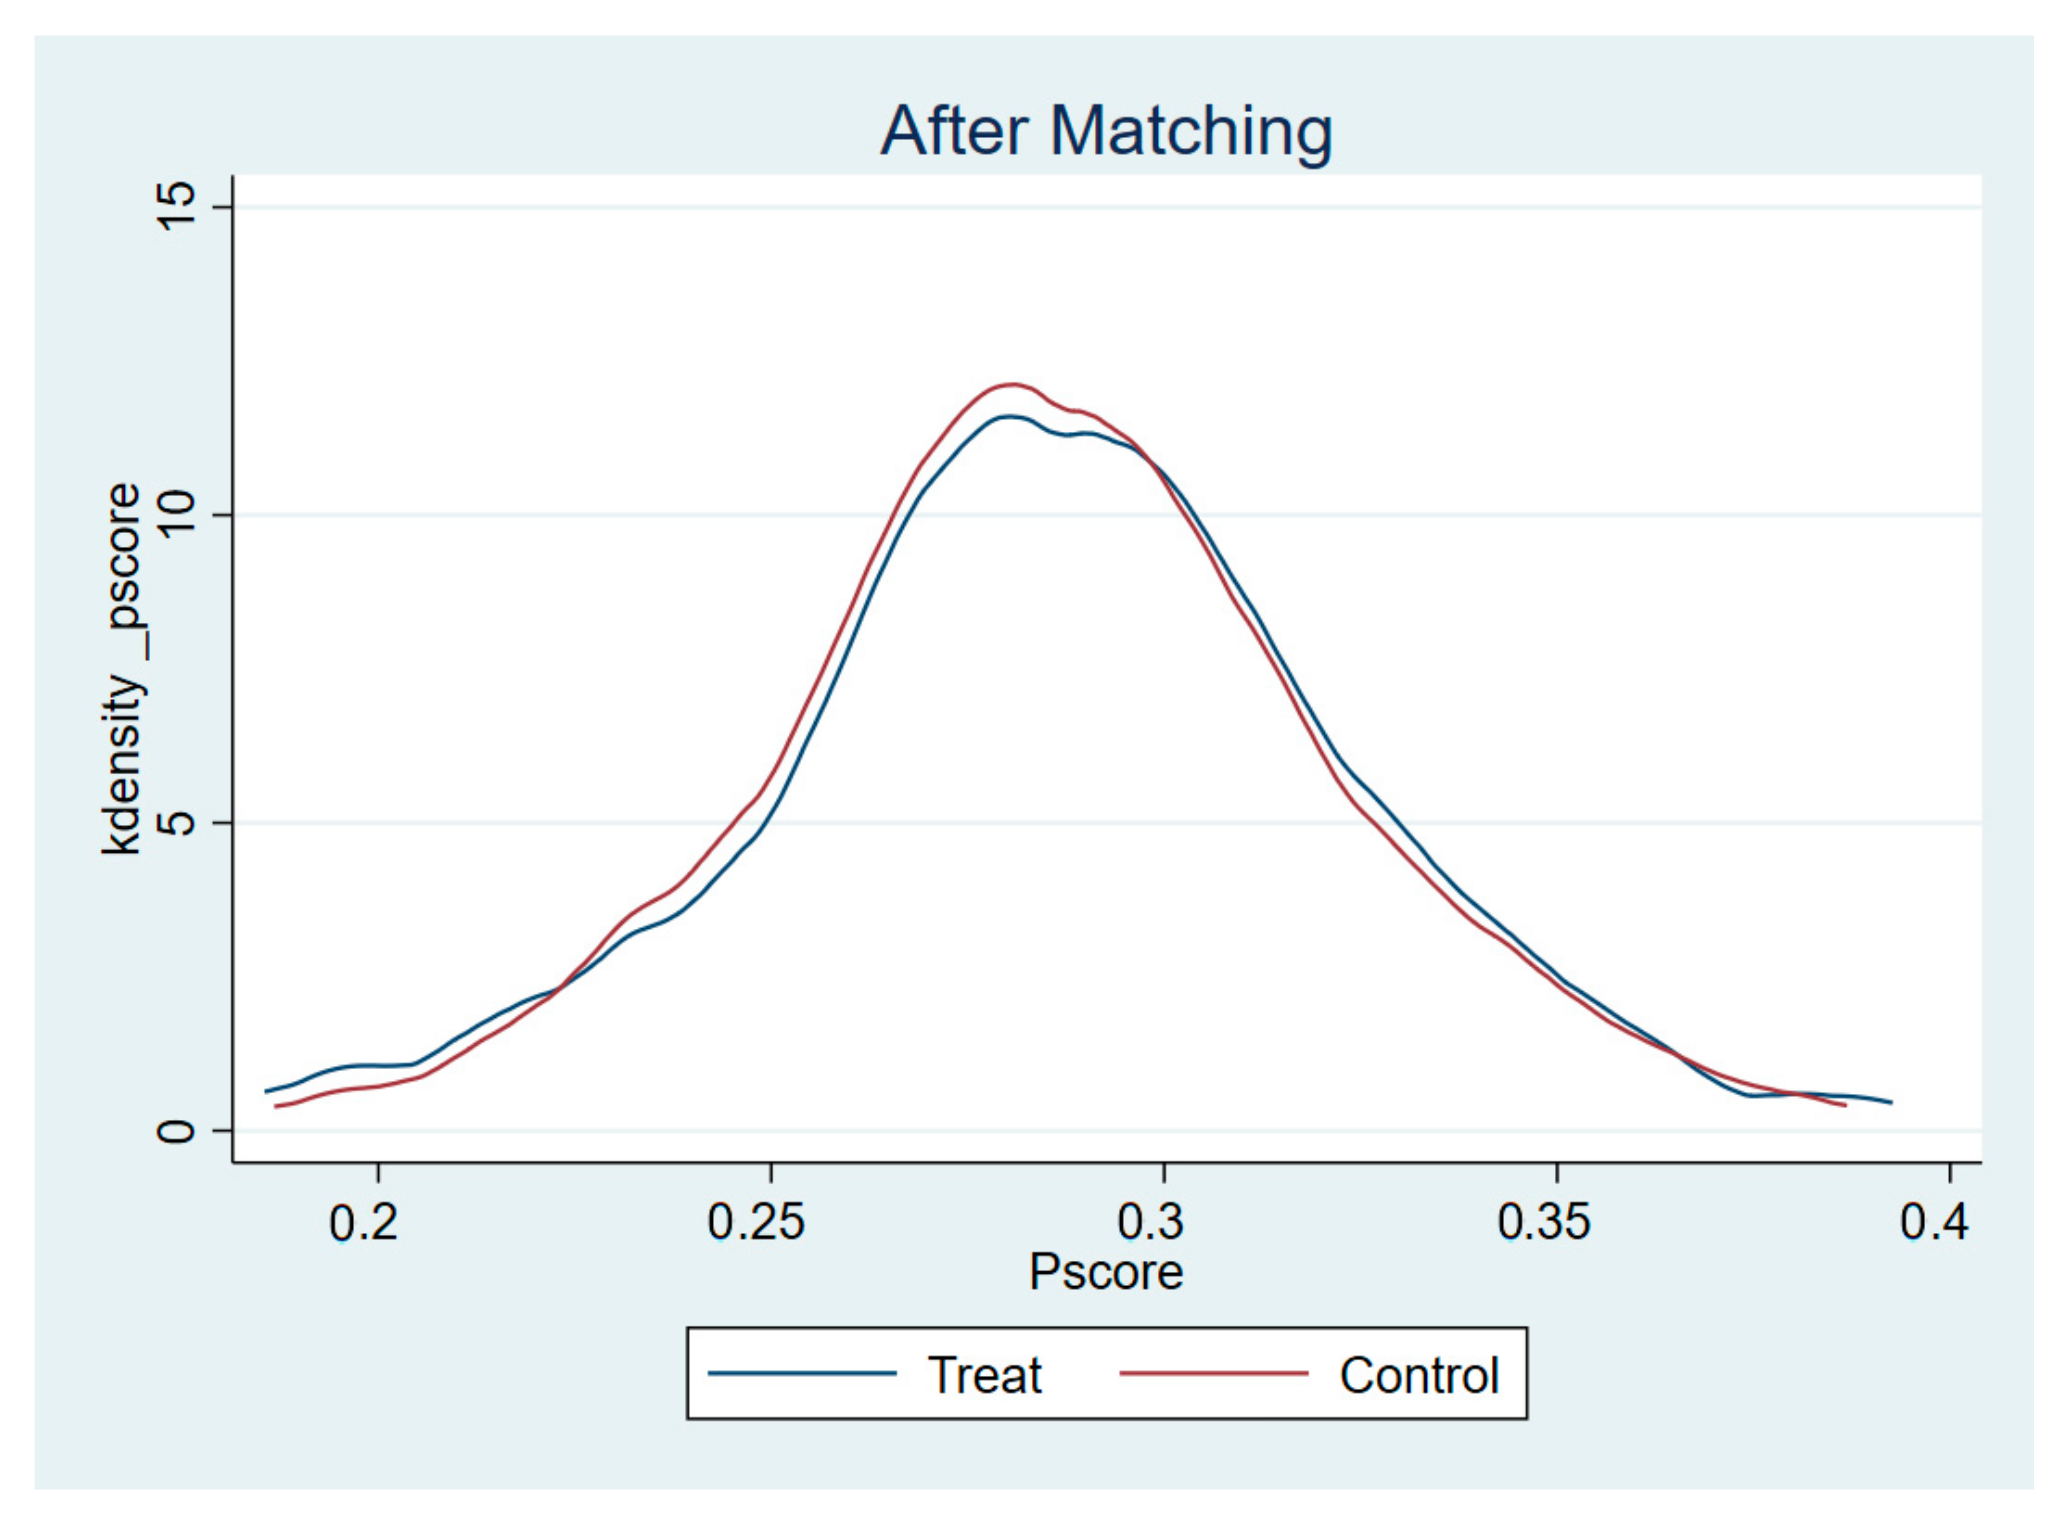
4.3.3. PSM-DID Test
4.3.4. Elimination of Outliers and Changes to the Sample Interval
4.4. Endogeneity Test
4.5. Mechanism Analysis
- To test the “Carbon Trading Policy → Green Exploratory Innovation” mechanism, as shown in Column (1) of Table 6, the results indicate that the regression coefficient is 15.19, and it is significant at the 1% confidence interval, suggesting that the carbon trading policy is significantly positively correlated with the level of green exploratory innovation within enterprises. The results confirm the “Carbon Trading Policy → Green Exploratory Innovation “ mechanism and support Hypothesis H2. This conclusion is consistent with the research of Borghesi, S et al. [4,5], but this paper expands the detailed research on the effect of carbon trading policy on green innovation; that is, in influencing the innovation process of green enterprises, carbon trading policy will first have a significant positive effect on green exploratory innovation, which lays the foundation for the mechanism analysis in the following text.
- To test the “Green Exploratory Innovation → Green Exploitative Innovation” mechanism, as shown in Column (2) of Table 7, the results indicate that the regression coefficient is 0.273, and it is significant at the 1% confidence interval, demonstrating that green exploratory innovation is significantly positively correlated with green exploitative innovation. The results confirm the “Green Exploratory Innovation → Green Exploitative Innovation” mechanism and support Hypothesis H3. This conclusion is consistent with the research of Cao, Q et al. [15,16], but this paper finds that green exploratory innovation and green application innovation in Green ambidextrous innovation not only have a combination and competition relationship, but also a sequential mechanism between the two; that is, green exploratory innovation can effectively improve the level of green application innovation.
- To test the “Green ambidextrous innovation → Autonomy and Controllability of Green Enterprises Over Customers” mechanism, as shown in Column (3) of Table 7, the results indicate that the regression coefficient is −0.0795, and it is significant at the 1% confidence interval, indicating that Green ambidextrous innovation is significantly positively correlated with the controllability of green enterprises over customers. The results confirm the “Green ambidextrous innovation → Autonomy and Controllability of Green Enterprises Over Customers” mechanism and support Hypothesis H4a. This conclusion is consistent with the research of Hua Zhibing et al. [21], but this paper not only finds the impact of Green ambidextrous innovation on customer concentration, but also proves the impact of Green ambidextrous innovation on the controllability of green enterprise customers, broadening the impact path of Green ambidextrous innovation.
- To test the “Green ambidextrous innovation → Autonomy and Controllability of Green Enterprises Over Suppliers” mechanism, as shown in Column (4) of Table 7, the results indicate that the regression coefficient is 0.012, and it is not significant at the 10% confidence interval, suggesting that the influence of Green ambidextrous innovation on the controllability of green enterprises over suppliers is not significant. The results indicate that the “Green ambidextrous innovation → Autonomy and Controllability of Green Enterprises Over Suppliers” mechanism does not hold. This conclusion is consistent with the research of Yuan Zeming et al. [49]; that is, the results of this paper once again verify that the impact of Green ambidextrous innovation on the controllability of green enterprise suppliers is not obvious. The reason may lie in the current disconnection within the green enterprises during the Ambidextrous Innovation process, where endogenous innovation is generally confined to enhancing the Autonomy and Controllability within the green enterprise itself, with the external spillover effects on other segments of the green supply chain remaining unclear, resulting in poor overall supply chain linkage effects.
- To test the “Green ambidextrous innovation → Autonomy and Controllability of Green Enterprises Over the Supply Chain” mechanism, as shown in Column (5) of Table 7, the results indicate that the regression coefficient is −0.0115, and it is not significant at the 10% confidence interval, suggesting that the impact of Green ambidextrous innovation on the controllability of the supply chain for green enterprises is not significant. The results confirm that the “Green ambidextrous innovation → Autonomy and Controllability of Green Enterprises Over the Supply Chain” mechanism does not hold. The reason could be attributed to the lag in the cycle of research and development of applied technologies by green enterprises. Therefore, the enhancement of overall supply chain controllability appears to be inconsequential, akin to the influence of Green ambidextrous innovation on suppliers’ controllability. Green enterprises’ Green ambidextrous innovation may predominantly depend on exogenous technological inputs rather than on indigenous research and development initiatives.
4.6. Further Analysis: Heterogeneity Test
4.6.1. Regional Heterogeneity
4.6.2. Firm Heterogeneity Test
5. Conclusions and Discussion
- To advance carbon trading policies, it is essential to enhance both policy frameworks and market mechanisms. From a governmental standpoint, incentives such as tax breaks, fiscal subsidies, or reductions in loan interest rates should be allocated to enterprises that achieve significant emission reductions. This approach alleviates the economic burden associated with green transformation and propels the external shift towards sustainable business practices. In refining the carbon trading market mechanism, a gradual transition from free allocation to paid allocation of carbon quotas is recommended. This shift ensures that carbon price signals accurately mirror the market’s supply and demand dynamics, thereby facilitating a fair distribution of carbon emission rights, fostering green technological innovation within enterprises, and reinforcing the Autonomy and Controllability of green businesses.
- The ambidextrous innovation capabilities of green enterprises must be fortified alongside the enhancement of their Autonomy and Controllability. Comprehensive innovation systems should be established, professional talent teams cultivated, and cross-departmental collaboration mechanisms developed to achieve seamless integration of resources, technology, and outcomes. Concurrently, governments are encouraged to establish innovation funds aimed at promoting collaborative innovation throughout the green supply chain. Such funds reduce trial-and-error costs for green enterprises, expand the application scenarios for green technologies, and facilitate the conversion of green technologies from tacit knowledge into explicit performance. These measures collectively support the dual objectives of innovation and controllability within green enterprises.
- A clear pathway must be established to translate Green ambidextrous innovation into Autonomy and Controllability for green enterprises. Optimization and upgrading of innovation systems, tailored to specific enterprise needs, should accelerate the efficient integration of government, industry, academia, and research sectors. Emphasis should be placed on the role of Green ambidextrous innovation within supply chains, enhancing information exchange and sharing across various upstream and downstream segments. Focus areas include the learning, absorption, and application of innovative resources and outcomes within the supply chain. By fostering a closed-loop Green ambidextrous innovation ecosystem across the entire supply chain, green enterprises can reinforce their leadership roles within this ecosystem.
- To promote a fair distribution of carbon emission rights and stimulate green technological innovation, the carbon trading market mechanism should undergo continuous improvement. Governments should increase green financial support and social investment in enterprises in western China, leveraging the region’s rich energy resources and dense energy industries. Priority should be given to green innovation and transformation in clean and sustainable energy, aiming to create an integrated “production–transportation–storage–usage” energy supply chain system. In terms of green enterprise types, policymakers should consider prioritizing the development of upstream green energy production enterprises, such as green factories and hydro or wind power plants, to achieve Autonomy and Controllability on the green energy supply side.
Author Contributions
Funding
Institutional Review Board Statement
Informed Consent Statement
Data Availability Statement
Acknowledgments
Conflicts of Interest
References
- Wang, W.G.; Han, X. Strategic Technological Innovation of Enterprises and Industrial Autonomy and Controllability. China Ind. Econ. 2024, 8, 43–60. [Google Scholar]
- To Enhance the Resilience of China’s Economy, It Is Crucial to Achieve Autonomy in Industrial and Supply Chains. Available online: http://theory.people.com.cn/n1/2020/1221/c40531-31973009.html (accessed on 3 November 2024).
- Implementation of the Central Economic Work Conference’s Directives Is Crucial for Achieving Greater Success in Development and Reform Initiatives—National Development and Reform Work Conference Convened in Beijing. Available online: https://www.ndrc.gov.cn/xwdt/xwfb/202412/t20241213_1395024.html (accessed on 14 December 2024).
- Borghesi, S.; Cainelli, G.; Mazzanti, M. Linking emission trading to environmental innovation: Evidence from the Italian manufacturing industry. Res. Policy 2015, 44, 669–683. [Google Scholar] [CrossRef]
- Calel, R.; Dechezleprêtre, A. Environmental policy and directed technological change: Evidence from the European carbon market. Rev. Econ. Stat. 2016, 98, 173–191. [Google Scholar] [CrossRef]
- Dong, Y.; Wang, Y.; Sun, K.; Sun, X. Research on the governance effect and emission reduction mechanism of “carbon emission trading”. Sci. Res. Manag. 2024, 45, 160–171. [Google Scholar]
- Li, X.L.; Shi, W.; Tian, Y. Carbon Emission Trading and Corporate Green Technological Innovations. Stat. Inf. Forum 2024, 11, 89–99. [Google Scholar]
- Feng, X.; Zhao, Y.; Yan, R. Does carbon emission trading policy has have emission reduction effect?—An empirical study based on quasi-natural experiment method. J. Environ. Manag. 2024, 351, 119791. [Google Scholar] [CrossRef]
- Gagelmann, F.; Frondel, M. The impact of emission trading on innovation–science fiction or reality? Eur. Environ. 2005, 15, 203–211. [Google Scholar] [CrossRef]
- Requate, T. Dynamic incentives by environmental policy instruments—A survey. Ecol. Econ. 2005, 54, 175–195. [Google Scholar] [CrossRef]
- Lv, M.; Bai, M. Evaluation of China′s carbon emission trading policy from corporate innovation. Financ. Res. Lett. 2021, 39, 101565. [Google Scholar] [CrossRef]
- Zhao, X.; Shang, Y.; Ma, X.; Xia, P.; Shahzad, U. Does carbon trading lead to green technology innovation: Recent evidence from Chinese companies in resource-based industries. IEEE Trans. Eng. Manag. 2022, 71, 2506–2523. [Google Scholar] [CrossRef]
- Mu, Y.; Zhao, J. Production Strategy and Technology Innovation under Different Carbon Emission Polices. Sustainability 2023, 15, 9820. [Google Scholar] [CrossRef]
- Zhang, N.; Bi, Y.; Gao, W.; Deng, J.; Tang, E. Heterogeneous effects of environmental regulations on green technology innovation: Measurement by using patents and evidence from China’ prefecture-level cities. Scientometrics 2024, 129, 7667–7698. [Google Scholar] [CrossRef]
- Cao, Q.; Gedajlovic, E.; Zhang, H. Unpacking organizational ambidexterity: Dimensions, contingencies, and synergistic effects. Organ. Sci. 2009, 20, 781–796. [Google Scholar] [CrossRef]
- Li, C.R.; Lin, C.J.; Huang, H.C. Top management team social capital, exploration-based innovation, and exploitation-based innovation in SMEs. Technol. Anal. Strateg. Manag. 2014, 26, 69–85. [Google Scholar] [CrossRef]
- Jansen, J.J.P.; Bosch, F.A.J.V.D.; Volberda, H.W. Exploratory innovation, exploitative innovation, and performance: Effects of organizational antecedents and environmental moderators. Manag. Sci. 2006, 52, 1661–1674. [Google Scholar] [CrossRef]
- Mihalache, O.R.; Jansen, J.J.; Van den Bosch, F.A.; Volberda, H.W. Top management team shared leadership and organizational ambidexterity: A moderated mediation framework. Strategic Entrep. J. 2014, 8, 128–148. [Google Scholar] [CrossRef]
- Wang, Y.D.; Li, J.H. Constructing a “Four Forces, Five Dimensions” Model for Ambidextrous Organizational Innovation. Sci. Sci. Manag. ST 2012, 33, 173–180. [Google Scholar]
- He, Z.L.; Wong, P.K. Exploration vs. exploitation: An empirical test of the ambidexterity hypothesis. Organ. Sci. 2004, 15, 481–494. [Google Scholar] [CrossRef]
- Hua, Z.B.; Wu, Y. Ambidextrous Innovation and Its Impact on Customer Concentration: A Resource Dependence Perspective. Res. Dev. Manag. 2024, 1–15. [Google Scholar] [CrossRef]
- Mafabi, S.; Munene, J.C.; Ahiauzu, A. Creative climate and organisational resilience: The mediating role of innovation. Int. J. Organ. Anal. 2015, 23, 564–587. [Google Scholar] [CrossRef]
- Arora, A.; Fosfuri, A.; Gambardella, A. Markets for technology and their implications for corporate strategy. Ind. Corp. Change 2001, 10, 419–451. [Google Scholar] [CrossRef]
- Engelen, A.; Huesker, C.; Rieger, V.; Berg, V. Building a resilient organization through a pre-shock strategic emphasis on innovation. J. Prod. Innov. Manag. 2024, 41, 36–61. [Google Scholar] [CrossRef]
- Coase, R.H. The problem of social cost. J. Law Econ. 2013, 56, 837–877. [Google Scholar] [CrossRef]
- Sun, Y.N.; Jiang, L.Y. How Ambidextrous Innovation Enhances Organizational Resilience: A Multiple Case Study in the Chinese Context. Nanjing Soc. Sci. 2024, 3, 41–51. [Google Scholar]
- Porter, M.E.; Linde, C.V.D. Toward a new conception of the environment-competitiveness relationship. J. Econ. Perspect. 1995, 9, 97–118. [Google Scholar] [CrossRef]
- Cai, Q.F.; Yan, W.W.; Shu, S.W. Green Innovation Spillover in Supply Chains—From the Perspective of Core Enterprises and Suppliers′ Collaborative Development. Econ. Manag. 2024, 46, 43–59. [Google Scholar]
- Xia, J. Mutual dependence, partner substitutability, and repeated partnership: The survival of cross-border alliances. Strateg. Manag. J. 2011, 32, 229–253. [Google Scholar] [CrossRef]
- Tang, F.C.; Gu, S.L.; Huan, G. Digital Platform Capability and Disruptive Corporate Innovation: An Empirical Study Based on Platform Ecology and Dynamic Capabilities. Syst. Eng. Theory Pract. 2024, 1–23. [Google Scholar]
- Zhu, J.; Fan, Y.; Deng, X.; Xue, L. Low-carbon innovation induced by emissions trading in China. Nat. Commun. 2019, 10, 4088. [Google Scholar] [CrossRef]
- Cui, J.; Dai, J.; Wang, Z.; Zhao, X. Does environmental regulation induce green innovation? A panel study of Chinese listed firms. Technol. Forecast. Soc. Change 2022, 176, 121492. [Google Scholar] [CrossRef]
- Nong, D.; Nguyen, T.H.; Wang, C.; Van Khuc, Q. The environmental and economic impact of the emissions trading scheme (ETS) in Vietnam. Energy Policy 2020, 140, 111362. [Google Scholar] [CrossRef]
- Opinions of the CPC Central Committee and the State Council on Fully Implementing the New Development Concept to Address Carbon Peak and Carbon Neutrality. Available online: https://www.ndrc.gov.cn/xxgk/jd/zctj/202110/t20211024_1300729.html (accessed on 3 November 2024).
- Lu, J.; Wang, X.F. The Impact of Low-Carbon Pilot Policies on Urban Technological Innovation in China: A Quasi-Natural Experiment of Low-Carbon City Pilots. J. China Univ. Geosci. (Soc. Sci. Ed.) 2019, 19, 128–141. [Google Scholar]
- Ngo, L.V.; Bucic, T.; Sinha, A.; Lu, V.N. Effective sense-and-respond strategies: Mediating roles of exploratory and exploitative innovation. J. Bus. Res. 2019, 94, 154–161. [Google Scholar] [CrossRef]
- Sheng, M.Q.; Wu, S.M.; Zhang, Y.N. Exploratory Innovation and Corporate Total Factor Productivity. Ind. Econ. Res. 2020, 1, 28–41. [Google Scholar]
- Yang, Z.; Li, J.Z.; Ling, H.C. Policy Uncertainty and Innovation Digitalization: The Perspective of Ambidextrous Innovation. Sci. Res. Manag. 2022, 43, 1–10. [Google Scholar]
- Tang, Y.J. Bargaining Power of Suppliers and Distributors and Company Performance: Evidence from Chinese Manufacturing Listed Companies from 2005 to 2007. China Ind. Econ. 2009, 10, 67–76. [Google Scholar]
- Porter, M.E. The five competitive forces that shape strategy. Harv. Bus. Rev. 2008, 86, 78–93. [Google Scholar]
- Deng, F.; Yang, K.X.; Zheng, Y.Y. The Impact of Supply Chain Characteristics on Corporate Green Innovation: An Analysis from the Perspectives of Resource Synergy and Crowding Out. Sci. Res. Manag. 2024, 45, 1–11. [Google Scholar]
- Wu, Q.; Yao, X.Y. Enterprise Digital Transformation and Supply Chain Configuration: Centralization or Diversification. China Ind. Econ. 2023, 8, 99–117. [Google Scholar]
- Fink, R.C.; Edelman, L.F.; Hatten, K.J.; James, W.L. Transaction cost economics, resource dependence theory, and customer–supplier relationships. Ind. Corp. Change 2006, 15, 497–529. [Google Scholar] [CrossRef]
- Beijing and Tianjin among 7 Provinces and Cities Authorized to Initiate Carbon Emission Trading Pilot Projects. Available online: http://www.gov.cn/jrzg/2012-01/13/content_2043687.htm (accessed on 3 November 2024).
- Li, J.C.; Peng, Y.C.; Wang, W.W. Can Green Credit Policies Foster the Development of Green Enterprises?—A Risk-Taking Perspective. Financ. Res. 2023, 3, 112–130. [Google Scholar]
- Li, S.; Li, D.; Tian, M.F.; Du, G.Y. Has Technological Innovation Reduced Enterprises’ Dependence on Major Clients? Nankai Manag. Rev. 2021, 24, 26–39. [Google Scholar]
- Zhang, S.; Ma, X.; Cui, Q.; Liu, J. Does the low carbon transition impact urban resilience? Evidence from China’s pilot cities for carbon emission trading. Environ. Sci. Pollut. Res. 2024, 31, 11128–11149. [Google Scholar] [CrossRef]
- Li, W.; Chen, L.; Chi, Y. Supplier/customer concentration and corporate green innovation. Soft Sci. 2023, 37, 97–102+126. [Google Scholar]
- Yuan, Z.M.; Huang, C.; Liu, J. The Spillover Effects of Carbon Emission Trading on High-Quality Corporate Development: Empirical Evidence from Supply Chain Alliances. Res. Econ. Manag. 2024, 45, 58–80. [Google Scholar]


| Variable | N | Mean | Std. Dev. | Median | Max | Min |
|---|---|---|---|---|---|---|
| Cen con | 1856 | 28.336 | 18.204 | 23.24 | 95.02 | 0.31 |
| Cen sup | 1856 | 27.384 | 14.815 | 23.265 | 97.33 | 0.33 |
| Cen chain | 1856 | 25.507 | 13.526 | 22.95 | 79.91 | 1.48 |
| Treated | 1856 | 0.277 | 0.448 | 0 | 1 | 0 |
| time | 1443 | 53.314 | 124.132 | 1 | 526 | 0 |
| DID | 1856 | 0.199 | 0.400 | 0 | 1 | 0 |
| Lev | 1856 | 0.435 | 0.167 | 0.441 | 0.864 | 0.043 |
| ROA | 1856 | 0.047 | 0.050 | 0.045 | 0.219 | −0.427 |
| REC | 1856 | 0.15 | 0.091 | 0.132 | 0.507 | 0 |
| RC | 1856 | 2.158 | 1.910 | 1.607 | 24.226 | 0.455 |
| Quick | 1856 | 1.698 | 1.730 | 1.222 | 21.888 | 0.312 |
| BM | 1856 | 0.354 | 0.141 | 0.337 | 0.846 | 0.049 |
| Firmage | 1856 | 2.878 | 0.374 | 2.944 | 3.689 | 1.099 |
| Board | 1856 | 2.158 | 0.187 | 2.197 | 2.708 | 1.609 |
| Top3 | 1856 | 0.449 | 0.142 | 0.436 | 0.885 | 0.149 |
| Variable | (1) Cen_con | (2) Cen_sup | (3) Cen_chain |
|---|---|---|---|
| DID | −2.989 *** | 0.702 | −1.637 * |
| (0.986) | (1.190) | (0.877) | |
| Lev | −12.29 *** | −5.208 | −8.678 *** |
| (3.544) | (4.075) | (2.512) | |
| Roa | −22.04 *** | −6.194 | |
| (6.497) | (6.920) | ||
| REC | 17.43 *** | −4.433 | |
| (5.359) | (6.118) | ||
| CR | −3.670 *** | −0.475 | |
| (1.348) | (1.612) | ||
| Quick | 4.851 *** | 1.590 | |
| (1.414) | (1.706) | ||
| BM | −8.008 *** | −4.858 | −5.213 ** |
| (2.737) | (2.993) | (2.328) | |
| Firmage | −8.387 *** | 4.056 | |
| (2.981) | (3.796) | ||
| Board | −5.715 ** | 5.182 ** | −4.218 ** |
| (2.232) | (2.470) | (1.984) | |
| Top3 | 6.304 * | −2.858 | |
| (3.793) | (4.453) | ||
| Constant | 63.23 *** | 18.63 | 41.56 *** |
| (9.730) | (11.57) | (4.787) | |
| Year&Ind | Yes | Yes | Yes |
| Observations | 1773 | 1471 | 1775 |
| R-squared | 0.668 | 0.677 | 0.767 |
| Number of scode | 125 | 125 | 125 |
| Variables | (1) Cen_con | (2) Cen_sup | (3) Cen_chain |
|---|---|---|---|
| DID | −3.754 *** | 0.426 | −1.856 ** |
| Constant | 26.90 *** | 34.30 *** | 26.37 *** |
| (1.129) | (1.229) | (0.991) | |
| Controls | Control | Control | Control |
| Year&Ind | Yes | Yes | Yes |
| Observations | 1795 | 1490 | 1797 |
| R-squared | 0.016 | 0.055 | 0.159 |
| Number of scode | 125 | 125 | 125 |
| Variables | (1) Winsor_cus | (2) Winsor_sup | (3) Winsor_chain | (1) 2011–2015_cus | (2) 2011–2015_sup | (3) 2011–2015_chain |
|---|---|---|---|---|---|---|
| DID | −3.604 *** | 0.231 | −1.908 ** | −3.754 *** | 0.426 | −1.856 ** |
| (0.983) | (1.131) | (0.851) | (0.994) | (1.186) | (0.872) | |
| Constant | 26.94 *** | 33.54 *** | 25.95 *** | 26.90 *** | 34.30 *** | 26.37 *** |
| (1.116) | (1.172) | (0.967) | (1.129) | (1.229) | (0.991) | |
| Controls | Control | Control | Control | Control | Control | Control |
| Year&Ind | Yes | Yes | Yes | Yes | Yes | Yes |
| Observations | 1795 | 1490 | 1797 | 1795 | 1490 | 1797 |
| R-squared | 0.615 | 0.656 | 0.667 | 0.016 | 0.055 | 0.159 |
| Number of scode | 125 | 125 | 125 | 125 | 125 | 125 |
| Variables | (1) IV_cus | (2) IV_sup | (3) IV_chain |
|---|---|---|---|
| L.DID | −5.622 *** | −3.213 ** | −4.329 *** |
| (0.994) | (1.278) | (0.863) | |
| Constant | 26.60 *** | 28.52 *** | 16.78 *** |
| (1.081) | (2.242) | (0.938) | |
| Controls | Control | Control | Control |
| Year&Ind | Yes | Yes | Yes |
| Observations | 1669 | 1415 | 1671 |
| R-squared | 0.032 | 0.031 | 0.197 |
| Number of scode | 125 | 125 | 125 |
| Variables | (1) inno_ex | (2) inno_ap | (3) cen_con | (4) cen_sup | (5) cen_chain |
|---|---|---|---|---|---|
| inno_ap | −0.0795 *** | 0.0140 | −0.0115 | ||
| (0.0170) | (0.0181) | (0.0162) | |||
| inno_ex | 0.273 *** | 0.0450 *** | −0.0132 * | 0.0236 *** | |
| (0.00740) | (0.00700) | (0.00758) | (0.00666) | ||
| DID | 15.19 *** | 6.366 *** | −2.030 ** | −1.897 * | 3.290 *** |
| (3.787) | (1.171) | (0.828) | (1.019) | (0.788) | |
| Controls | Control | Control | Control | Control | Control |
| Constant | 11.01 *** | 2.307 *** | 28.71 *** | 27.93 *** | 24.59 *** |
| (1.230) | (0.387) | (0.277) | (0.343) | (0.264) | |
| Year&Ind | Yes | Yes | Yes | Yes | Yes |
| Observations | 1856 | 1856 | 1795 | 1490 | 1797 |
| R-squared | 0.409 | 0.456 | 0.429 | 0.405 | 0.422 |
| Number of scode | 125 | 125 | 125 | 125 | 125 |
| Variables | (1) East | (2) West | (3) Mid | (4) East | (5) West | (6) Mid | (7) East | (8) West | (9) Mid |
|---|---|---|---|---|---|---|---|---|---|
| DID | −2.878 *** | −7.636 ** | −2.555 | −0.0253 | 2.196 | 1.891 | −0.950 | −6.112 ** | −2.498 |
| (1.750) | (4.066) | (3.019) | (1.813) | (3.550) | (3.122) | (1.506) | (3.518) | (2.671) | |
| Controls | Control | Control | Control | Control | Control | Control | Control | Control | Control |
| Constant | 27.78 *** | 27.93 *** | 24.15 *** | 34.47 *** | 32.95 *** | 31.63 *** | 26.99 *** | 24.48 *** | 23.43 *** |
| (1.404) | (3.145) | (2.309) | (1.505) | (2.840) | (2.494) | (1.209) | (2.722) | (2.043) | |
| Year&Ind | Yes | Yes | Yes | Yes | Yes | Yes | Yes | Yes | Yes |
| Observations | 1221 | 187 | 387 | 1031 | 146 | 313 | 1223 | 187 | 387 |
| R-squared | 0.712 | 0.792 | 0.756 | 0.763 | 0.741 | 0.766 | 0.871 | 0.740 | 0.793 |
| Number of scode | 86 | 13 | 28 | 86 | 13 | 28 | 86 | 13 | 28 |
| Variables | (1) green | (2) green_chain | (3) green | (4) green_chain | (5) green | (6) green_chain |
|---|---|---|---|---|---|---|
| DID | −7.366 *** | −2.185 | −13.11 *** | 4.027 | −10.24 *** | 0.923 |
| (2.748) | (4.467) | (2.970) | (4.910) | (2.150) | (3.683) | |
| Controls | Control | Control | Control | Control | Control | Control |
| Year&Ind | Yes | Yes | Yes | Yes | Yes | Yes |
| Constant | 29.21 *** | 39.76 *** | 36.02 *** | 29.39 *** | 32.62 *** | 34.57 *** |
| (2.388) | (3.766) | (2.580) | (4.139) | (1.868) | (3.104) | |
| Observations | 267 | 79 | 267 | 79 | 267 | 79 |
| R-squared | 0.199 | 0.284 | 0.254 | 0.126 | 0.270 | 0.191 |
| Number of scode | 24 | 7 | 24 | 7 | 24 | 7 |
Disclaimer/Publisher’s Note: The statements, opinions and data contained in all publications are solely those of the individual author(s) and contributor(s) and not of MDPI and/or the editor(s). MDPI and/or the editor(s) disclaim responsibility for any injury to people or property resulting from any ideas, methods, instructions or products referred to in the content. |
© 2025 by the authors. Licensee MDPI, Basel, Switzerland. This article is an open access article distributed under the terms and conditions of the Creative Commons Attribution (CC BY) license (https://creativecommons.org/licenses/by/4.0/).
Share and Cite
Chen, W.; Yang, Y. Does Carbon Trading Policy Enhance the Autonomy and Controllability of Green Enterprises in Supply Chains? A Study of the Chain-Mediating Effects of Green Ambidextrous Innovation. Sustainability 2025, 17, 1534. https://doi.org/10.3390/su17041534
Chen W, Yang Y. Does Carbon Trading Policy Enhance the Autonomy and Controllability of Green Enterprises in Supply Chains? A Study of the Chain-Mediating Effects of Green Ambidextrous Innovation. Sustainability. 2025; 17(4):1534. https://doi.org/10.3390/su17041534
Chicago/Turabian StyleChen, Wenjie, and Yisong Yang. 2025. "Does Carbon Trading Policy Enhance the Autonomy and Controllability of Green Enterprises in Supply Chains? A Study of the Chain-Mediating Effects of Green Ambidextrous Innovation" Sustainability 17, no. 4: 1534. https://doi.org/10.3390/su17041534
APA StyleChen, W., & Yang, Y. (2025). Does Carbon Trading Policy Enhance the Autonomy and Controllability of Green Enterprises in Supply Chains? A Study of the Chain-Mediating Effects of Green Ambidextrous Innovation. Sustainability, 17(4), 1534. https://doi.org/10.3390/su17041534