Abstract
Identifying ecosystem service trade-offs/synergies and their influencing factors are prerequisites for formulating scientific ecosystem management strategies. We selected Dongting Lake Area as the study area, quantified four key ESs dynamics, including food production (FP), soil conservation (SC), habitat quality (HQ) and ecological leisure (EL), identified relationships between paired ecosystem services using Spearman correlation coefficients, and analyzed how various drivers impact trade-offs and synergies by leveraging spatial panel data models; we also implemented ecosystem management zoning by superposition analysis on ecosystem services, the relationships between these services, and key drivers. The results showed that FC and SC displayed synergy before a trade-off over the period 2000–2022. The FP–HQ and HQ–EL initially displayed synergy, then trade-off, and then synergy again. Spatially, the spatial trade-off ratios of FP–HQ, SC–HQ, and HQ–EL exceeded the synergy ratios, and trade-off areas of FP–HQ, SC–HQ, and HQ–EL existed around Dongting Lake. The direct or indirect effects of DEM, slope, precipitation, and population density have the greatest effect on ecosystem service pairs. Furthermore, the DTLA was divided into ecological unbalance, soil conservation, habitat quality synergy, and ecological leisure areas. These finding may provide critical scientific insights into how to balance ecological conservation and socio-economic progress in the Dongting Lake Area.
1. Introduction
Ecosystem services are the beneficial products, processes, and functions that ecosystems provide for human beings through natural processes, including support, regulation, provision, and cultural services [1]. These services are fundamental to human prosperity, economic activity, and social development [2,3].
Considering stakeholder preferences and limited ecological resources, the ecological processes of different ecosystem services tend to form win–win or competitive resource relationships [4,5], leading to synergies and trade-offs between ecosystem services [6,7]. The synergy between regulating and supporting services predominates, whereas regulating services mainly have a trade-off relationship with provisioning and cultural services [8]. For example, excessive pursuit of provisioning services (such as food yield) may lead to degradation of regulating services, such as soil and water conservation. Furthermore, some of these trade-offs are inherent, whereas others can be mitigated to some extent through management [9,10]. Dai et al. [11] showed that, since implementation of conservation measures, the ecosystem services in the Qinghai–Tibet Plateau have generally improved and trade-offs between providing, regulating, and supporting services have been alleviated, particularly in areas where Grain for Green projects have been implemented. Therefore, understanding and balancing the trade-offs and synergies between ecosystem services is crucial for effective policy development and environmental remediation [12].
Geographical and climatic changes play a crucial role in shaping ecosystem services. Moreover, socio-economic factors significantly influence these dynamics [13,14]. Qiao et al. [15] found that accumulated temperature and the digital elevation model (DEM) positively affected trade-offs between providing, regulating, and cultural services in Taihu Basin. Xu and Peng [16] found that the normalized difference vegetation index (NDVI) positively affected the synergistic relationship between soil and water conservation and net primary productivity (NPP), whereas, gross domestic product (GDP) negatively affected this relationship. Huang and Wu [17] showed that precipitation was the main driver of the trade-off between water yield and livestock supply in the Tibet Autonomous Region. Furthermore, when disturbances to ecosystems caused by certain drivers cease, specific ecosystem trade-offs may be mitigated or even restored to their original synergistic state [18]. Therefore, to improve the efficiency of ecosystem management, it is necessary to study the key drivers of ecosystem trade-offs/synergies.
The Dongting Lake Area (DTLA) is the second-largest freshwater lake wetland and also serves as a substantial production base for bulk agricultural products in China [19]. However, owing to long-term economic development and human interference, the DTLA has experienced serious ecological and environmental problems, including water quality deterioration, lake shrinkage, and biodiversity loss [20]. These changes have directly or indirectly impacted ecosystem services in the region. For example, implementation of the Three Gorges Dam has potential disadvantages, including changes in downstream flows, reductions in flooded areas, and water quality deterioration, which in turn have diminished the water purification service functions in the Dongting Lake Area [21]. Furthermore, with the acceleration of urbanization and the intensification of land-use transformation, the Dongting Lake Area has experienced habitat fragmentation, a decrease in biodiversity, and an increase in food production capacity, resulting in a clear trade-off between habitat quality and food production [14]. Most previous research focuses on the ecological environment and its carrying capacity in the DTLA, such as land-use change and its impact on ecological carrying capacity, water security and water resource management, biodiversity loss, and its importance to ecosystem health [22]. However, research on ecosystem service functions of the DTLA is relatively weak, particularly regarding spillover or indirect effects of drivers of ecosystem service relationships. The Dongting Lake Ecological and Economic Zone Plan highlights the steadfast coordination of the socio-economic development and ecological environment protection. Coupling of ecosystems with human well-being is becoming increasingly important [23].
Therefore, this study used the DTLA as an example and selected four ecosystem services (food production [FP], soil conservation [SC], habitat quality [HQ], and ecological leisure [EL]) to explore the interactions between ecosystem services and their key drivers, to identify appropriate ecosystem management strategies. In particular, we addressed three questions: (1) How do trade-offs and synergies among ecosystem services evolve over time and across different spatial scales in the Dongting Lake Area? (2) What are the geographical, climatic, and socio-economic drivers influencing these relationships? (3) How can management strategies be designed to address these trade-offs and enhance synergies effectively? The results of the present study could provide insights that could facilitate the mitigation of conflict among different ecosystem services and the sustainable supply of ecosystem services.
2. Materials and Methods
2.1. Study Area
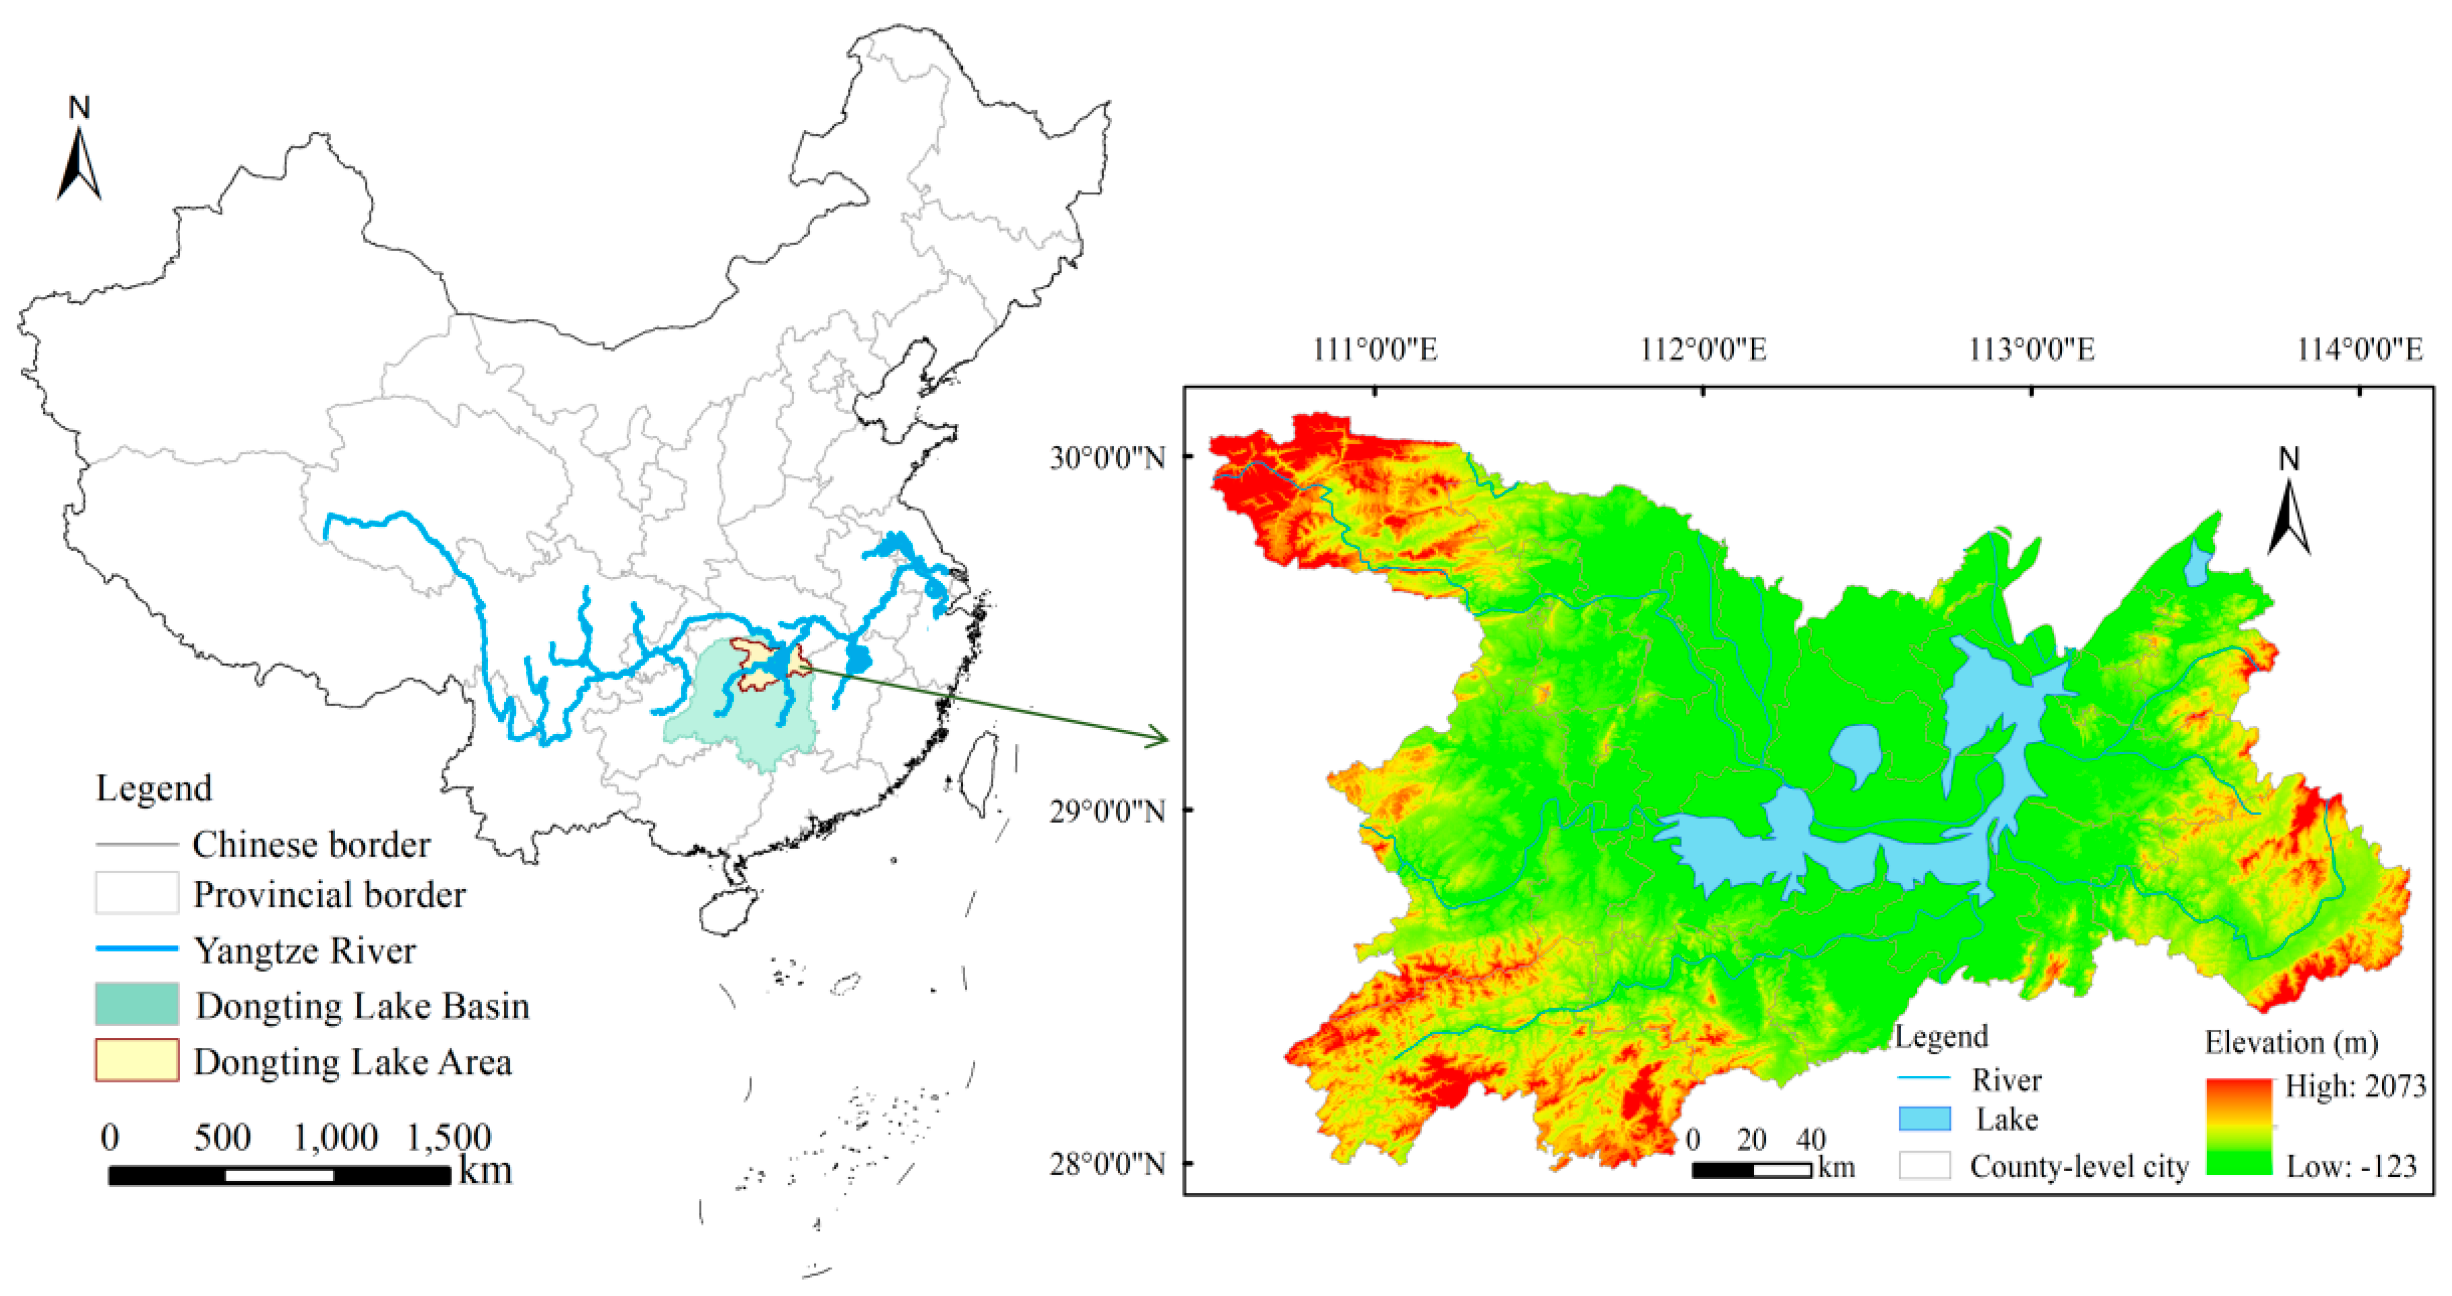
The DTLA (28°39′–30°05′ N, 109°50′–114°15′ E) is located in the middle reaches of the Yangtze River and covers an area of 31,700 km2, comprising 24 counties (cities and districts) of Yueyang, Yiyang, Changde, and Changsha, Hunan Province (Figure 1). The region has a subtropical monsoon climate, with annual precipitation of 1300–1600 mm and an average annual temperature of 16–17 °C. Dongting Lake is the second-largest freshwater lake in China. The topography of the DTLA is centered around Dongting Lake, with river and lake alluvial plains, lakeside hills, and low mountains distributed from the inside to the outside on the east, south, and west sides. This unique geographical environment makes the DTLA rich in natural resources and biodiversity, and it is known as “a good land with abundant fish and rice”. It is also a key area for coordinating the ecological protection and economic development of the lake area and a key node in the Yangtze River Economic Belt.
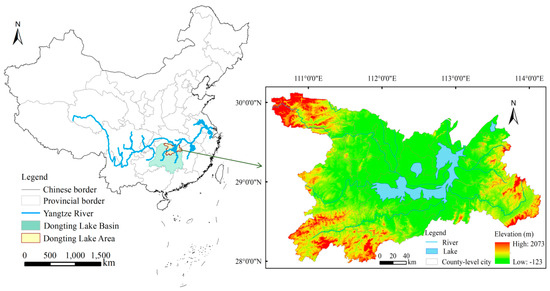
Figure 1.
Location of the Dongting Lake Area (DTLA), China.
2.2. Data Collection and Processing
2.2.1. Topography and Soil Data
DEM data, with a 30-m spatial resolution, were obtained from the Geospatial Data Cloud (http://www.gscloud.cn/, accessed on 3 January 2025) as raster data, and slope data were subsequently calculated from the DEM. DEM were compared with ground survey data and topographic maps to identify any discrepancies. Additionally, field measurements and GPS data were used to verify the elevation values at specific points within the study area. Furthermore, a smoothing filter was applied to reduce noise and improve the overall quality of the DEM.
Land-use data were sourced from available Landsat satellite imagery on the Google Earth Engine (https://earthengine.google.com/, accessed on 3 January 2025). After image pre-processing, supervised classification, and human–computer interactive visual interpretation, land-use data products of the DTLA with a 30-m spatial resolution were obtained. Soil characteristic data were sourced from the World Soil Database (https://www.isric.org/explore/wise-databases, accessed on 3 January 2025), which contains grid data with a spatial resolution of kilometers and provides information such as soil phase, soil type, and soil chemical properties at each grid point. Because the original grid had no spatial reference information, defining the projection was necessary. The WGS_1984 geographic coordinate system was selected, the data format was the grid raster format, and the soil classification system was mainly FAO-90. A combination of linear and spline interpolation methods was used to estimate soil properties at 30-m spatial resolutions. Next, cross-validation was performed by comparing the land-use and soil data with ground truth data collected from field surveys [24], thereby mitigating errors arising from data interpolation and preprocessing.
2.2.2. Vegetation Data
NDVI data were obtained from the MOD09Q1 dataset provided by the Earth Resources Observing System Data Center of the United States Geological Survey, with a 250-m spatial resolution and 8-d temporal resolution (https://www.usgs.gov/, accessed on 3 January 2025). First, the NDVI value of vegetation was calculated using the near-infrared band reflectance (NIR) and infrared band reflectance (red) of the MOD09Q1 dataset. Second, the images were stitched and reprojected using the MODIS Reprojection Tool (MRT). Finally, the annual NDVI data were calculated using the maximum synthesis method. NPP of vegetation was obtained from the MOD17A1 dataset with a 500-m spatial resolution and 1-yr temporal resolution.
2.2.3. Climate Data
Climate data included annual average temperature, annual precipitation, and potential evapotranspiration. Temperature and precipitation data were downloaded from the National Meteorological Data Center (https://data.cma.cn/, accessed on 3 January 2025). Twelve meteorological stations were selected in and around the study area to ensure data accuracy. Temperature and precipitation data at a 30-m resolution were obtained via spatial interpolation. Potential evapotranspiration data were derived from the MOD16A2 dataset, which is a synthetic product provided by the official NASA website with an 8-d temporal resolution and 500-m spatial resolution (https://www.nasa.gov/, accessed on 3 January 2025).
2.2.4. Socio-Economic Data
Socio-economic data including population density, GDP, and road spatial distribution were obtained from the Resource and Environmental Science Data Platform (https://www.resdc.cn/, accessed on 3 January 2025). Population density and GDP were raster data with a 1-km spatial resolution. Road spatial distribution data were vector data. Considering the analysis and calculation of different data, clipping, projection, statistics, and interpolation functions in ArcGIS were used to unify the time frequency, projection coordinates, and grid size of all spatial data. The coordinate system was transformed to WGS_1984_UTM_Zone_48 and the resolution was resampled to 250 m × 250 m.
2.3. Methods
2.3.1. Quantitation of Ecosystem Services
FP
The DTLA, the main food-producing area of Hunan Province, is of great significance for maintaining food security. FP is primarily derived from cultivated land. NDVI can detect vegetation production status and reflect FP capacity. Therefore, based on the cultivated land area of the land-use classification data, the NDVI distribution method was used to calculate the grain yield for each grid. The FP spatial distribution was determined using the following formula:
where FPi is the food yield of grid unit i; Gsum is the total food yield; NDVIi is the normalized vegetation index of grid unit i, and; NDVIsum is the sum of the NDVI of the cultivated land.
SC
SC is important for maintaining land resources, preventing regional land degradation, and reducing the risk of geological disasters. The sediment transport ratio module in InVEST 3.14.1 software was used to calculate SC. This module, based on the USLE at the pixel scale, integrated data such as land use, soil texture, DEM, precipitation, and soil and water conservation measures, and it was used as the calculation unit to realize the model operation process. Therefore, the SC assessment results were more intuitive and closer to the actual situation in the study area.
Here, R is rainfall erosivity; K is the soil erodibility factor; LS is the topographic factor; C is the cover and management factor, and; P is the soil and water conservation measure factor.
C represents the role of vegetation cover in soil conservation, with values ranging from 0 to 1. Areas with no vegetation or crop cover (bare land) have a C value of 1, while areas with good vegetation cover have a C value of 0. Based on the formulae proposed in previous studies, the C value can be calculated for different levels of vegetation cover [25,26]. The calculation formula is as follows:
where P represents the degree to which human activities suppress soil erosion, with values ranging from 0 to 1. Areas where no soil erosion occurs have a P value of 0, while areas with no conservation measures have a P value of 1. For other land use types, the assignment of P values follows the methods of previous studies [26,27].
HQ
HQ is the basis of ecosystem function and is a key factor affecting biodiversity. The HQ module of the InVEST model was used to evaluate HQ of the target area. This module comprehensively considers multiple factors, such as land-use type, land-use change, ecological processes, and external threats, and then comprehensively evaluates the status and changing trends of HQ, as follows:
where HQij is the HQ of land-use type j in grid unit i; Hj is the habitat suitability of land-use type j; Dij is the degree of habitat degradation of land-use type j in grid unit i; z is the model parameter, k is the half-saturation coefficient, and z and k are set to 2.5 and 0.05, respectively.
EL
EL services are not only related to ecosystem attributes but also affected by factors such as accessibility to beneficiaries and geographical location. Generally, the higher the naturalness of an ecosystem, the better its accessibility, the higher the population density in nearby areas, and the stronger its ability to provide EL services. The specific calculation formula was as follows:
where NPPi is NPP of vegetation in grid unit i; popi is the population density of grid unit i, and roadi is the inverse of the Euclidean distance between grid unit i and the road.
2.3.2. Identification of Trade-Offs and Synergies
Spearman’s correlation coefficient is a nonparametric statistical method used to evaluate whether there is a monotonic relationship between two variables. It is based on the ranks of the data rather than the raw values, which makes it robust to outliers and skewed distributions. Additionally, it can be used with ordinal data and does not require the assumption of normality, making it suitable for various types of research. Correlations between many ecosystem services are complex and typically non-normally distributed. Therefore, Spearman’s correlation analysis was used in the present study to identify trade-offs and synergies between ecosystem services. The correlation coefficient ranges from −1 to 1. Ecosystem services trade-off/synergy can be divided into seven categories: high synergy (0.7 < ρ ≤ 1), moderate synergy (0.3 < ρ ≤ 0.7), slight synergy (0 < ρ ≤ 0.3), independence (ρ = 0), slight trade-off (−0.3 ≤ ρ < 0), moderate trade-off (−0.7 ≤ ρ < 0.3), and high trade-off (−1 ≤ ρ < −0.7).
2.3.3. Space Panel Data Models (SPDMs)
SPDMs combine the advantages of panel data analysis with spatial econometrics to analyze datasets that vary both over time and across spatial units. These models are particularly useful when spatial dependencies or spillovers affect the relationships being studied. In other words, they allow the examination of how variables interact, not only over time but also across geographical locations. Therefore, SPDMs were used in the present study to investigate the spatial interactions and impact differences of each driver on ecosystem services. SPDMs commonly include the spatial lag model (SLM), spatial error model (SEM), and spatial Durbin model (SDM). The specific formulae for SAR, SEM and SDM are as follows:
where yit is the j-th ecosystem service indicator for sample point i at time t, (ui, vi, ti) is the spatiotemporal coordinates of sample point i, ρ is the spatial autoregressive coefficient, measuring the strength of the spatial effect, W is the spatial weight matrix that defines the spatial relationships between individuals, Wyit represents the spatial lag term, Xit is a vector of the explanatory variables, μi is the individual fixed effect (if included in the model), εit is the random error term, λ is the spatial autocorrelation coefficient, vit is the idiosyncratic error term, and δ is the vector of spatial coefficients for the explanatory variables.
The SDM considers both the spatial lag of the dependent variable and the spatial lag of the independent variables, allowing for a more accurate representation of spatial interactions and spillovers. This dual consideration captures both direct and indirect spatial effects, which is crucial for understanding complex spatial relationships. In contrast, the SAR focuses only on the spatial lag of the dependent variable, potentially overlooking important spatial spillovers, while the SEM focuses solely on the spatial error term, missing direct spatial interactions.
The regression coefficient in the SPDM model results was used as the research object to generate the impact coefficient of the trade-off or synergy between ecosystem services. If the impact coefficient was positive, the driving factor promoted synergy between ecosystem services, and vice versa (i.e., it promoted a trade-off between ecosystem services). The calculation formula was as follows:
where αk_mn is the impact coefficient of the k-th driving factor on the trade-off/synergy between ecosystem service m and ecosystem service n; βk_m is the regression coefficient of the k-th driving factor on ecosystem service m, and; βk_n is the regression coefficient of the k-th driving factor on ecosystem service n.
3. Results
3.1. Spatial–Temporal Variations of Ecosystem Services
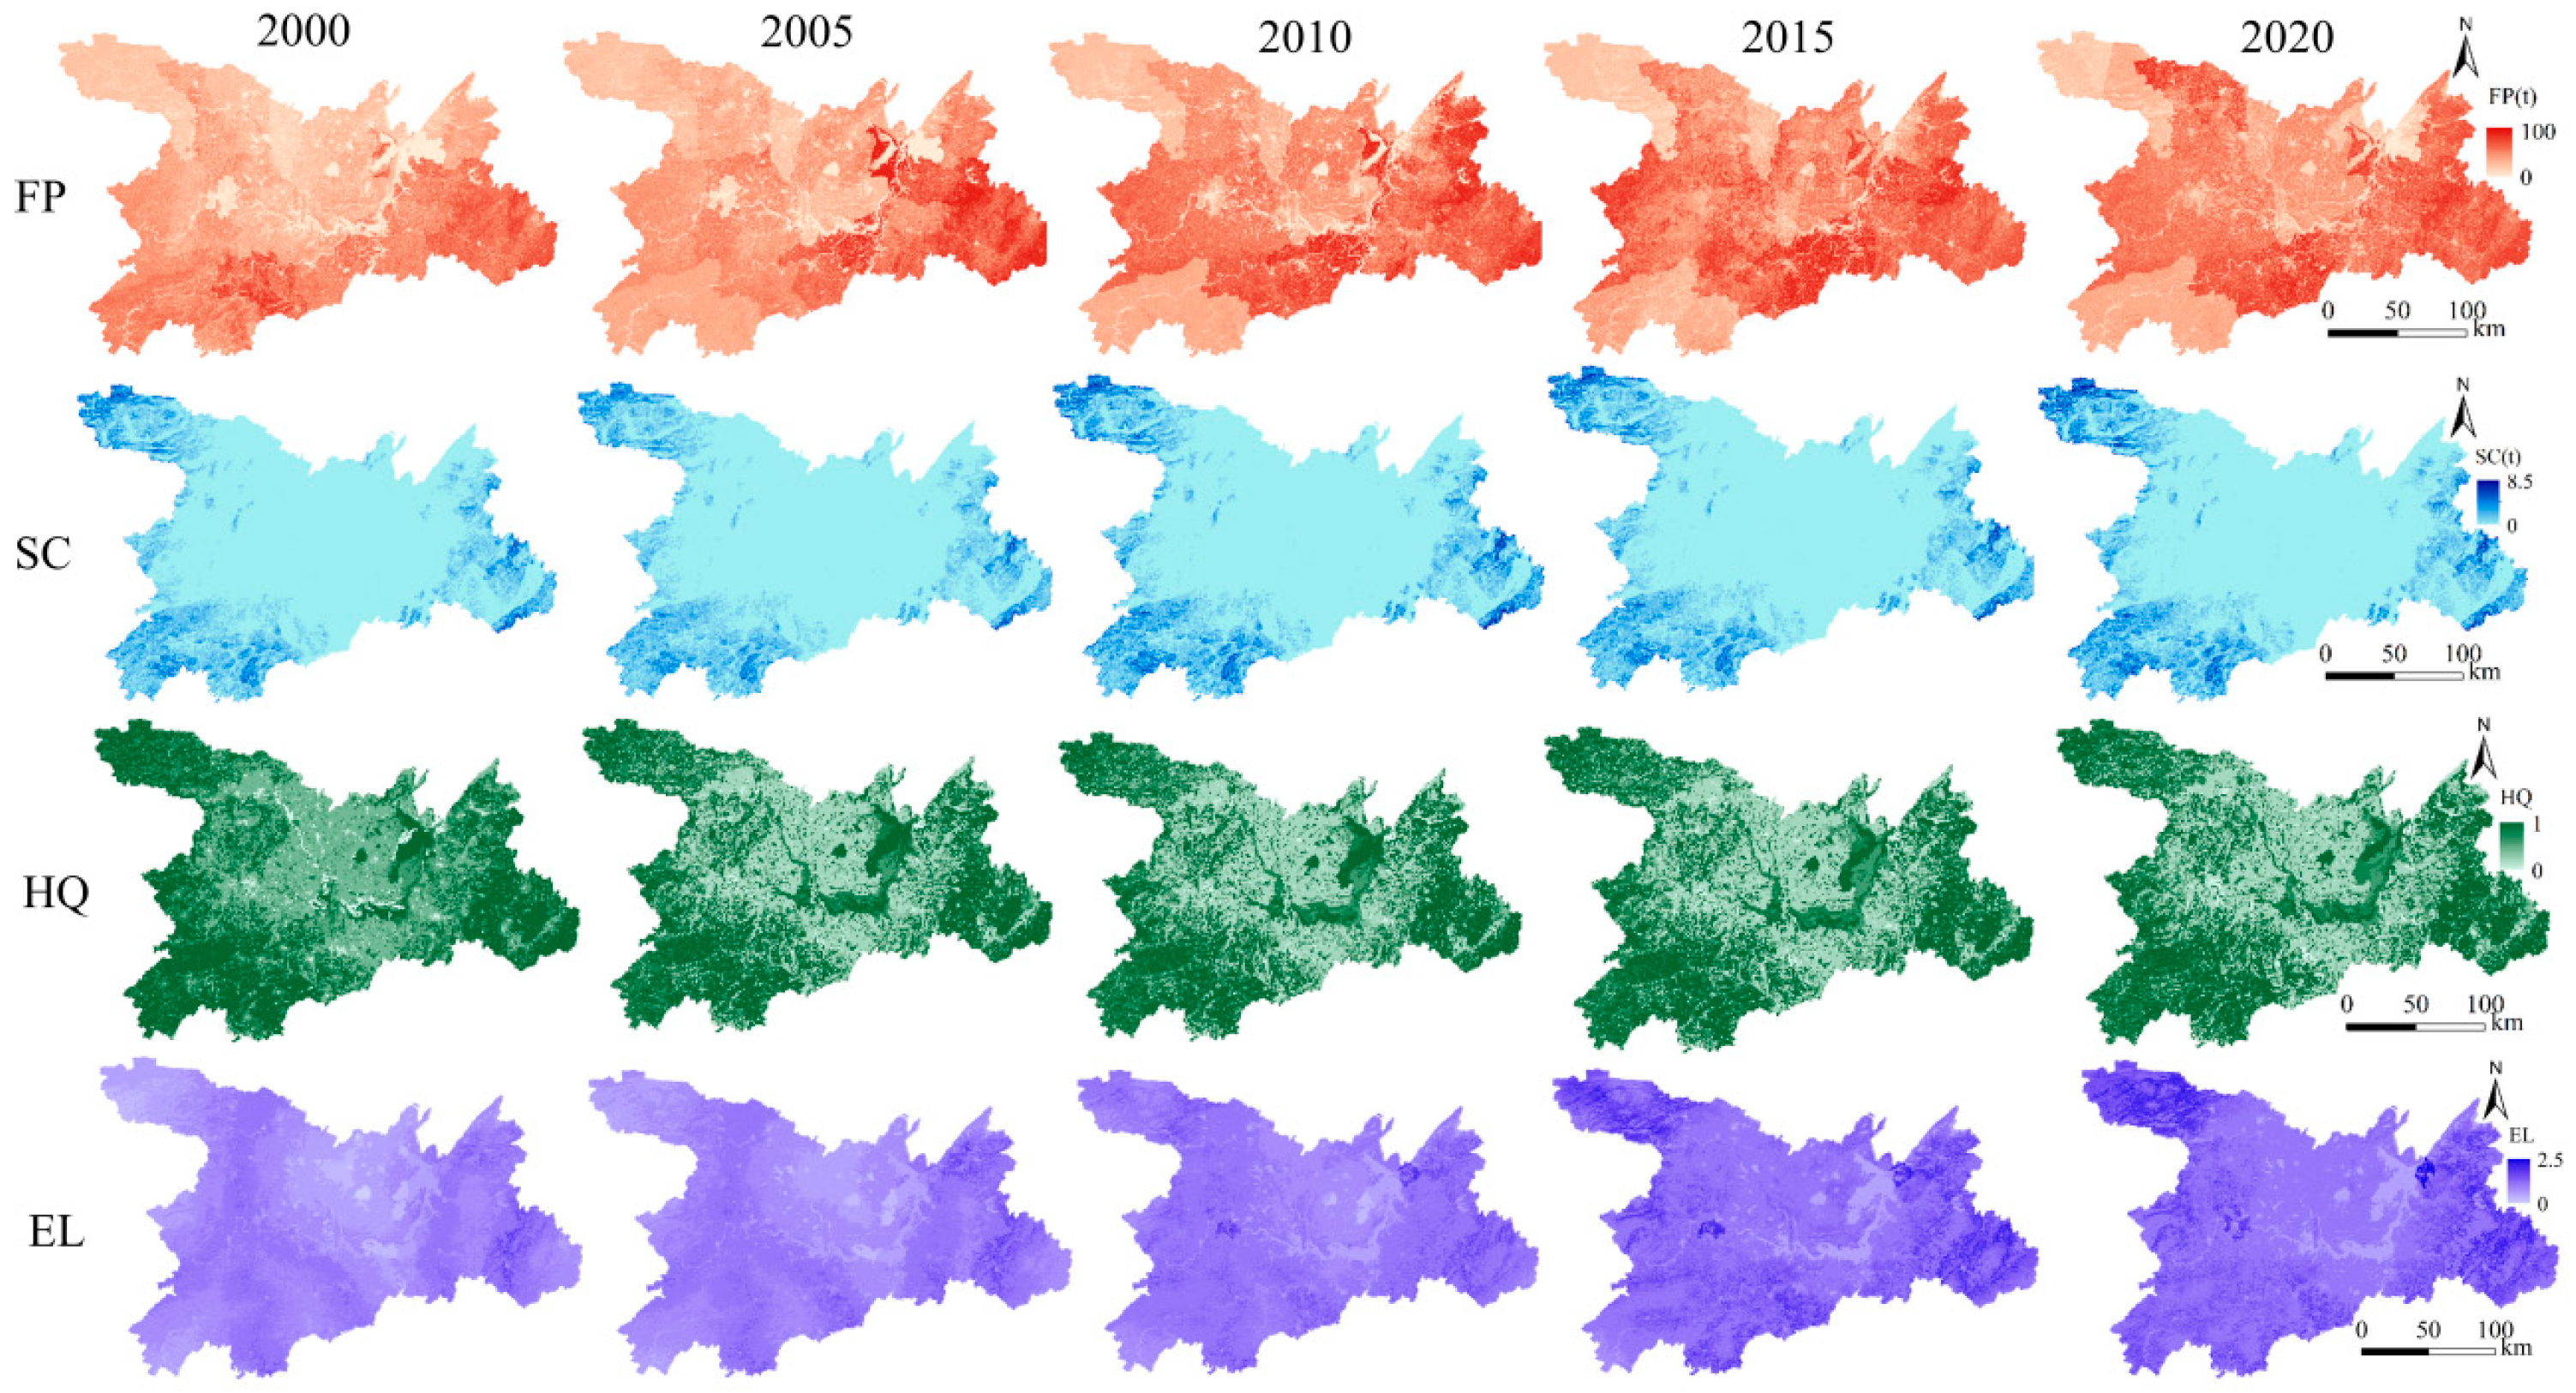
From 2000–2020, FP exhibited consistent growth, primarily concentrated in southeastern areas, whereas HQ declined significantly in peripheral regions due to human activities. The spatial distribution of SC was evident; higher SC values were mainly distributed in the southwest, northwest, and southeast corners of the study area and showed an increasing trend over time. EL increased gradually over time and was concentrated mainly in the northwest and east of the DTLA (Figure 2).
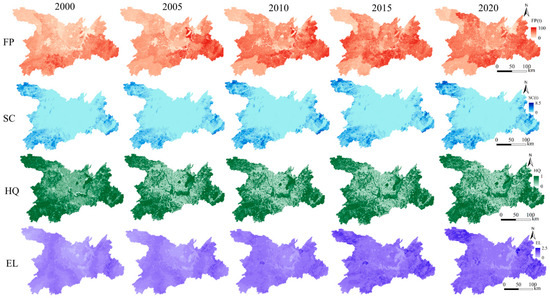
Figure 2.
Temporal and spatial changes in ecosystem services in the Dongting Lake Area (DTLA).
3.2. Temporal Evolution of Ecosystem Service Trade-Offs and Synergies
Correlation analyses were conducted to identify trade-offs or synergies among the four ecosystem services (Table 1). The correlation coefficient between FC and SC displayed synergy before a trade-off from 2000–2020. Synergistic relationships between FP–EL, SC–HQ, and SC–EL decreased over time. The relationships between FP–HQ and HQ–EL were initially synergy, then trade-off, and then synergy again. HQ–EL demonstrated slight synergy in 2000, then switched to a trade-off, and then to synergy again in 2020.

Table 1.
Correlations among ecosystem services in the Dongting Lake Area (p < 0.05).
3.3. Spatial Distribution of Ecosystem Service Trade-Offs and Synergies
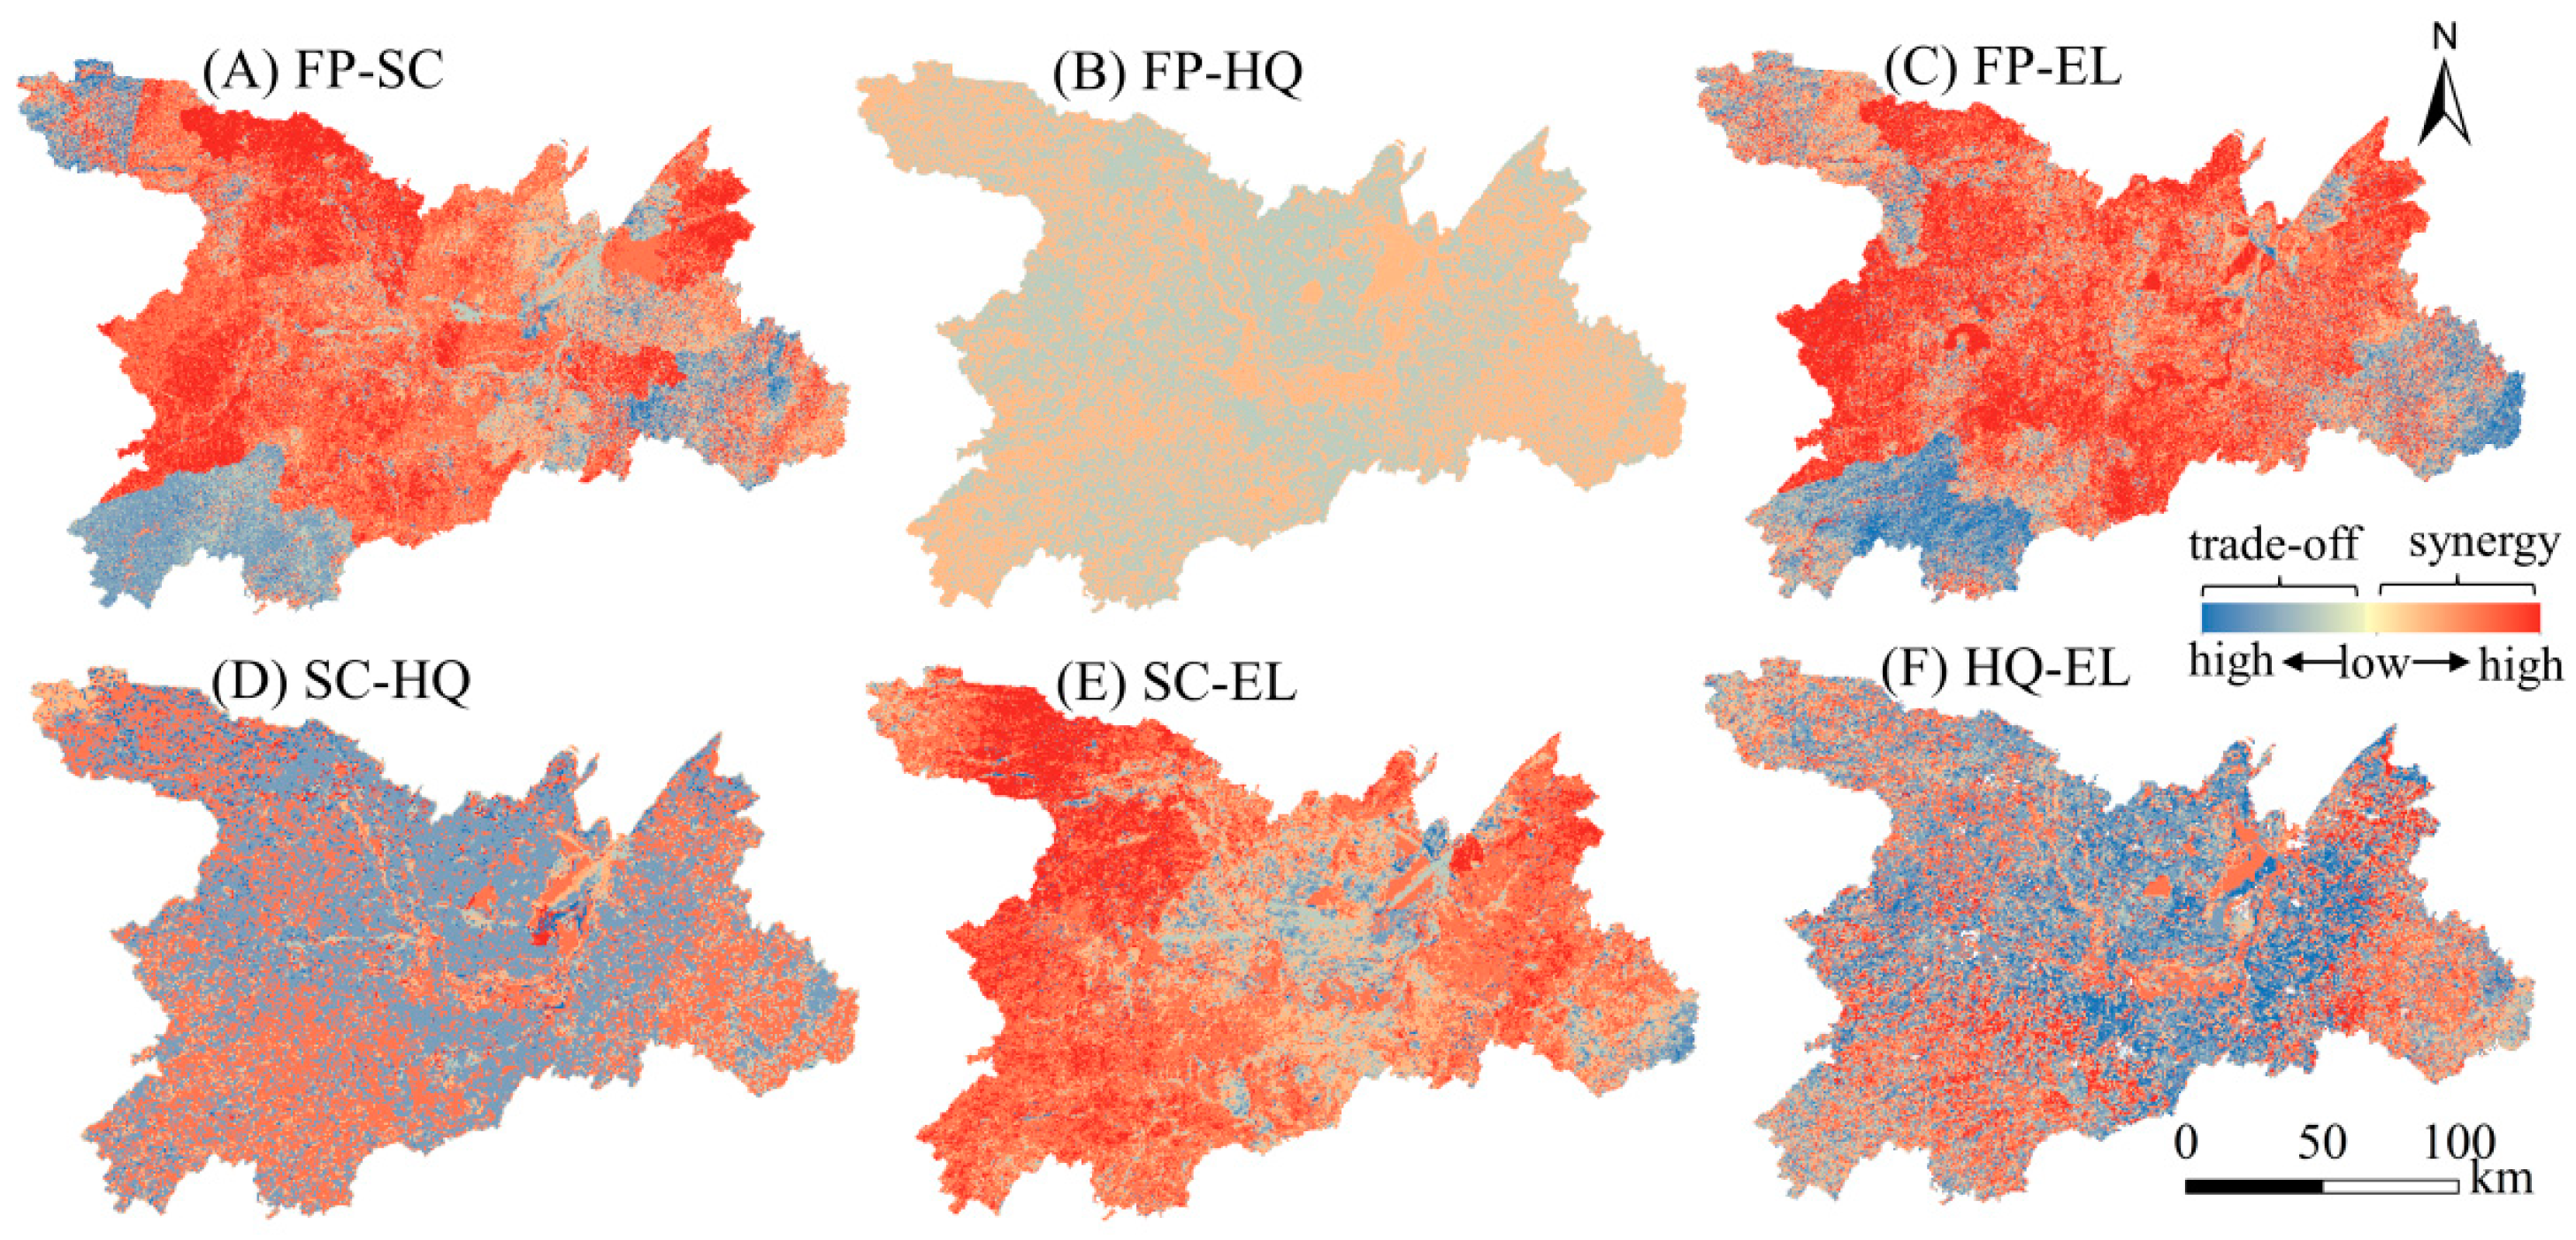
The spatial distributions of trade-offs and synergies between FP–SC and FP–EL were similar, with most regions exhibiting synergistic relationships and trade-offs mainly in the southwest and southeast corners (Figure 3A,C). For FP–HQ, SC–HQ, and HQ–EL, synergies were primarily in Dongting Lake and its periphery, whereas other areas exhibited trade-offs (Figure 3B,D,F). SC–HQ and HQ–EL had stronger degrees of trade-off or synergy compared to FP–HQ. SC–EL showed widespread synergy, especially in the west, with trade-offs mainly in the central region (Figure 3E).

Figure 3.
Spatial changes in trade-offs and synergies among ecosystem services in the Dongting Lake Area (DTLA).
The spatial distribution proportions of synergistic effects of FP–SC, FP–EL, and SC–EL were much larger than those of trade-off effects, and the spatial proportions of synergies were 71%, 70%, and 82%, respectively. The spatial trade-off ratios of FP–HQ, SC–HQ, and HQ–EL exceeded their corresponding spatial synergy ratios, and the trade-off effect space accounted for 56%, 55%, and 57%, respectively (Figure 4).
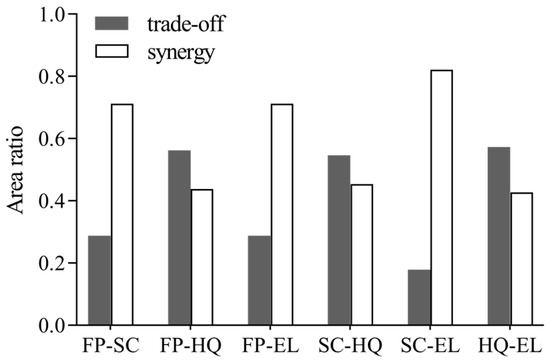
Figure 4.
Area ratio of synergies and trade-offs among ecosystem services in the Dongting Lake Area (DTLA).
3.4. Drivers of Ecosystem Service Trade-Offs and Synergies
LM test statistics were all significant at p < 0.05, indicating that spatial autocorrelation existed for all four ecosystem services, and that it was reasonable to choose a spatial measurement model. The Hausman test showed p < 0.05, indicating that the null hypothesis was rejected, and hence the fixed-effects model was chosen. The spatial–temporal test results were all significant (p < 0.05); that is, the null hypothesis was rejected, and the two-effect model was chosen. The LR test statistics were all significant (p < 0.05), indicating that the SDM model could not be degraded into SAR or SEM models; therefore, it was more effective to choose the dual-fixed-effect SDM for analysis (Table 2).
Table 2.
Tests of model selection for ecosystem services.
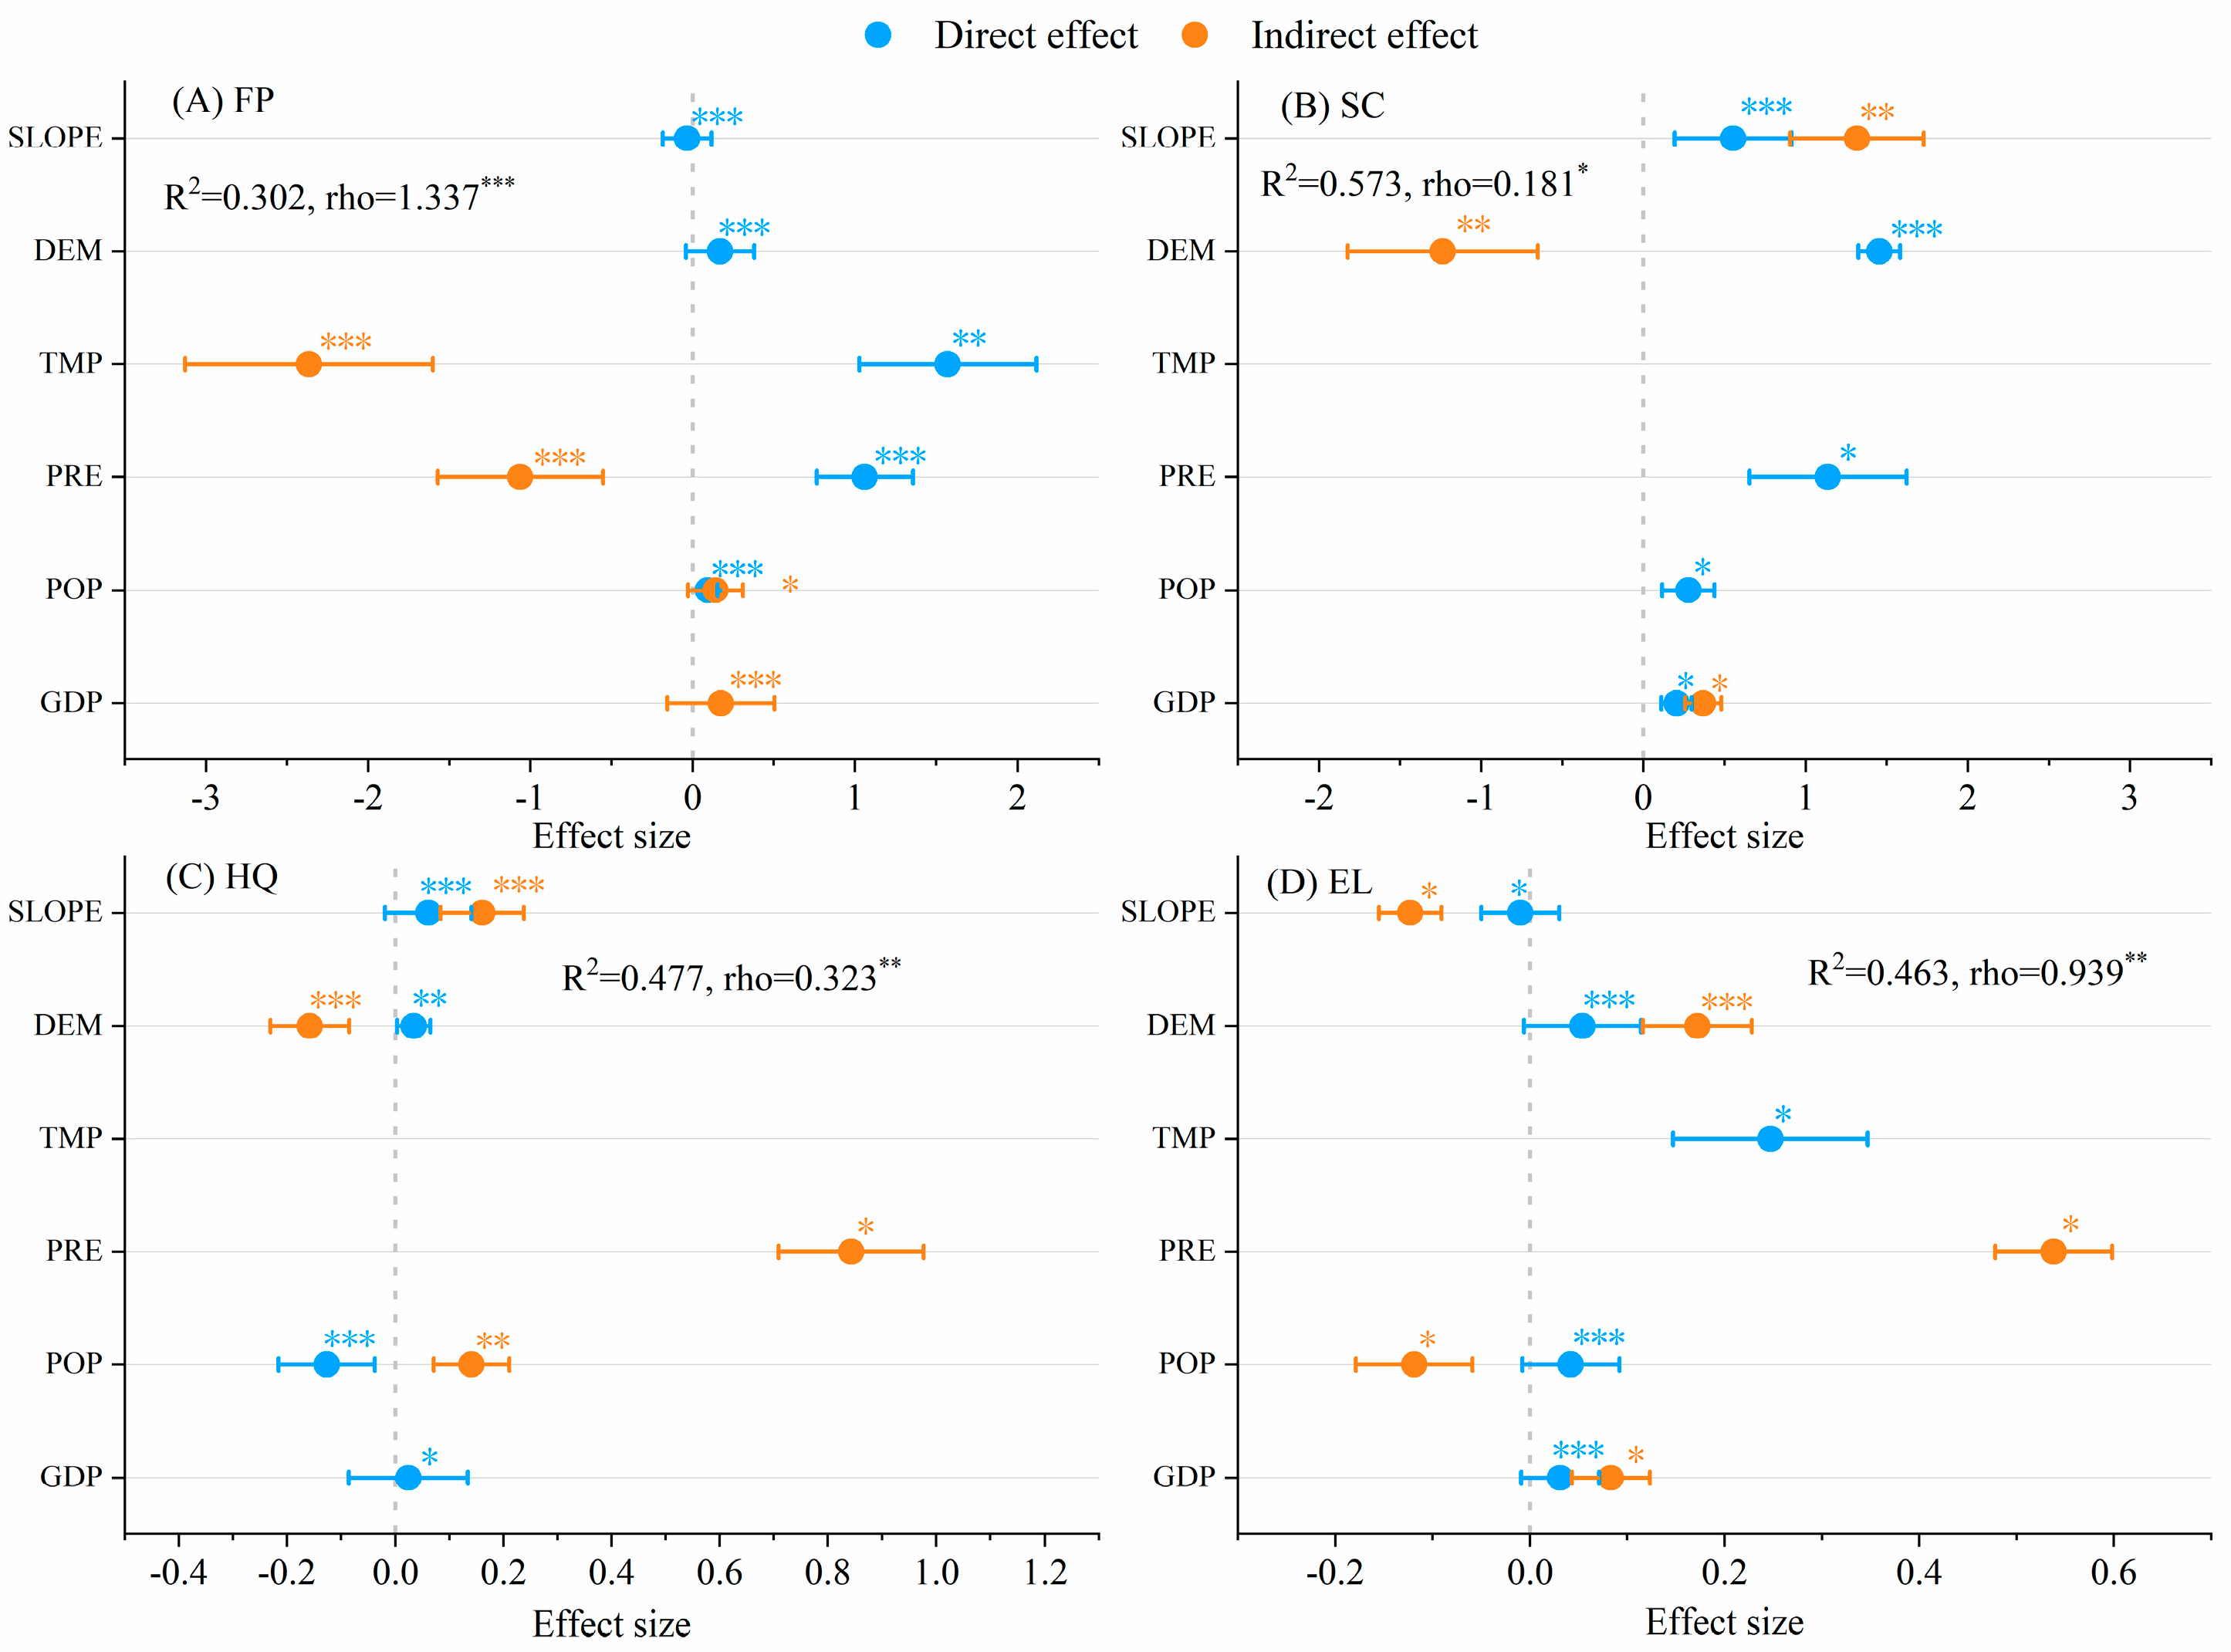
The four ecosystem services were primarily affected by geographical drivers (DEM, slope [SLOPE]), climate drivers (temperature [TMP] and precipitation [PRE]), and socio-economic drivers (population [POP] and gross domestic product [GDP]). The impact of climatic drivers on FP was more significant than that of other ecosystem services, regardless of direct or indirect effects. Specifically, TMP, PRE, DEM, and POP had direct positive effects on FP, whereas SLOPE had negative effects. TMP and PRE had indirect negative effects on FP, whereas POP and GDP had positive effects (Figure 5A). Effects of geographical drivers on SC were more significant than those of other drivers. Specifically, PRE, geography, and socio-economic factors had direct positive effects, SLOPE and GDP had positive indirect effects, and DEM had negative indirect effects on SC (Figure 5B). Concerning HQ, DEM, SLOPE, and GDP had direct positive effects and POP had negative effects. SLOPE, PRE, and POP had positive indirect effects on HQ and DEM had negative effects (Figure 5C). DEM, TMP, POP, and GDP had direct positive effects on EL and SLOPE had negative effects. DEM, PRE, and GDP had positive indirect effects on EL and POP and SLOPE had negative effects (Figure 5D).

Figure 5.
Direct and indirect effects of biophysical condition, climate, and human factors on ecosystem services in the Dongting Lake Area (DTLA), based on spatial panel modeling (*** p < 0.001, ** p < 0.01, * p < 0.05).
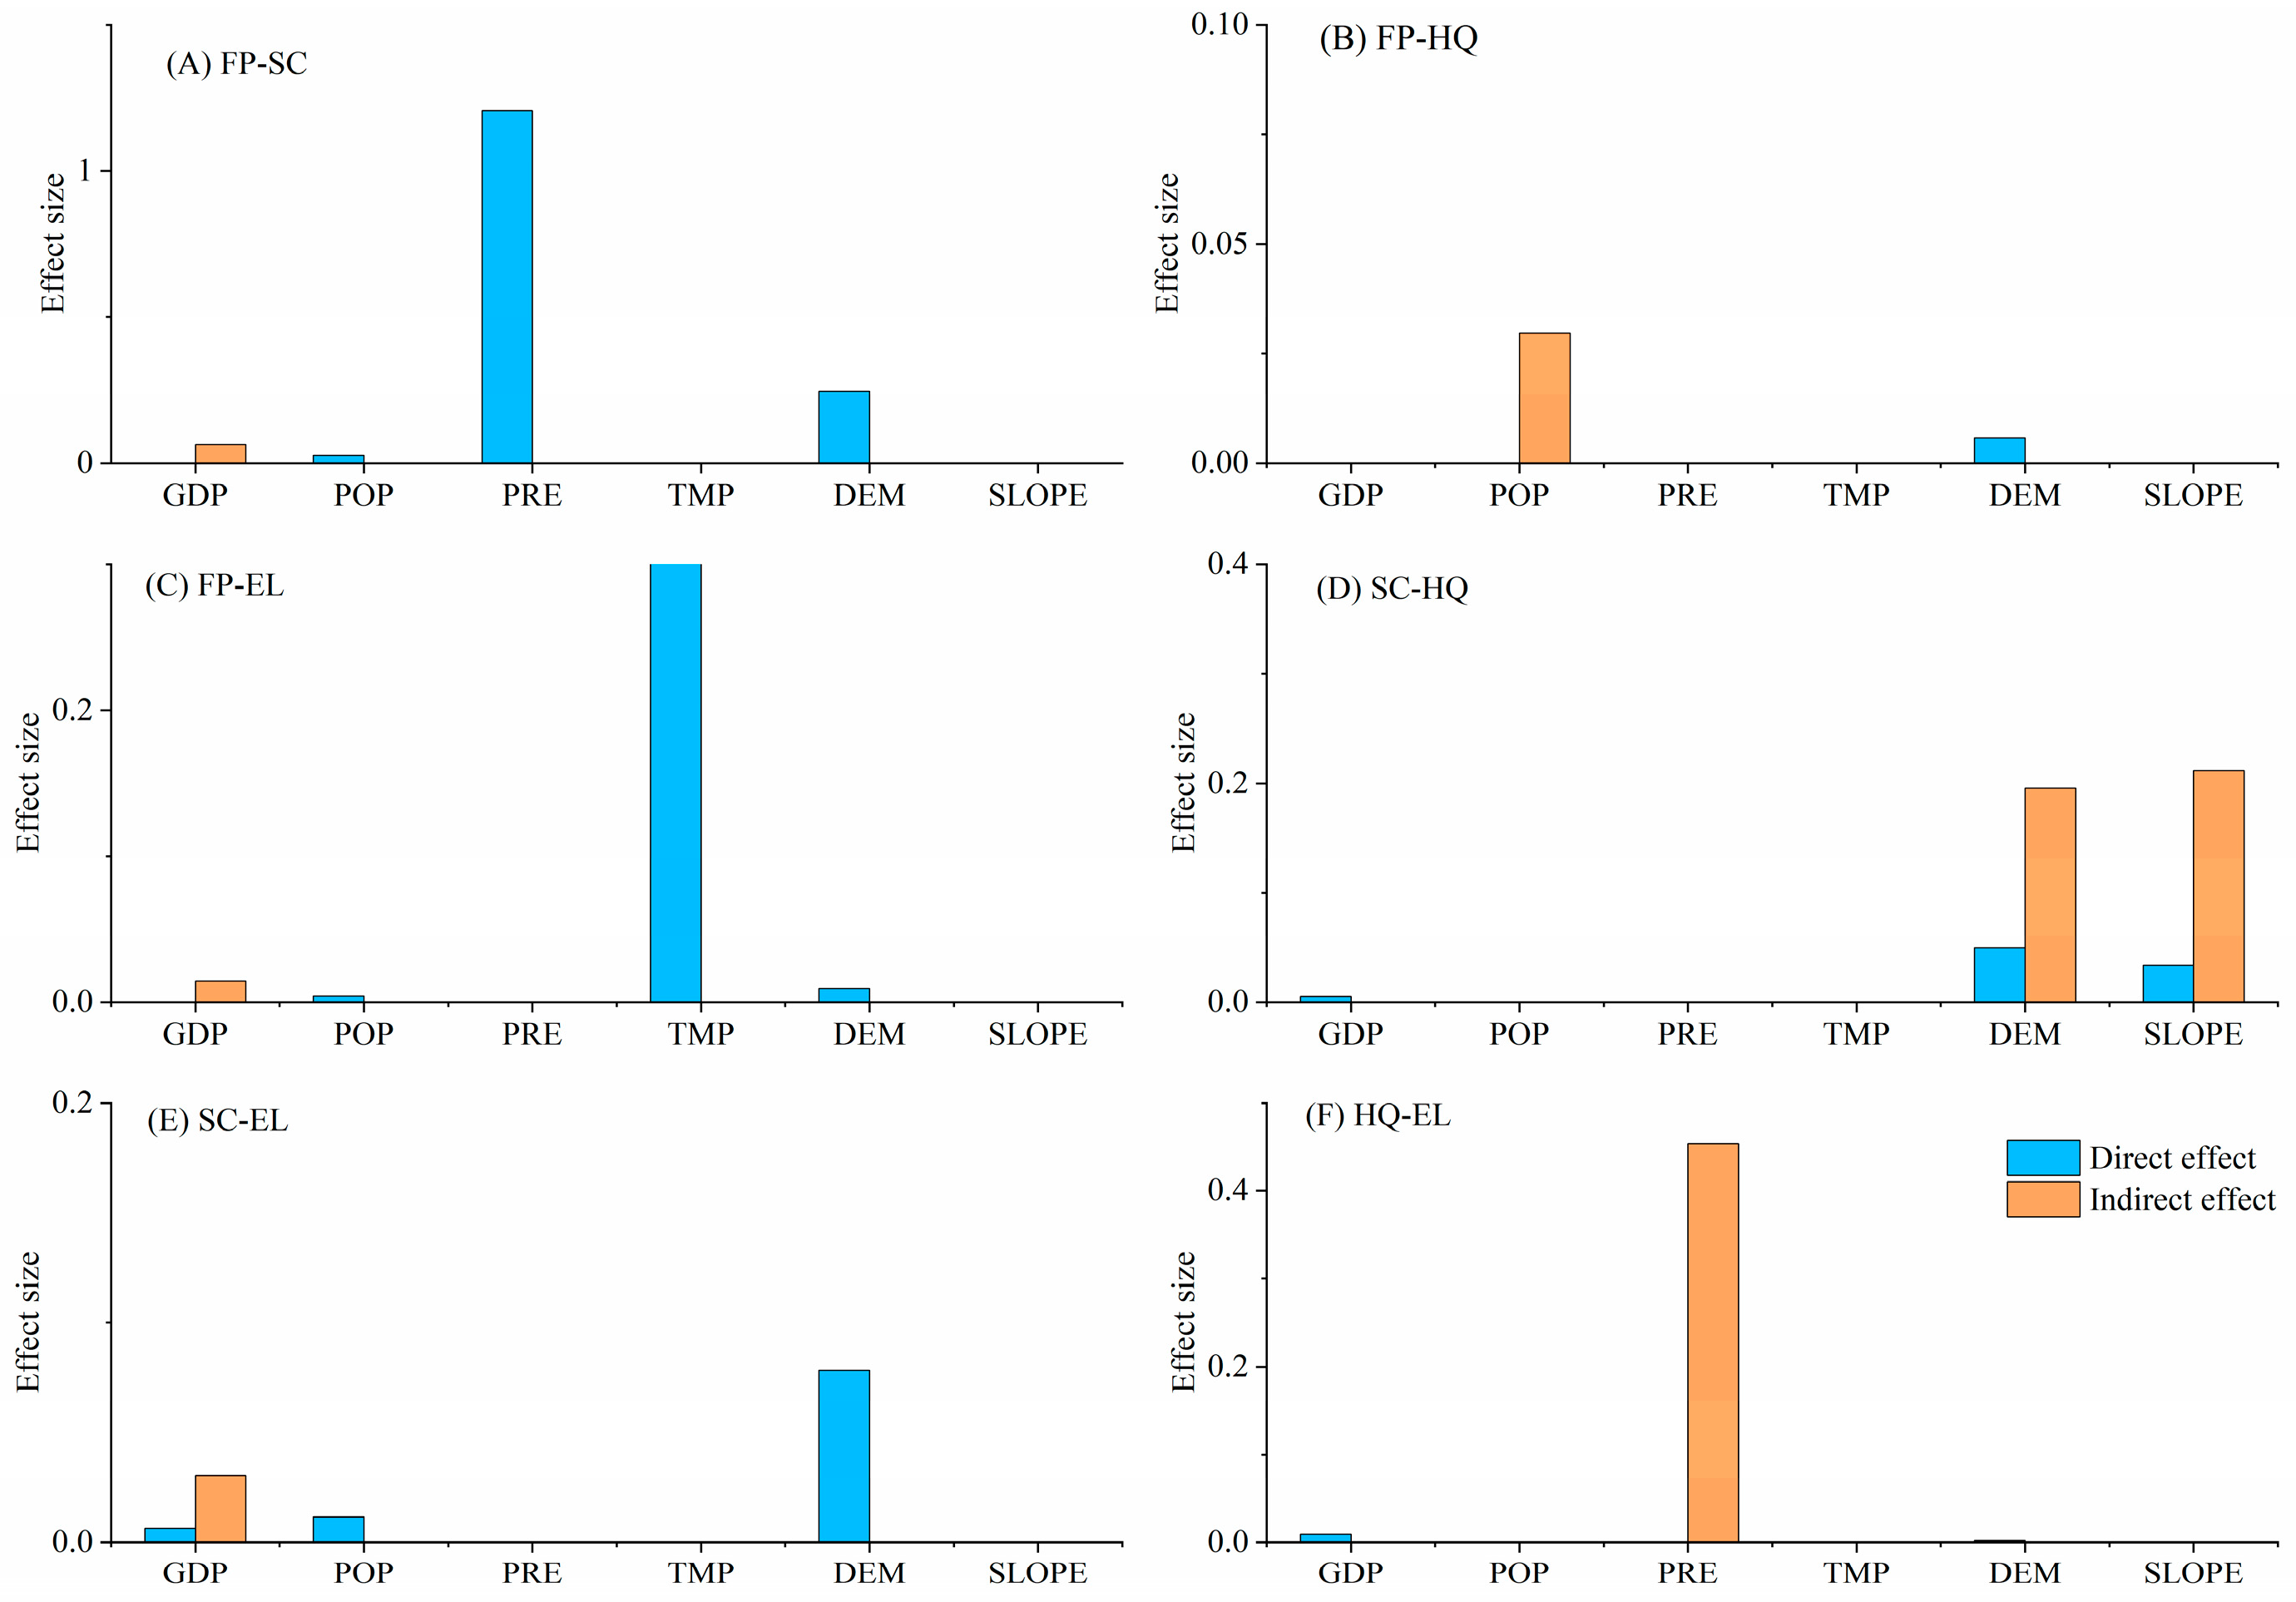
SLOPE directly facilitated the trade-off between FP–SC (Figure 6A). PRE had an indirect negative trade-off effect on FP–HQ and FP–EL (Figure 6B,C). POP directly or indirectly drove evolution of FP–HQ, FP–EL, and SC–HQ in a trade-off manner (Figure 6B–D). DEM and SLOPE (i.e., two geographical forces) primarily impacted the SC–EL trade-off; that is, increased DEM and SLOPE directly exacerbated the SC–EL trade-off (Figure 6E). Increases in DEM, SLOPE, and POP indirectly aggravated the HQ–EL trade-off, and POP expansion directly intensified the HQ–EL trade-off (Figure 6F).

Figure 6.
Direct and indirect effects of biophysical condition, climate, and human factors on trade-off of ecosystem services in the Dongting Lake Area (DTLA), based on spatial panel modeling.
PRE, DEM, and POP had direct positive synergistic effects on promoting FP–SC (Figure 7A). GDP indirectly facilitated synergy between FP–SC, FP–EL, and SC–EL (Figure 7A,C,E). POP expansion indirectly promoted FP–HQ synergy, whereas DEM was a direct factor (Figure 7B). TMP, DEM, and POP directly facilitated FP–EL synergy (Figure 7C). DEM and SLOPE directly or indirectly drove SC–HQ synergy (Figure 7D). GDP, POP, and DEM directly facilitated SC–EL synergy (Figure 7E). Increased PRE indirectly facilitated HQ–EL synergy, whereas GDP directly facilitated it (Figure 7F).
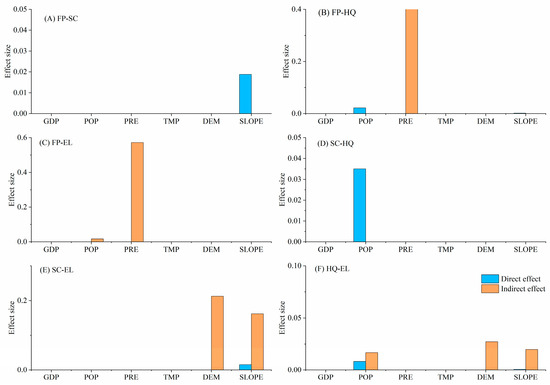
Figure 7.
Direct and indirect effects of biophysical condition, climate, and human factors on synergy of ecosystem services in the Dongting Lake Area (DTLA), based on spatial panel modeling.
4. Discussion
4.1. Ecosystem Services Changes During 2000–2020
High-FP areas were concentrated around Dongting Lake (Figure 2). Studies have indicated that lakes are important food sources [28]. Although Dongting Lake does not directly produce crops, its water is vital for surrounding areas, which rely directly on the freshwater supply for irrigation [29]. In addition, since 2001, urbanization of the area around Dongting Lake has accelerated, particularly in terms of population and economic urbanization [30,31]. In turn, ecosystem supply services (particularly FP services) in the area around Dongting Lake have tended to increase to cope with the challenges of the population explosion [32,33]. This aligns with our finding that FP increased from 2000–2020.
High-SC areas were primarily located in the southwest, northwest, and southeast corners of the DTLA, characterized by extensive vegetation coverage, resulting in strong SC capacities [34]. Conversely, low-SC regions were predominantly situated in construction land concentration zones and sparse vegetation zones of the DTLA [35]. Furthermore, China launched and implemented a series of ecological policies and measures in the DTLA, such as Returning Farmland to Forests, Returning Farmland to Lakes, and ecological restoration measures, which have made significant contributions to protecting ecological land and promoting environmental recovery [36,37]. Consequently, the area of ecological land, such as forests and grasslands, has increased over time and, in turn, SC has increased [11].
High-HQ regions, characterized by extensive biodiversity and relatively less human interference, were primarily in the Dongting Lake wetland and DTLA periphery. Low-HQ areas were largely situated around Dongting Lake with intensive human activities, resulting in relatively low HQ [38]. Our results suggested that the HQ of Dongting Lake declined during the study period, which is supported by other studies [39]. Water quality and biodiversity have declined in Dongting Lake owing to climate change, nutrient inputs, and human interference, leading to a decline in HQ [40]. However, the decline in the HQ of the Dongting Lake periphery may have been related to the continued increase in population size and rapid urbanization during this period, resulting in increased environmental pollution.
EL was mainly concentrated in the northwest and east of the DTLA, with intensive convenient transportation (Figure 2). Ecosystem cultural services were derived from human subjective initiatives [41]. The more convenient the transportation, the higher the population density, the higher the income of residents, and the higher the demand for cultural services [42]. Moreover, with rapid development of the social economy and implementation of ecological protection strategies, cultural services have increased significantly in recent years [43]. This is similar to our finding that EL gradually increased during the study period (Figure 2).
4.2. Analysis of Trade-Offs and Synergies Among Ecosystem Services
Trade-off relationships between FP–SC primarily existed in the southwest, northwest, and southeast corners of the DTLA (Figure 3A), which are woodland areas with extensive vegetation coverage. Forests or grasslands in the area may have been converted into farmlands to increase FP (Figure 5A); although this can increase FP in the short term, it leads to increased soil erosion and reduced soil retention in the long term [39]. In addition, FP–SC showed synergy and a trade-off during the study period (Table 1). In early stages of agricultural production, implementation of conservation tillage (e.g., minimum tillage) to protect the soil structure and reduce soil erosion was beneficial to both FP and SC, and thus they exhibited synergy. With the rapid population increase and market demand, the pressure on agricultural production has increased (Figure 5A). In turn, cultivated land overuse and arable land area expansion increase FP, which may lead to soil nutrient depletion and structural damage, increasing the soil erosion risk [23]. Therefore, a trade-off relationship between FP–SC was formed.
Trade-off effects of FP–HQ and HQ–EL were predominantly situated around Dongting Lake, whereas FP–EL showed a synergistic relationship in this region (Figure 3B,C,F). Previous studies have shown that, since 2001, the urbanization process of the area around Dongting Lake has accelerated, particularly population and economic urbanization [44]. During periods of rapid urbanization, the area around Dongting Lake enhanced ecosystem services (e.g., FP services) and ecosystem cultural services (such as recreational benefits) by sacrificing the natural environment, particularly lakes or forests, to cope with the challenges of rapid population growth and the growing cultural needs of people [45]. Subsequently, with the slowdown of development, natural resource degradation, and improved public awareness, effective ecological protection measures were implemented, which brought positive ecological effects. For example, Hunan Province implemented the Three-Year Action Plan for the Ecological and Environmental Improvement of Dongting Lake in 2018. During the study period, the relationships between FP–HQ and HQ–EL showed a trend of synergy, then trade-off, and finally synergy. In addition, the synergistic effects between FP–HQ and HQ–EL were mainly concentrated in the east and west of the DTLA and Dongting Lake, indicating that these areas had the highest FP supply efficiency, a healthy ecological environment, and could meet entertainment needs. Therefore, the government should maintain ecological protection in these areas and promote continuous FP.
Areas with SC–HQ synergy were primarily located in Dongting Lake and the DTLA periphery, characterized by high HQ (Figure 2 and Figure 3D). High-HQ areas tend to have extensive vegetation cover, which enhances SC by immobilizing soil and reducing soil erosion [43]. Furthermore, diverse plant communities can improve soil structure, increase soil organic matter content, and contribute to soil water retention and nutrient cycling [46]. Conversely, SC–HQ trade-off regions were predominantly situated in the construction land concentration zones and residential areas around Dongting Lake (Figure 3D). Agricultural expansion activities as a result of population expansion have increased the cultivated land area, which may have improved SC (because planting crops on cultivated land helps prevent soil erosion) while simultaneously destroying pre-existing habitats, reducing biodiversity, and reducing HQ [47]. In addition, global warming and frequent human activities reduce vegetation cover and damage soil structure, which increase the risk of soil erosion, habitat fragmentation, and pollution [18], thereby weakening SC–HQ synergy (Table 1).
SC–EL trade-off relationships were mainly concentrated in the central part of the DTLA, with moderate or slight trade-offs (Figure 3E). SC in the middle of the DTLA was low (Figure 2). However, the Dongting Lake wetland landscape and birdwatching festivals have attracted a large number of tourists. To enhance the EL experience, infrastructure (e.g., roads and parking lots) may be built [48]. Construction of EL facilities often requires removal of some vegetation, which has led to vegetation cover reduction and thus reduced SC [49]. The region with SC–EL synergy was distributed in the DTLA periphery (Figure 3E), which was either woodland or grassland with access to convenient transportation. Extensive vegetation coverage of woodlands and grasslands can effectively improve SC and provide aesthetically pleasing natural landscapes for ecological recreational activities. Furthermore, several railways pass through this area to facilitate EL services.
4.3. Spatiotemporal Drivers of Ecosystem Service Trade-Off/Synergy
Topographic features, including DEM and SLOPE, affected the distribution of land use and ecological services and promoted FP–HQ, FP–EL, and SC–EL synergies (Figure 7B,C,E) while aggravating trade-offs among different services [50]. For example, HQ was highest in high-elevation areas of the DTLA (Figure 2). However, steep terrain increased soil erosion, decreased SC ability, and affected EL (Figure 6E,F), resulting in intensified SC–EL and HQ–EL trade-offs (Figure 6E,F). In addition, steeper slopes were more prone to soil erosion, which affected FP efficiency and increased the difficulty of SC [51]; thus, the FP–SC trade-off increased with increases in slope (Figure 6A).
Moderate precipitation contributed to improvements in food yield, SC capacity, HQ, and EL experiences, thus strengthening FP–SC and HQ–EL synergies (Figure 7A,F). However, excessive or insufficient precipitation may lead to increased soil erosion, reduced HQ, and limited development of EL activities [45], thus promoting FP–HQ and FP–EL trade-offs (Figure 6B,C).
More funds were invested in agricultural technologies and sustainable agricultural implementation with GDP growth, which helped improve FP efficiency and reduced negative effects on soils and ecosystems (Figure 7A,C), thereby indirectly promoting FP–SC and FP–EL synergies. In addition, economic growth brought more funds for ecological conservation projects and construction of EL facilities, which contributed to improvements in HQ and SC capacity while providing a high-quality natural environment for ecological recreation [52], thus strengthening the synergies between HQ–EL and SC–EL (Figure 7E,F).
The demand for FP and EL increased as population density increased. To meet these needs, agricultural production may adopt more efficient farming techniques and sustainable land management methods to increase FP while providing high-quality EL services [46], which would promote FP–SC and SC–EL synergies to a certain extent (Figure 7A,E). However, this phenomenon has also led to increased competition for land resources, which has facilitated trade-offs between different services [53] and directly exacerbated conflicts between FP–HQ, SC–HQ, and HQ–EL (Figure 6B,D,F).
4.4. Implications for Ecosystem Services Management
Our results provide the spatial–temporal distribution of the four ecosystem service relationships and the influencing factors. Thus, policymakers can develop targeted measures to mitigate conflicts between different ecosystem services and ensure a sustainable supply of ecosystem services [12]. Trade-off effects of FP–HQ, SC–HQ, and HQ–EL were evident near Dongting Lake. These areas can be divided into ecological unbalance areas that focus on balancing the relationships between different ecosystem services. For example, to alleviate FP–HQ trade-offs, reforestation programs should be implemented and agricultural activities on steep slopes should be restricted to enhance soil conservation. To alleviate FP–SC trade-offs, sustainable agricultural practices such as crop rotation and reduced tillage should be promoted, and the development of ecological land facilities to enhance soil fertility and reduce erosion should be reinforced. Furthermore, through participatory and adaptive landscape governance, human resources can be transformed to improve ecosystem structure and function, and ecotourism could be developed to provide high-quality EL experiences [54].
Dongting Lake is an area with high HQ and FP–HQ, SC–HQ, and HQ–EL synergies, which can be classified as HQ synergy areas. In these management areas, measures have been taken to protect biodiversity, limit activities that may negatively affect habitats, and promote development of FP, SC, and EL. For example, the scope of existing nature reserves in the Dongting Lake wetland could be expanded, and human activities that potentially threaten sensitive habitats, such as land reclamation and overfishing, could be restricted. Additionally, native plants could be planted in degraded wetland areas to restore riparian vegetation zones, thereby improving water quality and restoring fish habitats. Furthermore, given the extensive agricultural land surrounding Dongting Lake, promotion of eco-friendly agricultural technologies, such as rice–fish co-culture systems, which can reduce the use of fertilizers and pesticides and minimize their impact on water quality, is recommended. These measures focus on protecting habitat quality and biodiversity, and synergistically developing multiple ecosystem service functions [43].
The northwest and southwest corners of the DTLA are high-SC areas and should be classified as soil conservation areas. Strict land management measures can be implemented in key soil conservation areas, such as planting shelterbelts, implementing sustainable agriculture, and implementing soil and water conservation projects, with a focus on protecting soil and water sources [55]. The southeastern corner of the DTLA had a higher EL and can be designated as an EL area. Considering the FP–SC trade-off in EL area, agricultural activities could be restricted and ecological leisure facilities promoted. Ensuring agricultural sustainability in the southeastern regions requires balancing FP growth with soil conservation initiatives. Additionally, tourist numbers should be restricted, ecological corridors planned, and natural landscapes protected to enhance the ecological functions of the regional landscape [15].
4.5. Limitations and Prospects
While the 20-year dataset provides valuable insights into the ecosystem service interactions and their spatiotemporal characteristics in the Dongting Lake Area, it may not fully capture long-term ecological and climatic variability. Future research should consider longer time series data to better understand the long-term trends and potential impacts of climate change on ecosystem services. In addition, the present study shows that the trade-offs and synergies among services have obvious temporal and spatial heterogeneity, and it is necessary to conduct scale effects research on the relationships among ecosystem services in future.
5. Conclusions
In the present study, the four key ES dynamics, comprising FP, SC, HQ, and EL, in DTLA were assessed. The trade-off/synergy relationships and the driving factors within the relationships in each of the ES pairs were identified. On that basis, the DTLA was divided into four zones. Our research provides a meaningful reference for ecosystem management in DTLA. The key findings are as follows:
- (1)
- FP exhibited consistent growth, primarily concentrated in southeastern areas, whereas HQ declined significantly in peripheral regions due to human activities. The spatial distribution of SC was evident, with higher values mainly in the southwest, northwest, and southeast corners of the study area and showing an increasing trend over time. EL increased gradually over time, primarily concentrated in the northwest and east of the DTLA.
- (2)
- Temporally, FC–SC, FP–HQ and HQ–EL displayed a synergy before a trade-off during 2000–2020. Spatially, the trade-off ratios of FP–HQ, SC–HQ, and HQ–EL exceeded synergy ratios, and trade-off areas of FP–HQ, SC–HQ, and HQ–EL existed around Dongting Lake. The spatial synergy ratios of FP–SC, FP–EL, and SC–EL exceeded trade-off ratios. The trade-off area between FP–SC and FP–EL was predominantly in the southwest and southeast corner, and the SC–EL trade-off area was concentrated in the central region.
- (3)
- The drivers that influence the distribution and changes in ES trade-offs/synergies are different. The DEM and slope facilitated the FP–HQ, FP–EL and SC–EL synergies, and intensified the FP–SC, SC–EL, and HQ–EL trade-offs. Precipitation strengthened the FP–SC and HQ–EL synergies, while exacerbating FP–HQ and FP–EL trade-offs. GDP indirectly promoted FP–SC and FP–EL synergies. Population density promoted FP–SC and SC–EL synergies and directly aggravated FP–HQ, SC–HQ, and HQ–EL trade-offs.
- (4)
- The DTLA was divided into ecological imbalance, SC, HQ synergy, and EL areas. Near Dongting Lake, there are ecological imbalance areas. Dongting Lake is the HQ synergy area. The northwest and southwest corners of DTLA are soil conservation areas. The southeastern corner of DTLA is an EL area. Targeted ecosystem management measures should be implemented in each zone to address ecological issues, promote sustainable development, and achieve harmonious coexistence between humans and nature.
Author Contributions
Y.H.: Conceptualization, Methodology, Writing—original draft. X.C.: Methodology, Writing—review and editing. L.Z.: Investigation, Data collection. All authors have read and agreed to the published version of the manuscript.
Funding
This work was supported by the Scientific Research Project of Hunan Provincial Department of Education (23B0641), the Hunan Province Social Science Fund Project (23YBQ092), the National Natural Science Foundation of China (32471657), and Hunan Province Natural Science Fund Project (2024JJ6214).
Institutional Review Board Statement
Not applicable.
Informed Consent Statement
Not applicable.
Data Availability Statement
The raw data supporting the conclusions of this article will be made available by the authors on request.
Conflicts of Interest
The authors declare that they have no known competing financial interests or personal relationships that could have appeared to influence the work reported in this paper.
Abbreviations
DTLA—Dongting Lake Area; FP—food production; SC—soil conservation; HQ—habitat quality; EL—ecological leisure.
References
- Bennett, E.M.; Peterson, G.D.; Gordon, L.J. Understanding relationships among multiple ecosystem services. Ecol. Lett. 2009, 12, 1394–1404. [Google Scholar] [CrossRef] [PubMed]
- Chaplin-Kramer, R.; Sharp, R.P.; Weil, C.; Bennett, E.M.; Pascual, U.; Arkema, K.K.; Brauman, K.A.; Bryant, B.P.; Guerry, A.D.; Haddad, N.M.; et al. Global modeling of nature’s contributions to people. Science 2019, 366, 255–258. [Google Scholar] [CrossRef]
- Zhang, C.; Su, B.; Beckmann, M.; Volk, M. Emergy-based evaluation of ecosystem services: Progress and perspectives. Renew. Sust. Energ. Rev. 2024, 192, 114201. [Google Scholar] [CrossRef]
- Daw, T.; Brown, K.; Rosendo, S.; Pomeroy, R. Applying the ecosystem services concept to poverty alleviation: The need to disaggregate human well-being. Environ. Conserv. 2011, 38, 370–379. [Google Scholar] [CrossRef]
- Peng, Z.; Wu, H.; Ding, M.; Li, M.; Huang, X.; Zheng, R.; Xu, L. Ecological compensation standard of a water-receiving area in an inter-basin water diversion based on ecosystem service value and public willingness: A case study of Beijing. Sustainability 2021, 13, 5236. [Google Scholar] [CrossRef]
- Howe, C.; Suich, H.; Vira, B.; Mace, G.M. Creating win-wins from trade-offs? Ecosystem services for human well-being: A meta-analysis of ecosystem service trade-offs and synergies in the real world. Glob. Environ. Change 2014, 28, 263–275. [Google Scholar] [CrossRef]
- Mouchet, M.A.; Lamarque, P.; Martín-López, B.; Crouzat, E.; Gos, P.; Byczek, C.; Lavorel, S. An interdisciplinary methodological guide for quantifying associations between ecosystem services. Glob. Environ. Change 2014, 28, 298–308. [Google Scholar] [CrossRef]
- Plantinga, A.J.; Millage, K.; O’Reilly, E.; Bieri, T.; Holmes, N.; Wilson, J.; Bradley, D. How to pay for ecosystem services Andrew. Front. Ecol. Environ. 2024, 22, e2680. [Google Scholar] [CrossRef]
- Liu, C.; Yang, M. An empirical analysis of dynamic changes in ecological sustainability and its relationship with urbanization in a coastal city: The case of Xiamen in China. J. Clean. Prod. 2020, 256, 120482. [Google Scholar] [CrossRef]
- Su, B.; Liu, M. An ecosystem service trade-off management framework based on key ecosystem services. Ecol. Indic. 2023, 154, 110894. [Google Scholar] [CrossRef]
- Dai, E.; Zhao, Z.; Jia, L.; Jiang, X. Contribution of ecosystem services improvement on achieving Sustainable development Goals under ecological engineering projects on the Qinghai-Tibet Plateau. Ecol. Eng. 2024, 199, 107146. [Google Scholar] [CrossRef]
- Primmer, E.; Furman, E. How have measuring, mapping and valuation enhanced governance of ecosystem services? Ecosyst. Serv. 2024, 67, 101612. [Google Scholar] [CrossRef]
- Huang, Y.; Chen, X.S.; Zhu, L.L. Differential responses of ecosystem stability to climatic and anthropogenic factors in connected and isolated lake basins on the Yangtze River. J. Environ. Manag. 2024, 359, 121014. [Google Scholar] [CrossRef]
- Yuan, L.G.; Geng, M.M.; Li, F.; Xie, Y.; Tian, T.; Chen, Q. Spatiotemporal characteristics and drivers of ecosystem service interactions in the Dongting Lake Basin. Sci. Total Environ. 2024, 926, 172012. [Google Scholar] [CrossRef] [PubMed]
- Qiao, X.; Gu, Y.; Zou, C.; Xu, D.; Wang, L.; Ye, X.; Yang, Y.; Huang, X. Temporal variation and spatial scale dependency of the trade-offs and synergies among multiple ecosystem services in the Taihu Lake Basin of China. Sci. Total Environ. 2019, 651, 218–229. [Google Scholar] [CrossRef] [PubMed]
- Xu, Z.H.; Peng, J. Ecosystem services-based decision-making: A bridge from science to practice. Environ. Sci. Policy 2022, 135, 6–15. [Google Scholar] [CrossRef]
- Huang, Y.; Wu, J. Spatial and temporal driving mechanisms of ecosystem service trade-off/synergy in national key urban agglomerations: A case study of the Yangtze River Delta urban agglomeration in China. Ecol. Indic. 2023, 154, 110800. [Google Scholar] [CrossRef]
- Liu, Q.; Qiao, J.; Li, M.; Huang, M. Spatiotemporal heterogeneity of ecosystem service interactions and their drivers at different spatial scales in the Yellow River Basin. Sci. Total Environ. 2024, 908, 168486. [Google Scholar] [CrossRef]
- Xie, Y.H.; Chen, X.S. Effects of three-gorge project on succession of wetland vegetation in dongting Lake. Res. Agric. Modernization 2008, 29, 684–687. [Google Scholar]
- Wang, Z.; Zeng, L.H.; Wang, H.; Long, X.; Peng, J.; Chen, X. Different effects of natural siltation, damming and pollution on two adjacent lakes of Dongting Lake Wetland: Evidence from paleolimnology. J. Hydrol. 2024, 638, 131499. [Google Scholar] [CrossRef]
- Geng, M.M.; Wang, K.L.; Yang, N.; Li, F.; Zou, Y.; Chen, X.; Deng, Z.; Xie, Y. Spatiotemporal water quality variations and their relationship with hydrological conditions in Dongting Lake after the operation of the Three Gorges Dam, China. J. Clean. Prod. 2021, 283, 124644. [Google Scholar] [CrossRef]
- Xiang, J.; Tan, S.; Tan, X.; Long, J.; Xiao, T.; Wang, W. Spatiotemporal assessment of water security in the Dongting Lake region: Insights from projection pursuit method and sparrow search algorithm. J. Clean. Prod. 2022, 378, 134447. [Google Scholar] [CrossRef]
- Xiang, H.; Zhou, C.; Song, H. High-quality agricultural development in the central China: Empirical analysis based on the Dongting Lake area. Geomatica 2024, 76, 100010. [Google Scholar] [CrossRef]
- Huang, Y.; Chen, X.S.; Li, F.; Hou, Z.-Y.; Li, X.; Zeng, J.; Deng, Z.-M.; Zou, Y.-A.; Xie, Y.-H. Concurrent effects of flooding regimes and floodwater quality on sediment properties in a Yangtze River-connected floodplain wetland: Insights from field investigations during 2011–2020. Sci. Total Environ. 2022, 22, 154225. [Google Scholar] [CrossRef] [PubMed]
- Wang, W.Z.; Jiao, J.Y. Quantitative Evaluation of Soil Erosion Factors in China. Bull. Soil Water Conserv. 1996, 16, 1–20. [Google Scholar]
- Sharp, R.; Tallis, H.T.; Ricketts, T.; Guerry, A.D.; Wood, S.A.; Chapin-Kramer, R.; Nelson, E.; Ennaanay, D.; Wolny, S.; Olwero, N.; et al. InVEST3.2.0 User’s Guide; The Natural Capital Project: Stanford, CA, USA, 2016. [Google Scholar]
- Fang, L.L.; Wang, L.C.; Chen, W.X.; Sun, J.; Cao, Q.; Wang, S.; Wang, L. Identifying the impacts of natural and human factors on ecosystem service in the Yangtze and Yellow River Basins. J. Clean. Prod. 2021, 314, 127995. [Google Scholar] [CrossRef]
- Loiselle, A.; Proulx, R.; Larocque, M.; Pellerin, S. Synergies and trade-offs among ecosystems functions and services for three types of lake-edge wetlands. Ecol. Indic. 2023, 154, 110547. [Google Scholar] [CrossRef]
- Li, B.; Yang, G.; Wan, R.; Lai, X.; Wagner, P.D. Impacts of hydrological alteration on ecosystem services changes of a large river-connected lake (Poyang Lake), China. J. Environ. Manag. 2022, 310, 114750. [Google Scholar] [CrossRef] [PubMed]
- Xu, J.; Wang, Y.; Teng, M.; Wang, P.; Yan, Z.; Wang, H. Ecosystem services of lake-wetlands exhibit significant spatiotemporal heterogeneity and scale effects in a multi-lake megacity. Ecol. Indic. 2023, 154, 110843. [Google Scholar] [CrossRef]
- Peng, J.; Wang, X.Y.; Zheng, H.; Xu, Z. Applying production-possibility frontier based ecosystem services trade-off to identify optimal scenarios of Grain-for-Green Program. Landsc. Urban Plan. 2024, 242, 104956. [Google Scholar] [CrossRef]
- Jiang, S.; Cheng, X.; Yu, S.; Zhang, H.; Xu, Z.; Peng, J. Elevation dependency of ecosystem services supply efficiency in great lake watershed. J. Environ. Manag. 2022, 318, 115476. [Google Scholar] [CrossRef] [PubMed]
- Tang, H.; Halike, A.; Yao, K.; Wei, Q.; Yao, L.; Tuheti, B.; Luo, J.; Duan, Y. Ecosystem service valuation and multi-scenario simulation in the Ebinur Lake Basin using a coupled GMOP-PLUS model. Sci. Rep. 2024, 14, 5071. [Google Scholar] [CrossRef]
- Qin, J.; Ye, H.; Lin, K.; Qi, S.; Hu, B.; Luo, J. Assessment of water-related ecosystem services based on multi-scenario land use changes: Focusing on the Poyang Lake Basin of southern China. Ecol. Indic. 2024, 158, 111549. [Google Scholar] [CrossRef]
- Wang, L.; Li, Z.; Wang, D.; Chen, J.; Liu, Y.; Nie, X.; Zhang, Y.; Ning, K.; Hu, X. Unbalanced social-ecological development within the Dongting Lake basin: Inspiration from evaluation of ecological restoration projects. J. Clea. Prod. 2021, 315, 128161. [Google Scholar] [CrossRef]
- Liu, J.; Dietz, T.; Carpenter, S.R.; Alberti, M.; Folke, C.; Moran, E.; Pell, A.N.; Deadman, P.; Kratz, T.; Lubchenco, J.; et al. Complexity of coupled human and natural systems. Science 2007, 317, 1513–1516. [Google Scholar] [CrossRef] [PubMed]
- Huang, Y.; Gan, X.; Feng, Y.; Li, J.; Niu, S.; Zhou, B. A new framework for assessing ecosystem health with consideration of the sustainable supply of ecosystem services. Landsc. Ecol. 2024, 39, 37. [Google Scholar] [CrossRef]
- Hasan, S.S.; Zhen, L.; Miah, M.G.; Ahamed, T.; Samie, A. Impact of land use change on ecosystem services: A review. Environ. Dev. 2020, 34, 100527. [Google Scholar] [CrossRef]
- Yang, Y.; Yuan, X.; An, J.; Su, Q.; Chen, B. Drivers of ecosystem services and their trade-offs and synergies in different land use policy zones of Shaanxi Province, China. J. Clean. Prod. 2024, 452, 142077. [Google Scholar] [CrossRef]
- Zhang, P.; Zhang, S.; Zou, Y.; Wu, T.; Li, F.; Deng, Z.; Zhang, H.; Song, Y.; Xie, Y. Integrating suitable habitat dynamics under typical hydrological regimes as guides for the conservation and restoration of different waterbird groups. J. Environ. Manag. 2023, 345, 118451. [Google Scholar] [CrossRef]
- Willis, C. The contribution of cultural ecosystem services to understanding the tourism-nature-wellbeing nexus. J. Outdoor Rec. Tour. 2015, 10, 38–43. [Google Scholar] [CrossRef]
- Maes, J.; Hauck, J.; Paracchini, M.L.; Ratamäki, O.; Hutchins, M.; Termansen, M.; Furman, E.; Pérez-Soba, M.; Braat, L.; Bidoglio, G. Mainstreaming ecosystem services into EU policy. Curr. Opin. Environ. Sustain. 2013, 5, 128–134. [Google Scholar]
- Zhao, T.; Pan, J. Ecosystem service trade-offs and spatial non-stationary responses to influencing factors in the Loess hilly-gully region: Lanzhou City, China. Sci. Total Environ. 2022, 846, 157422. [Google Scholar] [CrossRef] [PubMed]
- Zhang, Y.; Ding, X.; Dong, L.; Yu, S. Research on spatiotemporal patterns and influencing factors of county-level urban shrinkage in urbanizing China. Sustain. Cities Soc. 2024, 109, 105544. [Google Scholar] [CrossRef]
- Huang, J.; Zheng, F.; Dong, X.; Wang, X.-C. Exploring the complex trade-offs and synergies among ecosystem services in the Tibet autonomous region. J. Clean. Prod. 2023, 384, 135483. [Google Scholar] [CrossRef]
- Feng, Q.; Zhao, W.; Duan, B.; Hu, X.; Cherubini, F. Coupling trade-offs and supply-demand of ecosystem services (ES): A new opportunity for ES management. Geo. Sus. 2021, 2, 275–280. [Google Scholar] [CrossRef]
- Zhang, B.; MacKenzie, A. Trade-offs and synergies in urban green infrastructure: A systematic review. Urban For. Urban Gree. 2024, 94, 128262. [Google Scholar] [CrossRef]
- Erlwein, S.; Pauleit, S. Trade-offs between urban green space and densification: Balancing outdoor thermal comfort, mobility, and housing demand. Urban Plan. 2021, 6, 5–19. [Google Scholar] [CrossRef]
- Cuthbert, M.O.; Rau, G.C.; Ekstrom, M.; O’carroll, D.M.; Bates, A.J. Global climate-driven trade-offs between the water retention and cooling benefits of urban greening. Nat. Commun. 2022, 13, 518. [Google Scholar] [CrossRef]
- Zhang, H.; Tang, Q.; He, X.; Yang, Q. Land use function changes and trade-offs/synergies across topographic gradients in the Three Gorges Reservoir Area, China. J. Clean. Prod. 2024, 469, 143233. [Google Scholar] [CrossRef]
- Zhu, S.; Zhao, Y.; Huang, J.; Wang, S. Analysis of spatial-temporal differentiation and influencing factors of ecosystem services in resource-based cities in semiarid regions. Remote Sens. 2023, 15, 871. [Google Scholar] [CrossRef]
- Wang, J.; Wu, W.; Yang, M.; Gao, Y.; Shao, J.; Yang, W.; Ma, G.; Yu, F.; Yao, N.; Jiang, H. Exploring the complex trade-offs and synergies of global ecosystem services. Environ. Sci. Ecotechnol. 2024, 21, 100391. [Google Scholar] [CrossRef] [PubMed]
- Shen, J.; Zhao, M.; Tan, Z.; Zhu, L.; Guo, Y.; Li, Y.; Wu, C. Ecosystem service trade-offs and synergies relationships and their driving factor analysis based on the Bayesian belief Network: A case study of the Yellow River Basin. Ecol. Indic. 2024, 163, 112070. [Google Scholar] [CrossRef]
- Ran, P.; Hu, S.; Frazier, A.E.; Yang, S.; Song, X.; Qu, S. The dynamic relationships between landscape structure and ecosystem services: An empirical analysis from the Wuhan metropolitan area, China. J. Environ. Manag. 2023, 325, 116575. [Google Scholar] [CrossRef] [PubMed]
- Lyu, F.; Tang, J.; Olhnuud, A.; Hao, F.; Gong, C. The impact of large-scale ecological restoration projects on trade-offs/synergies and clusters of ecosystem services. J. Environ. Manag. 2024, 365, 121591. [Google Scholar] [CrossRef] [PubMed]


Disclaimer/Publisher’s Note: The statements, opinions and data contained in all publications are solely those of the individual author(s) and contributor(s) and not of MDPI and/or the editor(s). MDPI and/or the editor(s) disclaim responsibility for any injury to people or property resulting from any ideas, methods, instructions or products referred to in the content. |
© 2025 by the authors. Licensee MDPI, Basel, Switzerland. This article is an open access article distributed under the terms and conditions of the Creative Commons Attribution (CC BY) license (https://creativecommons.org/licenses/by/4.0/).