
A Study of the Effect of Lake Shape on Hydrodynamics and Eutrophication

Abstract
:1. Introduction
2. Methodology
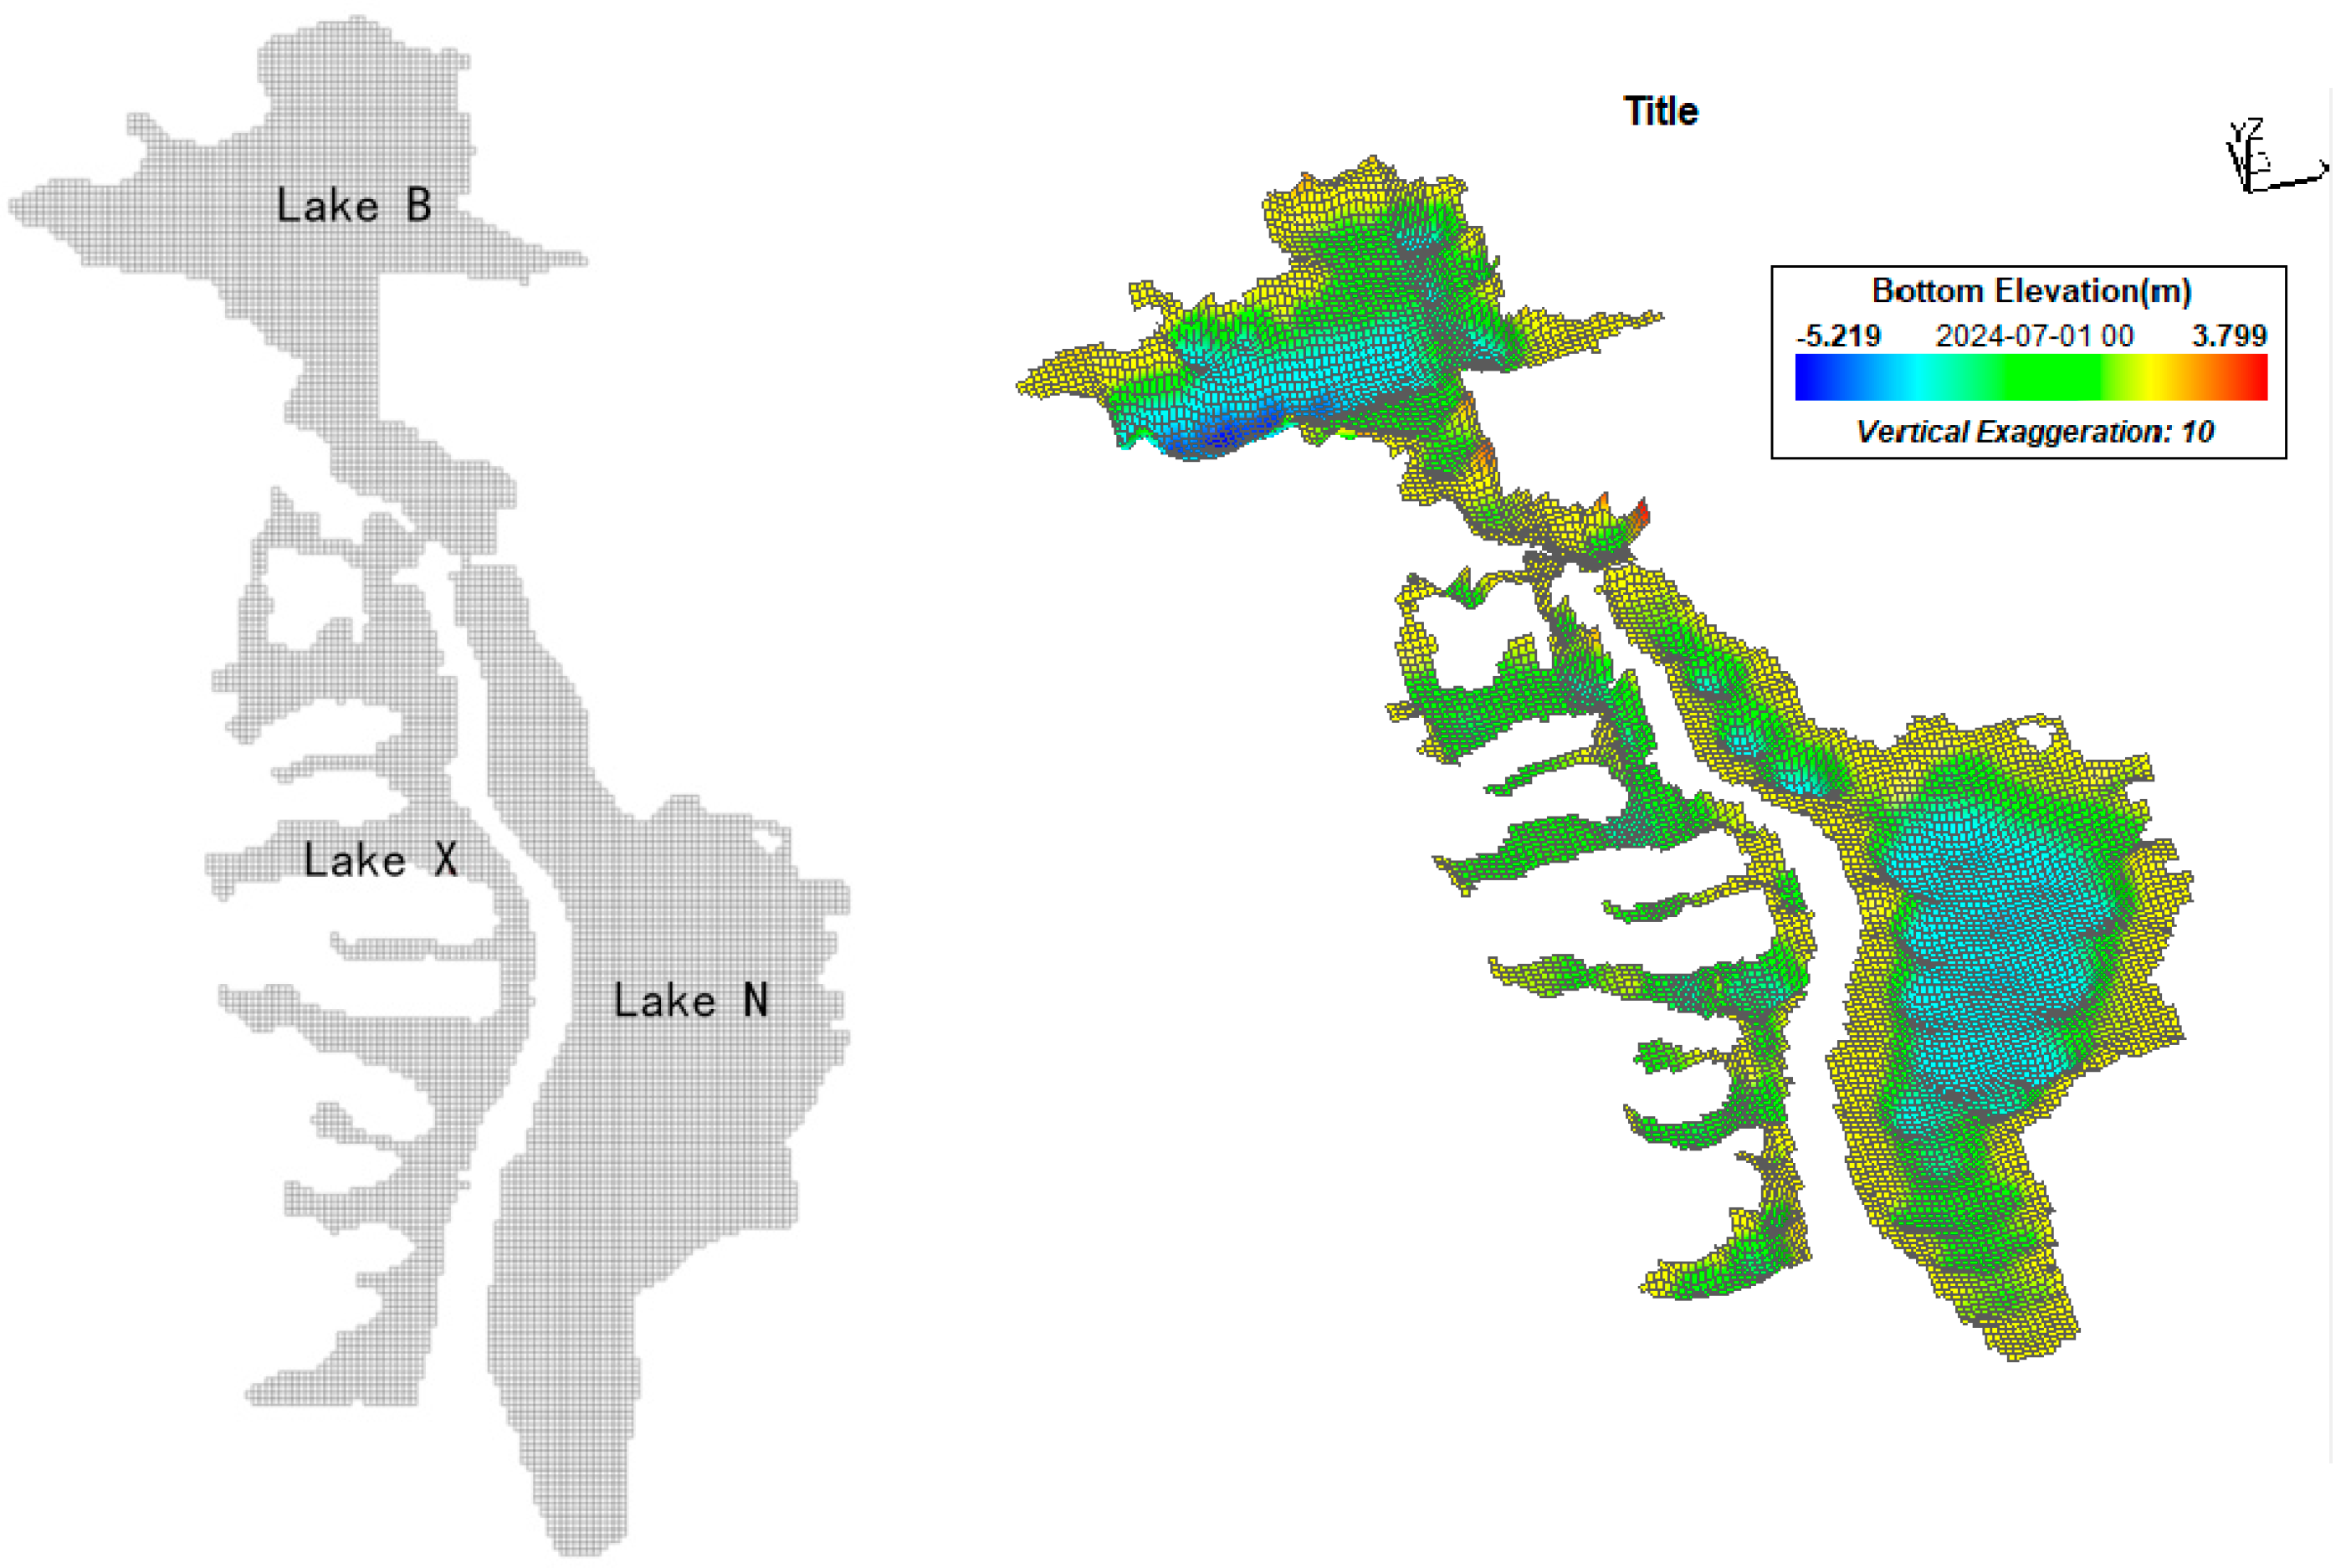
2.1. Study Region
2.2. Calculation of the Landscape Indices
- (1)
- The shape index (SI) measures how compact the shape of the lake is with respect to a circle of the same area, with the following formula:where is the perimeter of the lake and is the area of the lake.
- (2)
- Fractional dimension (FD): Reflecting the complexity of lake morphology, the closer the fractional dimension is to 2, the more complex the shape. The formula is as follows:
- (3)
- Near-circularity index (RCC): This assesses the degree of narrowness of a lake’s shape, where the larger the value, the narrower the shape. The formula is as follows:where is the area of the lake and is the area of the smallest outer circle of the lake.
2.3. Model Construction and Data Sources
- (1)
- Model boundary conditions: these include lake topographic data, recharge flow, meteorological conditions (wind speed, wind direction, temperature, etc.), and initial pollutant concentrations.
- (2)
- Initial conditions: based on the summer monitoring data in 2020, initial water level, water temperature, DO, TN, TP, and Chl-a concentrations were set.
- (3)
- Grid division: a two-dimensional orthogonal grid was used, with a total of 8837 cells, in which the grid was refined in key areas such as the connecting gates to improve the simulation accuracy.
- (1)
- Water quality monitoring data: collected according to the Environmental Quality Standard for Surface Water (GB3838-2002) [32], including water temperature, dissolved oxygen (DO), TN, TP, and Chl-a concentrations from July to September 2020, with a sampling frequency of every 15 days.
- (2)
- Meteorological data: provided by the China Meteorological Data Service Center, including wind speed, wind direction, rainfall, temperature, etc., with a data interval of 1 h.
3. Modeling and Validation
3.1. Model Building
3.2. Design for Simulated Working Conditions
3.2.1. Hydrodynamic Analysis Conditions
3.2.2. Water Quality Analysis Conditions
3.3. Model Rate Determination
4. Analysis of Lake Flow Fields and Factors Affecting the Water Environment
4.1. Impact of Lake Landscape Indices on Lake Eutrophication
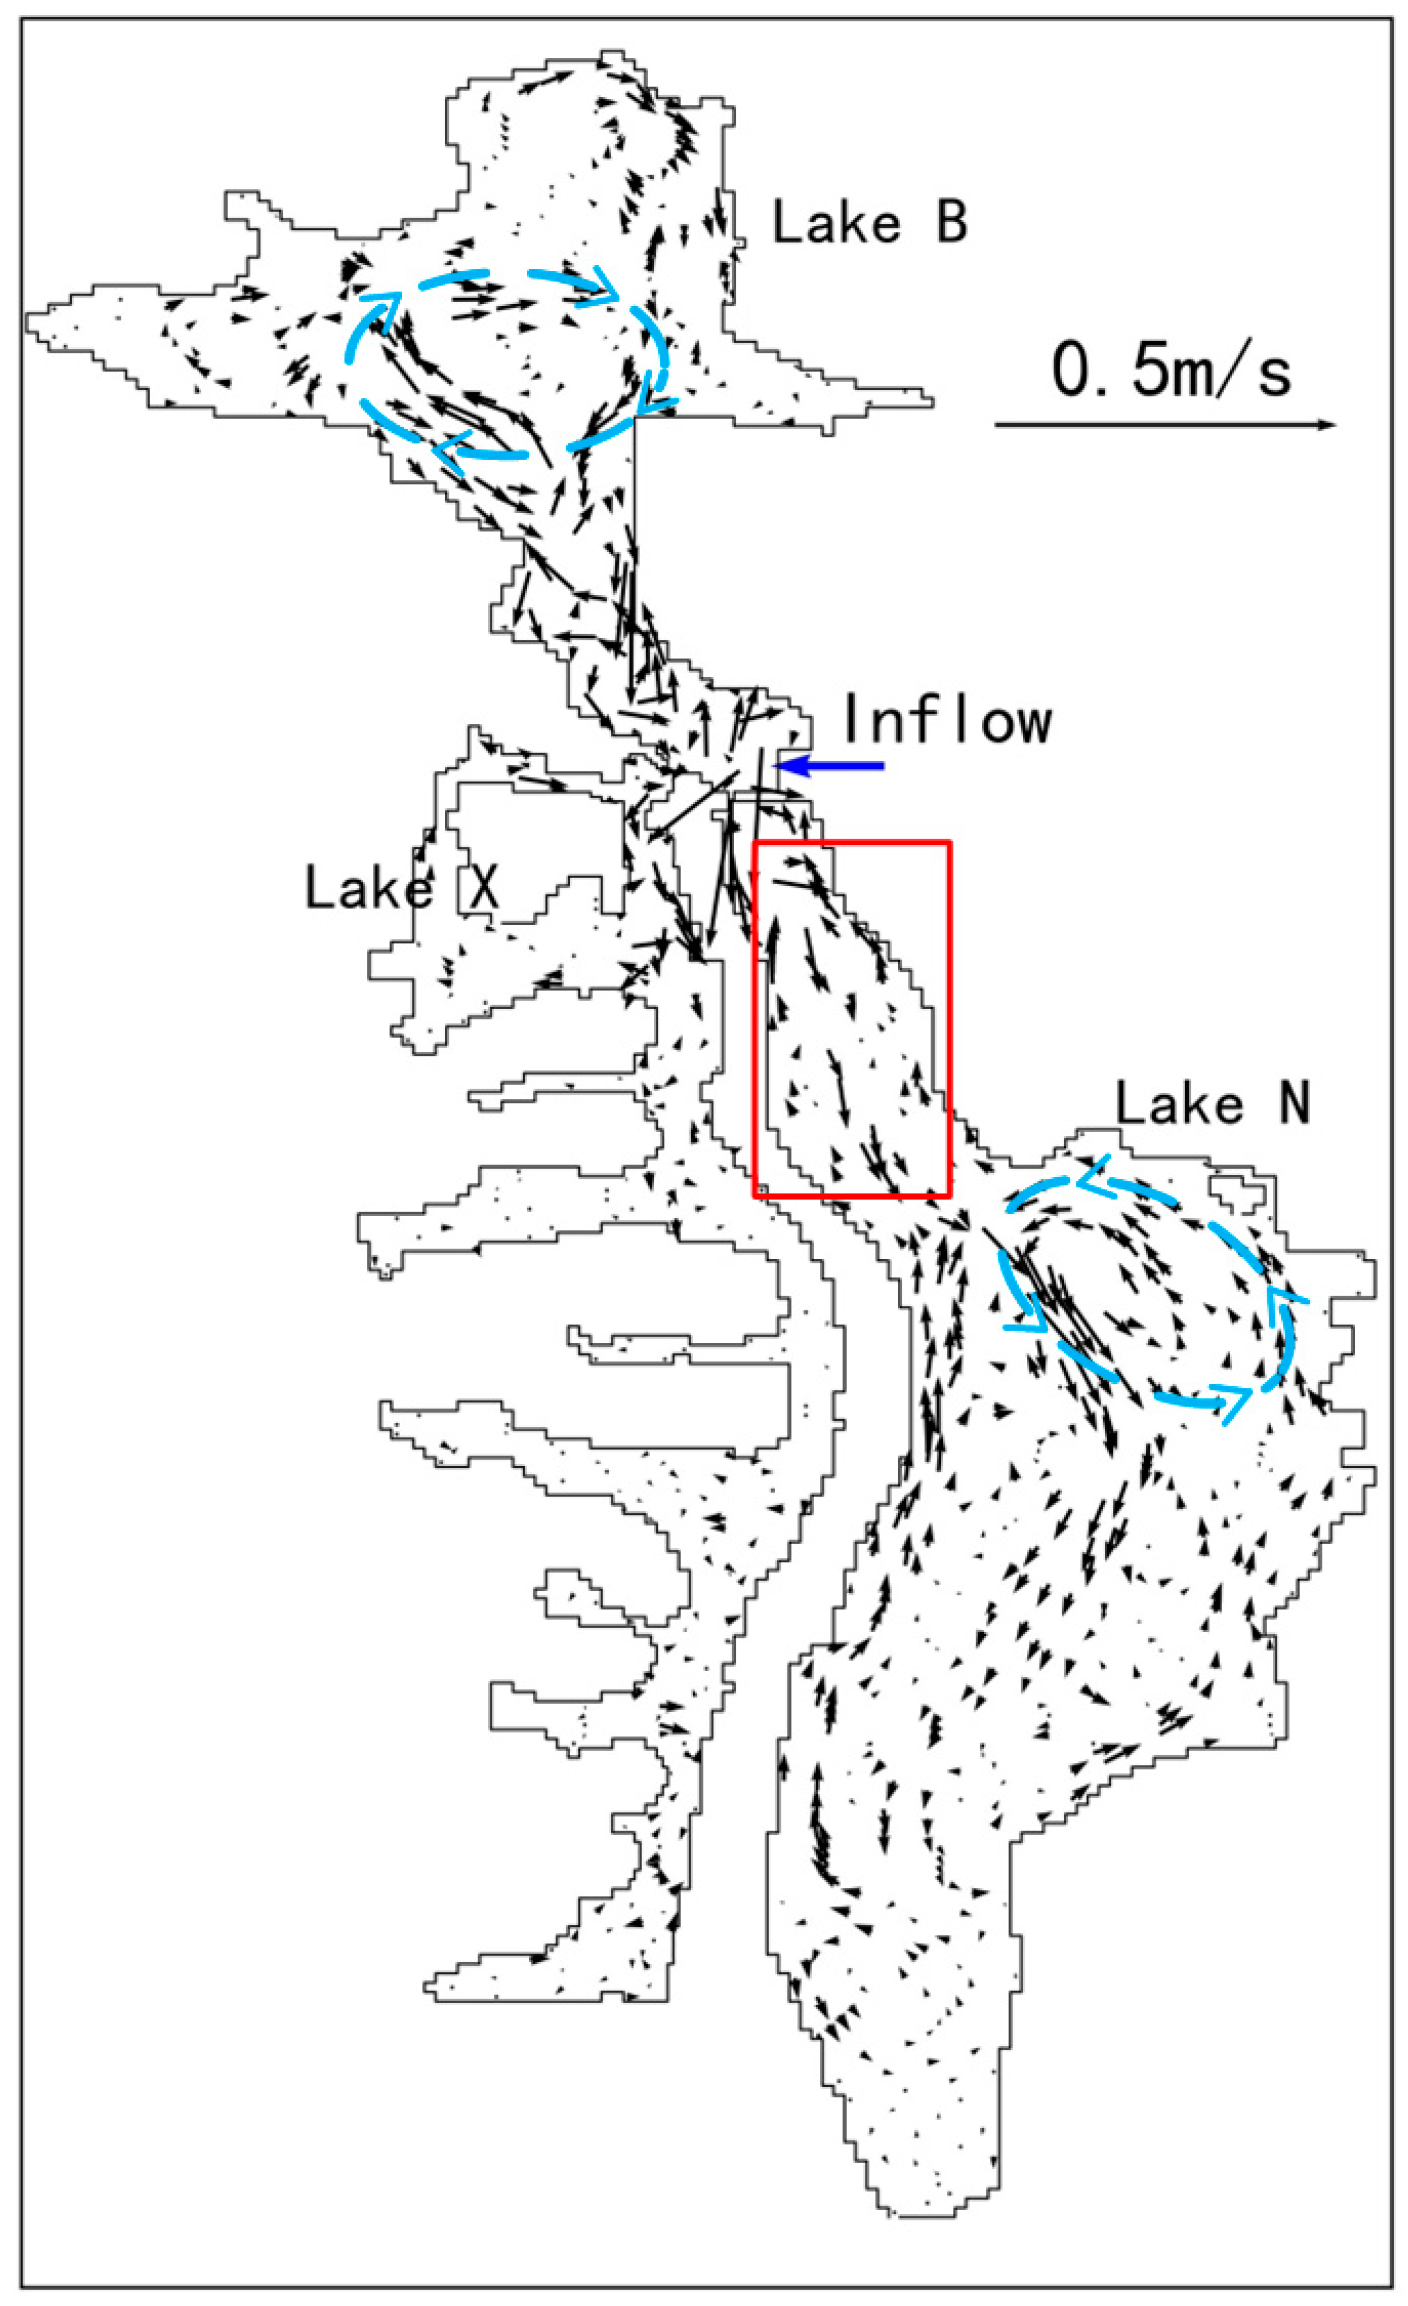
4.2. Characterization of Lake Flow Field Distribution
4.2.1. Characteristics of Lake Flow Field Distribution During Recharge Phase
4.2.2. Characterization of Lake Flow Field Distribution During Stationary Phase
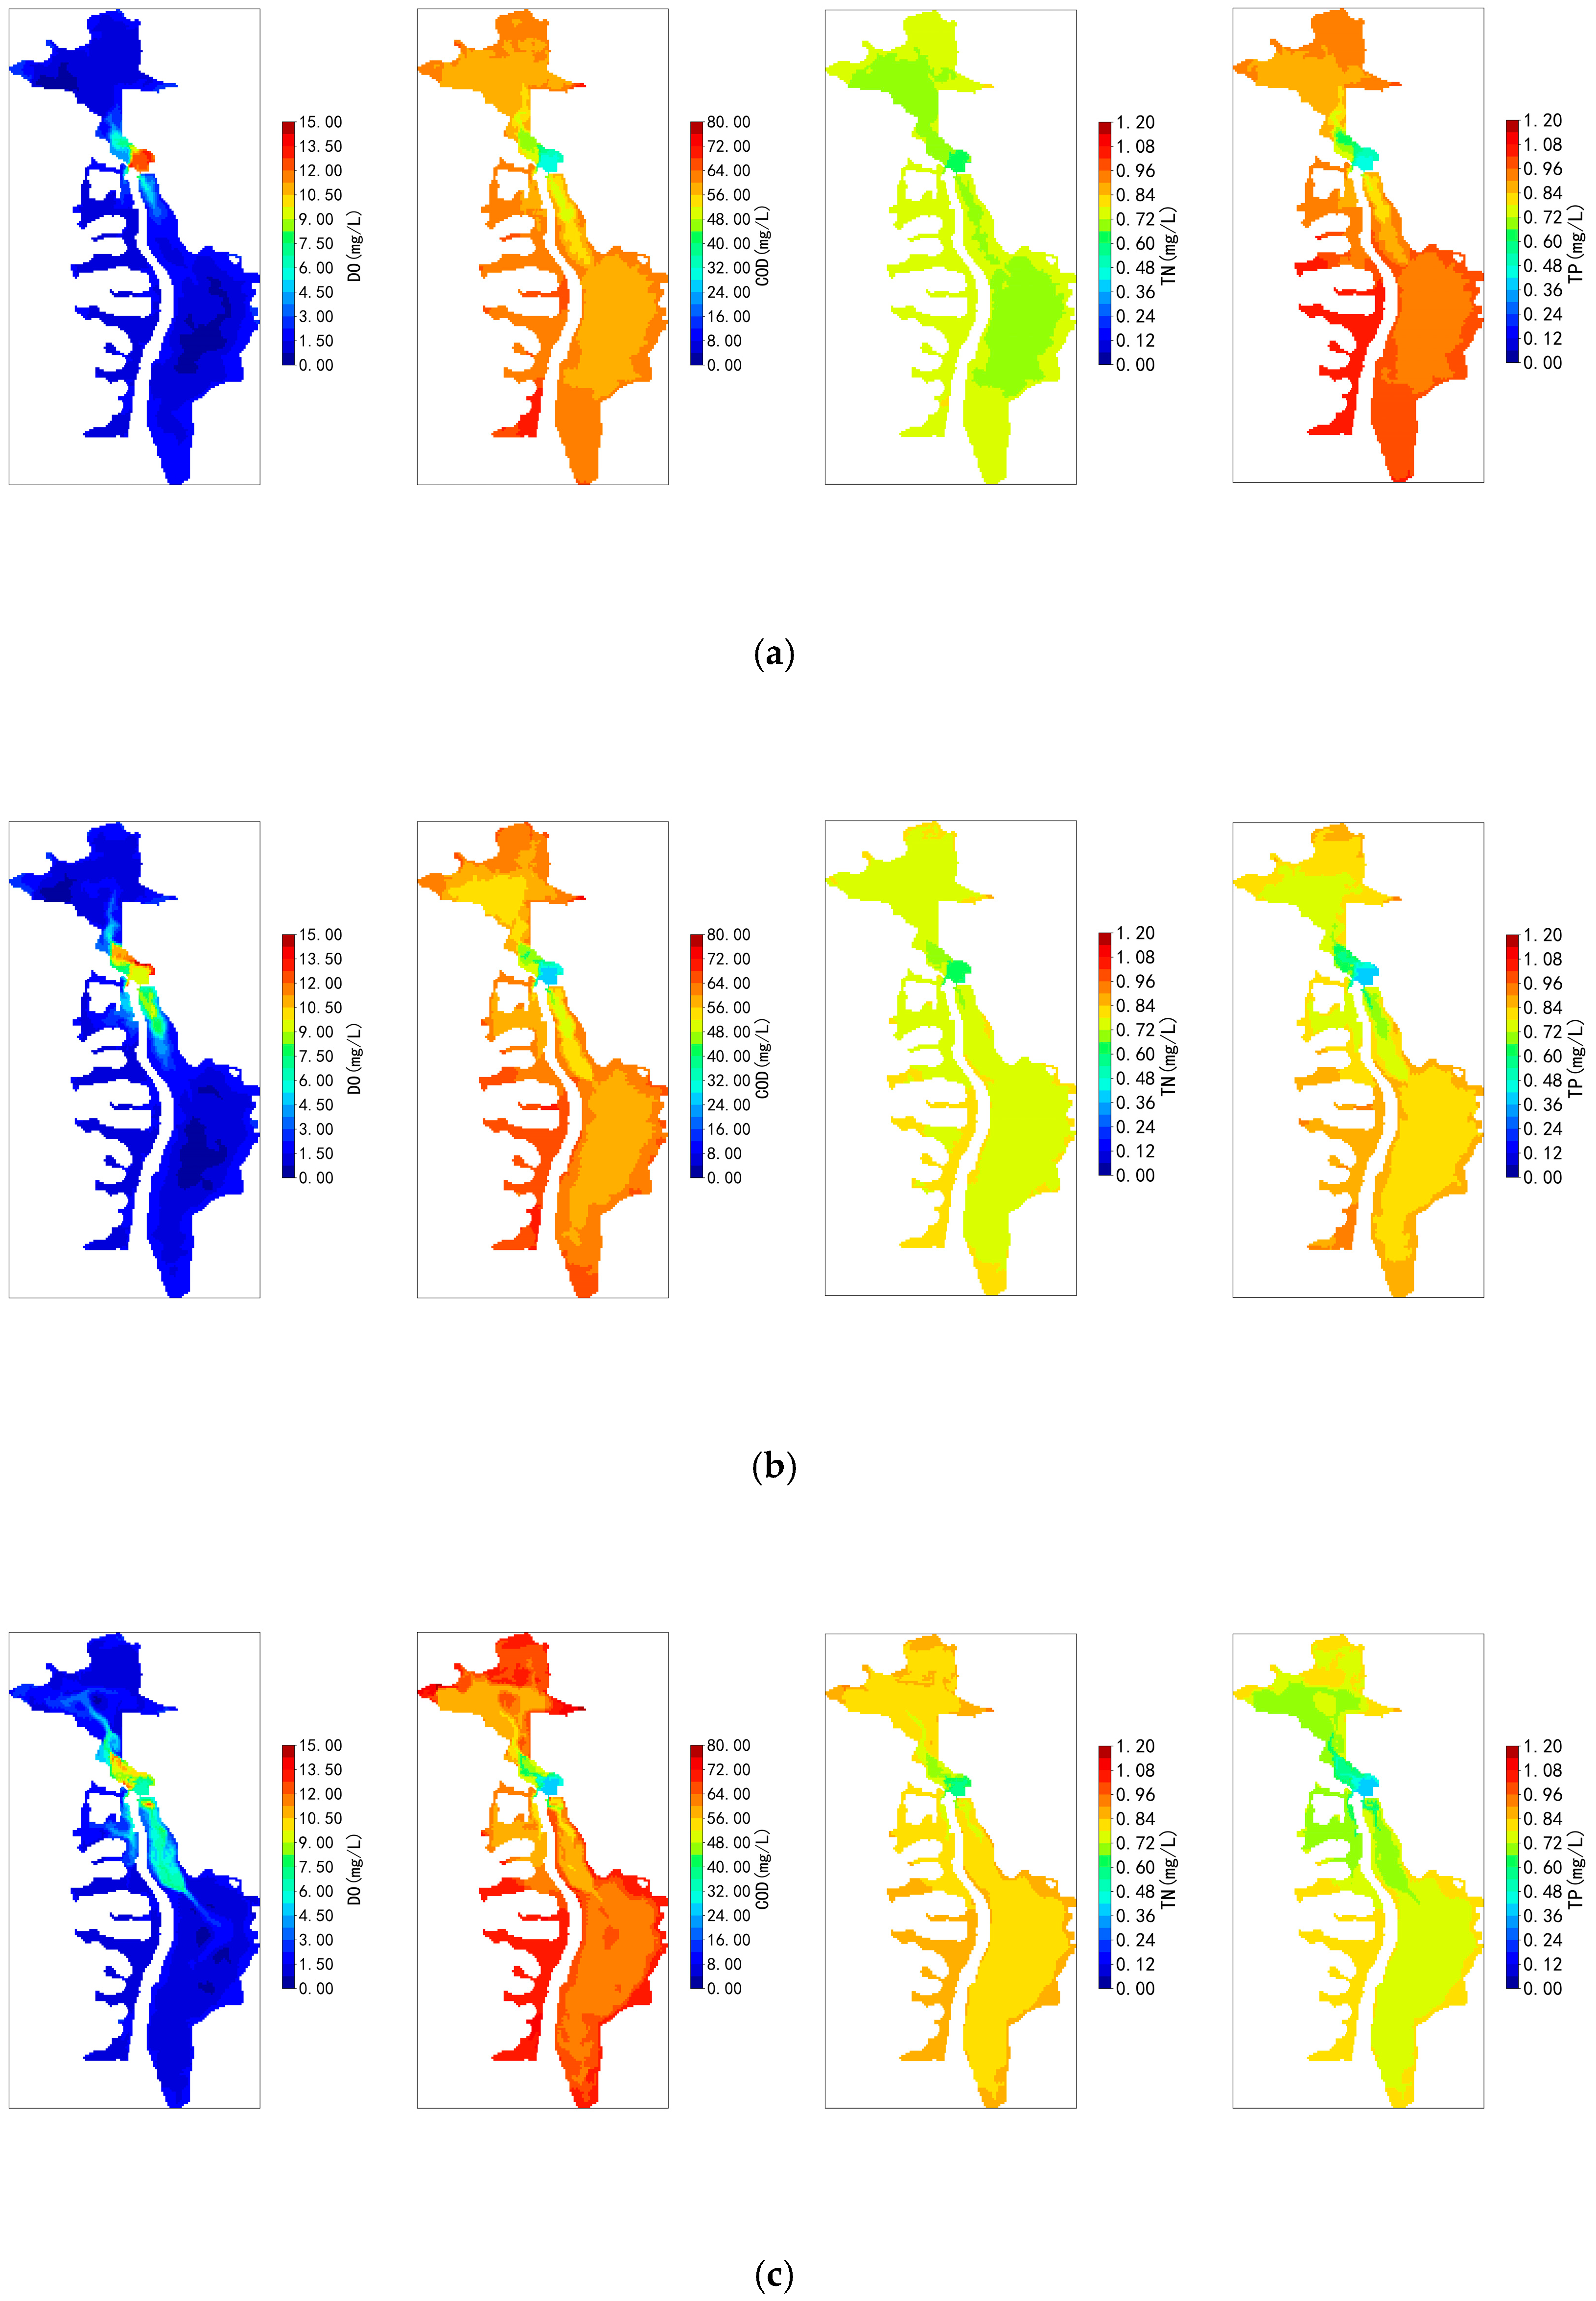
4.3. Characterization of Spatial and Temporal Distribution of Lake Water Quality
4.3.1. Characterization of Lake Water Quality Response During Recharge Phase
4.3.2. Characterization of Chl-a Distribution and Its Effects During the Stationary Phase After Recharge
4.3.3. Characterization of Temporal Changes in Chl-a of Lakes in the Stationary Phase
4.3.4. Chl-a Impact Factor Analysis
5. Discussion
5.1. Accuracy of Hydrodynamic and Water Quality Modeling
5.2. Long-Term Effects of Recharge and Wind Action on Lake Water Quality
6. Conclusions
- (1)
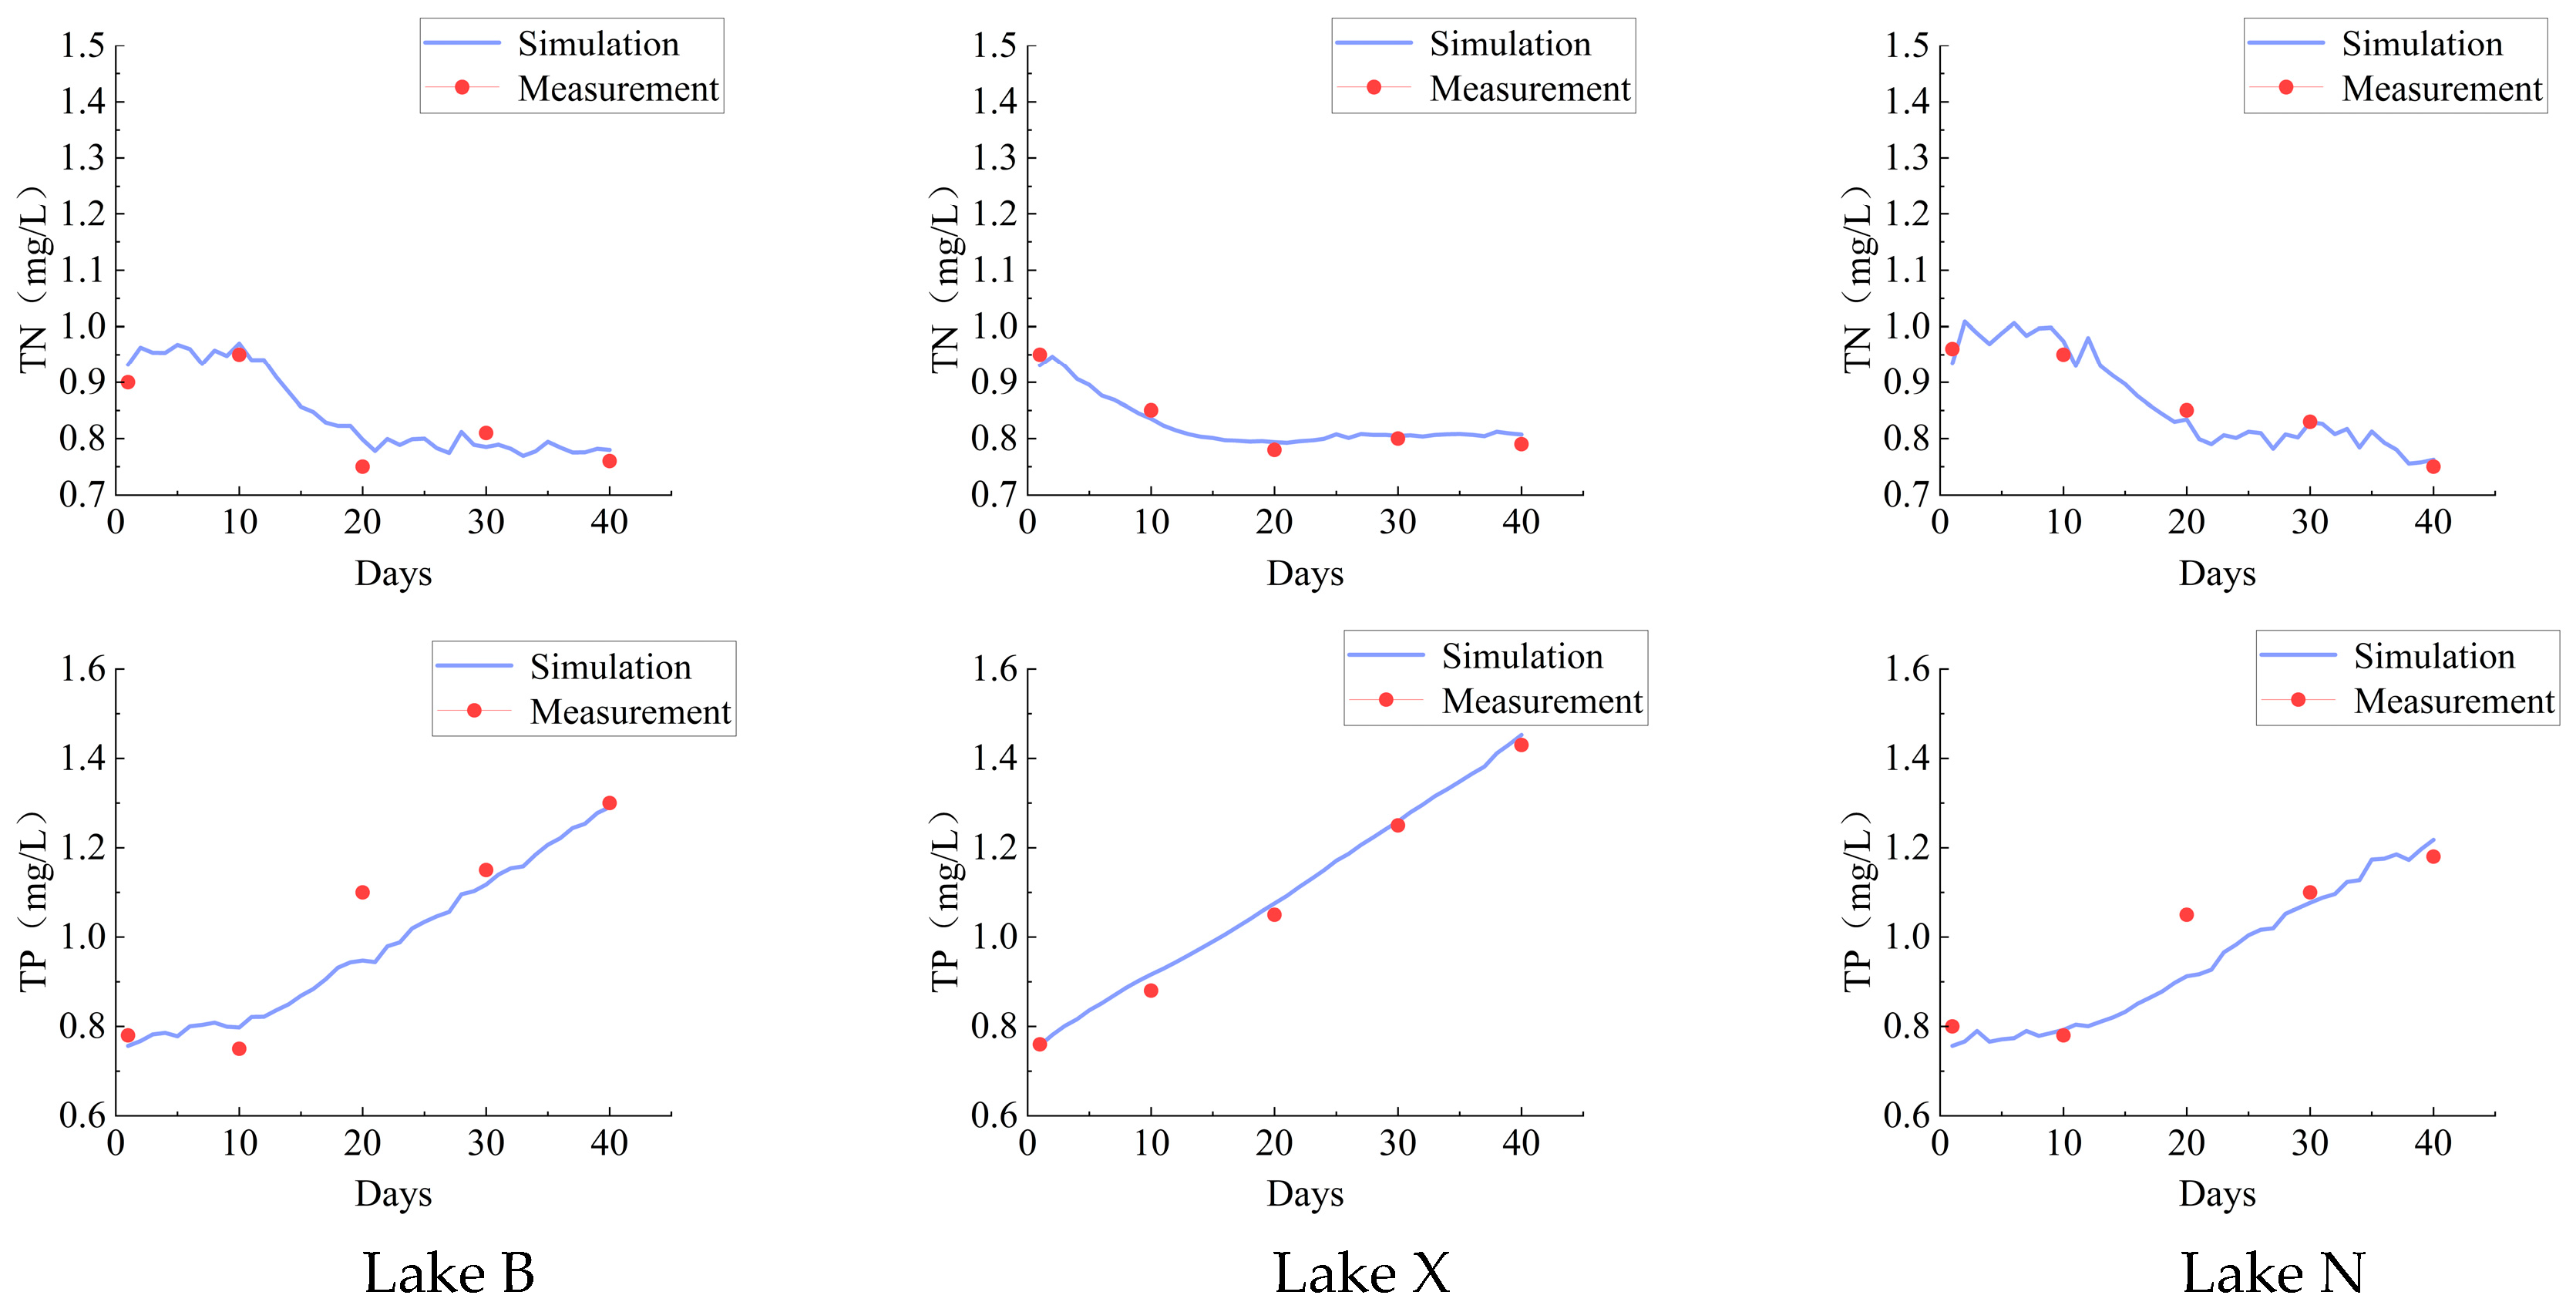
- In this study, a two-dimensional coupled hydrodynamic and water quality model using the EFDC framework was successfully developed to simulate the lake’s hydrodynamics and water environment. Model validation shows strong agreement between simulated and measured values, with the Nash-Sutcliffe Efficiency (NSE) generally exceeding 0.80 for parameters such as water level, water temperature, DO, COD, TN, and TP. Among them, Lake N has the highest simulation accuracies in water temperature (NSE = 0.93) and TN (NSE = 0.90). Overall, validation confirms the model’s ability to accurately capture the spatial and temporal distribution characteristics of the lake water body.
- (2)
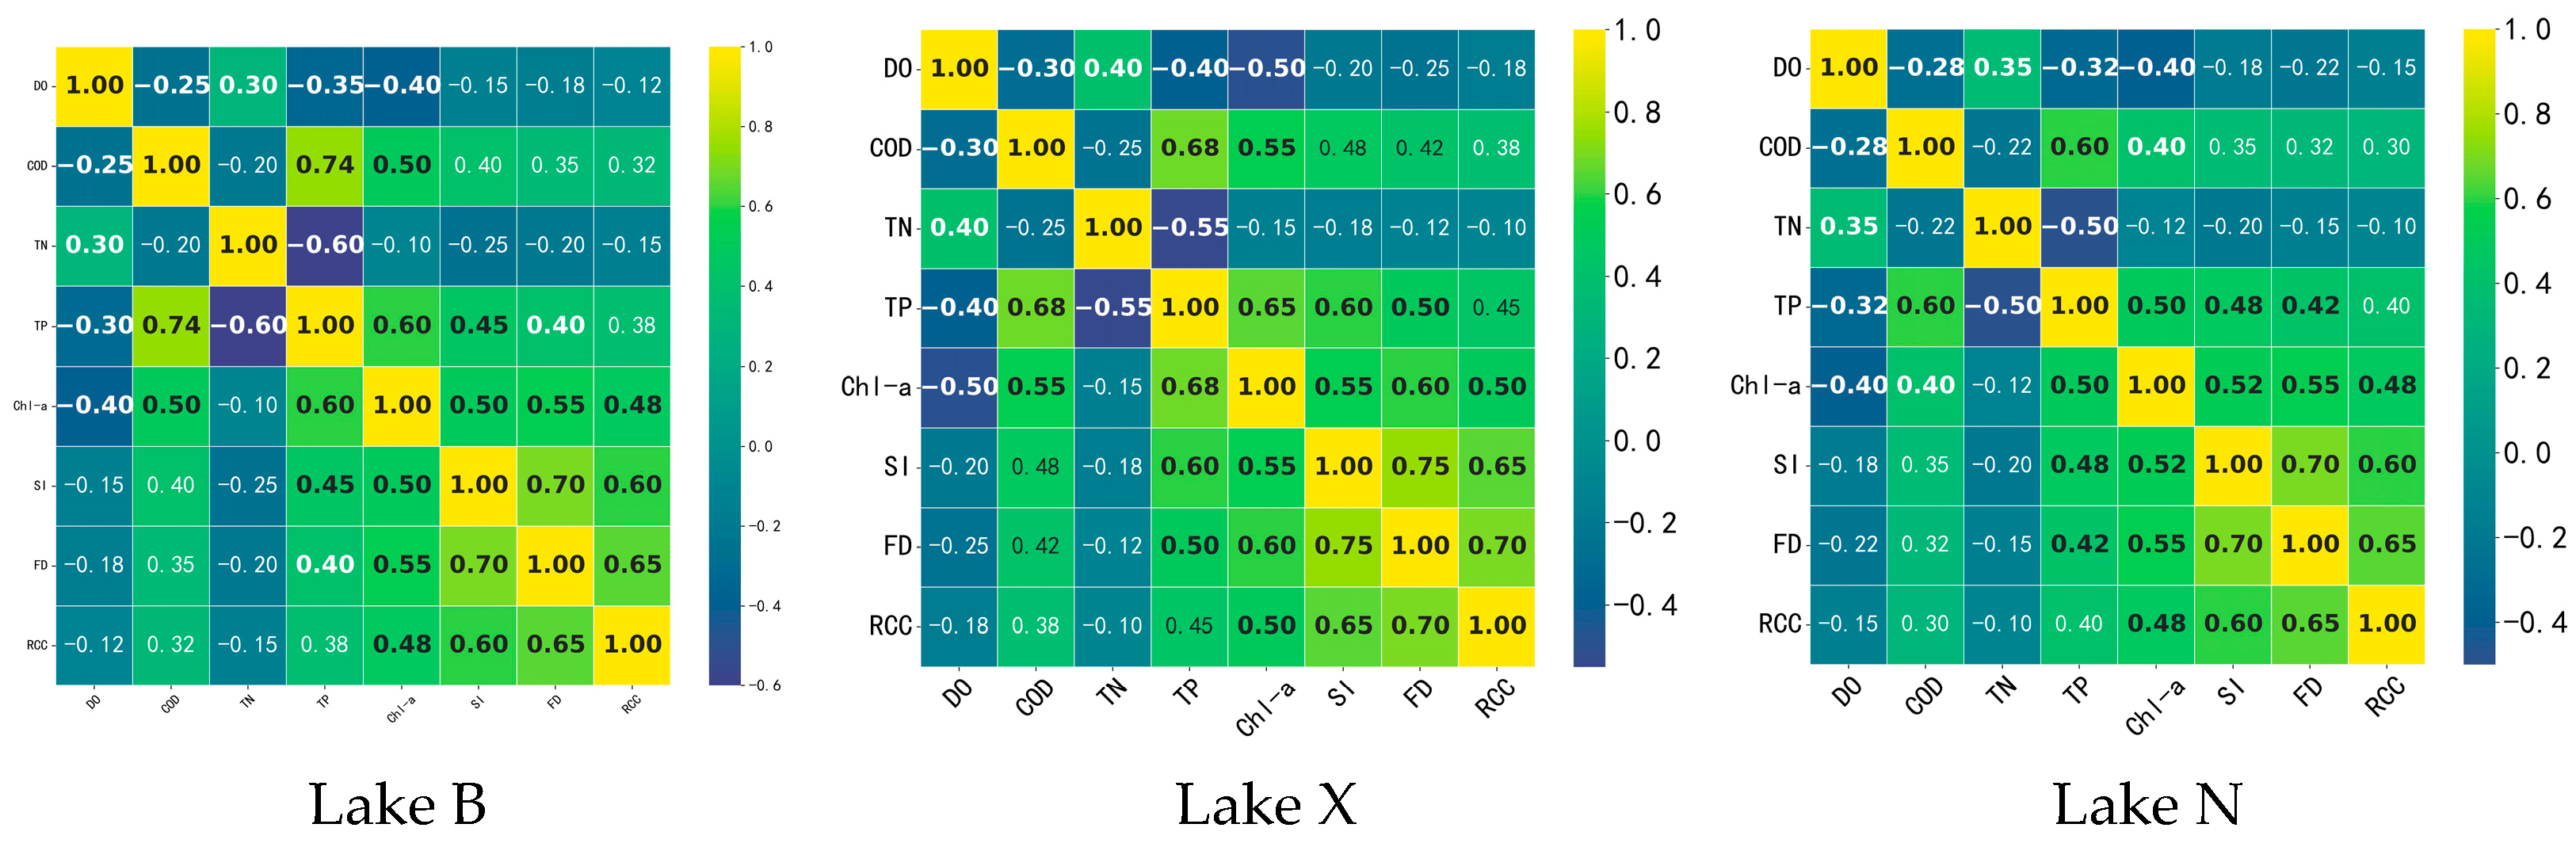
- Lake shape had a significant effect on the water quality response. Lake X had poor mobility and prolonged retention time due to its complex shape (shape index of 4.72, fractional dimension of 1.24), leading to significantly higher nutrient accumulation and algal bloom risk; in contrast, lake B had a regular shape (subcircularity index of 0.67) and high flow rate, with a relatively low risk of eutrophication. Correlation analysis showed that TP was the main driver of Chl-a concentration (correlation of 0.56-0.68, p < 0.01), while COD had a more significant effect on Lake X (0.55, p = 0.01) and Lake N (0.50, p = 0.02). Meanwhile, DO was negatively correlated with Chl-a (correlations of −0.40 to −0.50, p < 0.05), suggesting that higher flow rates had a positive effect on mitigating eutrophication. In addition, the correlation between lake shape indicators (SI and FD) and Chl-a reached the highest value in Lake X (0.55–0.60, p < 0.01), further confirming that complex shaped lakes are more likely to exacerbate the accumulation of nutrients and the risk of algal bloom.
- (3)
- Different recharge conditions had a significant regulatory effect on the water quality distribution of the lake. Under the recharge flow rate of 1.0 m3/s, the DO concentration in the area near the inlet of Lake B was significantly increased to 14.0–15.0 mg/L, while the DO concentration in most of the main body of the lake was maintained at about 3.0 mg/L and the overall water quality condition was improved. In contrast, in Lake X, due to low flow velocities, the DO concentration further decreased to less than 3.0 mg/L in some areas, while the COD concentration rose to more than 80.0 mg/L, indicating a higher risk of nutrient accumulation and water quality deterioration under low-flow conditions. In addition, wind promoted water mixing in the lake to some extent by enhancing water circulation. However, in Lake X, circulation was difficult to form effectively due to the limitations of complex shape and low flow velocities, resulting in the stagnant area remaining a major risk point for eutrophication. This result suggests that an improvement in lake water quality does not only depend on the recharge flow and frequency, but also needs to be considered in combination with the wind effect and the morphological characteristics of the lake.
- (4)
- In order to reduce the risk of algal bloom in Lake X, the frequency of water replenishment (once every 20 days) should be increased or the flow rate should be adjusted to enhance the dilution effect. This should be combined with engineering optimization measures (e.g., modifying the structure of the connecting gates and installing auxiliary pumping stations) to improve water mobility. For Lakes B and N, the existing replenishment frequency and flow rate can be maintained, while strengthening water quality monitoring during the resting phase. Wind can also be utilized to promote circulation and enhance water mixing, reducing the risk of localized eutrophication.
Author Contributions
Funding
Institutional Review Board Statement
Informed Consent Statement
Data Availability Statement
Conflicts of Interest
References
- Su, Y.; Gan, L.; Li, Y.; Fan, Z.; Xie, C.; Liu, Y.; Liao, Y.; Ding, R.; Liu, G.; Wu, J.; et al. A novel indicator for defining plain urban river network cyanobacterial blooms: Resource use efficiency. Heliyon 2022, 8, e10601. [Google Scholar] [CrossRef] [PubMed]
- Liu, C.; Liu, Y.; Giannetti, B.F.; Almeida, C.; Sevegnani, F.; Li, R. Spatiotemporal differentiation and mechanism of anthropogenic factors affecting ecosystem service value in the Urban Agglomeration around Poyang Lake, China. Ecol. Ind. 2023, 154, 110733. [Google Scholar] [CrossRef]
- Schirpke, U.; Tasser, E.; Ebner, M.; Tappeiner, U. What can geotagged photographs tell us about cultural ecosystem services of lakes? Ecosyst. Serv. 2021, 51, 101354. [Google Scholar] [CrossRef]
- Pan, J.; Ma, Y.; Cai, S.; Chen, Y.; Chen, Y. Distribution patterns of lake-wetland cultural ecosystem services in highland. Environ. Dev. 2022, 44, 100754. [Google Scholar] [CrossRef]
- Ebner, M.; Schirpke, U.; Tappeiner, U. Combining multiple socio-cultural approaches—Deeper insights into cultural ecosystem services of mountain lakes? Landsc. Urban Plan. 2022, 228, 104549. [Google Scholar] [CrossRef]
- Shen, H.; Xu, H.; Zhang, X.; Chen, J.; Zhu, T.; Jiang, W.; Fu, Y. Characteristics of phytoplankton functional groups in spring-type urban lakes and their ecological health evaluation—Taking Jinan Daming Lake as an example. J. Lake Sci. 2024, 36, 1036–1046. [Google Scholar]
- Li, L.; Wang, H.; Liu, K.; Ning, Y.; Chen, S.; Song, C. Characterization of spatial distribution pattern of urban lakes in China and discussion of influencing factors. J. Lake Sci. 2024, 36, 587–601. [Google Scholar]
- Qi, J. Spatial and Temporal Distribution of Eutrophication in Zhejiang Coastal Waters; Zhejiang University: Hangzhou, China, 2021. [Google Scholar]
- Qin, B.; Deng, J.; Shi, K.; Wang, J.; Brookes, J.; Zhou, J.; Zhang, Y.; Zhu, G.; Paerl, H.W.; Wu, L. Extreme Climate Anomalies Enhancing Cyanobacterial Blooms in Eutrophic Lake Taihu, China. Water Resour. Res. 2021, 57, e2020WR029371. [Google Scholar] [CrossRef]
- Fu, L.; Shen, Y.; Zhang, H.; Wang, X. Effects of water diversion projects on water environment in Chaohu Lake. Limnologica 2022, 97, 126026. [Google Scholar] [CrossRef]
- Lv, X.; Zhu, M.; Ma, Y.; Zou, W.; Xu, T.; Zhang, Z.; Zhu, G. Promoting conditions of algal blooms in typical source water reservoirs in the Taihu Lake basin. J. Lake Sci. 2023, 35, 1516–1528. [Google Scholar]
- Wang, F.; Li, Y.J.; Ma, T.T.; Chen, H.; Wang, X.; Li, K.; Wu, Z. Phytoplankton based ecological health assessment of urban lakes—A case study of Lake X in Tongling City, the lower reaches of the Yangtze River. J. Lake Sci. 2022, 34, 1890–1900. [Google Scholar]
- Zhao, Y.; Li, T.; Huang, B.; Feng, Y.; Lei, M.; Zhuo, H.; Wu, Y. Evolutionary characteristics of water quality and eutrophication of typical lakes in the middle reaches of the Yangtze River and their driving factors from 2016 to 2020. J. Lake Sci. 2022, 34, 1441–1451. [Google Scholar]
- Liu, D.; Zhang, M.; Shen, M.; Cao, Z.; Qi, T.; Qiu, Y.; Duan, H. Biomass and meteorological factors Predicting algal blooms in different zones of Lake Chaohu based on satellite-derived algal. J. Lake Sci. 2022, 34, 1090–1101. [Google Scholar]
- Li, F.P.; Gao, Y.; Zhang, H.P.; Xiao, Y.; Chen, L. Simulation experiment on the effect of flow velocity on the growth and population change of planktonic algae. J. Lake Sci. 2015, 27, 44–49. [Google Scholar]
- Paerl, H.W.; Barnard, M.A. Mitigating the global expansion of harmful cyanobacterial blooms: Moving targets in a human- and climatically-altered world. Harmful Algae 2020, 96, 1–8. [Google Scholar] [CrossRef] [PubMed]
- Tulatz, S.; Krock, B.; Tillmann, U.; Meunier, C.L. Effects of temperature, salinity and CO2 concentration on growth and toxin production of the harmful algal bloom species Alexandrium pseudogonyaulax (Dinophyceae) from the Danish Limfjord. Harmful Algae 2024, 140, 102756. [Google Scholar] [CrossRef] [PubMed]
- Huang, Q.F.; Li, N.; Li, Y. Long-term trend of heat waves and potential effects on phytoplankton blooms in Lake Qiandaohu, a key drinking water reservoir. Environ. Sci. Pollut. Res. 2021, 28, 68448–68459. [Google Scholar] [CrossRef] [PubMed]
- Zhang, J.; Bu, Y.; Qi, Y.; Zhou, B. Environmental management technology and effect of Tonghui Lake water. Water Resour. Prot. 2019, 35, 71–75. [Google Scholar]
- Chen, H.; Zhou, Q.C.; Tong, G.Y.; Guo, B. Progress in the study of eutrophication response law and early warning method of water bloom. China Rural. Water Hydropower 2024, 7, 117–125+134. [Google Scholar]
- Kouwen, N.C.; Ton, A.M.; Vos, S.E.; Vijverberg, T.; Reniers, A.J.H.M.; Aarninkhof, S.G.J. Quantifying spit growth and its hydrodynamic drivers in wind-dominated lake environments. Geomorphology 2023, 437, 1–18. [Google Scholar]
- Vuksanovic, V.; Smedt, F.D.; Meerbeeck, S.V. Transport of polychlorinated biphenyls (PCB) in the Scheldt Estuary simulated with the water quality model WASP. J. Hydrol. 1996, 174, 1–18. [Google Scholar] [CrossRef]
- Hernandez, P.; Ambrose, R.B., Jr.; Prats, D.; Ferrandis, E.; Asensi, J.C. Modeling Eutrophication Kinetics in ReservoirMicrocosms. Water Res. 1997, 31, 2511–2519. [Google Scholar] [CrossRef]
- Fizpartick, J.J. User’s Guide for RCA: Release 3.0; HydroQual Inc.: Magwag, NJ, USA, 2004. [Google Scholar]
- Qiu, Z.; Lou, A.; Du, P.; Cao, Z.; Yu, X. Simulation of water quality in Sanggou Bay using RCA model. Mar. Environ. Sci. 2010, 29, 736–740. [Google Scholar]
- Li, D.; Bu, S.; Gu, L. Water quality simulation of Yanghe Reservoir based on MIKE 21 model. J. Saf. Environ. 2018, 18, 1094–1100. [Google Scholar]
- Kim, J.; Lee, T.; Seo, D. Algal bloom prediction of the lower Han River, Korea using the EFDC hydrodynamic and water quality model. Ecol. Model. 2017, 366, 27–36. [Google Scholar] [CrossRef]
- Xu, S.; He, G.; Fang, H.; Bai, S.; Wu, X. Parameter uncertainty and sensitivity analysis of the three Gorges Reservoir and Xiangxi River EFDC model. J. Hydrol. 2022, 610, 127881. [Google Scholar] [CrossRef]
- Liu, Y.; He, H.; Zhou, J.; Fan, H.; Wu, Q.; Delang, C.O. Understanding thermal stratification and circulation dynamics in Fuxian Lake: Insights from EFDC simulation study. Ecol. Indic. 2024, 165, 112202. [Google Scholar] [CrossRef]
- Wu, G.Z.; Xu, Z.X. Prediction of algal blooming using EFDC model: Case study in the Daoxiang Lake. Ecol. Model. 2011, 222, 1245–1252. [Google Scholar] [CrossRef]
- Ahn, J.M.; Lee, K.; Lyu, S. Effect of Changes in Watershed Runoff Characteristics on Salinity Intrusion in Estuary Using EFDC. Hydraul. Eng. 2020, 24, 87–98. [Google Scholar] [CrossRef]
- Surface Water Environmental Quality Standard GB3838-2002; State Environmental Protection Administration of the People’s Republic of China. China Environmental Science Press: Beijing, China, 2002.
- Cheng, Y.; Ma, M.; Zhong, Y.; Wei, W.; Li, D.; Sun, J. Comprehensive pollution risk analysis of oil spill accident in multi-jetty development section of Jingjiang River based on EFDC model. Water Resour. Prot. 2024, 40, 150–156. [Google Scholar]
- Meng, S.; Yao, Y.; Hu, B.; Chen, Y.; Wang, L.; Liu, Y. Spatial distribution of summer chlorophyll a concentration in Daihai, Mengxin Plateau and the factors affecting it. J. Lake Sci. 2023, 35, 1255–1268. [Google Scholar]
- Seo, D.; Kim, M.; Ahn, J.H. Prediction of Chlorophyll-a Changes due to Weir Constructions in the Nakdong River Using EFDC-WASP Modelling. Environ. Eng. Res. 2012, 17, 402–407. [Google Scholar] [CrossRef]
- Zhu, G.; Xu, H.; Zhu, M.; Zou, W.; Guo, C.; Ji, P.; Da, W.; Zhou, Y.; Zhang, Y.; Qin, B. Changes in eutrophication status of lakes in the middle and lower reaches of the Yangtze River over the past three decades and their influencing factors. J. Lake Sci. 2019, 31, 1510–1524. [Google Scholar]
- Xu, J.; Yin, K.; Liu, H.; Lee, J.H.; Anderson, D.M.; Ho AY, T.; Harrison, P.J. A comparison of eutrophication impacts in two harbours in Hong Kong with different hydrodynamics. J. Mar. Syst. 2010, 83, 276–286. [Google Scholar] [CrossRef]
- Huisman, J.; Codd, G.A.; Paerl, H.W.; Ibelings, B.W.; Verspagen, J.M.; Visser, P.M. Cyanobacterial blooms. Nat. Rev. Microbiol. 2018, 16, 471–483. [Google Scholar] [CrossRef]
- Kim, J.H.; Shin, J.K.; Lee, H.; Kang, J.H.; Cho, K.H.; Lee, Y.G.; Chon, K.; Baek, S.S.; Park, Y. Improving the performance of machine learning models for early warning of harmful algal blooms using an adaptive synthetic sampling method. Water Res. 2021, 207, 117821. [Google Scholar] [CrossRef]
- Zhang, T.; Wang, J.; Chen, J.; Xiang, G.; Long, S. Relationship between phytoplankton community and environmental factors in Puding Reservoir. Environ. Sci. Technol. 2021, 44 (Suppl. S1), 8–19. [Google Scholar]


| Location | Perimeter (m) | Area (10,000 m2) | Roundness Compactness Coefficient (RCC) | Shape Index (SI) | Fractal Dimension (FD) |
|---|---|---|---|---|---|
| Lake B | 3407 | 20 | 2.15 | 0.61 | 0.67 |
| Lake X | 6700 | 16 | 4.72 | 1.24 | 0.88 |
| Lake N | 4126 | 37 | 1.91 | 1.08 | 0.80 |
Disclaimer/Publisher’s Note: The statements, opinions and data contained in all publications are solely those of the individual author(s) and contributor(s) and not of MDPI and/or the editor(s). MDPI and/or the editor(s) disclaim responsibility for any injury to people or property resulting from any ideas, methods, instructions or products referred to in the content. |
© 2025 by the authors. Licensee MDPI, Basel, Switzerland. This article is an open access article distributed under the terms and conditions of the Creative Commons Attribution (CC BY) license (https://creativecommons.org/licenses/by/4.0/).
Share and Cite
Zhou, Q.; Chen, H.; Cheng, B.; Cheng, Y.; Guo, B. A Study of the Effect of Lake Shape on Hydrodynamics and Eutrophication. Sustainability 2025, 17, 1720. https://doi.org/10.3390/su17041720
Zhou Q, Chen H, Cheng B, Cheng Y, Guo B. A Study of the Effect of Lake Shape on Hydrodynamics and Eutrophication. Sustainability. 2025; 17(4):1720. https://doi.org/10.3390/su17041720
Chicago/Turabian StyleZhou, Qingchen, Hong Chen, Baohua Cheng, Yu Cheng, and Bingbing Guo. 2025. "A Study of the Effect of Lake Shape on Hydrodynamics and Eutrophication" Sustainability 17, no. 4: 1720. https://doi.org/10.3390/su17041720
APA StyleZhou, Q., Chen, H., Cheng, B., Cheng, Y., & Guo, B. (2025). A Study of the Effect of Lake Shape on Hydrodynamics and Eutrophication. Sustainability, 17(4), 1720. https://doi.org/10.3390/su17041720