Article

Artisanal Biochar Application: Enhancing Sandy Soil Fertility and Rice (Oryza sativa L.) Productivity

by
Danielle França de Oliveira Torchia
1,*,
Tadeu Augusto van Tol de Castro
1,
Natália Fernandes Rodrigues
1,
Hellen Fernanda de Oliveira da Silva
1,
Riccardo Spaccini
2,
Silvana Cangemi
2,
Orlando Carlos Huertas Tavares
1,
Ricardo Luiz Louro Berbara
1,
Everaldo Zonta
1 and
Andrés Calderín García
1
1
Laboratory of Soil Biological Chemistry, Department of Soils, Federal Rural University of Rio de Janeiro (UFRRJ), Seropédica 23890-000, RJ, Brazil
2
Department of Agricultural Sciences, University of Napoli Federico II, 80055 Portici, Italy
*
Author to whom correspondence should be addressed.
Sustainability 2025, 17(8), 3306; https://doi.org/10.3390/su17083306
Submission received: 14 February 2025 / Revised: 29 March 2025 / Accepted: 2 April 2025 / Published: 8 April 2025

Abstract

:
The application of biochar as a soil amendment has garnered significant interest due to its potential to enhance soil fertility, promote plant growth, and contribute to sustainable agriculture. This study investigated how the structural and morphological characteristics of artisanal biochars from four different brands (AB1, AB2, AB3, and AB4), purchased in supermarkets, influence the development of rice plants in sandy soil. Spectroscopic analyses demonstrated that AB4 exhibited the highest aromaticity (77%), ensuring structural stability, whereas AB2 displayed greater aliphaticity (47%). Morphological characterization revealed that AB4 preserved the cellular structure of the original biomass. The biochar studied and the doses influenced the parameters evaluated in the development of rice plants in sandy soil differently. The biochar with the highest aromatic structure (AB4) promoted an increase in root area, length, and number of bifurcations, as well as in dry and fresh biomass. The nutrient accumulation in the aerial part of the rice plants was greater with the application of AB1 and AB2 at the dose of 10 t ha−1. Chlorophyll fluorescence analysis indicated improved photosynthetic performance in the AB4 treatment, mitigating initial plant stress and optimizing energy use. This study underscores the potential of artisanal biochar to enhance crop productivity and foster sustainable agricultural practices.

1. Introduction

Artisanal biochar is a powerful tool for optimizing crop cultivation and serves as a soil conditioner due to its accessibility and economic feasibility. Biochar consists of a solid material produced through the pyrolysis of biomass in an environment with little or no oxygen [1,2]. The chemical, morphological, and structural characteristics of biochar can provide both short- and long-term benefits when applied to the soil. The predominantly aromatic structure of biochar gives it high resistance to degradation, allowing it to remain in the soil for extended periods and contribute to the accumulation of recalcitrant carbon [3]. Another important characteristic of biochar is its high porosity, which enhances aggregate stability, reduces disaggregation rates, and consequently improves water and nutrient retention in the soil, especially in coarse-textured soils (0.5 to 1.0 mm), which respond better to biochar application [4,5]. However, applying biochar at concentrations above 3% can increase water retention efficiency in clay soils by up to 60% [6]. In loam–clay soils, biochar application at concentrations above 5% reduced pore size, consequently affecting soil hydraulic conductivity [7].
These effects on soil cannot be generalized, as factors such as feedstock and pyrolysis temperature directly influence biochar characteristics and, consequently, its functions in the soil [8]. Wood chip biochar has proven to be more effective at improving soil hydraulic properties than cattle manure biochar due to its higher porosity and surface area [9]. In addition to the benefits, biochar also affects several other physical soil properties, such as swelling/shrinkage, tensile strength, surface area, and crack density [10]. These biochar-induced modifications to the soil indirectly impact plant development, as they alter cultivation conditions. Adding less than 5% biochar improved germination, yield, and root development in halophytes such as Sesbania and coastal mallow [11]. The application of 2% husk-based biochar increased biomass production in sugarcane plants grown in sandy soil [12]. A dose of 30 t ha−1 of coconut shell biochar increased Zea mays biomass production by 90%, while 10% bamboo biochar promoted soybean growth [13]. Biochar has also been shown to positively influence root morphology and plant photosynthetic efficiency. Studies have demonstrated that biochar can increase root biomass and improve root architecture, facilitating water and nutrient uptake [14]. Moreover, studies indicate that biochar can enhance plant light-use efficiency, boosting photosynthetic activity and biomass production [15].
In this context, the use of artisanal biochars has increased in recent years, particularly those produced by regional farmers using traditional methods. Artisanal biochars are often derived from locally available biomass, such as wood residues and sewage sludge. However, criteria for their use in terms of material quality have not yet been established. There is still limited evidence of their direct effects on plants when applied to fragile sandy soils.
The soils used by small-scale farmers in the state of Rio de Janeiro, Brazil, are predominantly sandy, low in fertility, and highly susceptible to erosion, classifying them as fragile. Currently, the most commonly used agricultural practices include liming, no-tillage systems, and the application of fertilizers containing labile organic matter. However, the effectiveness of these practices remains under debate, as no-tillage systems require approximately 10 to 15 years to accumulate significant levels of soil organic carbon [16].
Given this context, this study aimed to investigate the relationship between the structural and morphological characteristics of artisanal biochars and their effects on plants grown in fragile sandy soils. The hypothesis is that biochars from different brands and doses influence the development of rice plants in sandy soil in different ways. Four different commercially available brands of artisanal biochar were analyzed and three different doses: 10 t ha−1, 20 t ha−1 e 30 t ha−1. The biochars were characterized using nuclear magnetic resonance (NMR) spectroscopy to determine their structure and scanning electron microscopy (SEM) to examine their morphology. They were then applied to sandy-textured Planosol for the cultivation of Oryza sativa L. (cv. Nippombare) rice plants. The parameters of nutrient accumulation in the plant’s aerial part, effects on root morphology, and photosynthetic parameters were evaluated.

2. Materials and Methods

2.1. Obtaining and Treatment of the Studied Biochars

The biochars used in this study were purchased from supermarkets in the state of Rio de Janeiro, Brazil. Four different brands were acquired, designated as AB1, AB2, AB3, and AB4, to protect the manufacturers’ identities. The biochars were produced by small-scale producers in the state of Rio de Janeiro, Brazil. All biochars were produced from eucalyptus reforestation wood. The manufacturers did not specify the exact production temperature; however, since the biochars were produced in artisanal kilns, the temperature likely ranged between 270 and 380 °C. These biochars were chosen because they are easily accessible to small producers in the state of Rio de Janeiro. According to the most recent census, family farming represents 76.8% of agricultural establishments in Brazil. However, in the southeast region (where the state of Rio de Janeiro is located), family farming accounts for approximately 34% of production and sales in the rural agroindustry sector [17]. The biochars were ground in a ball mill for application. Chemical characterization was performed by [18] and is found in Table S1 (Supplementary Materials). These biochars were selected because they are easily accessible to small producers in the study region and share chemical and spectroscopic characteristics with biochars previously analyzed by our group [8,18].

2.2. Characterization of the Biochars

2.2.1. Structural Analysis of Biochar

Cross-polarization/magic angle spinning (CP/MAS) 13C nuclear magnetic resonance (NMR) analysis was performed at the NMR Research Center CERMANU at the University of Napoli Federico II (Italy). Spectral acquisition specifications are detailed in the Supplementary Materials. The spectra were processed using the ACD/Processor 2020.1.1 software (ACD/Labs), in which baseline correction and smoothing (3rd degree and 25 points) were applied. All spectra were integrated into the following regions:
(1)
0–45. ppm (CAlkyl-H,R);
(2)
45–60. ppm (CAlkyl-O,N);
(3)
60–90. ppm (CAlkyl-O);
(4)
90–110. ppm (CAlkyl-di-O);
(5)
110–145. ppm (CAromatic-H,R);
(6)
145–160. ppm (CAromatic-O,N);
(7)
160–190. ppm (CCOOH);
(8)
190–220. ppm (CC=O).
The hydrophobicity index and the aromaticity and aliphaticity levels of the biochars were calculated using the following formulas [19]:
Aromaticity = [(110–145 ppm) + (145–160 ppm)]
Aliphaticity = [(0–45 ppm) + (45–60 ppm) + (60–90 ppm) + (90–110 ppm) + (160–190 ppm) + (190–220 ppm)]
Hydrophobic index = [(0–45 ppm) + (45–60 ppm) + (110–145 ppm) + (145–160 ppm)]/[(60–90 ppm) + (90–110 ppm) + (160–190 ppm) + (190–220 ppm)].
The spectra were processed using Unscrambler X 10.4 software (Camo Software AS, Oslo, Norway). First, the moving average smoothing was applied, followed by baseline correction. The chemometric analyses, including multivariate curve resolution (MCR) and principal component analysis (PCA), were conducted.

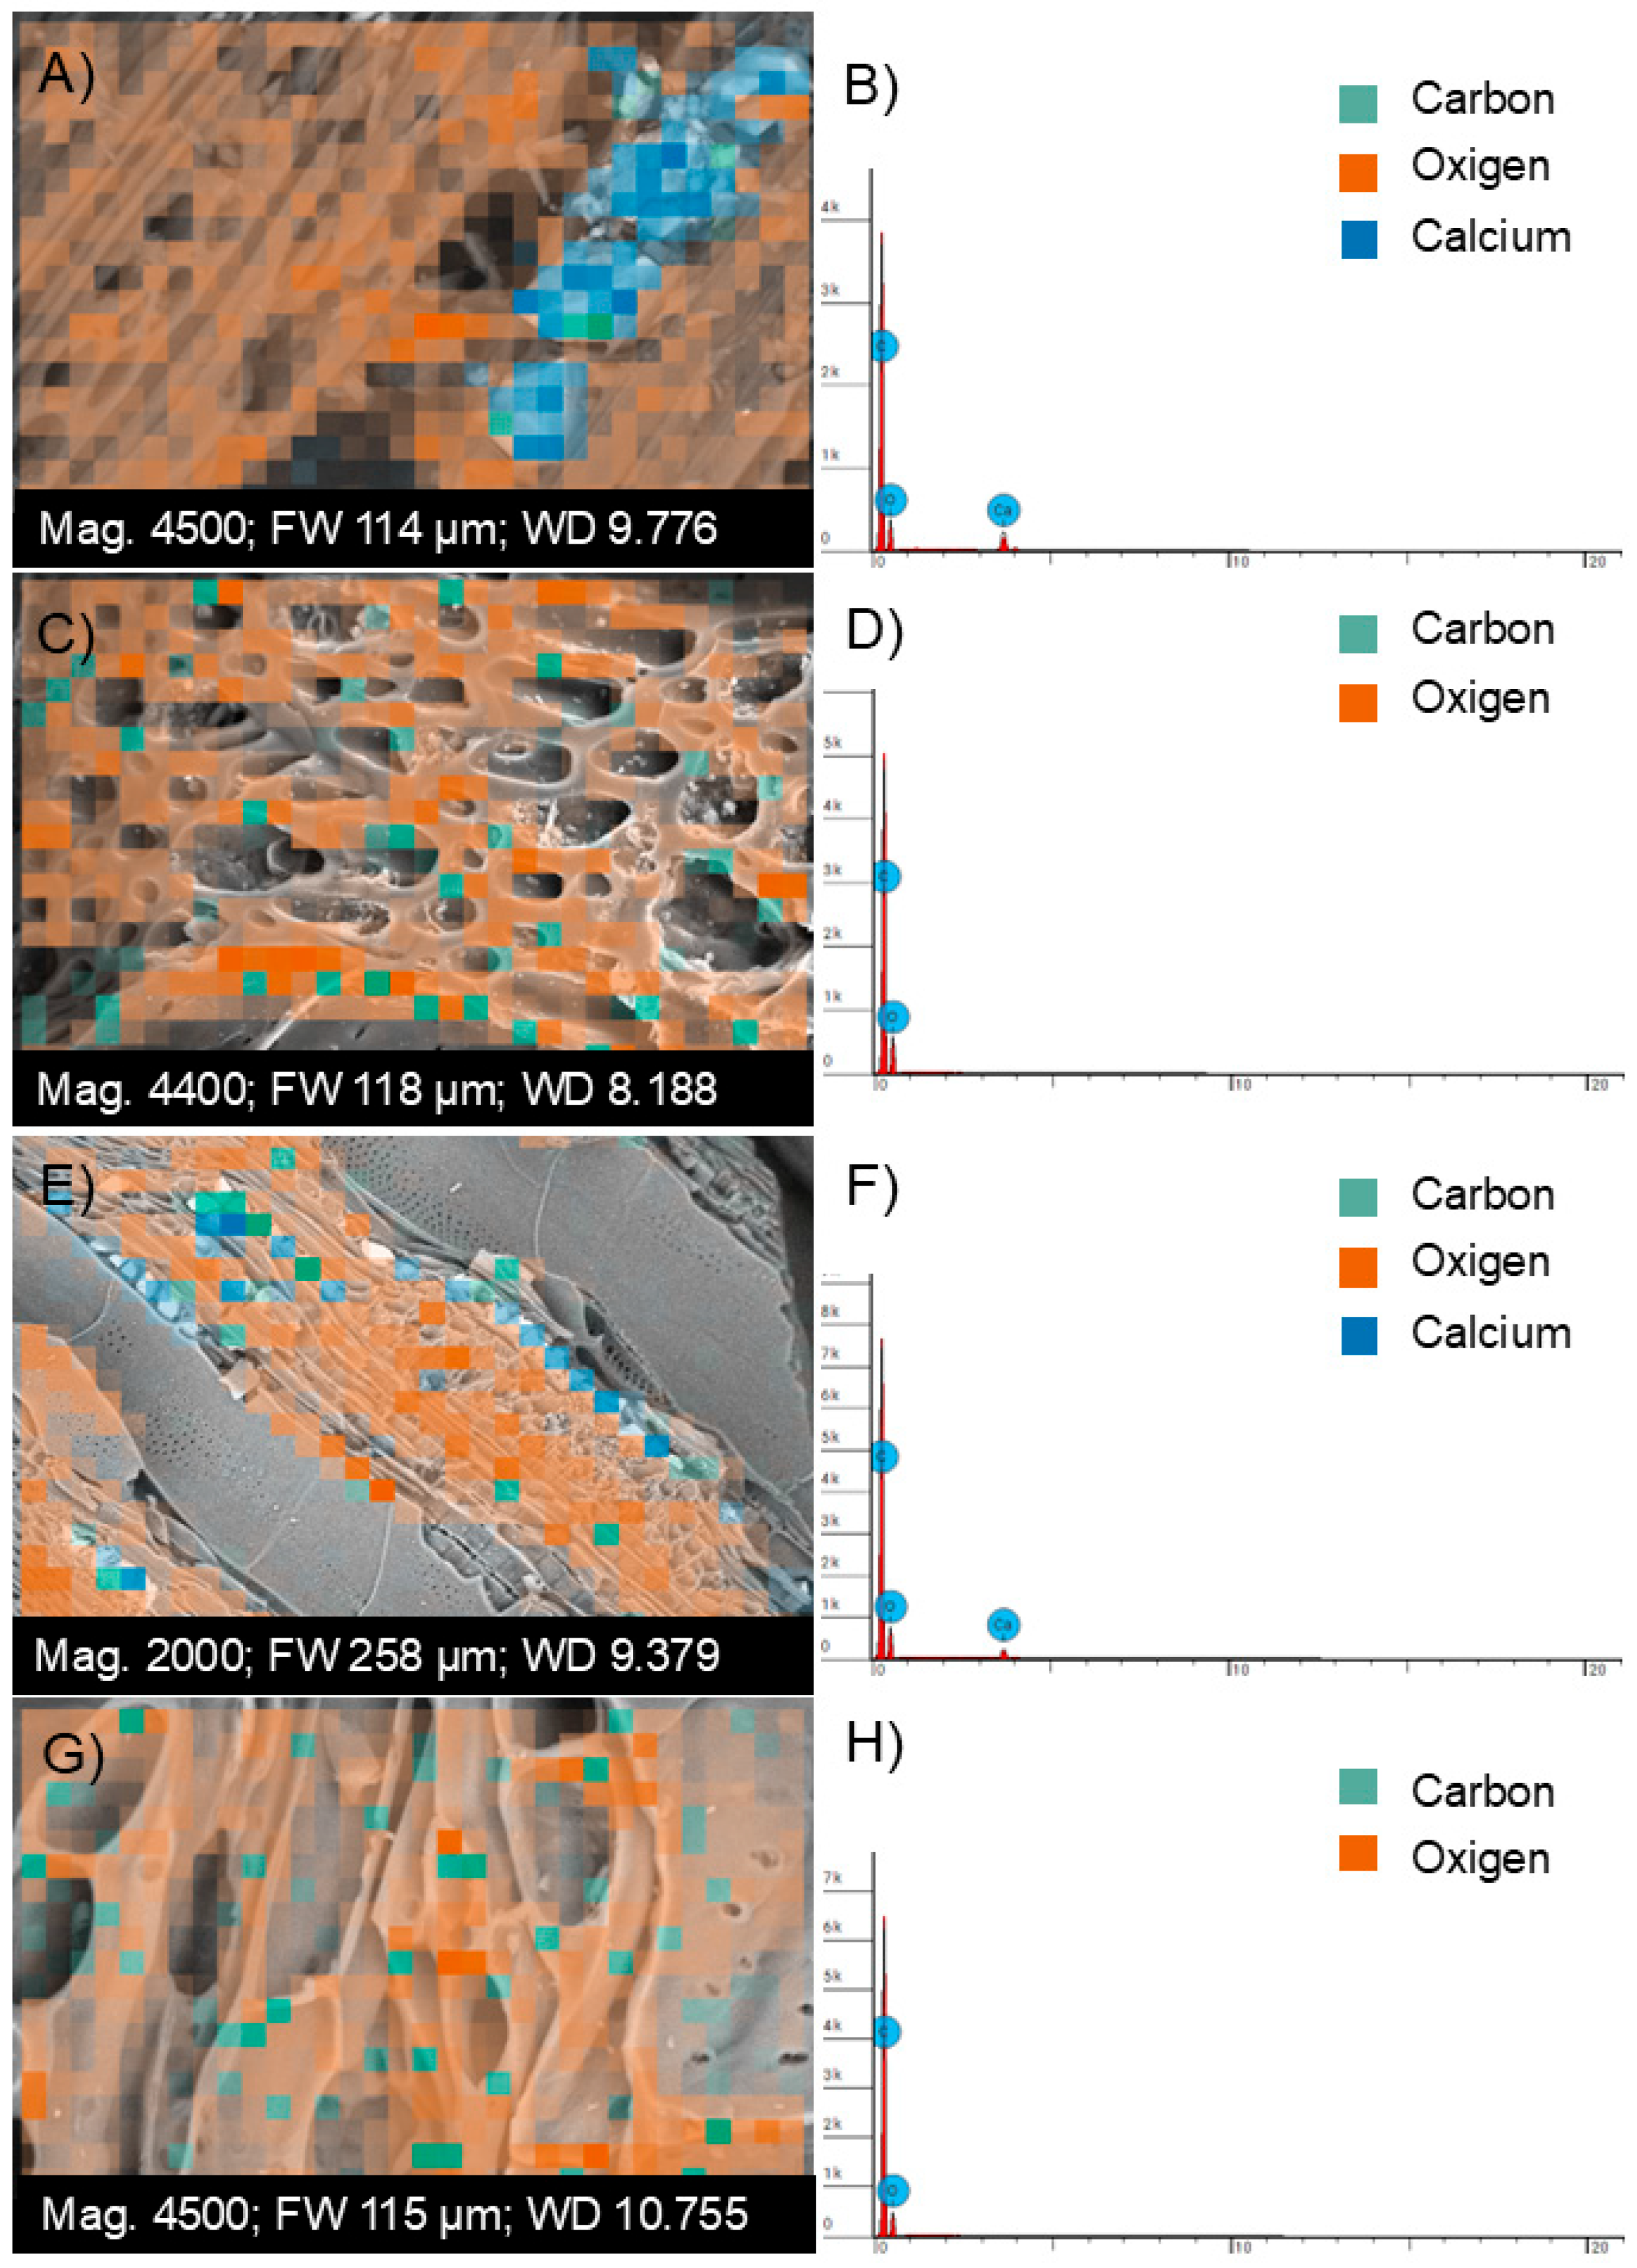
2.2.2. Characterization of Biochar by Energy Dispersive Spectroscopy (EDS) Microscopy

The morphological characterization of biochar was performed using a Phenom ProX Desktop (ThermoFisher, Waltham, MA, USA) high-resolution scanning electron microscope (SEM) equipped with an energy-dispersive X-ray spectroscopy (EDS) detector. Point analysis of the elements present in the biochar and EDS mapping were carried out. The samples were fixed onto stubs with carbon tape. Before being inserted into the device, an N2 jet was applied to the sample to eliminate possible residues. The image was acquired at 4700× g magnification, with FW: 109 μm, Mode: 15 kV (Point), WD: 9.5 mm, Detector: BSD Full. To determine the elements present on the biochar surface, spot, line scan, region, and map analyses were conducted.

2.3. Bioactivity Experiment with Rice Plants

2.3.1. Quantification of Biomass Production and Growth

For the bioactivity experiment, a fragile sandy soil classified as Planossolo Háplico by the Brazilian Soil Classification System (SIBCS) was collected in the city of Seropédica, Rio de Janeiro, Brazil. The soil was sieved through a 2 mm sieve and limed with dolomitic limestone (76% PRNT) according to the requirements for rice cultivation outlined in the Fertilization and Liming Manual for the State of Rio de Janeiro [20]. The chemical characterization was previously performed by [18] and is found in Table S2 of the Supplementary Materials.
To test the efficiency of biochars on plant development, rice plants (Oryza sativa L. cv. Nipponbare) were planted in soil and placed in a greenhouse with controlled temperature (22–26 °C) and humidity (70%). First, the seeds were washed with 2% sodium hypochlorite solution for 10 min and rinsed 10 times with distilled water. The biochar treatments were applied to the soil, which was homogenized and placed in 2 kg pots.
Four artisanal biochars (AB1, AB2, AB3, and AB4) were purchased from local commercial vendors, and three different application rates (10 t ha−1, 20 t ha−1, and 30 t ha−1) were evaluated. The doses were selected according to previous studies on biochar application in sandy soil available in the literature [18,21,22].
Two phosphorus supplementations (31 mg kg−1 P2O5) were applied using a mixture of 2/3 monobasic potassium phosphate (KH2PO4) and 1/3 anhydrous dibasic potassium phosphate (K2HPO4) at 21 and 26 days after sowing (DAS). At 32 DAS, plant samples were collected, and the roots, stems, and leaves were separated. The roots were weighed and stored in 70% ethanol for later morphological analysis. The leaves and stems were weighed to determine fresh biomass and then dried in an oven at 60 °C to obtain dry biomass.

2.3.2. Quantification of Nutrients Present in the Aerial Biomass of Rice Plants

The dry biomass of the sheet and sheath was too low for individual analysis; therefore, they were evaluated together as the aerial part. After the drying process, acid digestion of the aerial part of the plants was performed using the adapted EPA 3050 method. A total of 0.25 g of the sample was placed into the digestion tube, and 5 mL of nitric acid (HNO3 with suprapure grade) was added. The samples were then placed in the digestion block for 15 min at 95 °C. After this, an additional 10 mL of nitric acid was added, and the samples were returned to the digestion block for another 2 h. Subsequently, the samples were removed from the digestion block, and 8 mL of hydrogen peroxide (H2O2) was added. After cooling to room temperature, the final volume was adjusted to 50 mL with distilled water, followed by filtration.
The determination of Ca, Mn, Cu, Fe, and Mg concentrations in the samples was performed using a high-precision atomic absorption spectrometer (VARIAN 55B, Lanco, Sparta, MI, USA). The determination of K was carried out using a flame photometer (DIGIMED DM-62, Sao Paulo, Brazil). The concentration of P was determined using the colorimetric method according to Malavolta [23].

2.3.3. Analysis of the Photosynthetic Parameters of Rice Plants

Before measurement, the leaves were dark-adapted for at least 30 min. Chlorophyll a fluorescence parameters were evaluated using a Handy Plant Efficiency Analyzer (Hansatech, King’s Lynn, UK). The excitation light source consisted of red light at a wavelength of 650 nm and an intensity of 3000 μmol m−2 s−1, emitted by three light-emitting diodes. Measurements were performed at 7 a.m., with each assessment lasting 1 s. Fluorescence data were collected at two time points: 26 and 32 days after sowing (DAS). A transient or polyphasic fluorescence emission kinetics curve (OJIP) was generated to normalize the fluorescence signals to relative variable fluorescence using the equation: Vt = (Ft − Fo)/(FM − Fo), where Vt represents the relative variable fluorescence at time t, Fo is the initial fluorescence, Ft is the fluorescence at time t, and FM is the maximum fluorescence. The JIP test parameters, corresponding to the fluorescence transient steps (O, J, I, and P), were determined following the JIP test algorithm described in the literature [24].

2.3.4. Root Morphology

The rice plant root systems were uniformly arranged in a thin layer of water on a clear acrylic tray. Scanning of the plants was performed at 600 dpi using an Epson Expression 10000XL scanner (Suwa, Nagano, Japan), equipped with an additional light source (TPU) [25]. The root images were converted into an 8-bit grayscale format for processing. Each image was individually analyzed using the software WinRHIZO Arabidopsis 2022 (Regent Instruments Inc., Quebec City, QC, USA), with five root parameters quantified: root length (m plant−1), root surface area (m2 plant−1), average root diameter (mm root−1 plant−1), root volume (m3 plant−1), root branching (number plant−1), and root tip count (number plant−1).

2.3.5. Statistical Analysis of Data

The experimental design adopted was completely randomized in a factorial scheme with an additional treatment and seven replications ((4 × 3 + 1) × 7). Statistical analyses were performed using the R statistical software version 4.1.2. The results obtained from each analysis were subjected to analysis of variance (ANOVA) to evaluate the effects of the treatment factor (Factor A), dose factor (Factor B), and their interaction (A × B). The F-test was used to assess the significance of the effects (p < 0.05). To verify the assumptions of ANOVA, the Shapiro–Wilk test (p > 0.05) was performed to assess data normality, and the Bartlett test (p > 0.05) was used to evaluate the homogeneity of variances. The Tukey’s HSD test (p < 0.05) was conducted for multiple comparisons between the levels of Factors A and B, the Dunnett test (p < 0.05) was used to compare the treatments with the control, and the interaction breakdown was performed when the A × B interaction was significant. Different lowercase letters within the same biochar treatment indicate significant differences among application rates, while uppercase letters denote significant differences among biochar types within the same application rate (Tukey’s test, p < 0.05). Asterisks (*) represent significant differences between the control and the biochar treatments according to Dunnett’s test.

3. Results

3.1. Structural Analysis by CP MAS 13C NMR and Chemometric Analysis

The spectral characteristics of the biochars obtained by the CP MAS 13C NMR technique, as well as the results of the chemometric analyses, are presented in Figure 1. The biochars exhibited spectral features similar to those reported in the literature [8]. The AB1, AB3, and AB4 biochars showed low contributions of aliphatic peaks (0–110 ppm) (Figure 1A). However, the AB2 biochar exhibited more prominent peaks in this same region, particularly the peaks at 20.4 and 28.7 ppm, corresponding to non-substituted aliphatic carbons (alkyl C).
On the other hand, the aromatic region (110–160 ppm) contributed significantly to the structural characteristics of all the biochars, with peaks at 126.3 ppm, 126.0 ppm, 123.4 ppm, and 126.6 ppm for AB1, AB2, AB3, and AB4, respectively.
Figure 1B shows the results of the chemometric analysis of 13C NMR. In the scores, PCA represents 99% of the total variance explained, with AB1, AB3, and AB4 grouped in the positive values of PC-1 (74% of the total variance explained) and AB2 grouped in the negative values. This difference is also evident in the loadings, where the peaks corresponding to the aliphatic region of AB2 are shown in the negative part of PC-1 (blue line), distinguishing it from the others.
The relative quantification of carbon types in the different biochar samples is shown in Figure 1C. The biochars are predominantly composed of CArom-H,R, with this group making the greatest contribution to AB4 (69%). AB2 contained more aliphatic carbons, as previously highlighted in the analyses. These characteristics gave AB2 a higher aliphaticity (47%) and AB4 a higher aromaticity (77%) and, consequently, a higher hydrophobicity index (7) (Figure 1D).

3.2. Morphological Characterization of Biochar by Scanning Electron Microscopy (SEM) and Energy-Dispersive X-Ray Spectroscopy (EDS)

The SEM images (Figure 2) show the characteristic morphology of the biochars. At lower magnifications (Figure 2A,C,E,G), it is possible to observe macroporosity in all biochars and well-preserved structures, especially in AB2 and AB4. These features are derived from the original plant anatomy of the raw material used in the production of each biochar. Macropores are essential for vital soil functions, such as aeration and hydrodynamics, as well as for root development, and they serve as a habitat for microorganisms [1]. At higher magnifications (Figure 2B,D,F,H), differences in the texture of the biochars can be observed, along with the presence of micropores and mineral residues. These residues may arise from contaminants or incomplete carbonization and can limit pore access, reducing biochar efficiency in water and nutrient retention [26].
Porosity in biochar forms during the temperature increase in the pyrolysis process, where there is a rearrangement of fused-ring carbons. These carbons are stacked and form lamellar crystals that are randomly oriented, leaving voids between them [27]. On the other hand, the presence of nutrients associated with minerals in the pores may increase the potential of biochar as a fertilizer. Since it is handcrafted biochar, the exact pyrolysis temperatures used in its production are not known. However, the morphological characteristics suggest that there was preservation of the plant cellular structure in AB2 and AB4, which is typical of biochars subjected to more controlled temperatures (350–500 °C) [28].
The EDS technique was combined with SEM to determine the elements present on the surface of the biochars (Figure 3). All the biochars exhibited a predominance of C and O. The high presence of O may be associated with functional groups such as hydroxyls, carbonyls, and carboxyls, which play crucial roles in interactions with ions and molecules in the soil [27]. Calcium (Ca) concentration points were found in the pores of the AB1 and AB3 biochars (highlighted in blue). Ca may be associated with O in the form of carbonates or Ca oxides formed during the pyrolysis process, which could serve as acidic additives for the soil [29]. The SEM and EDS results are consistent with this observation. The literature [30] reported calcium in the pores of biochar made from tree chips (Schleichera oleosa) produced at 450 °C, and Ca was also evidenced in samples from Terra Preta [31].

3.3. Effects of Biochar Application on Fresh and Dry Mass of the Root, Sheath, and Leaf of Rice Plants

The results demonstrate that the studied artisanal biochars and doses differentially influence the fresh and dry biomass production of rice plants (Figure 4). In the analysis of root fresh biomass (Figure 4A), no statistical differences were observed among application doses (uppercase letters, p > 0.05); however, the lowest dose (10 t ha−1) was sufficient to enhance root fresh biomass production. Regarding biochar types (lowercase letters), significant variations were detected. AB4 yielded the highest root fresh biomass (3.61 g), while AB1, AB2, and AB3 resulted in means of 3.35 g, 3.12 g, and 2.91 g, respectively. Compared to the control, AB2 and AB3 significantly reduced root fresh biomass (p < 0.05). For root dry biomass (Figure 4B), treatments did not differ statistically from the control. Among biochars, AB4 remained the most efficient (0.31 g), followed by AB2, AB1, and AB3 with closely grouped means of 0.27 g, 0.26 g, and 0.25 g, respectively. The 10 t ha−1 dose again maximized root dry biomass, yielding 0.32 g (AB4), 0.27 g (AB1), 0.27 g (AB3), and 0.25 g (AB2).
In sheath fresh biomass (Figure 4C), AB4 produced significantly higher values (2.12 g) compared to AB1 (1.72 g), AB2 (1.80 g), and AB3 (1.78 g), though no dose effect was observed. The control exhibited the highest sheath fresh biomass (2.28 g). For sheath dry biomass (Figure 4D), a significant interaction between factors (p < 0.05) was detected. The 10 t ha−1 dose promoted the highest production across all biochars: AB1 (0.24 g), AB2 (0.23 g), AB3 (0.25 g), and AB4 (0.25 g), with no differences from the control.
In leaf fresh biomass (Figure 4E), AB4 achieved the highest mean (1.51 g), while AB1 (1.23 g), AB2 (1.31 g), and AB3 (1.26 g) showed similar results. The highest dose (30 t ha−1) increased production for AB4 (1.62 g) but reduced it for AB1 (1.20 g). A parallel trend was observed in leaf dry biomass (Figure 4F), where AB4 (0.37 g) significantly outperformed other biochars (0.31 g for AB1, AB2, and AB3).

3.4. Nutrient Contents in the Aerial Parts of Rice Plants

The nutrient contents in the aerial parts of the rice plants were influenced differently by each biochar and dose (Figure 5). The phosphorus (P) content (Figure 5A) showed a significant difference in the interaction between the factors (biochar × dose). At the 10 t ha−1 dose, the highest P levels were obtained with the application of AB2 (23.7 g kg−1), AB1 (23.3 g kg−1), and AB3 (19.7 g kg−1), which were statistically similar. AB4 resulted in the lowest level of 12.1 g kg−1. At the 20 t ha−1 dose, the behavior was statistically similar, with higher P accumulation from AB1 (23.9 g kg−1), AB2 (22.5 g kg−1), and AB3 (19.6 g kg−1) and lower accumulation from AB4 (13.7 g kg−1). At the highest dose (30 t ha−1), AB1 and AB2 were statistically equal, resulting in P accumulations of 24.3 g kg−1 and 23.5 g kg−1, respectively. The application of AB4 and AB3 resulted in P levels of 14.9 g kg−1 and 14.5 g kg−1. Within each biochar factor, only AB3 and AB4 showed statistical differences between doses. For AB3, the highest P content was achieved with the 10 t ha−1 dose (19.7 g kg−1), with lower values at 20 and 30 t ha−1 (13.7 and 14.4 g kg−1). In the AB4 treatment, the 20 t ha−1 dose statistically resulted in the highest P accumulation (19.6 g kg−1). All biochars were statistically more efficient than the control in accumulating P in the aerial parts of the rice plants.
For potassium (K) concentrations (Figure 5B), there were statistical differences in the factors individually. The biochars AB3, AB2, and AB1 were statistically similar, with K accumulation of 31.7 g kg−1, 31.3 g kg−1, and 31.2 g kg−1, respectively. AB4 resulted in a K concentration of 29.1 g kg−1 in the aerial parts. Regarding doses, 30 t ha−1 was statistically more efficient than the 10 t ha−1 dose, resulting in the accumulation of 31.6 g kg−1 of K. The treatments were statistically more efficient than the control.
The calcium (Ca) content in the aerial parts of the rice plants (Figure 5C) was also influenced by the application of biochars and doses, with a significant difference in the interaction between the factors. At the 10 t ha−1 dose, K accumulation was statistically similar in AB2, AB1, and AB3 (8.3 g kg−1, 8.2 g kg−1, and 7.8 g kg−1), while AB4 accumulated 6.9 g kg−1. At the 20 t ha−1 dose, 7.9 g kg−1 of K accumulated with AB1, which was statistically different from AB4 (6.9 g kg−1). At the 30 t ha−1 dose, AB1 accumulated statistically more K than the others (8.9 g kg−1). AB4, AB2, and AB3 did not differ statistically (7.4 g kg−1, 7.3 g kg−1, and 6.8 g kg−1). For AB1, the highest dose, 30 t ha−1 (8.9 g kg−1), had significantly higher accumulation than 20 t ha−1 (7.9 g kg−1). For the application of AB2 and AB3, the highest K content was obtained at the 10 t ha−1 dose, with 8.3 g kg−1 and 7.8 g kg−1, respectively. The lowest content occurred at the highest dose, with accumulation of 7.3 g kg−1 (AB2) and 6.7 g kg−1 (AB3). For AB4, the highest dose was needed to achieve the statistically highest K accumulation (7.4 g kg−1).
For magnesium (Mg) concentrations, the treatment results were not statistically different from the control. Among the doses, 20 t ha−1 and 30 t ha−1 had statistically similar results, with accumulations of 3.7 mg kg−1 and 3.5 mg kg−1, respectively. AB2 and AB3 promoted the highest Mg content of 3.7 mg kg−1 in the aerial parts. AB1 and AB4 also resulted in the same concentration of 3.2 mg kg−1.
The results for copper (Cu) content (Figure 5E) showed a statistical interaction between the dose and biochar factors. At the lowest dose (10 t ha−1), AB1 was more efficient in accumulating Cu (10.5 mg kg−1), followed by AB2 (7.9 mg kg−1). AB3 and AB4 accumulated Cu at the lowest concentrations (4.7 mg kg−1 and 4.2 mg kg−1). A similar pattern was found at the 20 t ha−1 dose, with the highest Cu content in AB1 (12.0 mg kg−1) and the lowest in AB3 and AB4 (4.8 mg kg−1 and 3.5 mg kg−1). At the 30 t ha−1 dose, the highest Cu content was obtained with the application of AB1 (12.3 mg kg−1). In the biochar factor, AB1 achieved the highest result with doses of 30 t ha−1 and 20 t ha−1 (12.3 mg kg−1 and 12.2 mg kg−1) and the lowest with 10 t ha−1 (10.5 mg kg−1). For AB2, the highest result was with the lowest dose, 10 t ha−1 (7.9 mg kg−1), and the lowest with 30 t ha−1 (5.6 mg kg−1). The doses of AB3 did not differ statistically, resulting in an average accumulation of 4.5 mg kg−1. With AB4, the highest Cu content was obtained with the 30 t ha−1 dose (5.7 mg kg−1).
Manganese (Mn) concentrations were statistically higher with the application of AB4 (79.1 mg kg−1), while AB1, AB2, and AB3 did not differ statistically (56.0 mg kg−1, 52.0 mg kg−1, and 44.5 mg kg−1). The 10 t ha−1 dose resulted in the highest Mn accumulation (70.6 mg kg−1).
For iron (Fe), there was an interaction between the factors. At the 10 t ha−1 dose, AB2 (160.4 mg kg−1) and AB1 (155.7 mg kg−1) resulted in significantly higher Fe content compared to AB3 (123.6 mg kg−1). At the 20 t ha−1 and 30 t ha−1 doses, only AB1 showed a statistically higher performance (153.2 mg kg−1 and 191.6 mg kg−1), while AB4 showed the lowest content (113.9 mg kg−1 and 111.6 mg kg−1). The biochars AB3 and AB4 did not show statistical differences between doses. AB1 achieved the highest Fe concentration at the 30 t ha−1 dose (191.6 mg kg−1) and statistically lower concentrations at the 10 t ha−1 and 20 t ha−1 doses (155.7 mg kg−1 and 153.2 mg kg−1). For AB2, the highest concentration was obtained at the lowest dose, 10 t ha−1 (160.5 mg kg−1), and the lowest concentration at the highest dose, 30 t ha−1 (111.6 mg kg−1).

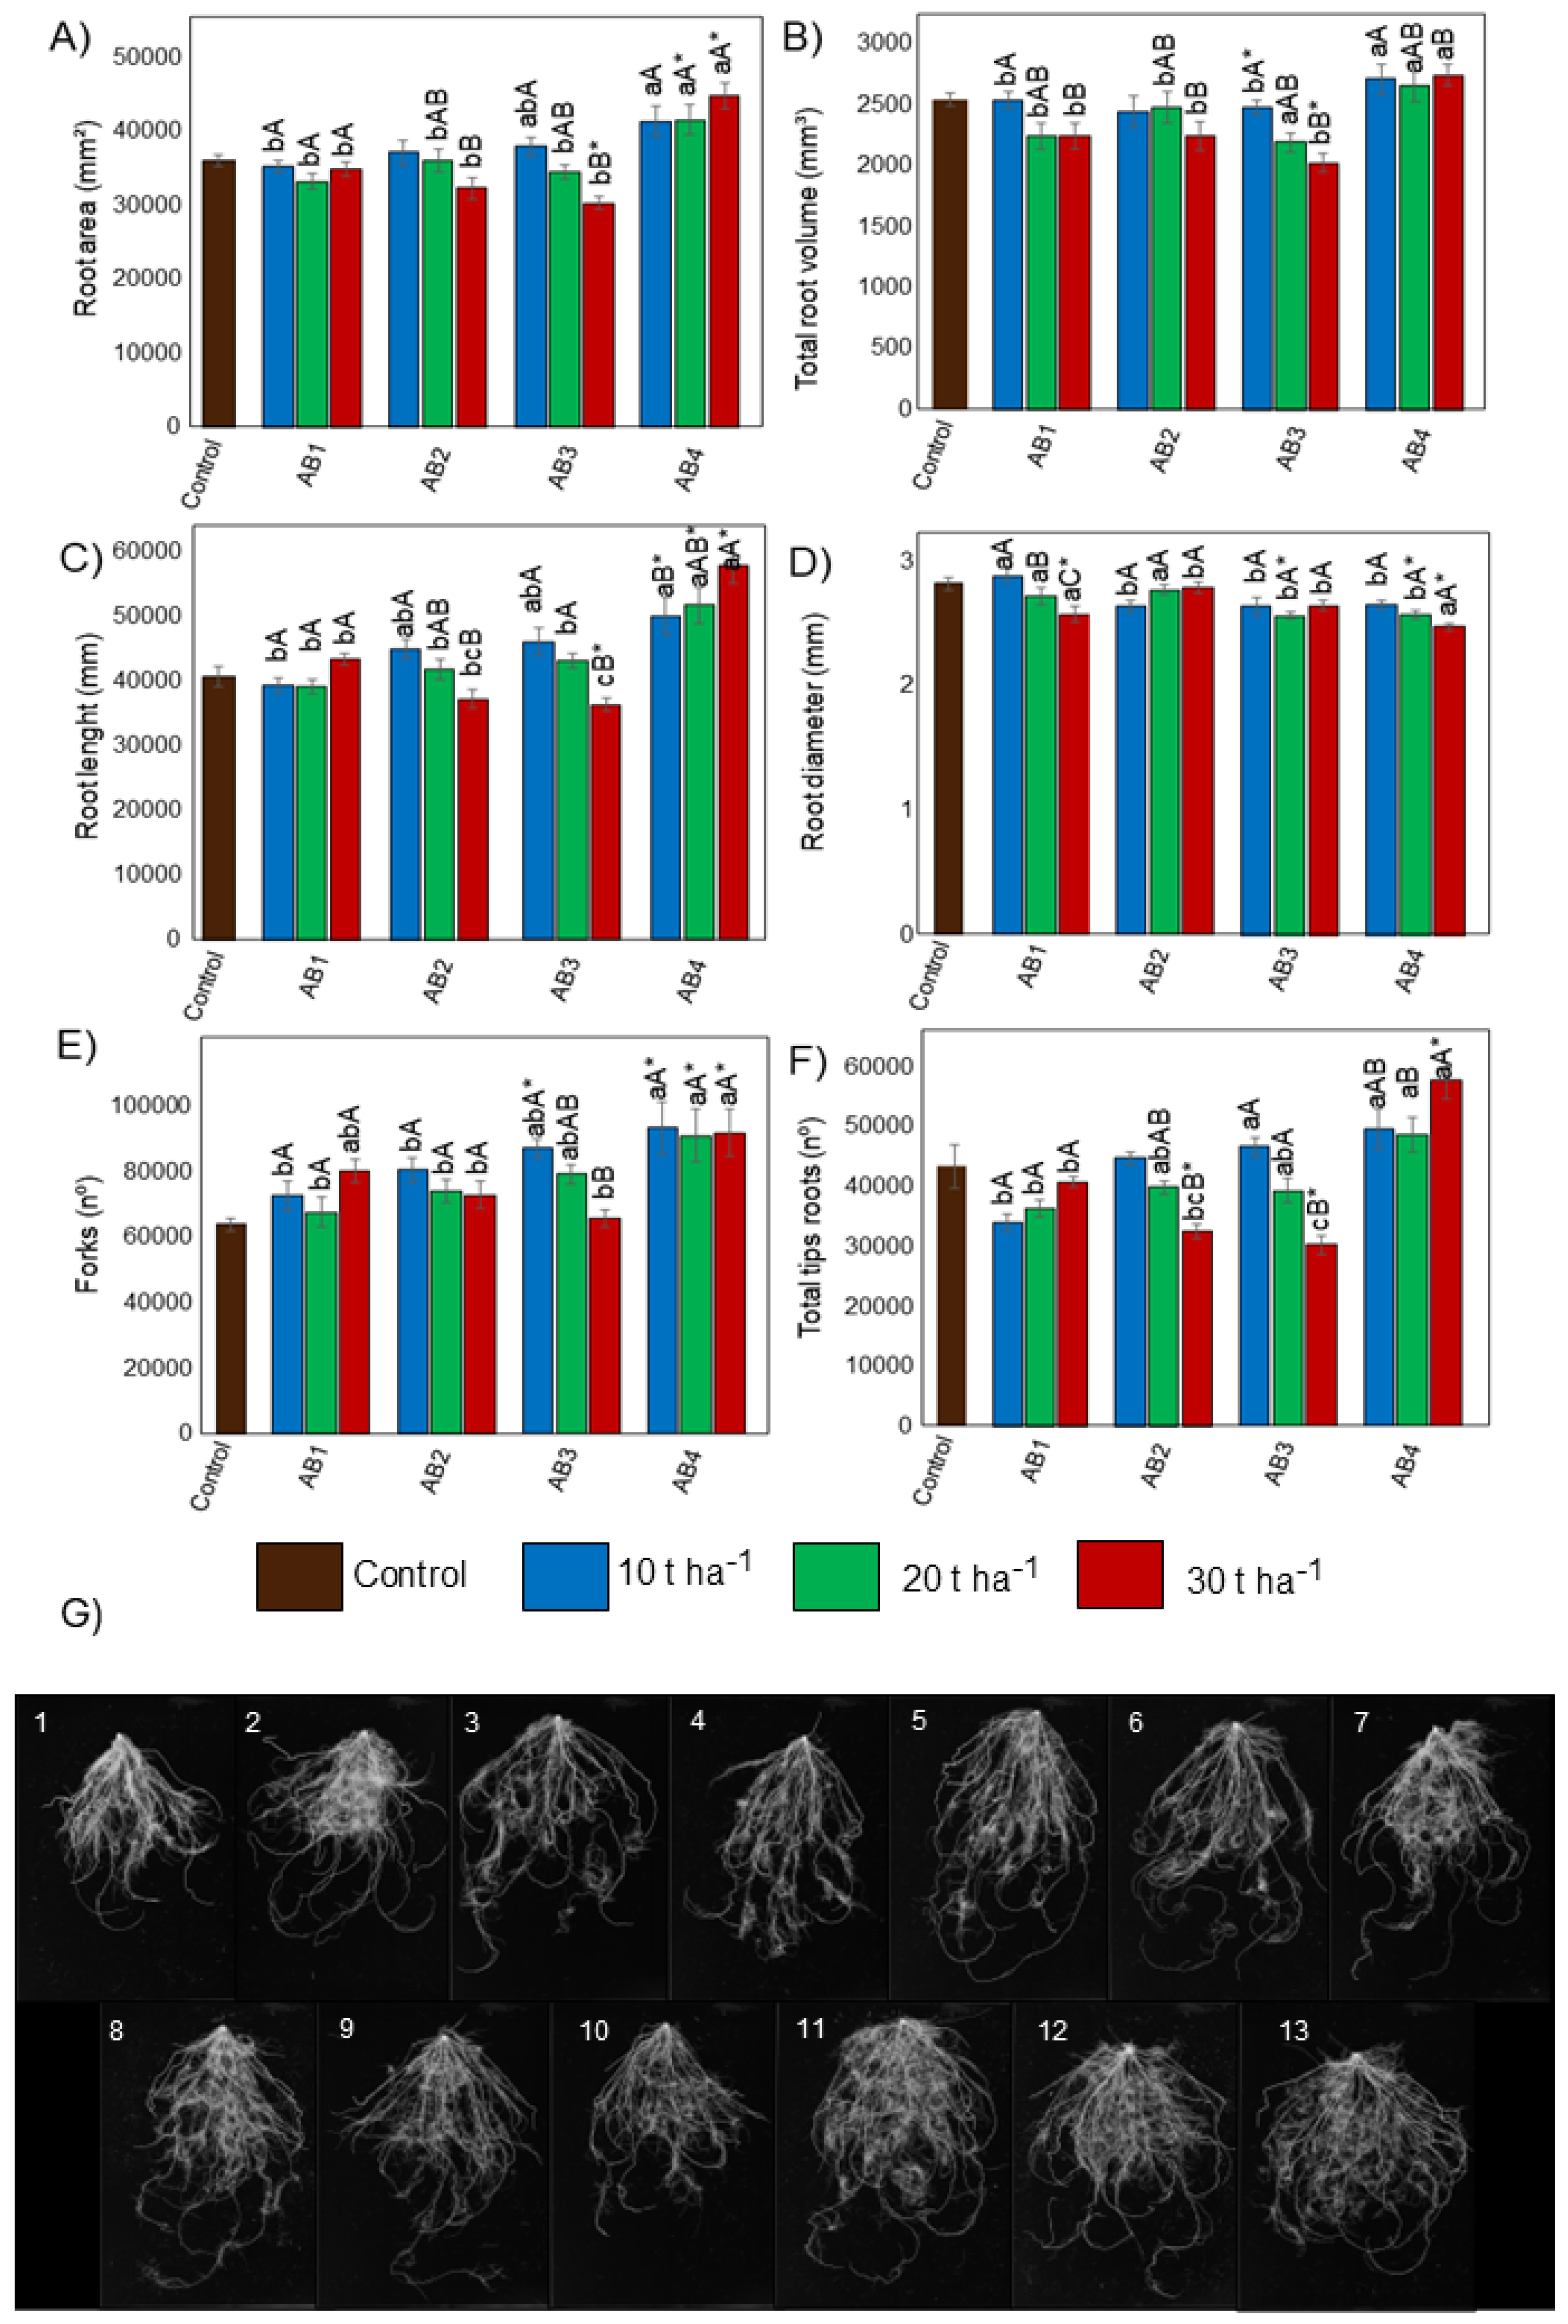
3.5. Effects of Biochar Application on Root Morphology

The application of different handmade biochars at varying doses altered the morphology of rice plant roots (Figure 6). For all the parameters evaluated, except for total root volume, the interaction between factors had a significant influence.
For total root area (Figure 6A), at the 10 t ha−1 dose, AB4 gave the highest result (41.1 mm2), compared to AB1, which resulted in 35.2 mm2. At the 20 t ha−1 and 30 t ha−1 doses, the behavior was similar. AB4 resulted in 41.3 mm2 at 20 t ha−1 and 44.4 mm2 at 30 t ha−1, while the smallest area was found with the application of 20 t ha−1 of AB1 (33.1 mm2) and 30 t ha−1 of AB3 (30.5 mm2). There was no statistical difference between AB1 and AB4 across doses. AB2 and AB3 had the highest results at 10 t ha−1 (37.0 mm2 and 37.7 mm2, respectively). Regarding total root volume, increasing the dose resulted in smaller volumes (an average of 2.3 mm3 at the 30 t ha−1 dose). The highest volume was obtained at the lowest dose (10 t ha−1), with 2.5 mm3. The variation in biochar did not result in statistical differences for this parameter.
For total root length, AB4 showed the greatest results at all doses. At the 10 t ha−1 dose, AB4 resulted in a length of 49.7 mm, while AB1 resulted in 39.1 mm. At the 20 t ha−1 dose, AB4 reached 51.4 mm in root length. The other biochars showed statistically similar growth with 42.8 mm for AB3, 41.6 mm for AB2, and 39.1 mm for AB1. At the 30 t ha−1 dose, AB4 resulted in 57.4 mm of root length, while AB3 had the lowest result of 35.7 mm. AB1 did not show a statistical difference across doses. AB2 and AB3 achieved the best results with the 10 t ha−1 dose (44.7 mm and 45.8 mm, respectively).
For root diameter, there was a different pattern compared to the other parameters, with the lowest results observed with AB4. At the 10 t ha−1 dose, only AB1 had the highest diameter (2.9 mm). At the 20 t ha−1 dose, AB2 and AB1 resulted in 2.7 mm, while AB3 and AB4 had 2.5 mm. At the highest dose, AB2 again had the largest diameter of 2.8 mm. The biochars AB2, AB3, and AB4 did not differ statistically between doses. In the AB1 treatment, the 10 t ha−1 dose presented the largest diameter, 2.8 mm.
For the number of forks, the 10 t ha−1 dose performed best with AB4 (92,565.0 forks). The smallest number for this dose was obtained with AB1 (72,224.7 forks). At the 20 t ha−1 dose, the behavior was similar to the previous one, with AB4 showing the highest number (90,121.7 forks) and AB1 the lowest (67,391.4 forks). At the 30 t ha−1 dose, AB4 resulted in 91,069.8 forks, while AB3 had the lowest result with 65,654.8 forks. Only AB3 showed statistical differences between doses, with 86,306.4 forks at the 10 t ha−1 dose, 78,586.8 forks at the 20 t ha−1 dose, and 65,654.8 forks at the 30 t ha−1 dose.
The number of tips was strongly benefited by the application of biochars, especially at the 10 t ha−1 dose, with the highest results for AB4 (49,114.7), AB2 (44,469.1), and AB3 (43,761.4). At the 20 t ha−1 and 30 t ha−1 doses, AB4 showed statistically better results than the other biochars (48,276.3 and 57,254.6, respectively). AB1 did not show a statistical difference between doses. For AB2 and AB3, the efficiency was reduced with increasing dose. AB2 had better performance with the 10 t ha−1 dose (44,469.1) and worse with the 30 t ha−1 dose (32,352.5). AB3 had the highest result at the 10 t ha−1 dose (43,761.4) and the lowest at the 30 t ha−1 dose (30,122.4). In contrast, AB4 had the highest result at the 30 t ha−1 dose (57,254.5) and the lowest at the 20 t ha−1 dose (48,276.2).

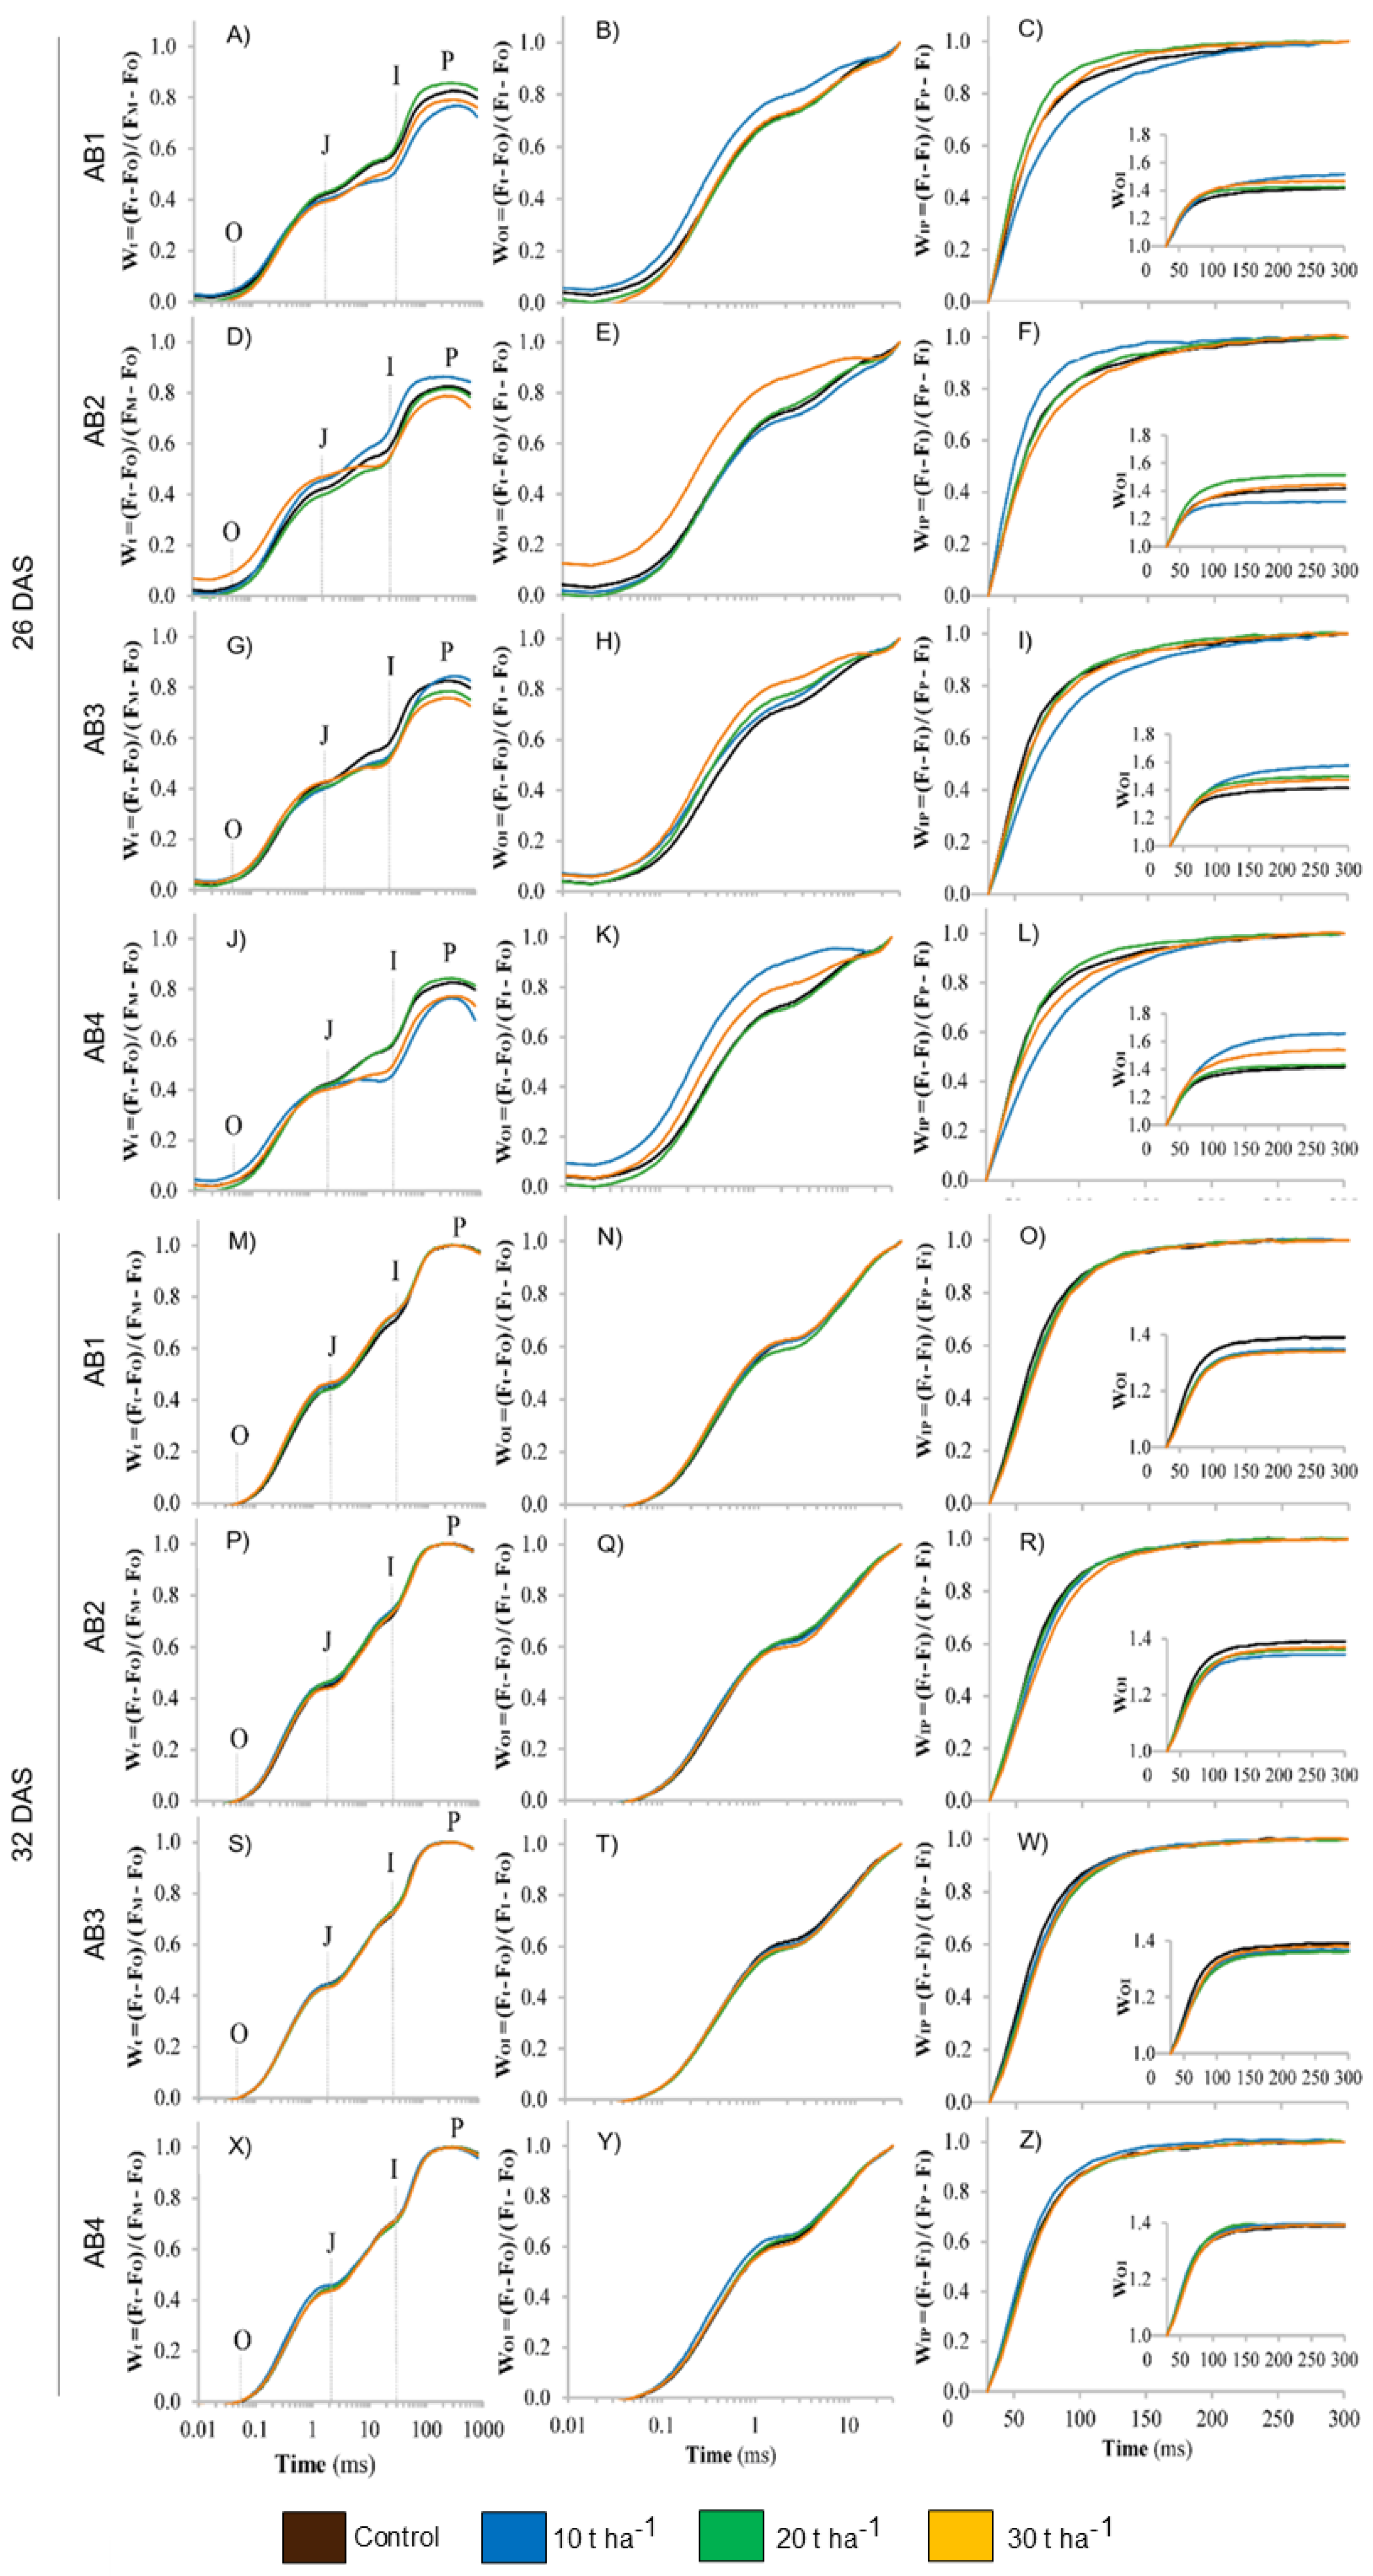
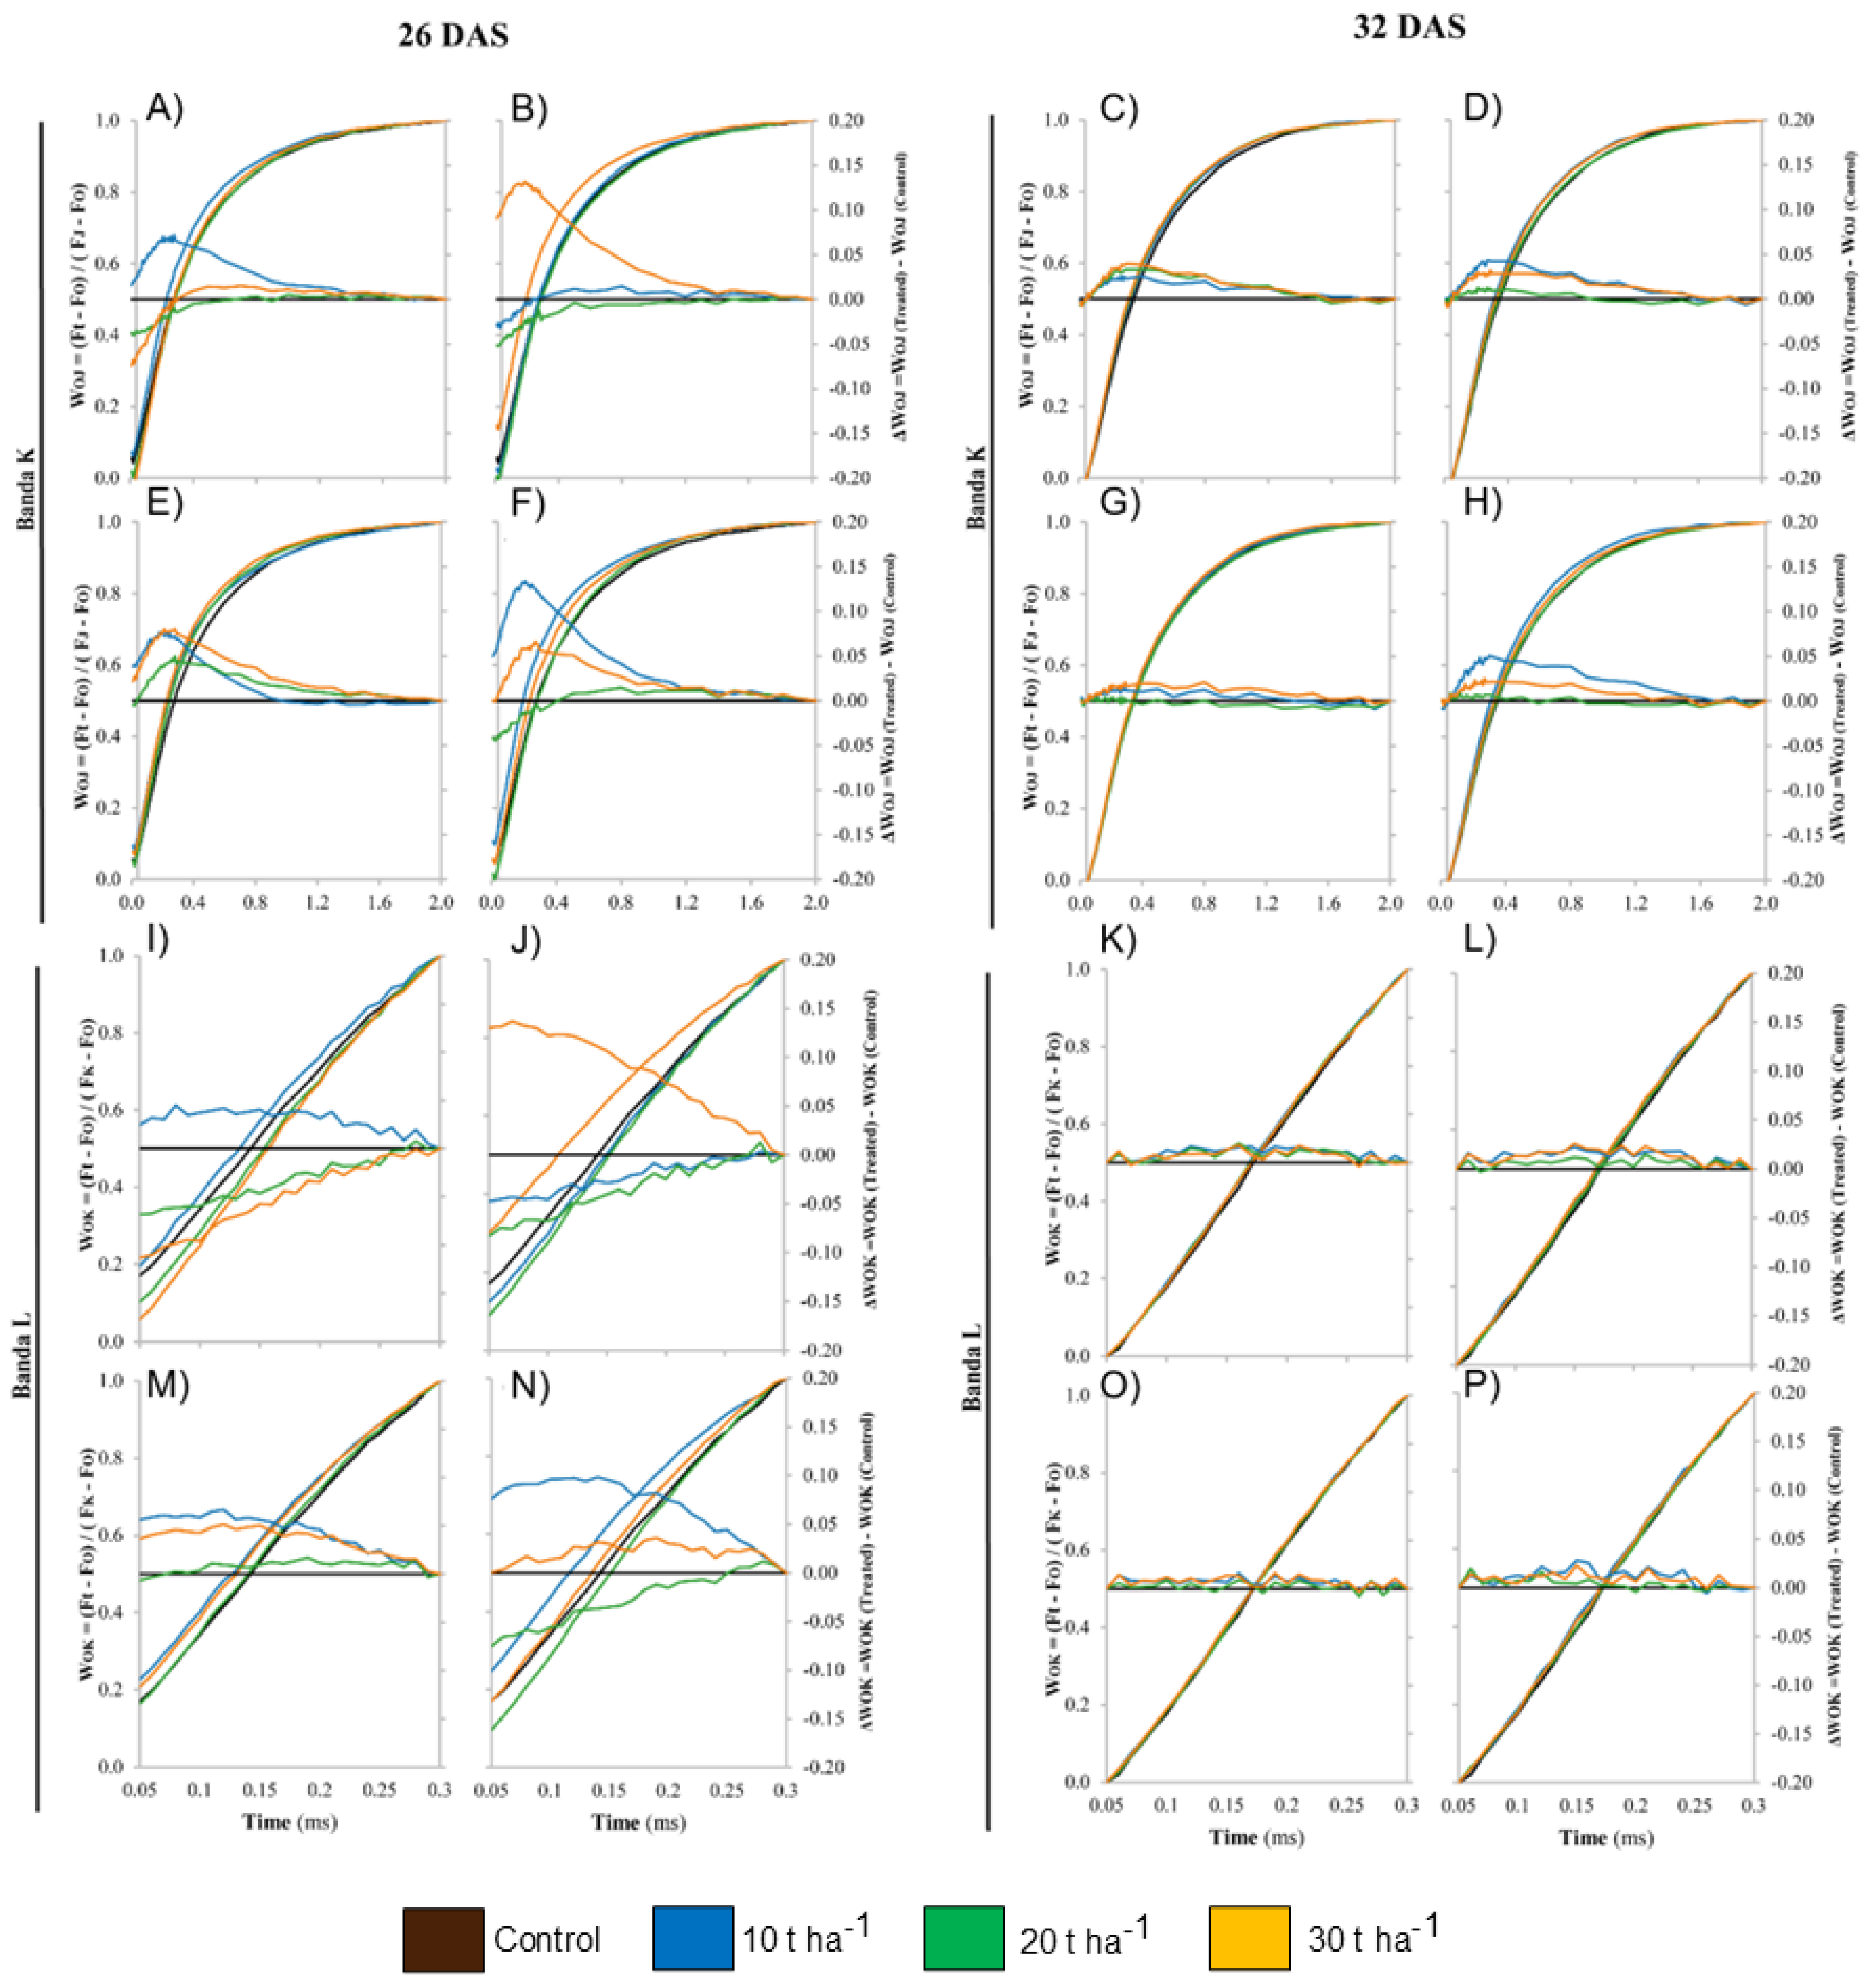
3.6. Effects of Biochar Application on Chlorophyll Fluorescence

The photosynthetic parameters obtained from the JIP test analysis of chlorophyll a transient fluorescence, normalized to the control as a reference, for rice plants treated with biochar at 26 and 32 days after application are shown in Figure 7. Analysis at 26 DAS showed that all biochar treatments led to an increase in the photosynthetic performance index, the conservation of excitation energy for intersystem electron transfer reduction (PIabs), and the performance index for the conservation of excitation energy for the reduction of the final electron acceptors of Photosystem I (PSI) (PItotal). The most significant increases were observed in the AB2 treatment at 20 t ha−1 and the AB3 treatment at 10 t ha−1. Despite the significant increase in PItotal with the application of AB4 at the 10 t ha−1 dose, there was also a reduction in PIabs.
Biochar AB2 at 30 t ha−1 and AB4 at 10 t ha−1 presented significant increases in the specific activities per reaction center (RC), electron flow to final electron acceptors of PSI per RC (REO/RC), energy loss as heat (DIo/RC), and the apparent size of the antenna system (ABS/RC). At 32 DAS, photosynthetic activity was restored, as evidenced by the reduction in the intensity of changes in the analyzed parameters. Decreases in PIabs and PItotal were observed, mainly in the AB1 and AB2 treatments. The lowest dose of AB4 (10 t ha−1) still promoted a significant increase in energy loss as heat (DIo/RC), the apparent size of the antenna system (ABS/RC), and electron flow to final electron acceptors of PSI per RC (REO/RC) (Figure 7D1).
In Figure 8, graphs of chlorophyll a fluorescence normalized as the relative variable fluorescence curve OJIP are presented (O50 μs, J2 ms, I30 ms, and P1 s are marked on the graph) (Wt) (Figure 8A,D,G,J,M,P,S,X), along with graphs of normalized relative variable fluorescence between O50 μs and I30 ms (WOI) (Figure 8B,E,H,K,N,Q,T,Y) and graphs of normalized relative variable fluorescence between I30 ms and P1 s (WIP) (Figure 8C,F,I,L,O,R,W,Z).
The application of the treatments altered photosynthetic performance by modifying the OJIP curve. Figure 8A,D,G,J show that there was a reduction in the curve at most of the treatment doses compared with the OJIP transient of the control, which may be due to the reduction in Fm values. However, AB1 (20 t ha−1) and AB2 (10 t ha−1) resulted in an elevation of the curve relative to that of the control, indicating an improvement in photosynthetic performance. The WIP graphs show the sequence of electron transfer events from PSI (starting from plastoquinol (PQH2) to the final electron acceptors of PSI), which increased with the application of AB1 (20 t ha−1) and AB2 (10 t ha−1). At 32 DAS, the curves were homogeneous and typical, with no significant differences among the treatments. All the treatments resulted in a greater curve, indicating better photosynthetic performance than that at 26 DAS.
The graphs of the K and L bands are shown in Figure 9. When light excitation occurs, chlorophyll a fluorescence is induced, characterized by a curve at approximately 300 µs, known as the K band (Figure 9A–H). At 26 DAS, there was an increase in this band, reflecting a reduction in the efficiency of Photosystem II, caused by inefficient electron transport between the PSII donor and the primary quinone electron acceptor (QA). This reduction was observed in all the treatments, but primarily at the 10 t ha−1 dose of AB1, AB3, and AB4 (Figure 9A,E,F) and the 30 t ha−1 dose of AB2 (Figure 9B). This suggests the presence of some type of stress, such as nutritional deficiency, water stress, or oxidation, which destabilizes light-harvesting complexes. At 32 DAS, there was a reduction in the number of bands, reflecting greater stability, especially in plants treated with AB3 (Figure 9G).
Similar effects were observed in the L band (Figure 9I–P), indicating instability in the photosynthetic system at 26 DAS, which was reversed by 32 DAS.

4. Discussion

4.1. Structural and Morphological Characteristics of Artisanal Biochars

The artisanal biochars studied exhibited distinct structural and morphological characteristics. Regarding structure, all biochars contain a predominant peak in the aromatic region, which is characteristic of biochars produced at high temperatures (>500 °C) [29]. The predominance of aromatic groups gives biochar a low decomposition rate and, consequently, contributes to the long-term input of recalcitrant carbon into the soil [30].
On the other hand, the biochars displayed different peak intensities in the aliphatic regions. AB1 and AB2 showed more intense aliphatic peaks between 10 and 50 ppm, suggesting that they were produced at lower temperatures than AB3 and AB4. These biochars retain compounds derived from the original biomass, which may influence their stability and interaction with the soil [29]. These structural differences are important because they can affect the agronomic functions of biochars when applied to the soil. Biochars with higher aliphatic content tend to be more reactive, promoting greater adsorption of nutrients and organic compounds [31]. However, they are also less stable, degrading more quickly and releasing volatile compounds [32]. More aromatic biochars, such as AB3 and AB4, are highly stable and can act as carbon sequestration agents and soil conditioners over long periods [33].
The morphological characteristics of artisanal biochars, particularly the presence of pores, are frequently reported in the literature [1,34,35]. Macropores improve soil water retention, while micropores retain capillary water [36,37]. The application of biochar increases microporosity and the available water capacity in sandy soils [38,39].
Through EDS analysis, only the elements C and O were detected. The element Ca was found only in AB1 and AB3. When compared to the chemical characterization performed by [18], a discrepancy was observed. This occurs because the EDS technique is less sensitive than the methods used by the mentioned authors (atomic absorption and CHN) and only analyzes the biochar surface, which can be used as an estimate [35]. Additionally, biochar is heterogeneous, so a point analysis does not represent the total elemental quantification of the sample.

4.2. Influence of Artisanal Biochars on Nutrient Accumulation in the Aerial Part of Rice Plants

AB1 and AB2 promoted a higher accumulation of P in the aerial part of the plant compared to AB3 and AB4. In the characterization conducted by [18], AB1 and AB2 were identified as the biochars with the lowest P content. Therefore, the concentrations of the nutrients accumulated in the aerial part of the plants are not directly related to the nutritional composition of the biochar but rather to the supplementation provided throughout the experiment. However, the characteristics of the biochars influenced how this nutrient was made available to the plant. The pores present in biochar store P, releasing it gradually [40].
On the other hand, biochar can promote the solubilization of inorganic P and the mineralization of organic P due to microbial activity, resulting in greater plant absorption [41]. The biochars also influenced the availability of K and Ca, increasing their concentrations in the aerial part of the plant, particularly with AB1 and AB2. AB1 and AB2 exhibit higher aliphatic characteristics than AB3 and AB4. Therefore, the functional groups present facilitate the adsorption of cations such as K and Ca, preventing their fixation in soil colloids and making them available to plants [42].
Micronutrients were less affected by biochars compared to macronutrients. The adsorption of micronutrients by biochar may be limited due to competition with other ions, such as Ca2⁺ and K⁺ [1,43].

4.3. Effects of Artisanal Biochars on the Morphology of Rice Plant Roots

The changes induced by AB4 observed in terms of root morphology, such as increased area, length, and number of bifurcations, align with the findings of the study by [44], in which biochar increased water and nutrient absorption by the plants and improved root development. Ref. [45] reported that the application of biochar promoted increased availability of P and consequently increased root biomass and root density in tropical soils.
Additionally, biochar can increase soil porosity and root aeration, promoting greater root growth [46]. However, there was a reduction in root volume at the 30 t ha−1 dose with the application of biochars AB1, AB2, and AB3, which may have occurred due to a nutritional imbalance. Doses of biochar can increase the concentration of nutrients, such as nitrogen, leading to toxicity or promoting an imbalance that reduces root growth [47].

4.4. Effects of Artisanal Biochars on Photosynthetic Parameters

The AB2 and AB3 biochars promoted more significant increases in photosynthetic performance (PIabs and PItotal). A study reported an increase in photosynthetic capacity and peanut yield with the application of biochar, which optimized light use by the plants [47]. The application of higher doses of biochar (20 t ha−1 and 30 t ha−1) tended to increase most of the chlorophyll fluorescence parameters, indicating a positive photosynthetic response and improved plant health. In contrast, the lowest dose (10 t ha−1) did not result in significant improvement and may even reduce photosynthetic efficiency. AB3 promoted improvements in specific activities per reaction center (RC) and electron flow to the final acceptor in PSI, corroborating the studies by [48], which revealed that biochar with higher oxygen content enhances chemical reactivity and increases photosynthetic efficiency.
The presence or absence of the K band can reflect the health and efficiency of Photosystem II, especially under stress conditions. Once light excitation begins, the K band appears at approximately 300 µs and is related to the inactivation of the oxygen-evolving complex (OEC) [49]. In this study, the increased K band present at 26 DAS suggests that PSII was not functioning optimally, possibly due to some form of stress, such as drought, salinity, or the presence of toxins [50]. At 32 DAS, there was a reduction or absence of the K band in all the treatments, indicating a positive effect of biochar on photosynthesis, reducing stress.
The application of the treatments also promoted the emergence of the L band, which reflects information about the organization and connectivity of the PSII reaction centers. The increase in the L band at 26 DAS reflects disorganization and may reduce the energy transfer efficiency. However, the reduction caused by the application of AB1, AB2, and AB4 suggests an improvement in organization. This reduction was more pronounced at 32 DAS, suggesting improved organization [51].

5. Conclusions

This study highlights important aspects of artisanal biochar as an agricultural tool for rice productivity in sandy soils. The studied biochars exhibited different effects on rice plant growth. Biochars with an aromatic structure and a higher presence of aliphatic groups (AB1 and AB2) contributed to greater nutrient accumulation in the aerial parts of the plants. However, biochar with an aromatic structure (AB4) performed better in root development and photosynthetic parameters. The applied doses also positively influenced the evaluated parameters, with the best results observed at the lowest dose of 10 t ha−1.
In general, AB4 at the lowest dose (10 t ha−1) proved to be the most efficient biochar for the development of rice plants in sandy soil. The studied brand does not specify the temperature used in the production process on its packaging, which limits comparisons with other biochars in the literature. These results are preliminary and unprecedented for this type of soil. Further testing is required on other crops, with longer cultivation periods and more specific analyses, to better understand how artisanal biochars can enhance agricultural production and contribute to the regeneration of fragile soils.

Supplementary Materials

The following supporting information can be downloaded at: https://www.mdpi.com/article/10.3390/su17083306/s1, Table S1. Macro and micronutrient contents of the biochars [18]; Table S2. Soil chemical analysis [18].

Author Contributions

D.F.d.O.T.: Formal analysis, Experiment conduction, Writing—original draft. T.A.v.T.d.C.: Formal analysis, Experiment conduction, Writing—original draft. N.F.R.: Experiment conduction, Formal analysis. H.F.d.O.d.S.: Experiment conduction. R.S.: Formal analysis. S.C.: Formal analysis. O.C.H.T.: Experiment conduction, Formal analysis. R.L.L.B.: Investigation, Data curation, Writing—review and editing. E.Z.: Investigation, Data curation, Writing—review and editing. A.C.G.: Conceptualization, Methodology, Data curation, Formal analysis, Investigation, Writing—original draft, Visualization, Supervision, Project administration. All authors have read and agreed to the published version of the manuscript.

Funding

This work was supported by the Carlos Chagas Filho Foundation for Research Support of the State of Rio de Janeiro—Brazil (Grant No. SisFAPERJ:2012028010), the National Council for Scientifc and Technological Development—Brazil (CNPQ: No. 402396/2021–9 Universal 18/2021, CNPq-No. 309722/2021–7, PQ-2 Research grant, CNPq-No: 150752/2022-9), the Post-Graduate Program in Agronomy—Soil Science at the Federal Rural University of Rio de Janeiro (PPGA—CS, UFRRJ), and the Coordination for the Improvement of Higher Education Personnel—Brazil (Grant no. CAPES:001).

Institutional Review Board Statement

Not applicable.

Informed Consent Statement

Not applicable.

Data Availability Statement

The datasets generated and analyzed in the current study may be made available on demand on reasonable request.

Acknowledgments

The authors sincerely thank the International Humic Substances Society (IHSS) and NMR Research Center CERMANU, at University of Napoli Federico II (Italy) for their support in facilitating the NMR analysis through the IHSS Training Award. We also extend our appreciation to the Multi-User Ultrastructure Laboratory Science at the Federal Rural University of Rio de Janeiro (LMU/UFRRJ) for providing the SEM-EDS analyses, which were instrumental in this research.

Conflicts of Interest

The authors declare no competing interests.

References

  1. Lehmann, J.; Joseph, S. Biochar for Environmental Management; Routledge: London, UK, 2015; Volume 2, ISBN 9781844076581. [Google Scholar]
  2. Placido, J.; Capareda, S.; Karthikeyan, R. Production of Humic Substances from Cotton Stalks Biochar by Fungal Treatment with Ceriporiopsis Subvermispora. Sustain. Energy Technol. Assess. 2016, 13, 31–37. [Google Scholar] [CrossRef]
  3. Al-Wabel, M.I.; Al-Omran, A.; El-Naggar, A.H.; Nadeem, M.; Usman, A.R.A. Pyrolysis Temperature Induced Changes in Characteristics and Chemical Composition of Biochar Produced from Conocarpus Wastes. Bioresour. Technol. 2013, 131, 374–379. [Google Scholar] [CrossRef] [PubMed]
  4. Blanco-Canqui, H. Biochar and Soil Physical Properties. Soil Sci. Soc. Am. J. 2017, 81, 687–711. [Google Scholar] [CrossRef]
  5. Ibrahim, A.; Usman, A.R.A.; Al-Wabel, M.I.; Nadeem, M.; Ok, Y.S.; Al-Omran, A. Effects of Conocarpus Biochar on Hydraulic Properties of Calcareous Sandy Soil: Influence of Particle Size and Application Depth. Arch. Agron. Soil Sci. 2017, 63, 185–197. [Google Scholar] [CrossRef]
  6. Kameyama, K.; Miyamoto, T.; Iwata, Y.; Shiono, T. Influences of Feedstock and Pyrolysis Temperature on the Nitrate Adsorption of Biochar. Soil Sci. Plant Nutr. 2016, 62, 180–184. [Google Scholar] [CrossRef]
  7. Devereux, R.C.; Sturrock, C.J.; Mooney, S.J. The Effects of Biochar on Soil Physical Properties and Winter Wheat Growth. Earth Environ. Sci. Trans. R Soc. Edinb. 2013, 103, 13–18. [Google Scholar] [CrossRef]
  8. Torchia, D.F.d.O.; Zonta, E.; de Andrade, A.M.; García, A.C. Production and Characterization of Biochar Obtained from Different Biomass and Pyrolysis Temperature. Braz. J. Chem. Eng. 2021, 39, 415–427. [Google Scholar] [CrossRef]
  9. Lei, O.; Zhang, R. Effects of Biochars Derived from Different Feedstocks and Pyrolysis Temperatures on Soil Physical and Hydraulic Properties. J. Soils Sediments 2013, 13, 1561–1572. [Google Scholar] [CrossRef]
  10. Zong, Y.; Chen, D.; Lu, S. Impact of Biochars on Swell-Shrinkage Behavior, Mechanical Strength, and Surface Cracking of Clayey Soil. J. Plant Nutr. Soil Sci. 2014, 177, 920–926. [Google Scholar] [CrossRef]
  11. Zheng, R.; Li, C.; Sun, G.; Xie, Z.; Chen, J.; Wu, J.; Wang, Q. The Influence of Particle Size and Feedstock of Biochar on the Accumulation of Cd, Zn, Pb, and As by Brassica chinensis L. Environ. Sci. Pollut. Res. 2017, 24, 22340–22352. [Google Scholar] [CrossRef]
  12. Alvarez-Campos, O.; Lang, T.A.; Bhadha, J.H.; McCray, J.M.; Glaz, B.; Daroub, S.H. Biochar and Mill Ash Improve Yields of Sugarcane on a Sand Soil in Florida. Agric. Ecosyst. Environ. 2018, 253, 122–130. [Google Scholar] [CrossRef]
  13. Gonzaga, M.I.S.; Mackowiak, C.; de Almeida, A.Q.; de Carvalho Junior, J.I.T.; Andrade, K.R. Positive and Negative Effects of Biochar from Coconut Husks, Orange Bagasse and Pine Wood Chips on Maize (Zea mays L.) Growth and Nutrition. Catena 2018, 162, 414–420. [Google Scholar] [CrossRef]
  14. Jien, S.H.; Wang, C.S. Effects of Biochar on Soil Properties and Erosion Potential in a Highly Weathered Soil. Catena 2013, 110, 225–233. [Google Scholar] [CrossRef]
  15. He, Y.; Yao, Y.; Ji, Y.; Deng, J.; Zhou, G.; Liu, R.; Shao, J.; Zhou, L.; Li, N.; Zhou, X.; et al. Biochar Amendment Boosts Photosynthesis and Biomass in C3 but Not C4 Plants: A Global Synthesis. GCB Bioenergy 2020, 12, 605–617. [Google Scholar] [CrossRef]
  16. Corbeels, M.; Marchão, R.L.; Neto, M.S.; Ferreira, E.G.; Madari, B.E.; Scopel, E.; Brito, O.R. Evidence of limited carbon sequestration in soils under no-tillage systems in the Cerrado of Brazil. Sci. Rep. 2016, 6, 21450. [Google Scholar] [CrossRef]
  17. Santos, R.S.; Santana, A.S. agricultura e agroindústria rural Na região sudeste segundo dados do censo agropecuário de 2017. Bol. Reg. Urbano E Ambient. Ipea 2020, 23, 123–133. [Google Scholar] [CrossRef]
  18. Torchia, D.F.d.O.; van Tol de Castro, T.A.; Tavares, O.C.H.; Souza, C.C.B.; da Silva, H.F.O.; de Moura, O.V.T.; da Silva, K.C.M.; de Souza Rocha, F.; Zonta, E.; García, A.C. Effects of Artisanal Biochar Applied to Rice Cultivation in Fragile Sandy Planosol at Rio de Janeiro (Brazil). J. Soil Sci. Plant Nutr. 2024, 24, 172–189. [Google Scholar] [CrossRef]
  19. Mazzei, P.; Cangemi, S.; Malakshahi Kurdestani, A.; Mueller, T.; Piccolo, A. Quantitative Evaluation of Noncovalent Interactions between 3,4-Dimethyl-1 H-Pyrazole and Dissolved Humic Substances by NMR Spectroscopy. Environ. Sci. Technol. 2022, 56, 11771–11779. [Google Scholar] [CrossRef] [PubMed]
  20. Portz, A.; Resende, A.S.; Teixeira, A.J.; Abboud, A.C.S.; Martins, C.A.C.; Carvalho, C.A.B.; Lima, E.; Zonta, E.; Pereira, J.B.A.; Balieiro, F.C.; et al. Recomendações de Adubos, Corretivos e de Manejo Da Matéria Para as Principais Culturas Do Estado Do Rio de Janeiro. In Manual de Calagem e Adubação do Estado do Rio de Janeiro; Luiz Rodrigues Freire, Ed.; Embrapa: Brasília, Brazil, 2013; Volume 1, pp. 1–434. [Google Scholar]
  21. Glaser, B.; Lehmann, J.; Zech, W. Ameliorating physical and chemical properties of highly weathered soils in the tropics with charcoal—A review. Biol. Fertil. Soils 2002, 35, 219–230. [Google Scholar] [CrossRef]
  22. Uzoma, K.C.; Inoue, M.; Andry, H.; Fujimaki, H.; Zahoor, A.; Nishihara, E. Effect of cow manure biochar on maize productivity under sandy soil condition. Soil Use Manag. 2011, 27, 205–211. [Google Scholar] [CrossRef]
  23. Malavolta, E.; Vitti, G.C.; Oliveira, S.A. Evaluation of the Nutritional Status of Plants: Principles and Applications, 2nd ed.; Potafos: Piracicaba, Brazil, 1997. [Google Scholar]
  24. Strasser, R.J.; Tsimilli-Michael, M.; Srivastava, A. Analysis of the Chlorophyll a Fluorescence Transient. In Chlorophyll a Fluorescence; Papageorgiou, G.C., Govindjee, Eds.; Springer: Berlin/Heidelberg, Germany, 2004; Volume 19, pp. 321–362. [Google Scholar]
  25. Tavares, O.C.H.; Santos, L.A.; Filho, D.F.; Ferreira, L.M.; García, A.C.; Castro, T.A.V.T.; Zonta, E.; Pereira, M.G.; Fernandes, M.S. Response Surface Modeling of Humic Acid Stimulation of the Rice (Oryza sativa L.) Root System. Arch. Agron. Soil Sci. 2021, 67, 1046–1059. [Google Scholar] [CrossRef]
  26. Demirbas, A. Effects of Temperature and Particle Size on Bio-Char Yield from Pyrolysis of Agricultural Residues. J. Anal. Appl. Pyrolysis 2004, 72, 243–248. [Google Scholar] [CrossRef]
  27. Rutherford, D.W.; Wershaw, R.L.; Cox, L.G. Changes in Composition and Porosity Occurring During the Thermal Degradation of Wood and Wood Components; US Department of the interior, US Geological Survey: Reston, WA, USA, 2005. [Google Scholar]
  28. Antal, M.J.; Grønli, M. The Art, Science, and Technology of Charcoal Production. Ind. Eng. Chem. Res. 2003, 42, 1619–1640. [Google Scholar] [CrossRef]
  29. Lehmann, J.; Rillig, M.C.; Thies, J.; Masiello, C.A.; Hockaday, W.C.; Crowley, D. Biochar Effects on Soil Biota—A Review. Soil Biol. Biochem. 2011, 43, 1812–1836. [Google Scholar] [CrossRef]
  30. Spokas, K.A.; Novak, J.M.; Venterea, R.T. Biochar’s role as an alternative N-fertilizer: Ammonia capture. Plant Soil 2012, 350, 35–42. [Google Scholar] [CrossRef]
  31. Keiluweit, M.; Nico, P.S.; Johnson, M.G.; Kleber, M. Dynamic molecular structure of plant biomass-derived black carbon. Environ. Sci. Technol. 2010, 44, 1247–1253. [Google Scholar] [CrossRef]
  32. Singh, B.P.; Cowie, A.L.; Smernik, R.J. Biochar stability in a clayey soil as a function of feedstock and pyrolysis temperature. Environ. Sci. Technol. 2010, 46, 11770–11778. [Google Scholar] [CrossRef] [PubMed]
  33. Nguyen, B.T.; Lehmann, J. Black carbon decomposition under varying water regimes. Org. Geochem. 2009, 40, 846–853. [Google Scholar] [CrossRef]
  34. Berek, A.K.; Hue, N.V. Characterization of Biochars and Their Use as an Amendment to Acid Soils. Soil Sci. 2016, 181, 412–426. [Google Scholar] [CrossRef]
  35. Chia, C.H.; Munroe, P.; Joseph, S.; Lin, Y. Microscopic Characterisation of Synthetic Terra Preta. Aust. J. Soil Res. 2010, 48, 593–605. [Google Scholar] [CrossRef]
  36. Torres, G.N.; Amorin, R.S.S.; DiRaimo, L.A.D.; Faria, O.C.O. Water retention in sandy soils of different origins with the addition of biochar. Caatinga 2023, 37, e11792. [Google Scholar]
  37. Kamarudin, N.S.; Dahalan, F.A.; Hasan, M.; An, O.S.; Parmin, N.A.; Ibrahim, N.; Hamdzah, M.; Zain, N.A.M.; Muda, K.; Wikurendra, E.A. Biochar: A Review of Its History, Characteristics, Factors That Influence Its Yield, Methods of Production, Application in Wastewater Treatment and Recent Development. Biointerface Res. Appl. Chem. 2022, 12, 7914–7926. [Google Scholar] [CrossRef]
  38. Uchimiya, M.; Wartelle, L.H.; Lima, I.M.; Klasson, K.T. Sorption of Deisopropylatrazine on Broiler Litter Biochars. J. Agric. Food Chem. 2010, 58, 12350–12356. [Google Scholar] [CrossRef]
  39. Nguyen, B.T.; Lehmann, J.; Kinyangi, J.; Smernik, R.; Riha, S.J.; Engelhard, M.H. Long-Term Black Carbon Dynamics in Cultivated Soil. Biogeochemistry 2008, 89, 295–308. [Google Scholar] [CrossRef]
  40. Dietrich, C.C.; Rahaman, M.A.; Robles-Aguilar, A.A.; Latif, S.; Intani, K.; Müller, J.; Jablonowski, N.D. Nutrient Loaded Biochar Doubled Biomass Production in Juvenile Maize Plants (Zea mays L.). Agronomy 2020, 10, 567. [Google Scholar] [CrossRef]
  41. Silva Gonzaga, M.I.; Oliveira da Silva, P.S.; Carlos de Jesus Santos, J.; Ganassali de Oliveira Junior, L.F. Biochar Increases Plant Water Use Efficiency and Biomass Production While Reducing Cu Concentration in Brassica juncea L. in a Cu-Contaminated Soil. Ecotoxicol. Environ. Saf. 2019, 183, 109557. [Google Scholar] [CrossRef]
  42. Zhang, H.; Chen, C.; Gray, E.M.; Boyd, S.E.; Yang, H.; Zhang, D. Roles of Biochar in Improving Phosphorus Availability in Soils: A Phosphate Adsorbent and a Source of Available Phosphorus. Geoderma 2016, 276, 1–6. [Google Scholar] [CrossRef]
  43. Chen, W.; Chen, Y.; Yang, H.; Li, K.; Chen, X.; Chen, H. Investigation on Biomass Nitrogen-Enriched Pyrolysis: Influence of Temperature. Bioresour. Technol. 2018, 249, 247–253. [Google Scholar] [CrossRef]
  44. Li, S.; Chen, G. Thermogravimetric, Thermochemical, and Infrared Spectral Characterization of Feedstocks and Biochar Derived at Different Pyrolysis Temperatures. Waste Manag. 2018, 78, 198–207. [Google Scholar] [CrossRef]
  45. Zhang, L.; Chang, L.; Liu, H.; de Jesús Puy Alquiza, M.; Li, Y. Biochar application to soils can regulate soil phosphorus availability: A review. Biochar 2025, 7, 13. [Google Scholar] [CrossRef]
  46. Tian, J.; Kuang, X.; Tang, M.; Chen, X.; Huang, F.; Cai, Y.; Cai, K. Biochar Application under Low Phosphorus Input Promotes Soil Organic Phosphorus Mineralization by Shifting Bacterial PhoD Gene Community Composition. Sci. Total Environ. 2021, 779, 146556. [Google Scholar] [CrossRef] [PubMed]
  47. Laird, D.A.; Fleming, P.; Davis, D.D.; Horton, R.; Wang, B.; Karlen, D.L. Impact of biochar amendments on the quality of a typical Midwestern agricultural soil. Geoderma 2010, 158, 443–449. [Google Scholar] [CrossRef]
  48. Meng, Z.; Huang, S.; Xu, T.; Lin, X.; Wu, J. Competitive adsorption, immobilization, and desorption risks of Cd, Ni, and Cu in saturated-unsaturated soils by biochar under combined aging. Hazard. Mater. 2022, 34, 128903. [Google Scholar] [CrossRef] [PubMed]
  49. Bhadha, J.H.; Daroub, S.H.; Lang, T.A. Effect of Kinetic Control, Soil: Solution Ratio, Electrolyte Cation, and Others, on Equilibrium Phosphorus Concentration. Geoderma 2012, 173–174, 209–214. [Google Scholar] [CrossRef]
  50. Prendergast-Miller, M.T.; Duvall, M.; Sohi, S.P. Biochar-Root Interactions Are Mediated by Biochar Nutrient Content and Impacts on Soil Nutrient Availability. Eur. J. Soil Sci. 2014, 65, 173–185. [Google Scholar] [CrossRef]
  51. Lehmann, J.; Pereira da Silva, J., Jr.; Steiner, C.; Nehls, T.; Zech, W.; Glaser, B. Nutrient Availability and Leaching in an Archaeological Anthrosol and a Ferralsol of the Central Amazon Basin: Fertilizer, Manure and Charcoal Amendments. Plant Soil 2003, 249, 343–357. [Google Scholar] [CrossRef]
Figure 1. Nuclear magnetic resonance (CP MAS 13C NMR) analysis. (A) Spectral analysis; (B) Chemometric analysis; (C) Relative carbon content: 1: CAlkyl-H,R; 2: CAlkyl-O,N; 3: CAlkyl-O; 4: CAlkyl-di-O; 5: CAromatic-H,R; 6: CAromatic-O,N; 7: CCOOH; 8: CC=O; (D) Aromaticity, aliphaticity, and hydrophobicity indices.
Sustainability 17 03306 g001
Figure 2. SEM analysis of the morphology of handcrafted biochars. (A) AB1 at 550× magnification; (B) AB1 at 4500× magnification; (C) AB2 at 820× magnification; (D) AB2 at 4500× magnification; (E) AB3 at 550× magnification; (F) AB3 at 4500× magnification; (G) AB4 at 550× magnification; (H) AB4 at 4500× magnification.
Sustainability 17 03306 g002
Figure 3. EDS analysis of the elements present on the surface of the biochars. (A) Map analysis of AB1; (B) Quantification of elements in AB1; (C) Map analysis of AB2; (D) Quantification of elements in AB2; (E) Map analysis of AB3; (F) Quantification of elements in AB3; (G) Map analysis of AB4; (H) Quantification of elements in AB4.
Sustainability 17 03306 g003
Figure 4. Production of fresh (A,C,E) and dry (B,D,F) biomass of rice with the application of artisanal biochars. Different lowercase letters correspond to statistical difference of the biochar factor in Tukey’s test (p < 0.05). Different uppercase letters correspond to statistical difference of the dose factor in Tukey’s test (p < 0.05). * corresponds to statistical differences of the treatments in relation to the control in Dunnet’s test (p < 0.05).
Sustainability 17 03306 g004
Figure 5. Concentration of macro- and micronutrients in the aerial parts of rice plants after the application of artisanal biochar. (A) P concentration; (B) K concentration; (C) Ca concentration; (D) Mg concentration; (E) Cu concentration; (F) Mn concentration; (G) Fe concentration. Different lowercase letters correspond to statistical differences of the dose factor in Tukey’s test (p < 0.05). Different uppercase letters correspond to statistical differences of the biochar factor in Tukey’s test (p < 0.05).
Sustainability 17 03306 g005
Figure 6. Root parameters of rice plants modified by the application of artisanal biochar. Area (A), volume (B), length (C), diameter (D), number of bifurcations (E) and number of thick roots (F). Image of scanned roots (G) 1 = Control; 2 = AB1 dose 10 t ha −1; 3 = AB1 dose 20 t ha −1; 4 = AB1 dose 30 t ha −1; 5 = AB2 dose 10 t ha −1; 6 = AB2 dose 20 t ha −1; 7 = AB2 dose 30 t ha −1; 8 = AB3 dose 10 t ha −1; 9 = AB3 dose 20 t ha −1; 10 = AB3 dose 30 t ha −1; 11 = AB4 dose 10 t ha −1; 12 = AB4 dose 20 t ha −1; 13 = AB4 dose 30 t ha −1. Different lowercase letters correspond to statistical differences of the dose factor in Tukey’s test (p < 0.05). Different uppercase letters correspond to statistical difference of the biochar factor in Tukey’s test (p < 0.05). * corresponds to statistical differences of the treatments in relation to the control in Dunnet’s test (p < 0.05).
Sustainability 17 03306 g006
Figure 7. Transient fluorescence analysis of chlorophyll a in rice plants after application of artisanal biochars. (A,A1) AB1; (B,B1) AB2; (C,C1) AB3; (D,D1) AB4.
Sustainability 17 03306 g007
Figure 8. OJIP curves of rice plants after the application of artisanal biochars. Relative variable fluorescence between points O and P (Wt) on a logarithmic time scale (A,D,G,J,M,P,S,X); relative variable fluorescence between points O and I (WOI) on a logarithmic time scale (B,E,H,K,N,Q,T,Y); relative variable fluorescence between points I and P (WIP) and WOI in the inset (C,F,I,L,O,R,W,Z).
Sustainability 17 03306 g008
Figure 9. K and L bands of rice plants after the application of artisanal biochars. (A,C,I,K) AB1; (B,D,J,L) AB2; (E,G,M,O) AB3; (F,H,N,P) AB4.
Sustainability 17 03306 g009
Disclaimer/Publisher’s Note: The statements, opinions and data contained in all publications are solely those of the individual author(s) and contributor(s) and not of MDPI and/or the editor(s). MDPI and/or the editor(s) disclaim responsibility for any injury to people or property resulting from any ideas, methods, instructions or products referred to in the content.

