Article

Beaver Dams as a Significant Factor in Shaping the Hydromorphological and Hydrological Conditions of Small Lowland Streams

Department of Hydraulic and Sanitary Engineering, Poznań University of Life Sciences, Piątkowska 94E, 60-649 Poznań, Poland
*
Author to whom correspondence should be addressed.
Sustainability 2025, 17(8), 3317; https://doi.org/10.3390/su17083317
Submission received: 11 January 2025 / Revised: 20 March 2025 / Accepted: 4 April 2025 / Published: 8 April 2025

Abstract

:
Beavers play a key role in creating temporary water reservoirs that significantly impact the natural environment and local river hydrology. The primary aim of this study was to assess the potential of increasing the number of beaver dams (Castor spp.), as an alternative method of water retention in the environment. Research conducted on three small lowland streams in central Poland revealed that beaver dams, even in modified riverbeds, enable the formation of shallow floodplains and ponds. Innovative analyses considered the structural materials of the dams and their impact on river hydromorphology and sediment transport. The findings emphasise the importance of beavers in water retention processes, the stabilisation of water levels during low flows and the protection of biodiversity. The study also demonstrated that beaver dams play a critical role in storing surface- and groundwater, mitigating drought impacts, reducing surface runoff, and stabilising river flows. These constructions influence local hydrology by increasing soil moisture, extending water retention times, and creating habitats for numerous species. The collected data highlight the potential of beaver dams as a tool in water resource management in the context of climate change. Further research could provide guidance for the sustainable utilisation of beavers in environmental conservation strategies and landscape planning.

1. Introduction

The quality and quantity of water in the environment is a key element of water resource management in catchments [1,2]. This problem becomes particularly important in connection with climate change and periodic water deficits [3]. In this situation, any factor improving the availability of water resources, including beaver impoundments, becomes extremely important and interesting [2,4,5]. Beaver dam construction (Castor fiber L.) can serve as a potential source of water storage [6,7]. This includes retaining water resources in both surface and groundwater systems (via groundwater infiltration) [8,9]. Due to intensive human activities that led to the near-extinction of beavers in some regions, there is now potential for population recovery, which could increase dam numbers and, consequently, aid water retention in river landscapes [10,11]. Beaver dams significantly affect local hydrology by altering water retention times and flow directions, and enhancing infiltration and groundwater reserves [7,12,13,14]. They also change the hydromorphological conditions of streams [15,16], creating beaver ponds, local scouring, and sediment deposition areas [17].
Beaver dams can serve as effective tools for managing groundwater and surface water resources, as their presence enables the gradual release of stored water into river channels [18,19,20,21]. Through dam construction and raising groundwater levels, beaver activity enhances water storage capacity in river catchments, which contributes to reducing surface runoff and mitigating flood impacts [22]. In the long term, this can lead to the conversion of intermittent streams into permanent water sources or to flow being maintained during droughts; it also improves river flow stability, which is particularly significant in the context of climate change [12,23,24,25].
The influence of beavers on groundwater levels around their reservoirs depends on factors such as terrain slope, valley width, soil type, and substrate. In river valleys, beaver dams increase soil moisture, altering vegetation composition and promoting biodiversity [26,27,28]. By building dams, the surrounding area becomes a suitable habitat for numerous species, including invertebrates, fish, and amphibians, creating ecological niches for various forms of life [29,30,31]. The tree damage caused by beavers increases sunlight penetration, altering vegetation composition and affecting the microclimate [32]. This creates new habitats for small mammals and birds, which also contributes to greater biodiversity [33,34,35]. Beaver-created water reservoirs range from a few cubic metres to as much as 12,000 m3. They allow significant amounts of water to be stored while also creating new habitats of natural value [23,26,36,37].
In the past, human settlement, deforestation, and intensive river regulation drastically reduced beaver populations in Europe, including in Poland, where the species’ numbers were limited to small northeastern regions by the mid-20th century [38]. It was only from the 1970s onward that Poland began efforts to rebuild European beaver (Castor fiber L.) populations, which resulted in intensified conservation and reintroduction actions [39]. Those programmes have enabled beavers to recolonise vast river valleys and wetland areas, where they contribute to water retention improvement and the protection of water resources [40].
Despite the numerous benefits of beaver activity, their presence can be seen as problematic, particularly in economic areas [41]. In Poland, the beaver population has increased significantly as a result of reintroduction programmes, leading to their increased presence along rivers, lakes, and drainage ditches and in agricultural areas. Beavers cut down trees along the banks, which can affect forest management, and their dams can raise groundwater levels in agricultural areas, which can cause crop problems.
Beaver dams can also contribute to hydrological hazards, especially during heavy rainfall and flooding. Studies have shown that the presence of beaver dams increases the scale of flooding by increasing water levels and changing groundwater levels [20]. This can result in longer periods of high water levels. A study conducted in Rocky Mountain National Park in Colorado found that beaver dams increased the flood area by 9–12 ha in a study area of 58 ha.
Some cases of sudden dam failure are also dangerous. Studies have shown that their sudden failure can lead to intense flooding and a threat to infrastructure and loss of life [42,43]. There are documented not-so-rare cases [44] that indicate that such failures can release millions of cubic metres of water—for example, in British Columbia in 2000, 2 million m3 of water was released, which caused erosion of the riverbed to a depth of 4 m and deposition of 80,000 m3 of sediment. Hydrodynamic modelling [45] suggests that beaver dams can affect water flows, but their ability to reduce flood peaks can sometimes be quite limited. Modelling results indicated that the dams increased the area flooded by more than 300%, and the flood wave attenuation effect reached a maximum of 13.1% and delayed the peak of the flood wave by 2.75 h. Therefore, the authors of the publication [45] indicated that dams cannot be considered an effective flood management measure. And the dams themselves, in certain conditions (especially high dams, in mountain and foothill areas) should be included in hydrological risk management planning.
Although the role of beaver dams in water retention and hydromorphological transformation is crucial, their impact on river hydrology remains insufficiently studied. While there are estimates of the water retention capacity of beaver dams, precise data on their effects on groundwater storage and water balance in agricultural catchments is lacking. Current studies also fail to compare the impact of beaver dams with other natural and artificial water reservoirs. Assessing their full influence on river flows is challenging due to the lack of precise volume estimates of water retained by these structures and the hydromorphological and sedimentological changes in channels affected by beavers.
The objective of this study is to determine the maximum potential influence of beaver dams on temporary water storage—both surface and groundwater—in small lowland river catchments. The results will provide a better understanding of the extent to which beaver activity affects river flow and what realistic benefits can be achieved by supporting beaver habitat restoration activities.

2. Materials and Methods

2.1. Rivers Location

Analyses of the influence of natural damming on hydromorphological, hydrological and environmental conditions were carried out on the example of selected lowland rivers located in the Wielkopolska region, Poland. The studied streams inhabited by beavers include the Kończak River, Mogilnica, and Cybina (Figure 1).
Data for analysis and calculations were obtained from field measurements conducted between 2020 and 2023 during spring and summer months. Geodetic equipment such as an optical leveller (accuracy 0.001 m) and RTK GPS (accuracy 0.02 m) were used for elevation measurements. The water flow velocity in river channels was measured using an electromagnetic probe (Valeport Model 801) with an accuracy of 0.01 m/s. Detailed photographic documentation of the studied objects was compiled during field inventory. Additionally, available cartographic materials and data were utilised (Table 1).

2.2. Location of the Study Objects

The studied beaver dams are located on small lowland streams in the central part of Poland, in the Wielkopolskie Voivodeship. The dam located in the riverbed of the Kończak River at km 4+075 is situated in the commune of Oborniki, in the central part of the Wielkopolskie Voivodeship (Figure 2a,b), while the dam in the riverbed of the Mogilnica River at km 24+935 is located in the commune of Opalenica, in the western part of the Wielkopolskie Voivodeship (Figure 2c,d). The third beaver dam analysed is located in the city of Poznań, in the riverbed of the Cybina River at km 4+835 (Figure 2e,f). Hydrographic maps for the catchment areas of the individual rivers up to the location of the beaver dam were developed using the Hydrographical Map of Poland, the Database of General Geographical Objects (BDOO), and QGIS software 3.32.1.

2.2.1. The Kończak River

Beaver dams in the Kończak River catchment (Figure 2a,b), in the water region of the Warta River, are located in an area of uniform surface water in the Kończak River, given the number PLRW600017187149. The Kończak River is a third-order stream and a right-bank tributary of the Warta River. The length of the Kończak River is approximately 19.47 km, and the total catchment area is around 241.85 km2 (Atlas of the Hydrographic Division of Poland, 2005), while the catchment area at the location of the beaver dam is approximately 228.51 km2. The largest part of the catchment area is made up of arable land, which constitutes approximately 67.4% of the total area. Forested areas make up approximately 29.3% of the catchment area, while built-up areas account for 3.1%. Surface waters occupy only 0.2% of the catchment area (Figure 2b).
The dam in the riverbed of the Kończak River at km 4+075 (Figure 3) (52°23′53,452″ N 16°59′23,482″ E) partitioned the entire riverbed of the stream, with the highest water flow occurring in the zone near the left bank. The construction material consisted of branches and mud. After 3 years of the dam’s operation, significant vegetation coverage was already visible, especially on the dam’s embankment on the lower site. The main overflow through the dam was located on the left bank, while a slight flow through the dam structure was also noticeable.

2.2.2. The Mogilnica River

The beaver dam in the Mogilnica River catchment (Figure 2c,d) is located in the water region of the Warta River in the homogeneous surface water section of Mogilnica, from Mogilnica Wschodnia to Rów Kąkolewski, with the number PLRW600019185687. Mogilnica is a fourth-order stream that drains water through the Prut I Canal to the Mosiński Canal and through the Prut II Canal to the Obra River. The length of the Mogilnica River is approximately 64.64 km, and the total catchment area is about 733.88 km2 [49], while the catchment area at the location of the beaver dam is approximately 280.48 km2. The largest portion of the catchment area consists of arable land, which accounts for approximately 84.7% of the total area. Forest areas account for about 8.7% of the catchment area, while built-up areas account for 5.8%. Surface water makes up only 0.8% of the catchment area (Figure 2c).
The beaver dam in the bed of the Mogilnica River at km 24+935 (52°18′30,474″ N 16°26′52,598″ E) is located in a forested area (Figure 4). The structure partitions the riverbed, while the flow occurs in the areas near the bottom of the riverbed, across its entire width. The construction material consists of small and large branches, as well as mud.

2.2.3. The Cybina River

The beaver dam in the Cybina River catchment (Figure 2e,f) is located in the water region of the Warta River, in the homogeneous section of surface water of the Cybina River, with the number PLRW600017185899. The Cybina River is a third-order stream and a right-bank tributary of the Warta River. The length of the Cybina River is 44.12 km, and the total catchment area is approximately 190.61 km2 [49], while the catchment area at the location of the beaver dam is approximately 169,38 km2. The largest portion of the catchment area comprises arable land, which makes up approximately 57.0% of the total area. Forest areas make up approximately 28.3% of the catchment area, while built-up areas account for 12.9%. Surface water occupies only 1.8% (Figure 2e).
The beaver dam located at km 4+835 of the Cybina River (Figure 5) (52°43′36,779″ N 16°37′14,369″ E) is situated within the recreational forest areas of the City of Poznań. Water flow through the structure occurs through the body of the dam. The construction material consists of medium and small branches collected from nearby shrubs and fallen trees.

2.3. The Characteristics of Hydrometeorological Conditions

The meteorological conditions were characterised based on data from the Institute of Meteorology and Water Management—National Research Institute (IMGW PIB). The materials were retrieved from the website [50]. All the considered objects are located in the Wielkopolskie Voivodeship, which is characterised by rather limited water resources, due in part to the amount and distribution of precipitation.
In recent years, winters in Wielkopolska have been characterised by milder temperatures and reduced snow cover. In the 2019/2020 winter season, the average daily temperature in Poznań was +4.1 °C, and during the day values of up to +13 °C were recorded [51]. There has also been a decrease in the number of days with an average temperature below 0 °C; in the years 1961–1990, there were 59 on average, while in the last decade (2013–2022) this number decreased to about 35 days per year [52].
Snowfall in the region is becoming less frequent and less abundant. In the winter season, the average snowfall in Poznań is about 34 mm, with the highest accumulation of about 41 mm at the beginning of February [53]. Such conditions affect surface runoff in the region. Less snowpack leads to reduced snow water storage, which results in reduced spring melt. As a result, surface runoff becomes less intense in spring but may become more variable during winter, especially when rain falls on frozen ground. This in turn can lead to faster runoff and an increased risk of local flooding.
The meteorological conditions for the beaver dams located in the Kończak riverbed were characterised based on data from the Szamotuły-Baborówko meteorological station. The meteorological conditions for the beaver dam located in the Mogilnica riverbed were characterised based on data from the Paproć meteorological station, while the meteorological conditions for the beaver dam located in the Cybina riverbed were characterised based on data from the Poznań-Ławica meteorological station. Table 2 shows the monthly distributions of average precipitation at the meteorological stations analysed.
The hydrological conditions in the catchments of the studied streams were developed based on available hydrometric data provided by IMGW (the Antoninek gauge for the Cybina River and the Konojad gauge for the Mogilnica River) or hydrological analyses that took into account precipitation models (Kończak river).

2.4. The Methodology for Studying Beaver Dams

To analyse the impact of beaver dams on the formation of the water table in the vicinity of each structure, the following studies, which also assess the technical condition of these structures, have been planned [54]:
  • Inventory and geodetic work for the structures, as well as tests on the material from which the dams were constructed;
  • Measurement of the water surface level in the vicinity of the beaver dams;
  • Measurements of the distribution of water flow velocity in cross-sections at the upper and lower sites of the beaver dams;
  • Determination of the granulometric composition of the sediment based on samples taken from the riverbed both downstream and upstream of the structure.
The water table configuration in the riverbed near the beaver dams was determined based on elevation measurements conducted during fieldwork. Detailed measurements of the riverbed were conducted, taking into account the geometry of the riverbed and the water table level. Based on measurements of the riverbed geometry and water level, and using AutoCAD software 2020, longitudinal profiles of the rivers in the vicinity of the beaver dams were drawn.
For hydrological analyses, the SCALGO Live software was used, which is considered a very useful tool for determining surface runoff paths and for providing a better understanding of the impact of land use on hydrological conditions in the catchment area. SCALGO is based on a digital terrain model obtained through Airborne Laser Scanning (ALS). According to the available information, the models take into account the detailed microrelief of the terrain, including buildings, road embankments, and drainage ditches. A Digital Elevation Model (DEM) was used to create a three-dimensional representation of fragments of the studied catchments. The terrain model was built with a raster resolution of 1×1 m. The programme was used, among other things, to determine the surface area and volume of the beaver ponds.
As a verification of the results from SCALGO, 3 models were prepared based on the existing DEMs of the analysed river sections. Each of the 3 models was prepared in 2 variants. The first variant was used to determine the water surface level for the applied discharges (SQ, SNQ and NNQ) for natural conditions. The second variant assumed the addition of beaver dams as Inline Structure with Gate as an interpretation of the porous and permeable structure of the beaver dam. The 1D hydrodynamic model HEC-RAS 6.3.x (https://www.hec.usace.army.mil (accessed 19 March 2025)) [55,56,57] was used to verify the extent of the backwater. In view of the complicated topography of the prepared models, default model assumptions were made. A characteristic feature of the diffusion wave equations used is the simplification of momentum by inertia. The computed water surface ordinates and velocity components do not differ significantly from those simulated with the full momentum model. However, the computations carried out are more stable and resistant to any perturbations caused by sudden changes in topography which occur in numerous cases in these models [58].
Steady flow was simulated as a specific step in unsteady flow computations [59]. The initial assumption of the simulation was a dry channel, and two boundary conditions were applied: upstream and downstream. At the upstream condition, steady values of the simulated flow in the form of hydrographs were used. At the downstream condition, normal depth was entered as resulting from the Manning equation. Computations were carried out until constant flow conditions were reached. The required time horizon was no longer than 5 days. The model was based on the existing DEM extended by field geometrical data of the channel taken during the field measurements. The values of the roughness coefficients were tared based on the hydrometric measurements taken during the measurements.
To determine the flow intensity of water, the results of velocity measurements taken at cross-sections using a Valeport Model 801 electromagnetic probe with an accuracy of 0.01 m/s. In each cross-section, several hydrometric verticals were identified, located both downstream and upstream of the structure. The measurements were conducted in accordance with the current hydrometric research methodology of IMGW-PIB. At each measurement point, 5 water velocity measurements were taken using an electromagnetic current meter.
During field inventory work, the condition of the beaver dams was also assessed, and an analysis of the construction material of each dam was conducted. The determination of the material used to construct the beaver dams was carried out based on measurements of the diameters of the branches that made up the structure of the dam. The measurements were made using a digital calliper with an accuracy of 0.5 mm. The material was randomly collected from the dam bodies without damaging or interfering with the structure itself.
The granulometric composition of the sediment samples was determined using the sieving method, according to the standard procedure described in the national standard PN-EN 933-1:2012 [60].
A grain size analysis of the samples taken was carried out by determining the following indices: Degree of sorting according to Hazen [61]:
u = d 60 d 10
Ground material well sorted, where u < 5.
Geometric standard deviation of the screening curve:
σ g = d 84 d 16
According to Little and Mayer [62], the soil material is heterogeneous where σg > 1.3.
Schoberl differential index [63]:
σ s = d 90 d 50
The soil material is differentiated when σs > 1.55.

3. Results

3.1. Inventory of Structures

3.1.1. The Beaver Dam at Kończak, km 4+075

The dam in the bed of the Kończak River at kilometre 4+075 spans the entire stream channel, causing water to back up on the upstream (Figure 6). The structure had a width of approx. 9.7 m and a height ranging from 0.68 to 0.80 m. The crown width of the dam was approx. 1.0 m. At the base (on the riverbed), the dam had a width of approx. 3.10 m. The longitudinal slope of the riverbed in the vicinity of the beaver dam is 1.5‰.

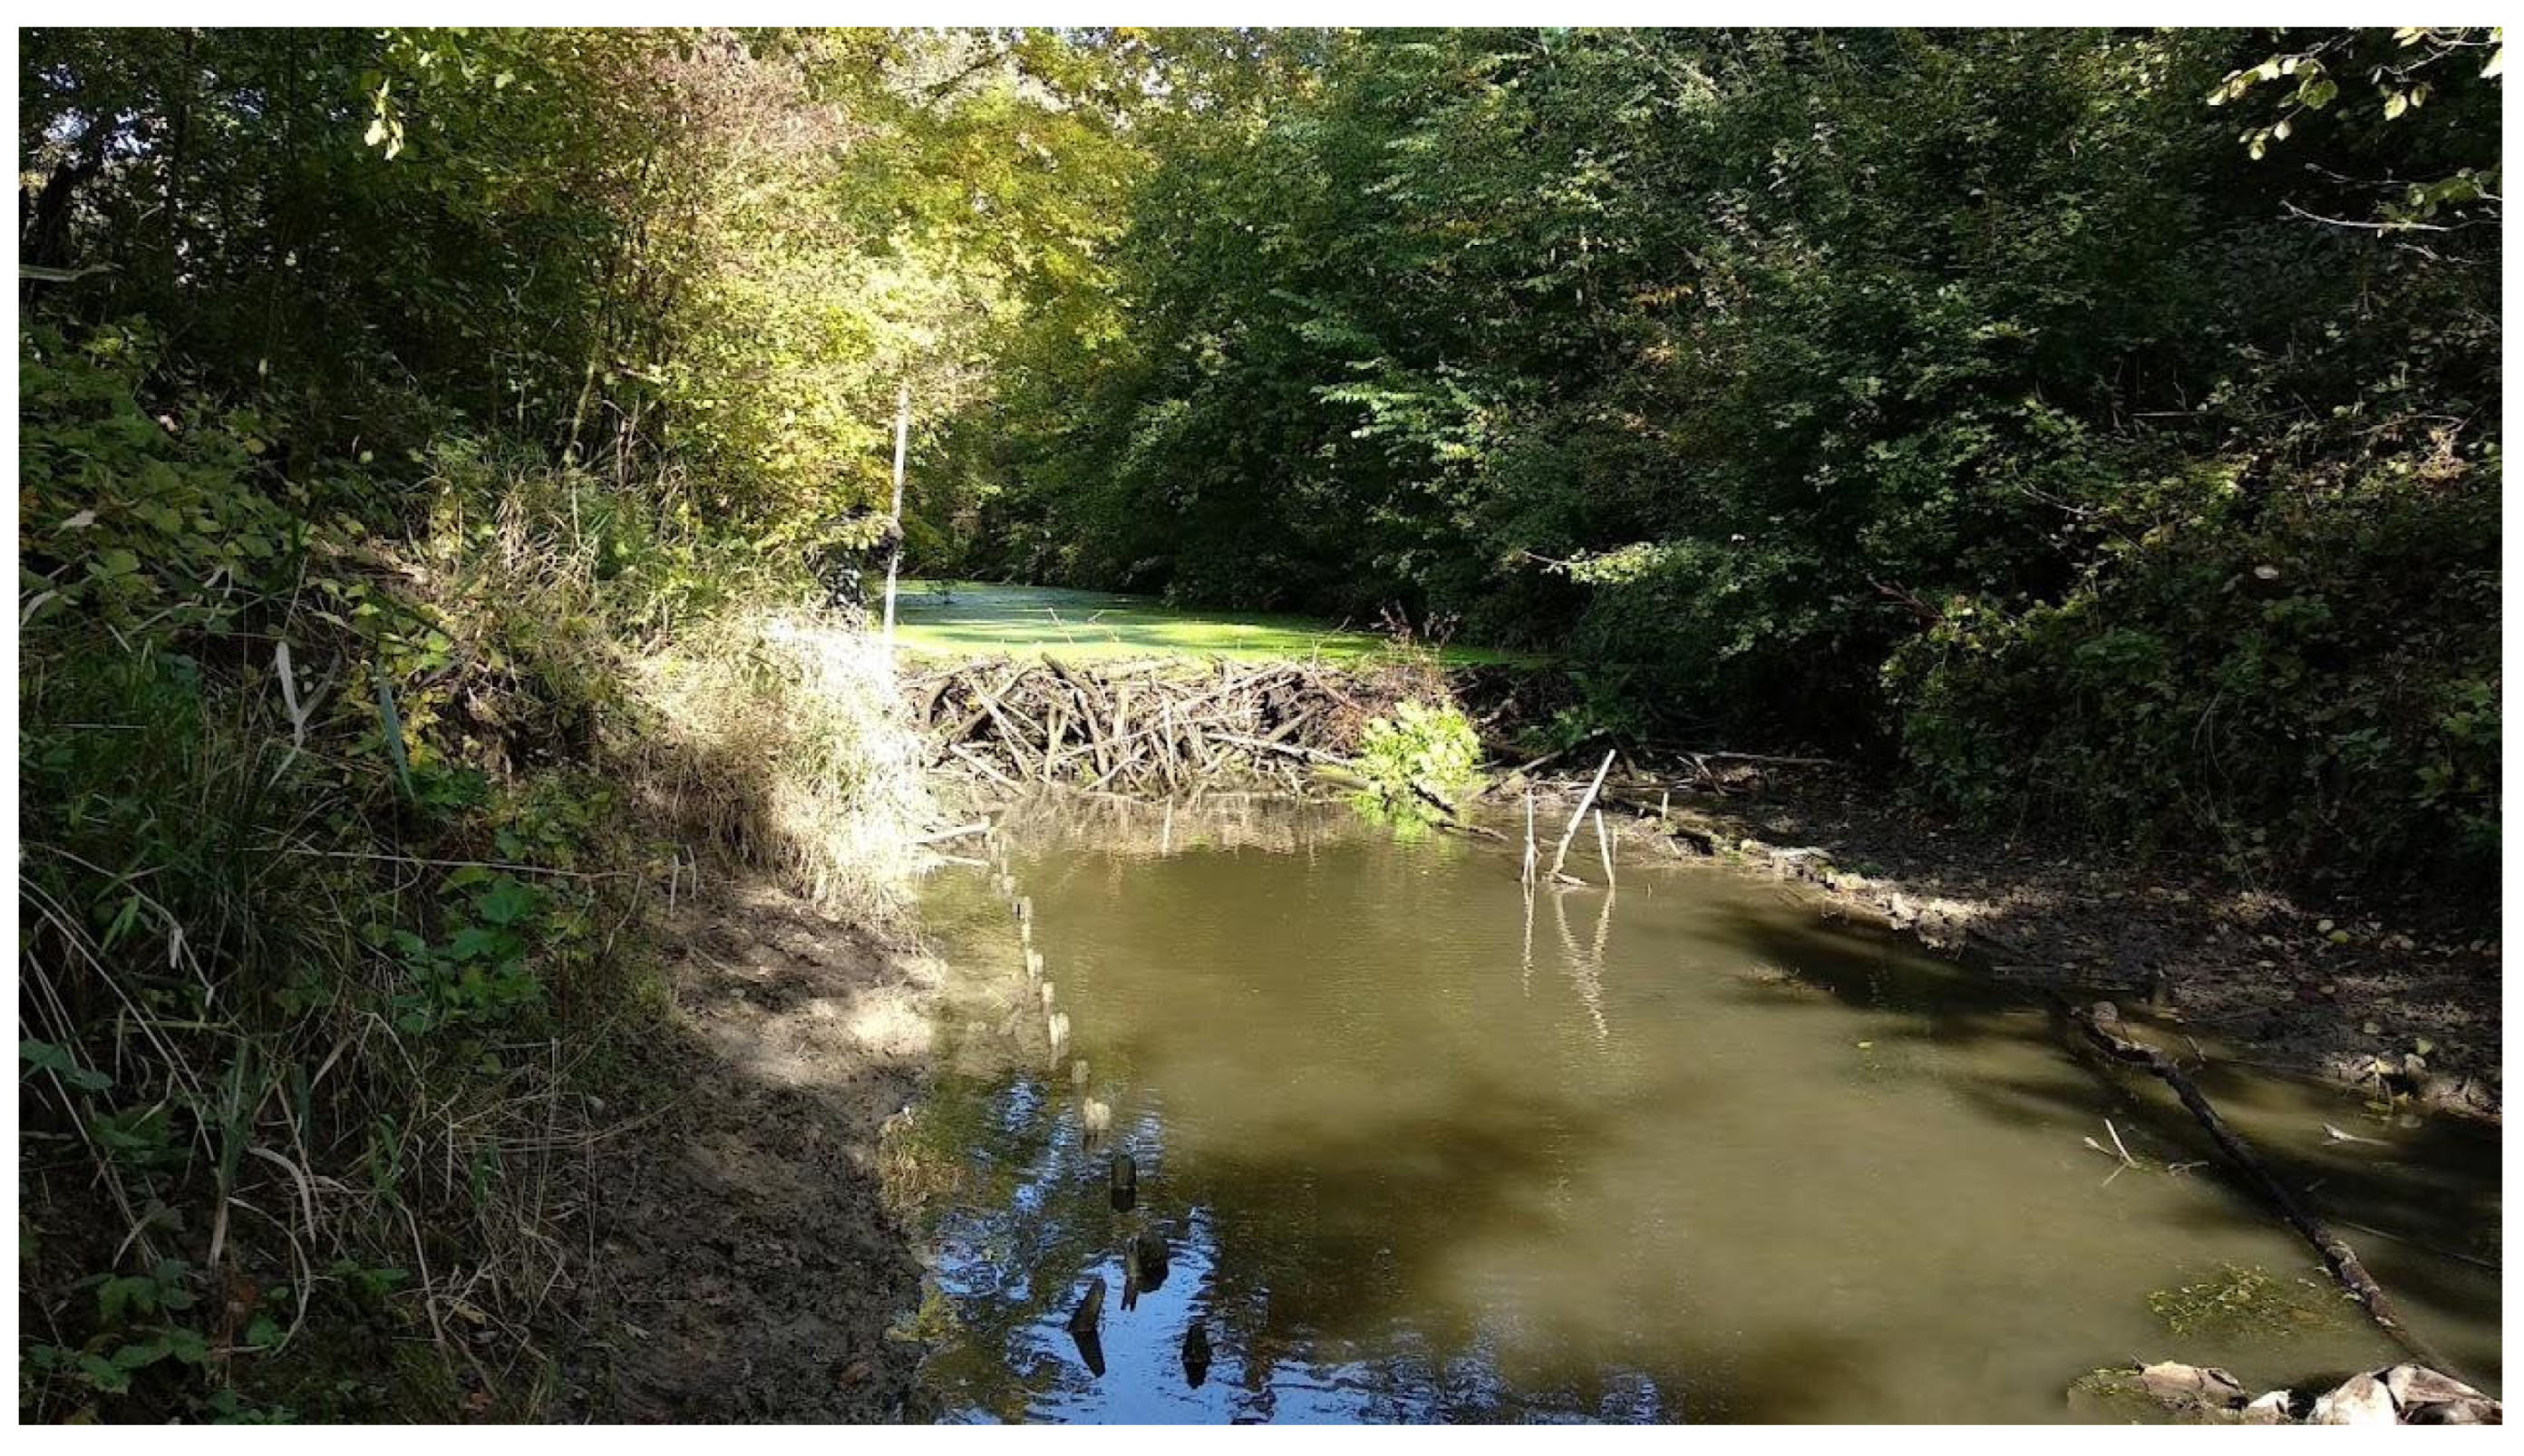
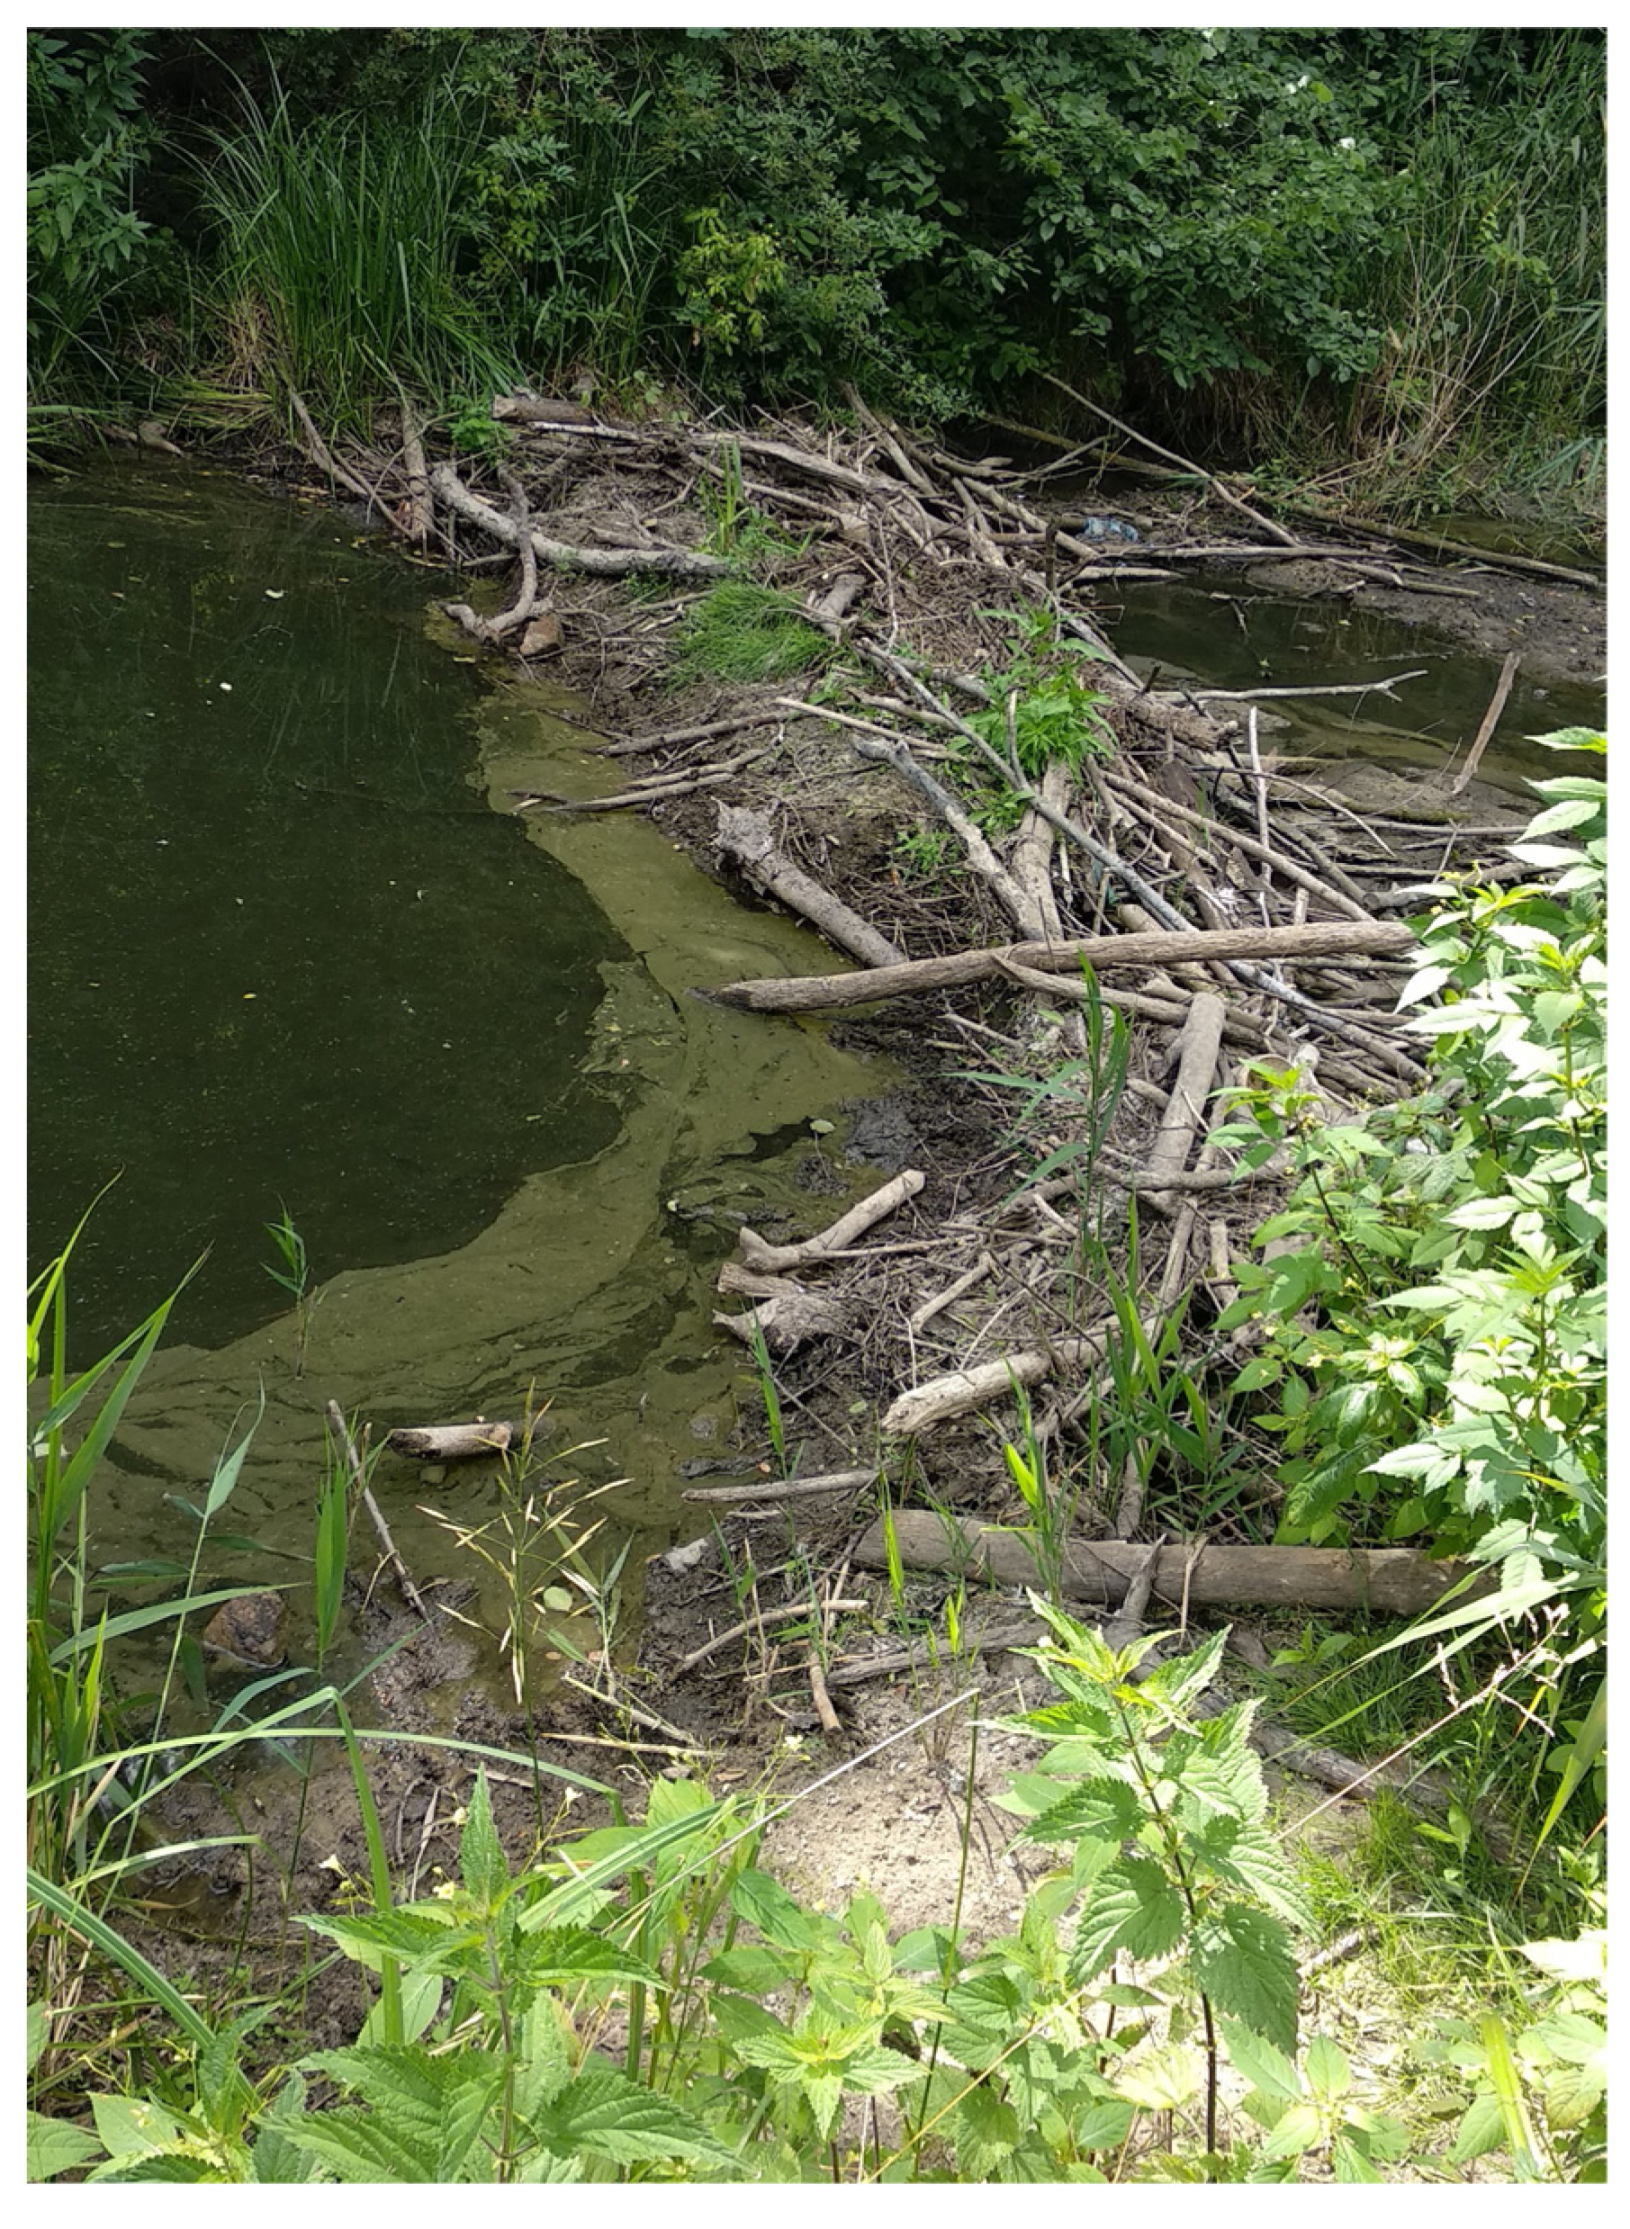
3.1.2. The Beaver Dam at Mogilnica, km 24+935

The beaver dam at km 24+935 of the Mogilnica River spans the entire riverbed, causing flooding at the upper site (Figure 7). The structure had a width of approx. 6.5 m and a height of approximately 0.88 m. The crown width of the dam was approx. 1.0 m. At the base (on the riverbed), the dam had a width of approx. 3.10 m. The longitudinal slope of the riverbed in the vicinity of the beaver dam is 1.5‰.

3.1.3. The Beaver Dam at Cybina, km 4+835

The beaver dam at km 4+835 of the Cybina River partitioned the entire riverbed, causing water impoundment at the upper site (Figure 8). The structure had a width of approx. 10 m and a height of approximately 0.70 m. The crown width of the dam was approx. 1.0 m. At the base (on the riverbed), the dam had a width of approx. 3.5 m. The longitudinal slope of the riverbed in the vicinity of the beaver dam is 3.0‰.

3.2. Characteristics of Hydrological Conditions

The Kończak River is an uncontrolled stream, on which no hydrometric observations are conducted. On the Mogilnica River, there is one hydrological station named Konojad 7+600, while on the Cybina River, there is a hydrological station at the Antoninek cross-section 8+500 km. The characteristic flow rates for the beaver dam cross-sections on the Cybina and Mogilnica rivers were calculated based on data from gauge observations. The hydrological conditions for the Kończak River catchment were determined based on commonly used empirical formulas [64,65] for Flinta River catchment.
The average annual flow of SQ was calculated based on the following formula:
S Q = 0.03171 · C m · H · F           [ m 3 · s 1 ]
where
0.03171—replacement value of the precipitation index expressed in metres to flow [m·km−2];
Cm—value of the runoff coefficient [dm3·s−1·km−2];
H—average precipitation over the years [m];
F—catchment area [km2].
Due to the small catchments with a fairly characteristic land cover, the runoff coefficients for each catchment were calculated based on the formulas proposed by Jokiel et al. [66]:
C m = 0.063 · W s 0.25 · Ψ 0.1           d m 3 · s 1 · k m 2
where
0.063—runoff coefficient for lowland rivers [-];
Ψ—the average slope of the banks [‰];
Ws—average elevation of the catchment, calculated according to the formula [m]:
W s = 0.5 · W z W u
where
Wz—elevation of the source [m a.s.l.];
Wu—elevation of the outlet [m a.s.l.].
Ψ = Δ W A [ ]
where
ΔW = Wz − Wu [m];
A—catchment area [km2].
The mean low-flow SNQ (8) and the lowest flow QN (NNQ) (9) were calculated based on the following formulas [67]:
S N Q = n · y · S Q           m 3 · s 1
N N Q = n · y · S Q           m 3 · s 1
n—flow coefficient 0.4 for SNQ and 0.2 for NNQ [-];
y—a coefficient for catchments dependent on terrain shape and land cover [-].
The flow values calculated based on Formulas (4), (8), and (9) for characteristic flows in the riverbeds are compiled in Table 3.
Based on the hydrological data, hydrographs were drawn up for the individual catchments. The Kończak River (Figure 9) did not exceed the average annual discharge except for two times in the spring. The situation was slightly better on the Mogielnica River, where the average annual discharge was exceeded every spring (Figure 10). However, during summer, the flows significantly decreased below the average low discharge. In contrast, the Cybina River was characterised by exceptionally low flows throughout the research period (Figure 11).

3.3. Water Table Riverbed Configuration

3.3.1. The Riverbed near Beaver Dam Kończak, km 4+075

Figure 12 shows the water surface elevation in the Kończak riverbed from km 4+058 to km 4+105. The difference in the water surface level between the upper and lower sites of the dam is h = 0.30 m. Water flowed both through the crown of the structure and partially through the structure, which made it possible, based on Woo and Weddington’s [68] division, to characterise the beaver dam as an overflow flow type. The result of the impoundment observed on the Kończak River is the phenomenon that involves an accumulation of material carried above the dam and erosion of the lower site. On the longitudinal profile (Figure 12), accumulated material above the dam is visible. The thickness of the accumulated material in P5 is approximately 0.15 m. The lower site is characterised by erosion reaching 0.30 m in P3, which should be reduced, however, by the local embankment from P2, formed from the coarsest fractions originating from P3.

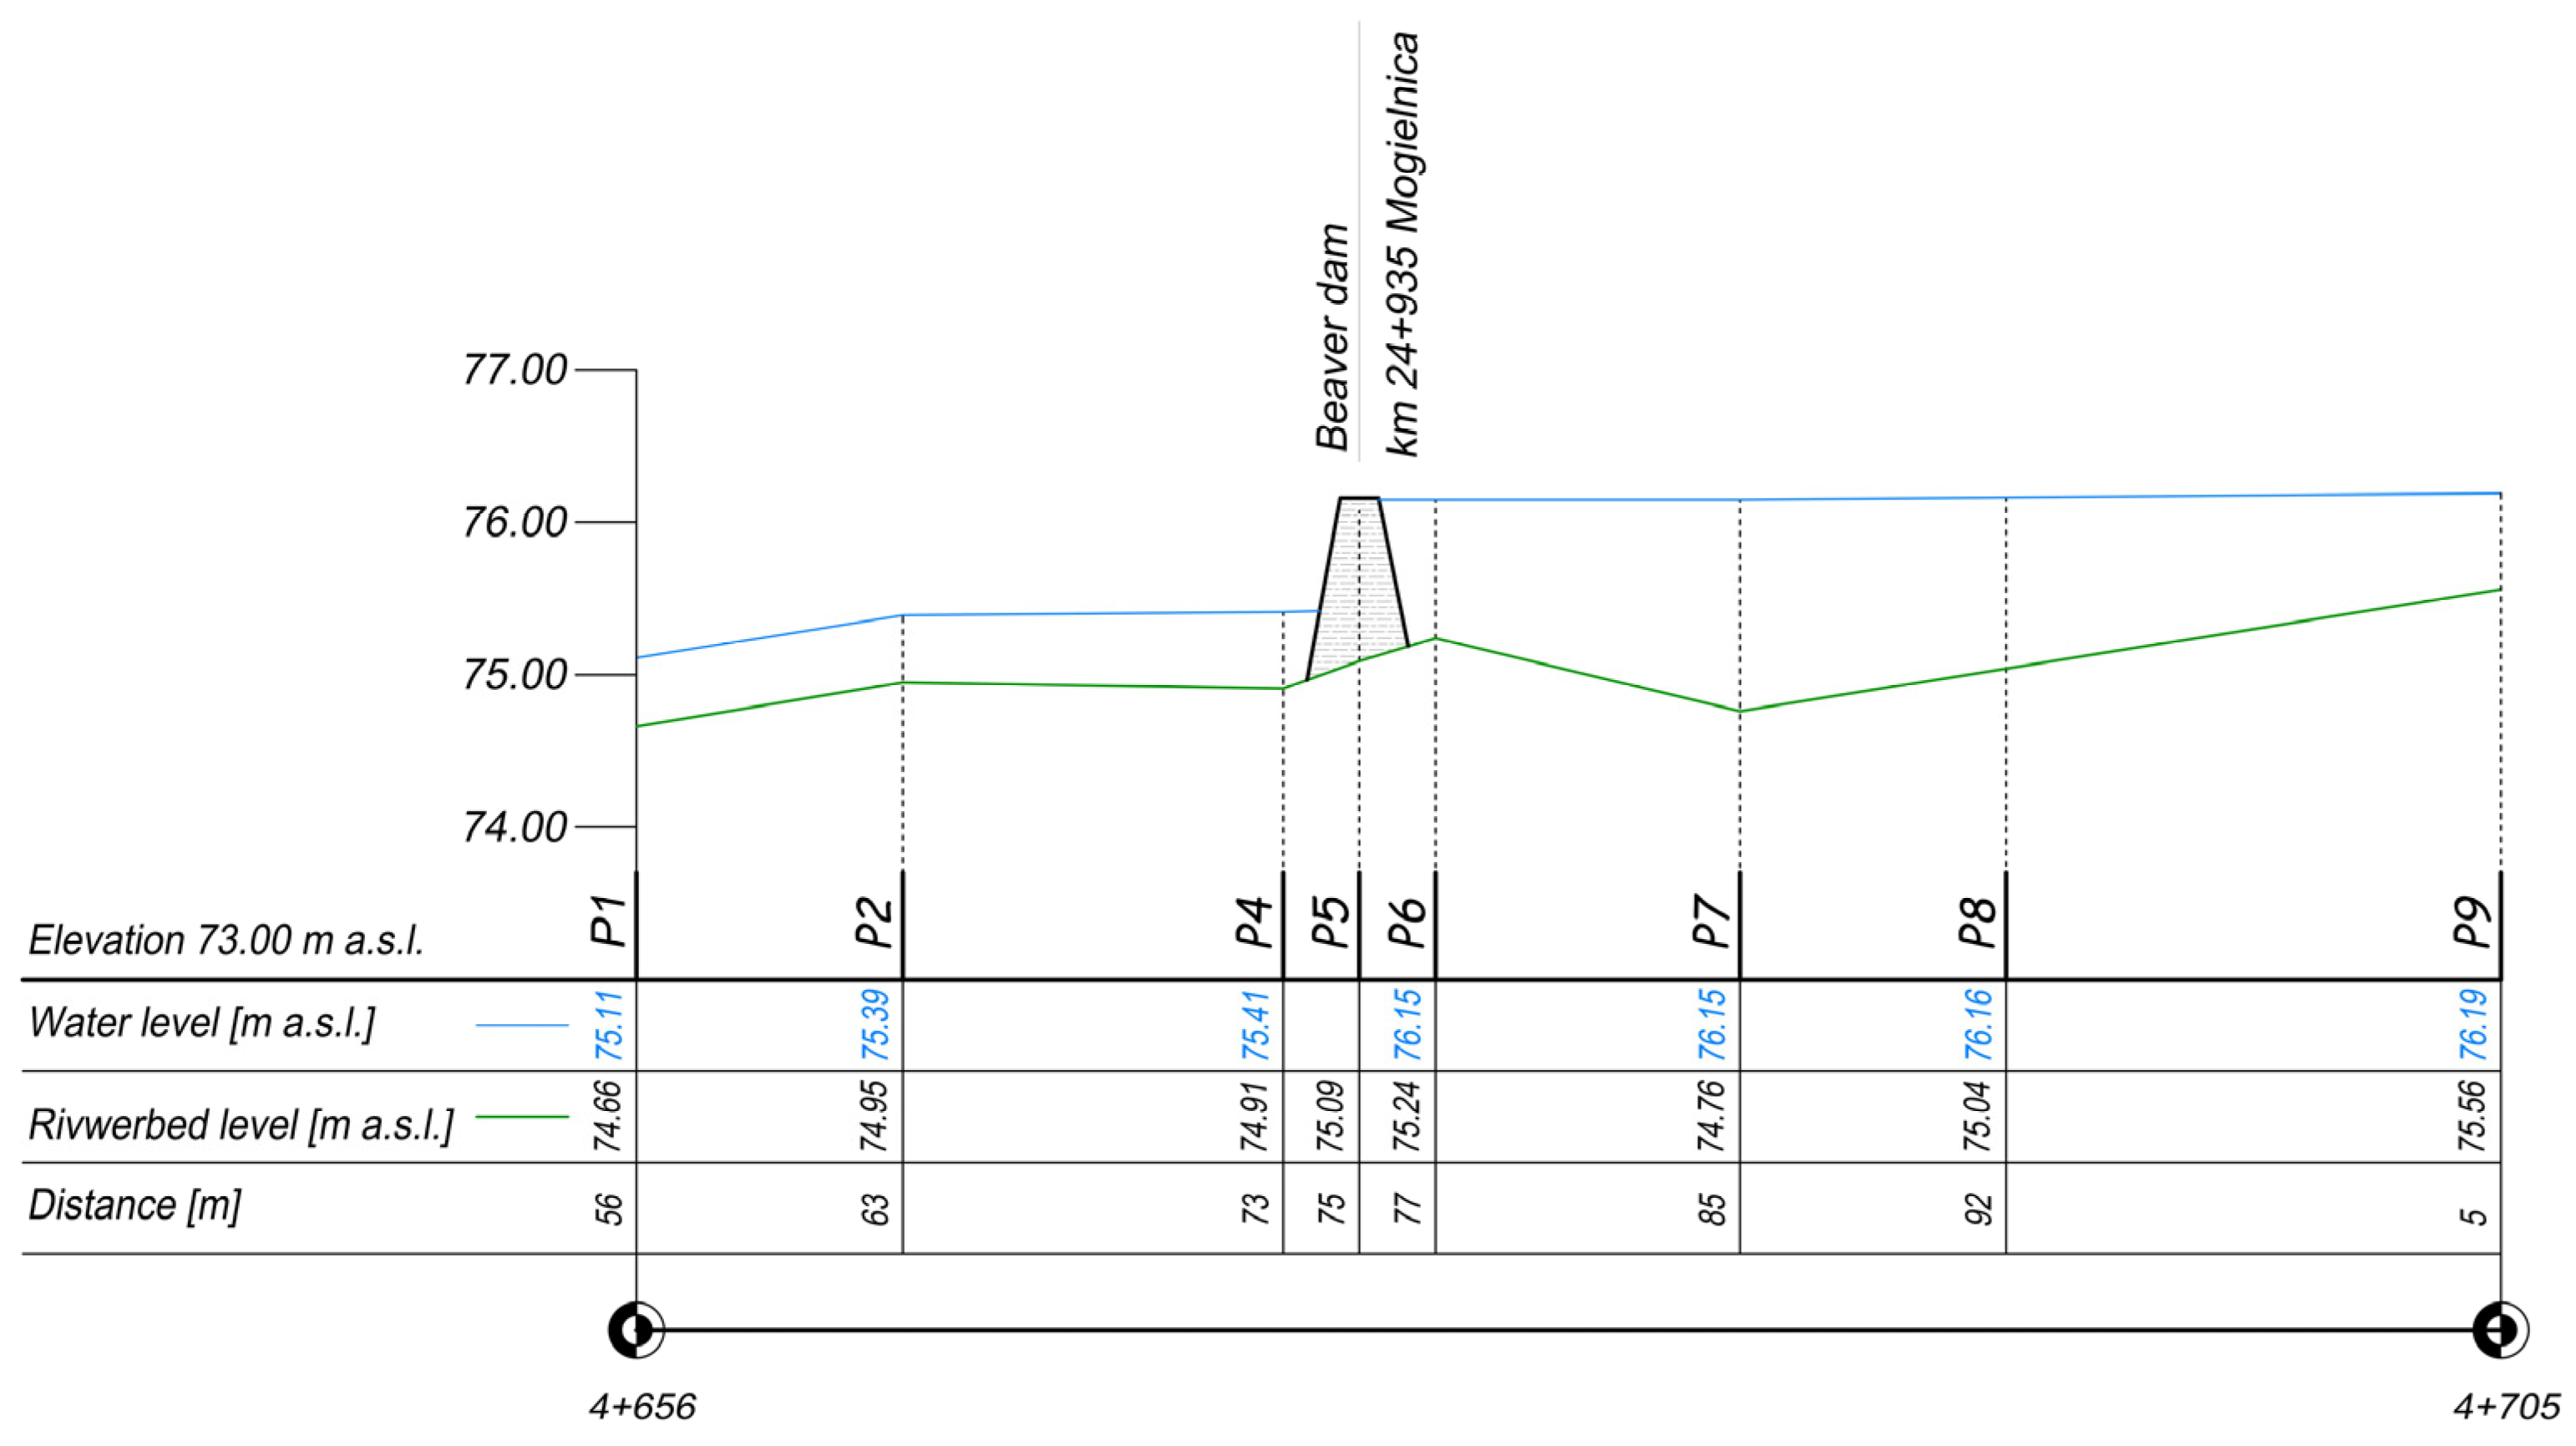
3.3.2. The Riverbed near Beaver Dam Mogilnica, km 24+935

Figure 13 shows the water table configuration in the bed of the Mogilnica River from km 24+915 to km 24+953, where the dam has been constructed. At the upper site, the water table level during the measurements was 76.15 m above sea level, while at the lower site, it was 75.41 m above sea level. The difference in the water table level was as much as Δh = 0.75 m. The flow of water occurred through the crown of the structure and partially through the structure, which made it possible, based on Woo and Weddington’s [68] division, to define the nature of the dam as overflow flow. A definitive determination of the longitudinal changes in the riverbed caused by damming on the Mogilnica River is hindered by the beaver activity, which involves sealing the dam structure with bed material from the upper site. The visible difference between P6 and P7 (Figure 13) is 0.48 m, but due to the locally increased bed slope above the dam caused by the extraction of material for dam construction, the amount of accumulated material according to the average longitudinal slope could be approximately 0.20 m. The erosion of the lower site is slightly longer than on other studied structures and it extends almost to the cross-section of P2. The difference between P2 and P3 is 0.21 m; however, the accumulation of coarser parts of the thicker parts of the bottom debris was not observed in the section up to P1.

3.3.3. The Riverbed near Beaver Dam Cybina, km 4+835

Figure 14 presents the arrangement of the water surface in the Cybina River channel in the section from km 4+816 to km 4+849. In the case of the dam at km 4+835 of the Cybina River, a water impoundment of 0.32 m was observed, even though the examined dam showed signs of being abandoned at the time of the study. The water surface on the upper site was at an elevation of 60.52 m a.s.l., while on the lower site, it was at an elevation of 60.15 m a.s.l. Further downstream of the structure, the water surface level decreases due to the slope of the riverbed. During the field inspection, no flow over the crest was observed; therefore, based on the classification by Woo and Weddington [68], the dam was identified as a flow-through type. Despite similar impoundments observed on the Cybina and Kończak rivers, the extent of accumulation and erosion on the Cybina is minimal. The final section of the Cybina River is characterised by smaller slopes, and the series of lakes located about 1250 m upstream from the dam effectively reduces the amount of sediment carried, allowing it to settle in the relatively flat riverbed of the Cybina. Just upstream of the dam from the cross-section P4 (Figure 14), the accumulation of fine fractions reached just under 0.12 m. The visible erosion at the lower site in P3, despite its small value of 0.09 m, could not progress further due to the strong washout of fine fractions and the inability to erode fractions larger than 10 mm.

3.4. Construction Material of Beaver Dams

3.4.1. Material of the Beaver Dam Kończak, km 4+075

For the analysis of the dam on the Kończak River, a total of 28 branches were randomly selected, with the majority of the branches having a diameter of Ø 5 cm (eight pieces). Seven branches with a diameter of Ø 3 cm were also measured, along with five branches each with a diameter of Ø 2 cm and Ø 4 cm, as well as two branches with a diameter of Ø 1 cm and one branch with a diameter of Ø 6 cm. The average diameter of the measured material was Ø 3.54 cm. The construction material consisted of local willow shrubs (Salix alba L.) and young black alder trees (Alnus glutinosa (L.) Gaertn.), whose gnaw marks were identified on the streambanks. During the field survey, it was observed that the dam, in addition to the wooden material, was also constructed with mud (which sealed the structure) and was largely covered with herbaceous vegetation.

3.4.2. Material of the Beaver Dam Mogilnica, km 24+935

For the dam on the Mogilnica River, a total of 32 randomly selected branches were measured, with diameters ranging from Ø 1 to 15 cm. Among the selected branches, the most numerous—seven pieces—had a diameter of Ø 5 cm. There were also numerous branches with a diameter of Ø 4 cm (six pieces), Ø 6 cm (four pieces), and Ø 3 cm (four pieces). The average diameter of the measured branches was Ø 4.72 cm. The dam was sealed with mud, which consisted of alluvial sediment made up of a mixture of dust and clay with the addition of organic substances.

3.4.3. Material of the Beaver Dam Cybina, km 4+835

The total number of measured branches of the beaver dam on the Cybina River amounted to 39. The most branches identified were those with a diameter of Ø 2 cm (10 pieces). For a diameter of Ø 3 cm, there were 6 pieces, while in the range of Ø 4–9 cm, there were 18 branches. The average diameter of the measured material was Ø 3.82 cm. The construction material mainly consisted of willow shrubs (Salix alba L.) and branches of black alder (Alnus glutinosa (L.) Gaertn.), whose trunks and gnaw marks were identified on the banks of the stream.
In Figure 15, the percentage distribution of branches with a specific diameter for each beaver dam is shown. The largest percentage of all measured samples consisted of branches with a diameter of Ø 5 cm (22.14%). Branches with a diameter of Ø 4 cm accounted for 19.08%. Branches with diameters ranging from 2 to 5 cm accounted for as much as 74.05% of all branches used in the construction of the dams. The dam, in addition to the wooden material, was also constructed with mud (which sealed the structure) and was partially covered with herbaceous vegetation. The construction material consisted of willow shrubs (Salix alba L. and Salix fragilis) and branches of black alder (Alnus glutinosa (L.) Gaertn.), with trunks and gnaw marks identified on the banks of the stream.

3.5. Granulometric Composition of the Riverbed Sediment

The granulometric composition of the debris was determined for the beaver dams on the Kończak, Mogilnica, and Cybina rivers. The debris was collected from the riverbed in cross-sections above (1 m) and below the dam (3 m).
Figure 16 shows the grain size curve of the sediment samples taken from the riverbed of the Kończak River (km 4+075). The grain size analysis in the cross-section above the dam indicates that d50 is 0.18 mm, while below the dam it is 8.15 mm. The results confirm the observed phenomenon of changes in the hydromorphology of the streambed. As a result of the impoundment, the transport of sediment ceases, and fine fractions settle (coarser material is retained earlier, in the initial range of beaver impoundment, where the water flow velocity decreases). On the other hand, on the lower site, along with the process of bed erosion and the formation of scouring, the bed material is flushed out, and a gravelling process of the riverbed occurs. In the case of d90 in the cross-section above the dam, the material diameter was determined to be 0.73 mm, while for the cross-section below the dam, the d90 diameter was found to be 9.68 mm.
In Figure 17, the grain size curve of the sediment sample taken from the bed of the Mogilnica River is presented. The grain size analysis indicates that the d50 in the section above the dam consists of particles with a diameter of 0.19 mm, while below the dam, the diameter is as large as 7.06 mm. This indicates, on one hand, the deposition of fine fractions in front of the dam, and on the other hand, the sorting of material and the process of bed paving in the section downstream of the dam, where bed erosion and the appearance of scouring are observed. In the case of d90, in the section above the dam, the diameter was determined to be 0.88 mm, while for the section below the dam, the diameter was 9.62 mm.
Figure 18 shows the grain size curve of the sediment sample taken from the riverbed of the Cybina River, 2 m downstream of the Beaver Dam at km 4+835. The substitute diameter d90 of the sample is 9.87 mm, and d50 is 8.83 mm. Even the value of d10 is very high, at 8.07 mm. This indicates a very strong sorting of the riverbed at the lower site and a trace amount of finer sediment particles. The particle size distribution on the upper site (2 m above the dam) is more similar to the other sites and has the following substitute diameters: d90 = 0.50 mm and d50 = 0.19 mm.
Describing debris is not straightforward, so it is useful to use different indices to characterise the sediment particles. Table 4 provides a summary of the characteristic diameters and indices describing the sediments.
Analysing the table results (Table 4), it was found that the sorting index u above the beaver dam indicates good sorting of the material. This relationship does not occur for the Cybina River. However, for the debris sampling points located below the dam, the material was not sorted. For all samples taken both below and above the beaver dams, there was heterogeneity except for the sampling point located below the dam on the Cybina River. Analysis of the value of the Schoberl differential index indicates that all samples taken above the Beaver dams are characterised by material of various grains, while below the dams this index showed non-differentiated material. Grain size analyses clearly indicate the impact of beaver dams on debris transport and changes in riverbed debris characteristics.
Considering the analysis of the obtained results, the impact of beaver dams on the hydrological regime within their vicinity is largely comparable to the effect of anthropogenic dam structures. Due to the fact that beavers choose smaller rivers or floodplains of larger rivers for dam construction, the impact range of their structures is usually smaller than that of hydrotechnical structures built by humans, whose height and water impoundment are significantly greater.

3.6. Determining the Volume of Beaver Ponds

The SCALGO programme was used to estimate the volume of beaver ponds and to represent the areas that will be covered by water as a result of the rise in the water table in the stream. Due to the capabilities of the software, these results were presented assuming a constant water level elevation. The estimated increase in retention volume was calculated based on the increase in the cross-sectional area of the stream resulting from the rise in the water level (considering the water level before the beaver dam and after the beaver dam, treating the latter as the pre-dam construction level) and the length determined using the Digital Elevation Model (DEM) of the backwater formed as a result. Due to the decrease in the water level as a result of the cessation of the backwater effect created by the beaver dams, it was assumed that the backwater would decrease uniformly along its length, halving the estimated increased retention volume.
Based on field measurements of the rise in water level resulting from the construction of beaver dams, the change in the water level elevation was estimated. Figure 19 shows the extent of the backwater associated with the rise in the water level on the Kończak River. The impact of the backwater in this case was 675 m. Figure 20 shows the extent of the backwater associated with the rise in water levels on the Mogilnica River, which reaches as much as 1.6 km. Additionally, as a result of the rise in the water level, two depressions in the terrain were filled with water, forming two ponds. The additional retention volume of these two ponds is approximately 22,100 m3, with a water level elevation of 76.32 m above sea level. In Figure 21, the reach of the backwater effect related to the rise in the water table on the Cybina River is shown. In this case, due to the terrain surrounding the river and the slope of the riverbed, the reach of the backwater effect was at maximum 290 m. The summary of the estimated volume of retained water associated with the raised water level due to the construction of beaver dams is presented in Table 5.
The increased retention volume associated with the rise in the water table due to the construction of a beaver dam, and consequently the inundation of a larger area, is primarily dependent on the topography of the surrounding land and the potential for water to spread into lower-lying areas. Considering these circumstances, particularly favourable conditions were observed in the case of the beaver dam on the Mogilnica River. On the other hand, the incised riverbed of the Cybina River, which has relatively steep slopes along the studied section, resulted in a very modest increase in the amount of water retained.

3.7. Determination of the Extent of Beaver Dams

The extent of damming was determined on the basis of the model created in the Hec-Ras software 6.3.1 for the Kończak River in the vicinity of beaver dam Kończak, km 4+075. Due to the local riverbed structure and small differences in damming levels, the extent of the backwater was similar for all considered discharges (SQ, SNQ, and NNQ) (Figure 22). The Figure shows both the water level without damming and including effect the beaver dam. At the lowest discharge considered (NNQ), the extent of impact of the damming was 415 m. At the mean lowest discharge (SNQ), the extent of the backwater was approximately 435 m. However, for the mean discharge (SQ) it slightly increased to 445 m.
The model prepared in HEC-RAS for the section of the Mogielnica river near the beaver dam Mogilnica, km 24+935, allowed, on the basis of the computation assumptions made in Section 2.3, for the extent of damming to be determined. The high damming levels reached by the beaver dam resulted in a long range of backwater effect. The lowest determined reach for the NNQ flow was 960 m. At the mean lowest discharge (SNQ), the reach of the backwater was approximately 1080 m, and for the mean flow (SQ) the reach of the backwater increased to 1505 m above the dam (Figure 23).
The application of computation procedures identical to those used for the two previous rivers allowed the HEC-RAS programme to prepare a model of the Cybina river section near the beaver dam Cybina, 4+835, in a variant without damming and including the effect of the beaver dam. The extent of the damming was thus determined. The strongly varying longitudinal profile of the Cybina contributed to a non-linear increase in the extent of the dam’s impact. The lowest determined reach for the NNQ discharge was 103 m. For the mean lowest flow (SNQ), the reach of the backwater was approximately 105 m. However, for the mean low discharge (SQ), the increase in the reach of the backwater reached up to 138 m above the dam (Figure 24).
The table below shows the extent of the backwater estimated by hydrodynamic model computations using the HEC-RAS software 6.3.1 (Table 6).
Analysis of the tabulated ranges in Table 6 and Table 5 allowed a correlation to be charted between the ranges obtained with the SCALGO and HEC-RAS software 6.3.1 used (Figure 25). The value of the linear correlation was R = 0.969, indicating a high convergence of the reaches obtained with both tools. Obviously, the computations made with the HEC-RAS model are more precise and methodologically correct. However, in spite of two slight outliers (for the NNQ discharge for the Mogilnica River and the SQ discharge for the Cybina River), it was indicated that the SCALGO can be considered helpful for a preliminary and quick estimation of the extent of the beaver dams’ impact on the backwater in the riverbed. It also allows an approximate estimation of the volume of water retained without the need for hydrometric measurements or the creation of complex numerical models and simulations.
The steady development of technology and the numerous software and applications being developed allow for easier and more efficient environmental analyses. Although the obtained trend in the dependence of the extent of the backwater for both methods shows a high correlation, one has to remember, however, that locally one can reckon with even quite large differences in the results obtained. The differences for beaver dams in the extent of backwater effect shown in Table 5 and Table 6 are the best illustration of this. This phenomenon is impacted by local conditions of channel topography and discharge conditions. Simplifications of the computation used in SCALGO for long and flat river sections, as in the case of the Cybina model, can result in relatively large discrepancies compared to more advanced numerical models such as the HEC-RAS model.

4. Discussion

The widespread reintroduction and expansion of the Eurasian beaver across Europe is currently taking on a new dimension, related to the need for adaptation to climate change and the necessity of developing new catchment management strategies. In the face of current environmental challenges, studies on natural dams provide a basis for understanding how beavers can serve as a “nature-based solution” for sustainable land management, water resource protection, and flood prevention [69]. Beavers build dams that regulate the extent of their territory, while simultaneously modifying the entire surrounding environment [70]. There is also an active discussion in Poland about the impact of beaver reintroduction on geomorphology and hydrology, as well as the economic losses associated with damage to and flooding of forests [18]. Beavers, especially in river systems, typically dig bank dens where they build their lodges [16]. Beavers often dig multiple dens within a single territory, which can contribute to the formation of significant amounts of sediment transported into the stream [71]. This can also lead to landslides of riverbanks or even flood control embankments [72].
Some researchers argue that beavers not only support biodiversity and protect vulnerable species, increase resilience to floods, droughts, and fires, and enhance carbon sequestration, but also contribute to the rewilding of rivers [73,74]. Beaver dams are very helpful in mitigating the impact of climate change on the environment [73]. They slow down and store water, which can be available to riparian vegetation during drought periods, effectively protecting riparian ecosystems from droughts and reducing the effects of water stress on the environment. The objects presented in the study are located in the Greater Poland region—an area in Poland with the highest water deficits. The average annual precipitation in this area does not exceed 600 mm, while the value of evapotranspiration reaches 700–800 mm. The determined values of the runoff coefficient are approximately 0.2 dm3∙s−1∙km−2 with a European average of 9.61 s−1∙km−2 [75]. The activity of beavers in these streams results in local retention and the maintenance of elevated groundwater levels. The studies conducted on selected lowland streams confirmed the potential for effective channel retention, both in relation to riverbeds and adjacent areas.
The potential of beavers is often underutilised despite numerous data confirming their effectiveness [76,77]. The layout of the dams built by beavers is crucial here. Similar to the Cybina River, in many places, especially where there are steeper slopes, cascading systems are formed. This was also confirmed by analyses conducted by Neumayer et al. [45], who pointed out that beaver dam cascades allow for water retention between individual structures, even during small flood events that occur no more frequently than once every two years. The characteristics of the terrain also influence flood flows. Three cascades described by Neumayer et al. [45], which were located in narrow valleys in mountainous areas, resulted in a slight reduction and flattening of flood waves. On the other hand, the cascade with wide floodplains and a slight river gradient of 0.5‰ caused a significant transformation of the flood peak (up to 13.1%). Research Puttock et al. [69] also confirmed that beavers have an impact on reducing flood flows. Their statistical analysis of 1000 flood events showed that the impact of beavers was statistically significant in reducing the peak of flood waves. The authors also stated that beaver dams can reduce average flood flows by up to approximately 60%. Another very interesting point is the fact that beaver dams are not as durable during heavy rains as retention reservoirs built by humans [78]. The researchers found that only 68% of beaver dams remained intact or were only slightly damaged after heavy rainfall.
Available literature data suggests that an analysis of the dam structure and the materials from which they are built is necessary. The conducted studies on three selected streams in Greater Poland confirmed that beavers use local materials, placing significant importance on sealing the structure with river silt. Based on the conducted observations, analyses of the building materials of beaver dams, and the classification of beaver dams according to Woo and Waddington [68] (Table 7), the individual structures were classified. The beaver dam at km 4+075 of the Kończak River was classified as Class 4, and its condition according to this classification was determined as old. The construction contained old branches, mud, and debris. In the case of the dam at km 4+835 of the Cybina River, it was classified similarly to the dam on the Kończak River, as Class 4. However, the beaver dam at km 24+935 of the Mogilnica River was ultimately classified as Class 4, despite its relatively good condition and suspicions about the active maintenance of a high water level (around 0.70 m). However, the fieldwork did not reveal any traces of fresh branches, which ultimately prevented the dam from being classified as Class 1.
The study of the internal properties of beaver dams revealed significant differences in the structure of the dams in different locations [79]. The physical differences in the dam structure alter the dynamics and variability of water storage in the pond, as well as some dam attributes related to the surrounding landscape. For example, the material of the dam influenced its height [73]. The constant presence of beavers is also important, as they maintain the good technical condition of the dam. Swinnen et al. [80] analysed an area of central Belgium where 15 beaver territories were compared. When beavers were present, and the water depth in summer was <0.68 m, the likelihood of dam construction was high; if the water depth was >0.68 m, dam construction was unlikely. Dams caused an average increase in water level in the upper course of the river by 0.47 ± 0.21 m. On average, the water level could have increased by only an additional 0.25 ± 0. 30 m upstream from the dam. Similar values were obtained for the structures on the Kończak and Cybina rivers (approximately 0.32–0.37 m). This can significantly influence obtaining appropriate environmental conditions, including maintaining environmental flows, especially under water stress conditions.
Research has shown the undeniable impact of beavers on the hydromorphology of lowland streams. Previous studies conducted on Carpathian watercourses [74] (indicated that beaver-initiated processes mostly alter artificially standardised river sections. In the upper reaches, the impact of beaver activity (mainly dams) is reflected in increased lateral erosion, while the slower water current reduces the tendency for bottom degradation. In the lower reaches, the impact of beavers is mainly limited to bank fragmentation (landslides and burrows). Lateral erosion, accumulation of material on the edges of the river banks, and accumulation of wood debris have a local impact on the width of the river channel. Similar observations were made based on an analysis of the Chevral River (Belgium). Two beaver dam sequences were demonstrated there in 2004 [71]. The authors measured sediment volumes deposited behind the dams and determined grain size distribution patterns. Flows and sediment fluxes were measured at the inlet and outlet of each dam sequence. Between 2004 and 2011, 1710 m3 of sediment with an average thickness of 0.25 m was deposited behind beaver dams. The thickness of the sediment layer was significantly (p < 0.001) related to the area of beaver ponds. Along the stream, the sediment thickness of beaver ponds showed a sinusoidal deposition pattern, in which beaver ponds with thick sediment layers were preceded by ponds with thinner sediment layers. A downstream textural coarsening in the dam sequences was also observed, probably because of dam failures subsequent to surges. Differences in sediment flux between the inflow and outflow at the beaver pond sequence were related to the river hydrograph, with deposition taking place during the rising limbs and slight erosion during the falling limbs. The 7-year-old sequences have filtered 190.19 ton of sediment out of the Chevral river, which is of the same order of magnitude as the 374.4 ton measured in pond depos-its, with the difference between the values corresponding to beaver excavations (60.24 ton), inflow from small tributaries, and runoff from the valley flanks [71]. The detailed analysis of sedimentation in beaver pond sequences confirms the potential of beavers to contribute to river and wetland restoration and catchment management.

5. Conclusions

Studies on the impact of beaver dams confirm that these structures play an important role in storing surface and groundwater, mitigating the effects of drought, and reducing surface runoff. Beaver dams alter local hydrology, affecting water detention time, infiltration and flow stabilisation. They also increase soil moisture in river valleys, which promotes biodiversity. Reservoirs created by beavers can store significant amounts of water, creating habitats for numerous species. In the past, intensive human activities led to the disappearance of beaver populations in Poland, but reintroduction efforts have been underway since the 1970s. In the 1970s, these made it possible for the beavers to return and re-colonise the rivers.
Studies conducted on three small lowland watercourses located in central Poland have shown their influence on shaping local watercourse hydromorphology and water retention. Even in the case of transformed, narrow troughs (e.g., on the Mogilnica River, where channel retention was relatively low and the valley layout did not directly affect the formation of beaver ponds), the extent of beaver dam accumulation allowed the formation of shallow floodplains and ponds in field depressions hydraulically connected to the main watercourse. The novelty of the research is the detailed analysis of dam construction material and the study of the impact of beaver dams on river hydromorphology, including changes in the grain size of the debris. Precise data on the size of dams and their impact on water retention and sediment transport have been obtained, enriching knowledge of the role of beavers in ecosystems. Despite the numerous ecological benefits, there are still research gaps regarding the comparison of beaver dams with other anthropogenic water bodies. This includes their impact on farming and forestry. The results also underscore the potential importance of beaver dams as a tool in water management in the context of climate change. The magnitudes of flows during low periods clearly indicate that only the additional effect of beaver damming in the channel allows the water table to remain relatively stable.
In conclusion, beaver activities are an important part of natural environmental protection strategies. Their impact on hydrology, water retention and sedimentary processes underscores the need for greater consideration of their role in landscape management planning and water conservation. Further research into their activities could provide valuable insights into the effective use of beavers in sustainable development.

Author Contributions

Conceptualization, T.K., S.Z. and M.H.; methodology, T.K., S.Z. and M.H.; software, T.K., M.H., M.P. and S.Z.; validation, T.K., M.H. and S.Z.; formal analysis, T.K. and M.H.; investigation, S.Z., T.K. and M.H.; resources, T.K., S.Z. and M.H.; writing—original draft preparation, T.K., M.H. and S.Z.; writing—review and editing, T.K., M.H. and S.Z.; visualisation, T.K., M.P., M.H. and S.Z.; supervision, T.K. and M.H.; project administration, T.K.; funding acquisition, S.Z., T.K. All authors have read and agreed to the published version of the manuscript.

Funding

The research was co-founded by the National Science Centre of Poland within the PRELUDIUM project (No. 2021/41/N/ST10/02490): “Evaluation of a zoogenic factor in the modification of environmental, retention and hydromorphological conditions in small lowland watercourses based on the action of beavers (Castor fiber)” (2022–2025).

Institutional Review Board Statement

Not applicable.

Informed Consent Statement

Not applicable.

Data Availability Statement

The original contributions presented in this study are included in the article. Further inquiries can be directed to the corresponding author.

Acknowledgments

The research was co-founded by the National Science Centre of Poland within the PRELUDIUM project (No. 2021/41/N/ST10/02490): “Evaluation of a zoogenic factor in the modification of environmental, retention and hydromorphological conditions in small lowland watercourses based on the action of beavers (Castor fiber)” (2022–2025).

Conflicts of Interest

The authors declare no conflict of interest.

References

  1. Kałuża, T.; Pietruczuk, K.; Szoszkiewicz, K.; Tymiński, T. Assessment and Classification of the Ecological Status of Rivers in Poland According to the Requirements of the Water Framework Directive. Wasserwirtschaft 2014, 104, 24–29. [Google Scholar]
  2. Szałkiewicz, E.; Kałuża, T.; Grygoruk, M. Detailed Analysis of Habitat Suitability Curves for Macroinvertebrates and Functional Feeding Groups. Sci. Rep. 2022, 12, 10757. [Google Scholar] [CrossRef]
  3. Scamardo, J.E.; Marshall, S.; Wohl, E. Estimating Widespread Beaver Dam Loss: Habitat Decline and Surface Storage Loss at a Regional Scale. Ecosphere 2022, 13, e3962. [Google Scholar] [CrossRef]
  4. Butler, D.R. Characteristics of Beaver Ponds on Deltas in a Mountain Environment. Earth Surf. Processes Landf. 2012, 37, 876–882. [Google Scholar] [CrossRef]
  5. Feiner, K.; Lowry, C.S. Simulating the Effects of a Beaver Dam on Regional Groundwater Flow through a Wetland. J. Hydrol. Reg. Stud. 2015, 4, 675–685. [Google Scholar] [CrossRef]
  6. Boczon, A.; Wróbel, M.; Syniaiev, V. The Impact of Beaver Ponds on Water Resources in the Catchment Area in the Browsk Forest District-a Case Study. Lesn. Pr. Badaw. 2009, 70, 363. [Google Scholar]
  7. Tape, K.D.; Jones, B.M.; Arp, C.D.; Nitze, I.; Grosse, G. Tundra Be Dammed: Beaver Colonization of the Arctic. Glob. Chang. Biol. 2018, 24, 4478–4488. [Google Scholar] [CrossRef]
  8. Somorowska, U. Amplified Signals of Soil Moisture and Evaporative Stresses across Poland in the Twenty-First Century. Sci. Total Environ. 2022, 812, 151465. [Google Scholar] [CrossRef]
  9. Nyssen, J.; Pontzeele, J.; Billi, P. Effect of Beaver Dams on the Hydrology of Small Mountain Streams: Example from the Chevral in the Ourthe Orientale Basin, Ardennes, Belgium. J. Hydrol. 2011, 402, 92–102. [Google Scholar] [CrossRef]
  10. Oleszczuk, R.; Jadczyszyn, J.; Gnatowski, T.; Brandyk, A. Variation of Moisture and Soil Water Retention in a Lowland Area of Central Poland—Solec Site Case Study. Atmosphere 2022, 13, 1372. [Google Scholar] [CrossRef]
  11. Macfarlane, W.W.; Wheaton, J.M.; Bouwes, N.; Jensen, M.L.; Gilbert, J.T.; Hough-Snee, N.; Shivik, J.A. Modeling the Capacity of Riverscapes to Support Beaver Dams. Geomorphology 2017, 277, 72–99. [Google Scholar] [CrossRef]
  12. Dittbrenner, B.J.; Pollock, M.M.; Schilling, J.W.; Olden, J.D.; Lawler, J.J.; Torgersen, C.E. Modeling Intrinsic Potential for Beaver (Castor canadensis) Habitat to Inform Restoration and Climate Change Adaptation. PLoS ONE 2018, 13, e0192538. [Google Scholar] [CrossRef]
  13. Kałuża, T.; Sojka, M.; Wróżyński, R.; Jaskuła, J.; Zaborowski, S.; Hämmerling, M. Modeling of River Channel Shading as a Factor for Changes in Hydromorphological Conditions of Small Lowland Rivers. Water 2020, 12, 527. [Google Scholar] [CrossRef]
  14. Bajkowski, S.; Oleszczuk, R.; Urbański, J.; Jadczyszyn, J.; Kiraga, M. The Impact of Beaver Dams on the Dynamic of Groundwater Levels at Łąki Soleckie. Sustainability 2024, 16, 4135. [Google Scholar] [CrossRef]
  15. Correll, D.L.; Jordan, T.E.; Weller, D.E. Beaver Pond Biogeochemical Effects in the Maryland Coastal Plain. Biogeochemistry 2000, 49, 217–239. [Google Scholar] [CrossRef]
  16. Collen, P.; Gibson, R.J. The General Ecology of Beavers (Castor spp.), as Related to Their Influence on Stream Ecosystems and Riparian Habitats, and the Subsequent Effects on Fish. Rev. Fish. Biol. Fish. 2000, 10, 439–461. [Google Scholar] [CrossRef]
  17. Ulloa, E.; Anderson, C.B.; Ardon, M.; Morcia, S.; Valenzuela, A.E.J. Organic Matter Characterization and Decomposition Dynamics in Sub Antarctic Streams Impacted by Invasive Beavers. Lat. Am. J. Aquat. Res. 2012, 40, 881–892. [Google Scholar] [CrossRef]
  18. Brazier, R.E.; Puttock, A.; Graham, H.A.; Auster, R.E.; Davies, K.H.; Brown, C.M.L. Beaver: Nature’s Ecosystem Engineers. WIREs Water 2021, 8, e1494. [Google Scholar] [CrossRef]
  19. Gibson, P.P.; Olden, J.D. Ecology, Management, and Conservation Implications of North American Beaver (Castor canadensis) in Dryland Streams. Aquat. Conserv. 2014, 24, 391–409. [Google Scholar] [CrossRef]
  20. Westbrook, C.J.; Cooper, D.J.; Baker, B.W. Beaver Dams and Overbank Floods Influence Groundwater–Surface Water Interactions of a Rocky Mountain Riparian Area. Water Resour. Res. 2006, 42, 2005WR004560. [Google Scholar] [CrossRef]
  21. Połeć, K.; Grzywna, A. Influence of Natural Barriers on Small Rivers for Changes in Water Quality Parameters. Water 2023, 15, 2065. [Google Scholar] [CrossRef]
  22. Naiman, R.J.; Johnston, C.A.; Kelley, J.C. Alteration of North American Streams by Beaver. BioScience 1988, 38, 753–762. [Google Scholar] [CrossRef]
  23. Karran, D.J.; Westbrook, C.J.; Wheaton, J.M.; Johnston, C.A.; Bedard-Haughn, A. Rapid Surface-Water Volume Estimations in Beaver Ponds. Hydrol. Earth Syst. Sci. 2017, 21, 1039–1050. [Google Scholar] [CrossRef]
  24. Johnston, C.A. Fate of 150 Year Old Beaver Ponds in the Laurentian Great Lakes Region. Wetlands 2015, 35, 1013–1019. [Google Scholar] [CrossRef]
  25. Hood, G.A.; Bayley, S.E. Beaver (Castor canadensis) Mitigate the Effects of Climate on the Area of Open Water in Boreal Wetlands in Western Canada. Biol. Conserv. 2008, 141, 556–567. [Google Scholar] [CrossRef]
  26. Orazi, V.; Hagge, J.; Gossner, M.M.; Müller, J.; Heurich, M. A Biodiversity Boost From the Eurasian Beaver (Castor fiber) in Germany’s Oldest National Park. Front. Ecol. Evol. 2022, 10, 873307. [Google Scholar] [CrossRef]
  27. Jones, B.M.; Tape, K.D.; Clark, J.A.; Nitze, I.; Grosse, G.; Disbrow, J. Increase in Beaver Dams Controls Surface Water and Thermokarst Dynamics in an Arctic Tundra Region, Baldwin Peninsula, Northwestern Alaska. Environ. Res. Lett. 2020, 15, 075005. [Google Scholar] [CrossRef]
  28. Wright, J.P.; Jones, C.G.; Flecker, A.S. An Ecosystem Engineer, the Beaver, Increases Species Richness at the Landscape Scale. Oecologia 2002, 132, 96–101. [Google Scholar] [CrossRef]
  29. Lokteff, R.L.; Roper, B.B.; Wheaton, J.M. Do Beaver Dams Impede the Movement of Trout? Trans. Am. Fish. Soc. 2013, 142, 1114–1125. [Google Scholar] [CrossRef]
  30. Gamborg, C.; Sandøe, P. Beavers and Biodiversity: The Ethics of Ecological Restoration. In Cambridge Studies in Philosophy and Biology; Oksanen, M., Pietarinen, J., Eds.; Philosophy and Biodiversity; Cambridge University Press: Cambridge, UK, 2004; pp. 217–236. [Google Scholar] [CrossRef]
  31. Nica, A.; Petrea, M.-S.; Simionov, I.-A.; Antache, A.; Cristea, V. Ecological Impact of European Beaver, Castor fiber. Sci. Papers. Ser. D. Anim. Sci. 2022, 65, 1. [Google Scholar]
  32. Rosell, F.; Bozsér, O.; Collen, P.; Parker, H. Ecological Impact of Beavers Castor fiber and Castor canadensis and Their Ability to Modify Ecosystems. Mammal. Rev. 2005, 35, 248–276. [Google Scholar] [CrossRef]
  33. Bashinskiy, I.V. The Effect of Beaver (Castor fiber Linnaeus, 1758) Activity on Amphibian Reproduction. Inland Water Biol. 2008, 1, 326–331. [Google Scholar] [CrossRef]
  34. Ciechanowski, M.; Kubic, W.; Rynkiewicz, A.; Zwolicki, A. Reintroduction of Beavers Castor fiber May Improve Habitat Quality for Vespertilionid Bats Foraging in Small River Valleys. Eur. J. Wildl. Res. 2011, 57, 737–747. [Google Scholar] [CrossRef]
  35. Dalbeck, L.; Lüscher, B.; Ohlhoff, D. Beaver Ponds as Habitat of Amphibian Communities in a Central European Highland. Amphib. Reptil. 2007, 28, 493–501. [Google Scholar] [CrossRef]
  36. Połeć, K.; Grzywna, A.; Tarkowska-Kukuryk, M.; Bronowicka-Mielniczuk, U. Changes in the Ecological Status of Rivers Caused by the Functioning of Natural Barriers. Water 2022, 14, 1522. [Google Scholar] [CrossRef]
  37. Nummi, P.; Hahtola, A. The Beaver as an Ecosystem Engineer Facilitates Teal Breeding. Ecography 2008, 31, 519–524. [Google Scholar] [CrossRef]
  38. Wróbel, M. Population of Eurasian Beaver (Castor fiber) in Europe. Glob. Ecol. Conserv. 2020, 23, e01046. [Google Scholar] [CrossRef]
  39. Crawford, J.C.; Liu, Z.; Nelson, T.A.; Nielsen, C.K.; Bloomquist, C.K. Microsatellite Analysis of Mating and Kinship in Beavers (Castor canadensis). J. Mammal. 2008, 89, 575–581. [Google Scholar] [CrossRef]
  40. Burchsted, D.; Daniels, M.; Thorson, R.; Vokoun, J. The River Discontinuum: Applying Beaver Modifications to Baseline Conditions for Restoration of Forested Headwaters. BioScience 2010, 60, 908–922. [Google Scholar] [CrossRef]
  41. Pietrek, A.G.; Escobar, J.M.; Fasola, L.; Roesler, I.; Schiavini, A. Why Invasive Patagonian Beavers Thrive in Unlikely Habitats: A Demographic Perspective. J. Mammal. 2016, 98, 283–292. [Google Scholar] [CrossRef]
  42. Butler, D.R. The Failure of Beaver Dams and Resulting Outburst Flooding: A Geomorphic Hazard of the Southeastern Piedmont. Geogr. Bull. 1989, 31, 29–38. [Google Scholar]
  43. Butler, D.R.; Malanson, G.P. The Geomorphic Influences of Beaver Dams and Failures of Beaver Dams. Geomorphology 2005, 71, 48–60. [Google Scholar] [CrossRef]
  44. Case, B.; Egyir, P.; Geertsema, M. Catastrophic Failure of a Beaver Dam at Chudnuslida Lake, East Central British Columbia. In Proceedings of the Geohazards 2003, Third Canadian Conference on Geotechnique and Natural Hazards, Edmonton, AB, Canada, 9–10 June 2003; Canadian Geotechnical Society Edmonton: Edmonton, AB, Canada, 2003; pp. 9–10. [Google Scholar] [CrossRef]
  45. Neumayer, M.; Teschemacher, S.; Schloemer, S.; Zahner, V.; Rieger, W. Hydraulic Modeling of Beaver Dams and Evaluation of Their Impacts on Flood Events. Water 2020, 12, 300. [Google Scholar] [CrossRef]
  46. Polish General Office of Geodesy and Cartography. Available online: www.gugik.gov.pl (accessed on 10 January 2025).
  47. Polish National Water Management Board. Available online: https://kzgw.gov.pl (accessed on 10 January 2025).
  48. Polish National Geological Institute. Available online: http://dm.pgi.gov.pl/ (accessed on 10 January 2025).
  49. Polish Data Portal. Map of the Hydrographic Division of Poland at Scale 1:10 000 (MPHP10k). Available online: https://dane.gov.pl/pl/dataset/2167,mapa-podzialu-hydrograficznego-polski-w-skali-110 (accessed on 10 January 2025).
  50. Polish Institute of Meteorology and Water Management. Available online: https://danepubliczne.imgw.pl/data/ (accessed on 19 December 2024).
  51. Szyga-Pluta, K. Ground Temperature Variability in Poznań (2011–2020). Quaest. Geogr. 2022, 41, 63–77. [Google Scholar] [CrossRef]
  52. Pińskwar, I.; Choryński, A.; Graczyk, D. Vulnerability to Extreme Weather Events: Mapping Future Hazards in Wielkopolska Region, Poland. Reg. Environ. Chang. 2024, 24, 139. [Google Scholar] [CrossRef]
  53. Szyga-Pluta, K. Changes in Snow Cover Occurrence and the Atmospheric Circulation Impact in Poznań (Poland). Theor. Appl. Climatol. 2022, 147, 925–940. [Google Scholar] [CrossRef]
  54. Hämmerling, M.; Kałuża, T.; Zawadzki, P.; Zaborowski, S.; Sojka, M.; Liberacki, D.; Ptak, M. Application of Multi-Criteria Analytic Methods in the Assessment of the Technical Conditions of Small Hydraulic Structures. Buildings 2022, 12, 115. [Google Scholar] [CrossRef]
  55. Brandimarte, L.; Di Baldassarre, G. Uncertainty in Design Flood Profiles Derived by Hydraulic Modelling. Hydrol. Res. 2012, 43, 753–761. [Google Scholar] [CrossRef]
  56. Gibson, S.; Comport, B.; Corum, Z. Calibrating a Sediment Transport Model through a Gravel-Sand Transition: Avoiding Equifinality Errors in HEC-RAS Models of the Puyallup and White Rivers. In Proceedings of the World Environmental and Water Resources Congress, Sacramento, CA, USA, 18 May 2017; American Society of Civil Engineers: Sacramento, CA, USA, 2017; pp. 179–191. [Google Scholar]
  57. USACE. HEC-RAS River Analysis System User’s Manual Version 6.0; Report No. CPD-68; US Army Corps of Engineers Hydrologic Engineering Center: Davis, CA, USA, 2020.
  58. Peker, İ.B.; Gülbaz, S.; Demir, V.; Orhan, O.; Beden, N. Integration of HEC-RAS and HEC-HMS with GIS in Flood Modeling and Flood Hazard Mapping. Sustainability 2024, 16, 1226. [Google Scholar] [CrossRef]
  59. Dysarz, T.; Kałuża, T.; Mickevičius, K.; Veigneris, J.; Zawadzki, P.; Kujawiak, S.; Zaborowski, S.; Wicher-Dysarz, J.; Walczak, N.; Nieć, J.; et al. Application of Physical and Numerical Modeling for Determination of Waterway Safety under the Bridge in Kaunas City, Lithuania. Water 2023, 15, 731. [Google Scholar] [CrossRef]
  60. Polish Standard PN-EN 933-1:2012; Oznaczanie Składu Ziarnowego. Metoda Przesiewania. [Determination of Grain Composition. Sieving Method]. PKN: Warszawa, Poland, 2012.
  61. Dąbkowski, S.L. Kryterium Shieldsa po pięćdziesięciu latach [Shields criterion after fifty years]. Gospodarka Wodna. 1992, 1, 19–21. (In Polish) [Google Scholar]
  62. Little, W.C.; Meyer, P.G. Stability of Channel Beds by Armoring. J. Hydraul. Div. 1976, 102, 1647–1661. [Google Scholar]
  63. Dittrich, A. Wechselwirkung Morphologie/Strömung Naturnaher Fließgewässer. Mitt. Inst. Wasserwirtsch. Und Kult. 1998, 198, 208. [Google Scholar]
  64. Byczkowski, T. Hydrologia; SGGW: Warszawa, Poland, 1999. [Google Scholar]
  65. Cupak, A. Regionalization Methods for Low Flow Estimation in Ungauged Catchments—A Review. Acta Sci. Pol. Formatio Circumiectus 2020, 19, 21–35. [Google Scholar] [CrossRef]
  66. Jokiel, P.; Marszelewski, W.; Pociask-Karteczka, J. Hydrologia Polski. Wydawnictwo Naukowe PWN: Warszawa, Poland, 2022. [Google Scholar]
  67. Mamak, W. Regulacja Rzek i Potoków; Arkady: Warszawa, Poland, 1958. [Google Scholar]
  68. Woo, M.-K.; Waddington, J.M. Effects of Beaver Dams on Subarctic Wetland Hydrology. Arctic 1990, 43, 223–230. [Google Scholar]
  69. Puttock, A.; Graham, H.A.; Cunliffe, A.M.; Elliott, M.; Brazier, R.E. Eurasian Beaver Activity Increases Water Storage, Attenuates Flow and Mitigates Diffuse Pollution from Intensively-Managed Grasslands. Sci. Total Environ. 2017, 576, 430–443. [Google Scholar] [CrossRef]
  70. Stringer, A.P.; Gaywood, M.J. The Impacts of Beavers Castor spp. on Biodiversity and the Ecological Basis for Their Reintroduction to Scotland, UK. Mammal. Rev. 2016, 46, 270–283. [Google Scholar] [CrossRef]
  71. De Visscher, M.; Nyssen, J.; Pontzeele, J.; Billi, P.; Frankl, A. Spatio-temporal Sedimentation Patterns in Beaver Ponds along the Chevral River, Ardennes, Belgium. Hydrol. Process. 2014, 28, 1602–1615. [Google Scholar] [CrossRef]
  72. Harvey, G.L.; Henshaw, A.J.; Brasington, J.; England, J. Burrowing Invasive Species: An Unquantified Erosion Risk at the Aquatic-Terrestrial Interface. Rev. Geophys. 2019, 57, 1018–1036. [Google Scholar] [CrossRef]
  73. Ronnquist, A.L.; Westbrook, C.J. Beaver Dams: How Structure, Flow State, and Landscape Setting Regulate Water Storage and Release. Sci. Total Environ. 2021, 785, 147333. [Google Scholar] [CrossRef]
  74. Gorczyca, E.; Krzemień, K.; Sobucki, M.; Jarzyna, K. Can Beaver Impact Promote River Renaturalization? The Example of the Raba River, Southern Poland. Sci. Total Environ. 2018, 615, 1048–1060. [Google Scholar] [CrossRef] [PubMed]
  75. Fal, B.; Bogdanowicz, E. Zasoby Wód Powierzchniowych Polski. Wiadomości Instututu Meteorol. I Gospod. Wodnej 2002, 25, 3–38. [Google Scholar]
  76. Jordan, C.E.; Fairfax, E. Beaver: The North American Freshwater Climate Action Plan. WIREs Water 2022, 9, e1592. [Google Scholar] [CrossRef]
  77. Fairfax, E.; Whittle, A. Smokey the Beaver: Beaver-dammed Riparian Corridors Stay Green during Wildfire throughout the Western United States. Ecol. Appl. 2020, 30, e02225. [Google Scholar] [CrossRef]
  78. Westbrook, C.J.; Ronnquist, A.; Bedard-Haughn, A. Hydrological Functioning of a Beaver Dam Sequence and Regional Dam Persistence during an Extreme Rainstorm. Hydrol. Process. 2020, 34, 3726–3737. [Google Scholar] [CrossRef]
  79. Hartman, G.; Törnlöv, S. Influence of Watercourse Depth and Width on Dam-building Behaviour by Eurasian Beaver (Castor fiber). J. Zool. 2006, 268, 127–131. [Google Scholar] [CrossRef]
  80. Swinnen, K.R.R.; Rutten, A.; Nyssen, J.; Leirs, H. Environmental Factors Influencing Beaver Dam Locations. J. Wildl. Manag. 2019, 83, 356–364. [Google Scholar] [CrossRef]
Figure 1. Location of Wielkopolskie voivodship (yellow) in comparison to Poland (green) (a), and beaver dams in the figure, based on the administrative map of the Wielkopolskie Voivodeship: 1—beaver dam Kończak km 4+075, 2—beaver dam Mogilnica km 24+935, and 3—beaver dam Cybina 4+835 (b) (orange—catchment) (source: author’s analysis based on [46]).
Sustainability 17 03317 g001
Figure 2. Location of objects in catchment: 1—beaver dam Kończak River, km 4+075, 2—beaver dam Mogilnica River, km 24+935, 3—beaver dam Cybina River, km 4+835. The hydrographic network of the Kończak (a,b), Mogilnica (c,d), and Cybina (e,f) catchments up to the cross-section of the beaver dam on elevation maps (a,c,e) and land use structure maps (b,d,f) (source: own study based on the topographic map).
Sustainability 17 03317 g002
Figure 3. View from downstream of the beaver dam in Kończak River, km 4+075 (view on 10 May 2022).
Sustainability 17 03317 g003
Figure 4. View from downstream of the site of the beaver dam in Mogilnica River, km 24+935 (11 October 2022).
Sustainability 17 03317 g004
Figure 5. View from upstream of the site of the beaver dam in Cybina River, km 4+835 (10 May 2021).
Sustainability 17 03317 g005
Figure 6. Drawings of the (a) top view and (b) cross-section of the beaver dam Kończak, km 4+075.
Sustainability 17 03317 g006
Figure 7. Drawings of the (a) top view and (b) cross-section of the beaver dam Mogilnica, 24+935.
Sustainability 17 03317 g007
Figure 8. Drawings of the (a) top view and (b) cross-section of the beaver dam Cybina, km 4+835.
Sustainability 17 03317 g008
Figure 9. Hydrogram for the Kończak River at cross-section beaver dam Kończak, km 4+675, in the years 2018–2023 with average annual (green) and average low (yellow) values.
Sustainability 17 03317 g009
Figure 10. Hydrogram for the Mogielnica River at cross-section beaver dam Mogielnica, km 24+935, in the years 2018–2023 with average annual (green) and average low (yellow) values.
Sustainability 17 03317 g010
Figure 11. Hydrogram for the Cybina River at cross-section beaver dam Cybina, km 4+835, in the years 2018–2023 with average annual (green) and average low (yellow) values.
Sustainability 17 03317 g011
Figure 12. The longitudinal profile of the Kończak River from km 4+058 to km 4+105.
Sustainability 17 03317 g012
Figure 13. The longitudinal profile of the Mogilnica River from km 24+915 to km 24+953.
Sustainability 17 03317 g013
Figure 14. The long profile of the Cybina River from km 4+816 to km 4+849.
Sustainability 17 03317 g014
Figure 15. The percentage share of branches of a given diameter in the construction of the studied beaver dams.
Sustainability 17 03317 g015
Figure 16. The grain size curves of sediment samples taken from the riverbed of the Kończak River at km 4+075, both upstream and downstream of the beaver dam.
Sustainability 17 03317 g016
Figure 17. Grain size curves of sediment samples taken from the riverbed of the Mogilnica River at km 24+935, upstream and downstream of the beaver dam.
Sustainability 17 03317 g017
Figure 18. Grain size curves of sediment samples taken from the riverbed of the Cybina River at km 4+835, both below and above the beaver dam.
Sustainability 17 03317 g018
Figure 19. The extent of backflow resulting from the construction of the beaver dam on the Kończak River at the following water elevations: (a) 54.16 m a.s.l., (b) 54.21 m a.s.l., (c) 54.40 m a.s.l.
Sustainability 17 03317 g019
Figure 20. The extent of backflow due to the construction of the beaver dam on the Mogilnica River at the following water elevations: (a) 76.07 m a.s.l., (b) 76.15 m a.s.l., (c) 76.32 m a.s.l.
Sustainability 17 03317 g020
Figure 21. The extent of backflow due to the construction of the beaver dam on the Cybina River at the following water level elevations: (a) 60.45 m a.s.l., (b) 60.52 m a.s.l., (c) 60.69 m a.s.l.
Sustainability 17 03317 g021
Figure 22. Range of impact of beaver dam Kończak, km 4+075, for considered discharges (blue for normal water levels, light blue for dammed water levels).
Sustainability 17 03317 g022
Figure 23. Range of impact of beaver dam Mogilnica, km 24+935, for considered discharges (blue for normal water levels, light blue for dammed water levels).
Sustainability 17 03317 g023
Figure 24. Range of impact of beaver dam Cybina, 4+835, for considered discharges (blue for normal water levels, light blue for dammed water levels).
Sustainability 17 03317 g024
Figure 25. Correlation of backscatter ranges obtained with the used models.
Sustainability 17 03317 g025
Table 1. Summary of cartographic materials used in the study.
No.MaterialsScaleSystemYearSource
1National Register of Boundaries-922018[46]
2Raster Hydrographical Map of Poland1:50,000922010[47]
3Administrative Map of Poland1:10,000922017[46]
4General Geographic Map of Poland1:50,000922017[46]
5Map of Physico-Geographical Regions1:50,000922017[48]
6Digital Terrain Model (DTM)-922016–2023[46]
7Database of General Geographical Objects (BDOO)-922018[46]
Table 2. The average monthly amount of atmospheric precipitation at the Szamotuły-Baborówko, Paproć, and Poznań-Ławica meteorological stations (2021–2023) (IMGW PIB).
Meteorological StationPrecipitation Height
[-][mm]Total
IIIIIIIVVVIVIIVIIIIXXXIXII
Szamotuły-Baborówko362932274441766234453636497
Paproć493735273657876937523844567
Poznań-Ławica403739315055637239423340541
Table 3. Characteristic flow values of selected streams at the section where the beaver dam occurs.
No.Type of FlowFlow DesignationKończak River, km 4+675Mogilnica River, km 24+935Cybina River, km 4+835
123456
1Average annualSQ [m3∙s−1]0.7560.9900.656
2Average lowSNQ = Qn [m3∙s−1]0.3780.4950.394
3Absolute lowNNQ [m3∙s−1]0.1890.2480.197
4Runoff coefficientCm [dm3∙s−1∙km −2]0.2100.1960.226
5factor y [-]1.251.251.5
Table 4. Summary of characteristic diameters and indices describing the debris.
ParameterKończak RiverMogilnica RiverCybina River
UpstreamDownstreamUpstreamDownstreamUpstreamDownstream
D50 [mm]0.188.150.197.06000.198.83
D84 [mm]0.459.300.509.25000.409.70
D16 [mm]0.080.330.110.90000.138.10
D10 [mm]0.070.180.080.06900.098.00
D60 [mm]0.208.600.228.30000.229.10
D90 [mm]0.739.680.889.62000.509.87
u2.9047.782.65120.282.441.14
well sortedbadly
sorted
well sortedbadly
sorted
well sortedwell sorted
σg2.375.312.1313.211.7511.091
heterogeneous materialheterogeneous materialheterogeneous materialheterogeneous materialheterogeneous materialhomogeneous material
σs4.061.194.631.362.631.12
material of various grainsnon-differentiated materialmaterial of various grainsnon-differentiated materialmaterial of various grainsnon-differentiated material
Table 5. Calculations of increased retention by beaver dams.
River NameWater Level ElevationCross-Sectional Area in the Studied Section Without the Beaver Dam for SNQChange in the Cross-Sectional Area in the Studied SectionLength of the Estimated BackwaterVolume of Water over Length LIncrease in Retention VolumePercentage Increase in Retention Compared to SNQ
m a.s.l.m2m2kmm3m3%
Kończak
km 4+075
54.160.441.300.4850030060
54.211.740.5265045069
54.403.570.6815001,20080
Mogielnica
km 24+935
76.070.233.700.5164506,20096
76.154.220.9510,40010,05097
76.325.341.6026,75026,35099
Cybina
km 4+835
60.450.312.550.071109082
60.523.110.0815012080
60.694.650.2976067088
Table 6. Backwater extent for each dam and considered discharges.
River NameWater Level ElevationChange in the Cross-Sectional Area in the Studied SectionLength of the Estimated Backwater
m a.s.l.m2 kmhec
Kończak
km 4+075
54.16 1.30 0.415
54.21 1.74 0.435
54.40 3.57 0.445
Mogielnica
km 24+935
76.07 3.70 0.960
76.15 4.22 1.080
76.32 5.34 1.505
Cybina
km 4+835
60.45 2.55 0.103
60.52 3.11 0.105
60.69 4.65 0.138
Table 7. Beaver dam classes (Woo and Waddington 1990) [53].
ClassMaterialsPreservation Stage
1stones, new branches, fresh mudactive
2no stones, new branches, fresh mudactive
3stones, old branches, mud and debrisold
4no stones, old branches, mud and debrisold
5no stones, old branches, some mud and debris remainold
6only large branches remainold
7only small branches remainrelic
8most branches gone, only half of original structure remainsrelic
Disclaimer/Publisher’s Note: The statements, opinions and data contained in all publications are solely those of the individual author(s) and contributor(s) and not of MDPI and/or the editor(s). MDPI and/or the editor(s) disclaim responsibility for any injury to people or property resulting from any ideas, methods, instructions or products referred to in the content.

