Abstract
With increasing discussions about energy security and sustainable electricity generation, the supply of biomass resources, such as sugarcane energy, has become increasingly important for regional development. In this study, the impact of spatial dependence and distribution of the supply of sugar-energy bioelectricity in Brazil was examined using a spatial econometric model. Data from ANEEL’s Generation Information System were utilized to represent the Brazilian territory. Exploratory Spatial Data Analysis (ESDA) was employed as a method, with both bivariate and univariate correlations evaluated. In the scenario analysis, the results indicated a 133% increase in the number of sugarcane bagasse-based power plants in Brazil over the past twenty years (from 189 to 442 power plants), along with a 229% increase in GW potential (from 4.11 to 13.55 GW) over the same period. The results demonstrated that the Brazilian sector is expanding rapidly. Regarding spatial dependence, the results indicated that in Brazil, there is no clear correlation between electricity consumption and sugarcane supply, but the univariate analysis revealed that power availability is spatially connected, with the presence of high-supply clusters in the country. The spatial agglomerations showed an IMoran_Global of 0.543 for intermediate regions and 0.453 for immediate regions. Spatial agglomeration may have a positive effect on improving regional performance by reducing the challenges involved in site selection, licensing, and grid connection. Thus, this work contributes by analyzing the spatial distribution of supply, which can be useful for energy planning. Furthermore, spatial differences and disparities complicate the management and formulation of public policies aimed at regional energy development, requiring spatial methods that identify areas with similar characteristics, such as the one applied in this study.
1. Introduction
Bioelectricity is electricity generated by burning biomass, which comes from organic matter of plant or animal origin. The importance of bioelectricity stands out because it meets the targets set by Brazil in its Nationally Determined Contribution (NDC) at COP21. Its use has low carbon emissions and can even be considered carbon neutral when associated with sustainable practices, making it a strategic option in the domestic energy supply, in pursuit of energy security, and in reducing CO2 levels in the atmosphere, based on the circular economy. The green economy seeks to improve human well-being and social equality by mitigating environmental risks and ecological scarcity. In order to be more efficient and meet the Sustainable Development Goals (SDGs), nations must combine strategies for low-carbon economies using circular mechanisms, in both scale and scope, considering the comparative and competitive advantages they possess [1,2,3].
In Brazil, the sugar-energy sector (sugar-alcohol industry) has sugarcane (Saccharum officinarum) as its main raw material, which stands out for its ability to produce clean energy (heat, ethanol, and electricity) on a large scale and serves as an alternative to addressing the problems arising from climate change. This segment has undergone and is undergoing transformations and rearrangements because it is deeply intertwined with political–legal, economic, technological, social, and environmental aspects. In the sugar-energy sector, the diversification of the product portfolio generally also stems from the generation of effective risk mitigation strategies, particularly in the decarbonization of the transport sector, given the need to replace fossil fuels [4,5].
In the last decade, the determinants of investment decisions in the sector have been the attractiveness of sugarcane ethanol and the bioelectricity generated from sugarcane bagasse. Currently, only 15% of its potential is utilized. However, if the biomass present in sugarcane plantations were fully utilized, bioelectricity would have the technical potential to reach 151,000 GWh, which would supply more than 30% of energy consumption in the National Integrated System (NIS). Encouraged by the RenovaBio Program and a favorable business environment, bioelectricity for the grid has the potential to expand by more than 55% by 2030 [6]. In 2023, bioelectricity production from sugarcane reached 21,000 GWh, representing 75% of all biomass-based electricity generation in the country [4,6,7].
Regions with the potential to offer bioelectricity stimulate development centers, which are either a driving economic unit or a group of multiple such units. Regional economics seeks to understand the relationship between economic activities in a given geographical region. However, it does not incorporate sufficient theoretical frameworks to adequately explain spatial phenomena. Focusing on the analysis of spatial patterns and distributions of phenomena and variables, considering the geographical location of the data, spatial economics aims to understand how geography affects economic processes, exploring the relationship between space and the behavior of the variables studied. Within spatial economics, exploratory spatial data analysis (ESDA) is an approach that integrates spatial and geographical statistical techniques to identify trends, patterns, and spatial associations in economic activity. This method considers data holistically, examining their joint behavior and exploring the relationship between installed power and geographical, socioeconomic, and environmental variables [8,9].
For Perry [10], the existence of industrial clusters strengthens the universal policy that ensures sustained growth for any locality or region. Many managers, in both the public and private sectors, see the statistical validation of clusters as an opportunity to combine local competitive advantages with other policy intervention tools in order to promote regional development. Thus, ESDA can be a starting point for identifying regions prone to greater development in biomass energy generation.
ESDA also takes into account individual interactions and their impact on collective behavior and established patterns, revealing the mutual influence between regions and their surroundings, as well as the influence of other variables on the process. This analysis helps to identify clusters, outliers, and spatial dispersion patterns in the data [11,12,13].
Similar to other spatial analysis metrics, ESDA faces some limitations. Its spatial analysis depends on data being geocoded or mapped to a specific spatial location, which, in some cases, makes it difficult to conduct bivariate analyses at various territorial levels. Some approaches allow geographic boundaries to be defined by the data (for example, the Scan statistics cluster analysis), but these fail to significantly identify neighborhood effects, which are the result of comparative advantages and technological spillover. Thus, evaluating the sugar-energy biomass bioelectricity generation sector using ESDA is significant, since other studies may address different issues, but in similar geographical locations, making comparative discussions feasible.
In recent years, there has been an increase in the use of spatial analysis in economic modeling. Notable studies include Cabral et al. [12], who forecasted electricity consumption in Brazil; Coelho Junior et al. [14], who assessed the spatial distribution of firewood production in the Brazilian northeast; Dunn et al. [15], who analyzed power outage data and identified spatial and temporal heterogeneity in power grid reliability; Zhang [16], who showed the spatial characteristics of low-carbon energy in China; Santos Junior et al. [3], who analyzed the distribution and spatio-temporal dependence of the supply of forest bioelectricity in Brazil; and Szaruga et al. [17], who verified the spatial autocorrelation of power grid instability in the context of electricity production from renewable energy sources in Polish regions.
To understand the spatial interactions in a sugar-energy bioelectricity generation sector, and to identify areas with a high concentration of supply, this study presents a methodology for analyzing the distribution and spatial dependence of bioelectricity, using Brazil as a base scenario. Although this study focuses on Brazil, the methodological approach can be adapted and replicated in different international contexts, allowing the analysis of spatial patterns in various regions of the world.
The results should explain the evolution of sugarcane biomass as an energy vector in Brazil, while also describing the structure and regional distribution of this form of generation. Given that the development of clusters subsidizes policy professionals in rationalizing local intervention, it can contribute to the creation of regions with significant industrial and economic power in this type of renewable energy. On a local scale, the results will support public policy development and decision-making, facilitating the formulation and implementation of strategies for the energy security of Brazil’s electricity matrix, and advancing the decarbonization of the economy.
2. Materials and Methods
2.1. Object of Study
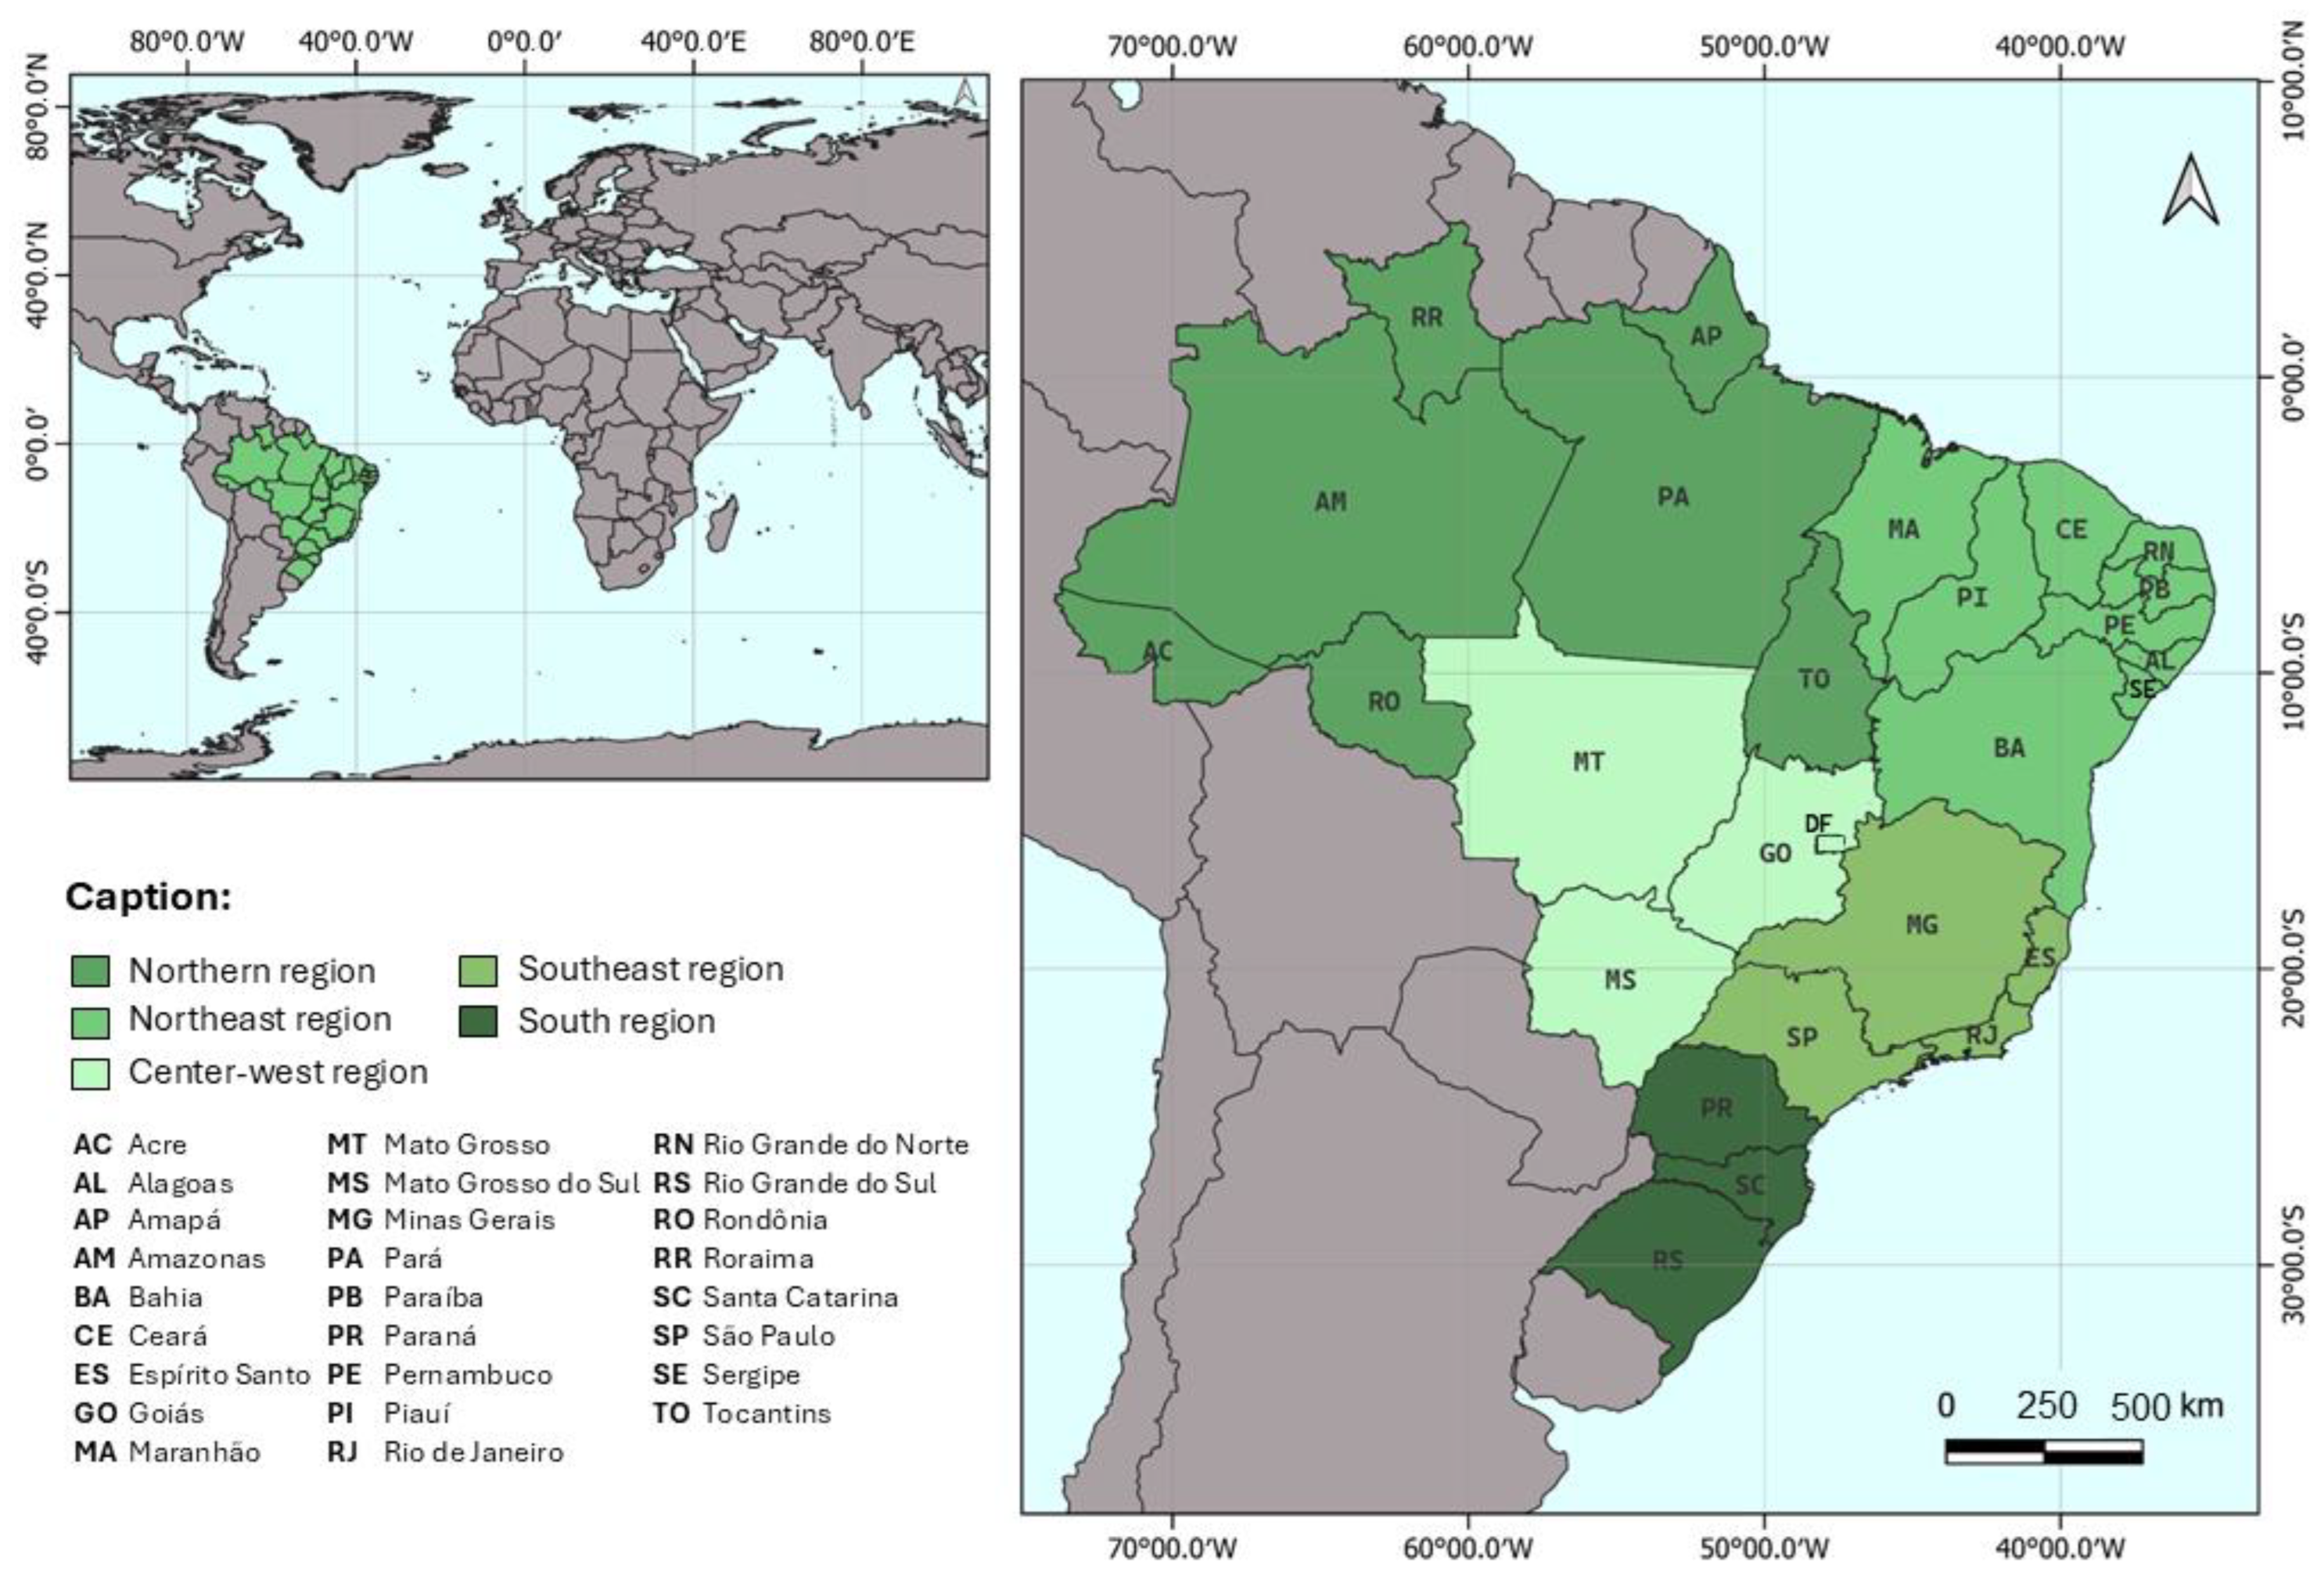
The granting data for Brazil’s biomass power plants can be accessed through ANEEL’s Aneel Information System (SIGA), using data from 1 May 2024 [18]. The national plants are classified into agro-industrial biomass, forestry, liquid biofuels, animal waste, and urban waste categories. This paper focuses on evaluating sugarcane bagasse-based power plants. Electricity consumption data by state were collected from the National Energy Balance (BEN) for 2024 [19]. Figure 1 illustrates the selected study area and provides a description of its territory. Brazil is divided into five major regions, which are further subdivided into 26 states and the Federal District (the national capital).
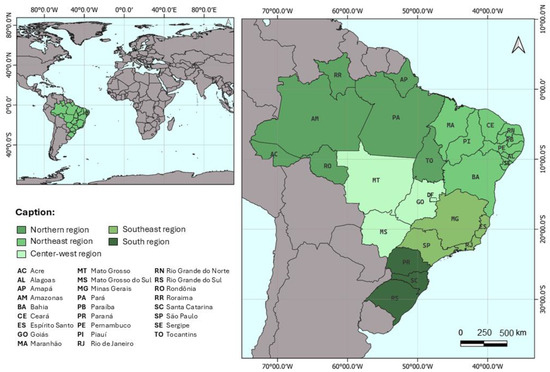
Figure 1.
Cartographic representation of the study territory.
For each power plant identified, the installed power (GW) and geographical coordinates were collected. These plants were spatialized with QGIS 3.6.0®, using geographical coordinates. A conjunctural analysis was conducted, focusing on Brazil’s regions and federal units, showing the evolution of the plants and the granted power (GW) for the years 2004, 2014, and 2024. The analysis spans the period of highest investment in renewable generation in Brazil, which began in 2002 with the creation of the Program to Encourage Alternative Sources of Electricity (in Portuguese, Programa de Incentivo às Fontes Alternativas de Energia Elétrica—PROINFA), the outcomes of which are evident in the following decades. The year 2024 represents the most recent year of available data. The choice of this temporal scope enhances replicability in other regions by focusing on widely available, consistent data.
To estimate the annual gains and losses of sugarcane bagasse-fired thermal plants, the Geometric Growth Rate (GGR) was used, according to Equation (1):
where VF is the amount or power granted (MW) of sugarcane bagasse biomass in the final year; V0 represents the quantity or power in the initial year; and ∆t is the temporal variation (expressed in years).
2.2. Exploratory Spatial Data Analysis
The evaluation of spatial autocorrelation, verification of spatial instabilities, and identification of outliers can be performed using exploratory spatial data analysis (ESDA) [14]. ESDA was conducted for the year 2024. Usually, the analysis of data associated with geographical regions involves identifying positively autocorrelated residuals, i.e., high residuals clustered in the same region [20].
Spatial autocorrelation represents the extent to which a given variable in region i (power granted for bioelectricity or number of generators) is related to the same variable in a neighboring region j. The spatial units considered were the states, intermediate regions, and immediate regions with biomass power plants. To verify the spatial pattern, the W weighting matrix was constructed, consisting of binary elements used to assess contiguity [14].
wij = 1 if observation i is a neighbor of observation j; and
wij = 0 if observation i is not a neighbor of observation j.
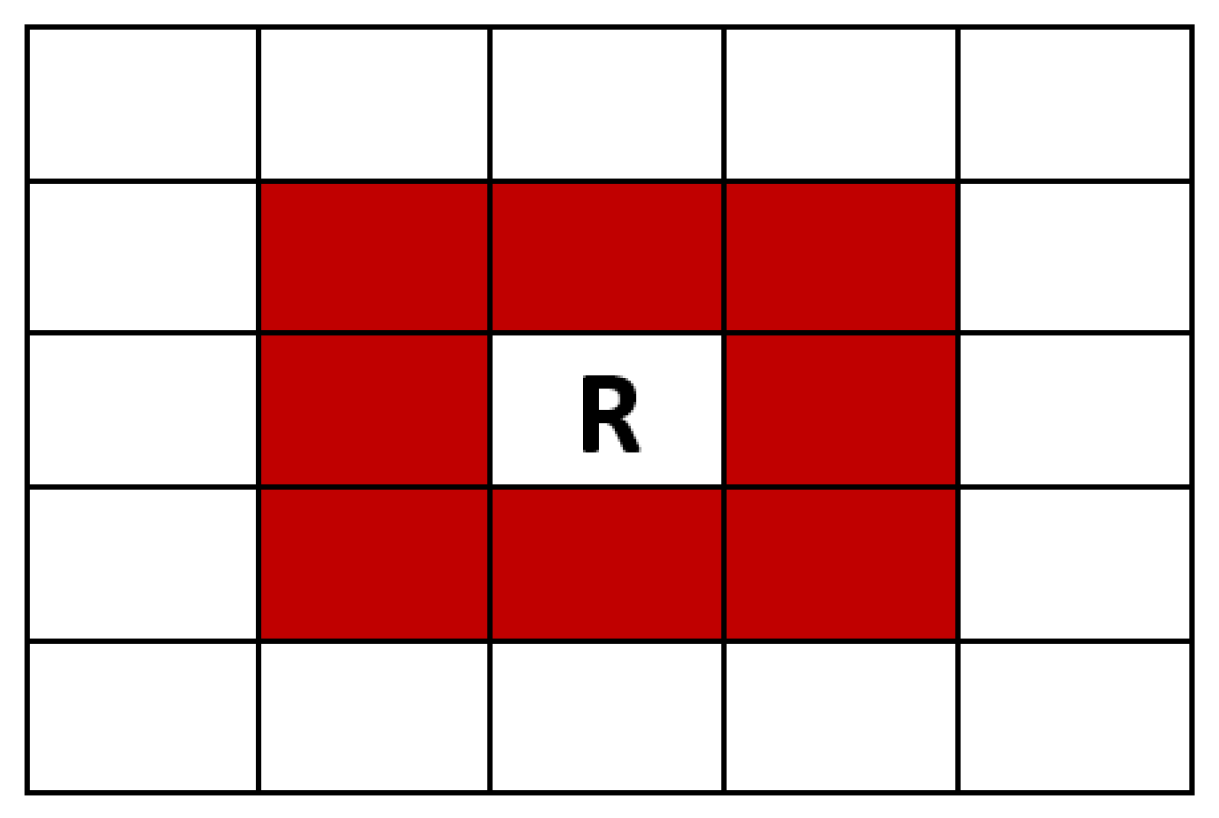
For contiguity, the Queen type was chosen, according to the model in Figure 2. This matrix can be classified as first-order (direct neighbors of regions), second-order (neighbors of neighbors of regions), third-order, or other associations [11]. In this study, only first-order neighbors were considered.
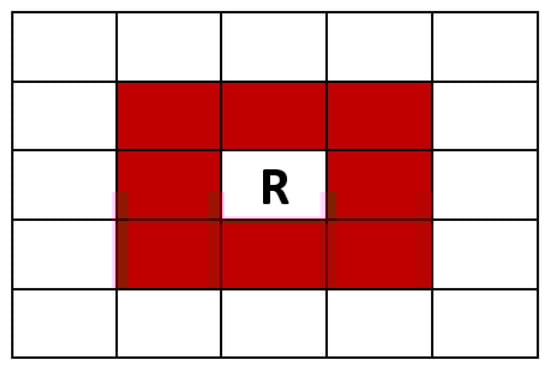
Figure 2.
Representation of the Queen contiguity matrix (R). Source: Adapted from Coelho Junior et al. [14].
2.2.1. Univariate Spatial Autocorrelation
I Moran Global (IMoran_Global)
Global spatial autocorrelation is a measure of correlation assessed by testing the null hypothesis of random locations [11]. Dunn [15] states that the characterization of spatial dependence allows the identification of significant results in a region, which is the main focus of spatial analysis. The function used to measure the impact of different variables in a region depends on their value in the neighboring region, i.e., there is spatial autocorrelation; the global Moran index (IMoran_Global) was used to measure this autocorrelation (Equation (2)):
where n = number of spatial units (e.g., regions) with power granted from sugar-energy biomass; Wij = value of the weighting matrix; Yi = power granted from sugar-energy bioelectricity at location i; Yj = power granted from sugar-energy bioelectricity at neighboring location j; and = average of the power granted from sugar-energy bioelectricity in the study region.
For spatially independent variables, i.e., variables without autocorrelation, the value of IMoran_Global is zero. When the variables are spatially dependent, there may be a pattern of similarity between nearby areas, where IMoran_Global will be positive (IMoran_Global > 0), or dissimilarity, where IMoran_Global will be negative (IMoran_Global < 0) [21].
The null hypothesis (H0) of the ESDA infers that the observed values are randomly distributed in space, with no significant spatial patterns. The alternative hypothesis (H1) in the Moran’s Index analysis is that the values of the variable under analysis show significant spatial autocorrelation, i.e., they are not randomly distributed in space. The p-value indicates the confidence interval for spatial autocorrelation to be significant, i.e., that values close together in space are more similar (or different) than expected by chance [11]. For this research, the significance value for IMoran_Global was set at 5% (p-value ≤ 0.05).
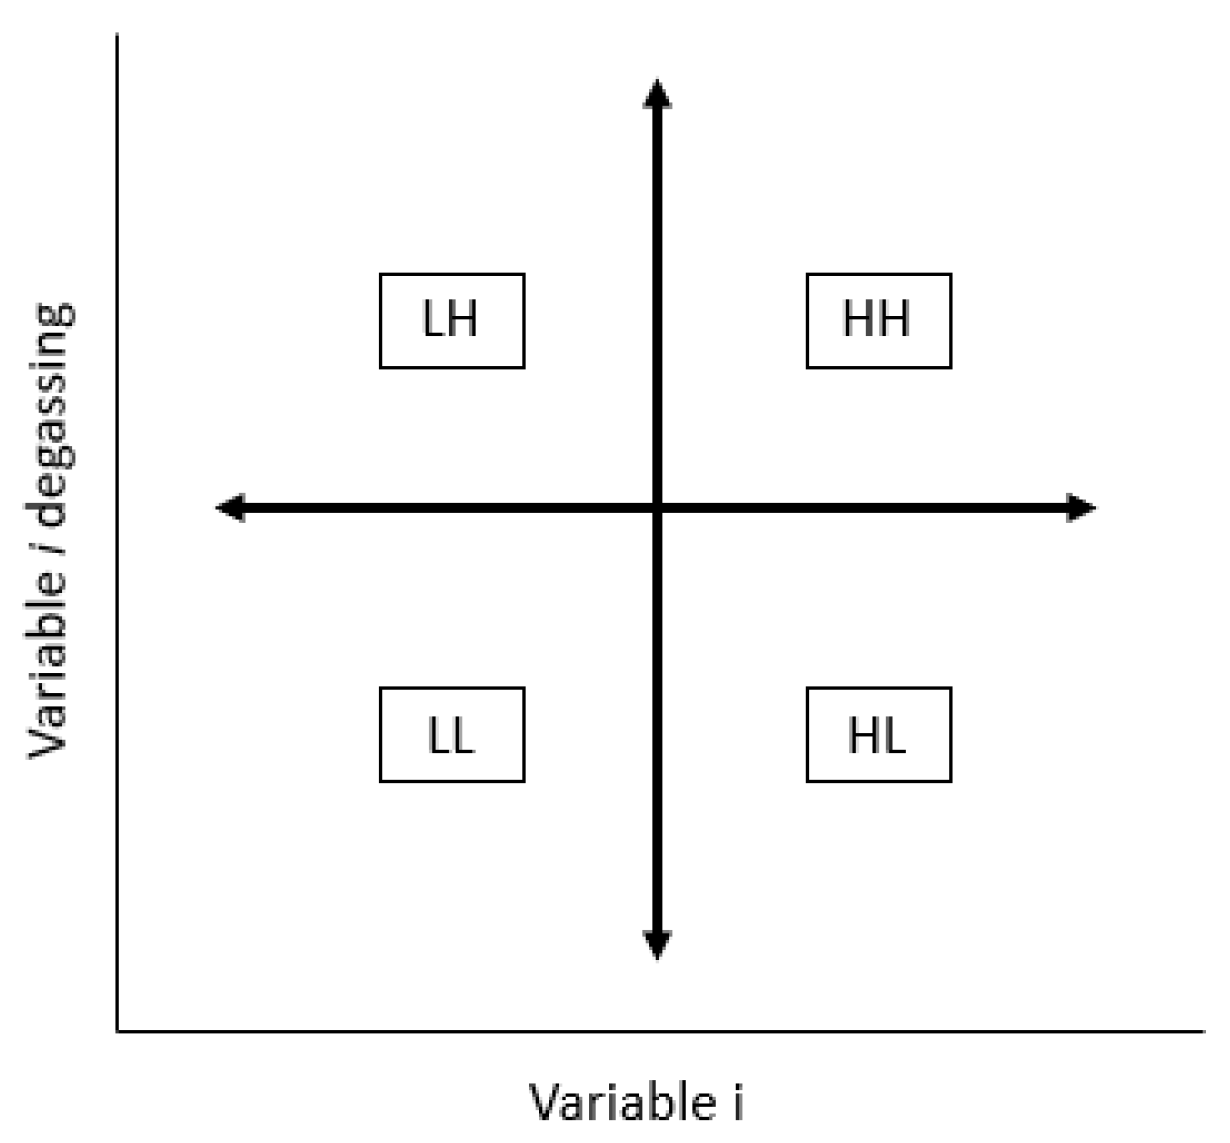
The results are presented in a scatter diagram (Figure 3). The interpretation of the diagram shows that, for a high number of generators or power granted, the HH (High-High) pattern is observed in high neighborhoods, while for low values, the LL (Low-Low) pattern is observed in low neighborhoods. In turn, dissimilar values between the observed power plant and its neighbors can be seen in the HL (High-Low) pattern, for high supply power plants surrounded by low-supply neighbors, or in the LH (Low-High) pattern, for low supply power plants surrounded by high-supply neighbors.

Figure 3.
Moran’s scatter diagram. Source: Adapted from Coelho Junior et al. [14].
I Moran Local (IMoran_Local)
For Dunn et al. [15], the existence of many observations in the study area results in a high probability of strong spatial autocorrelation at different points. Although the IMoran_Global index is important in terms of showing the integration of global data, this index must be supported by local statistics. According to Anselin [11], IMoran_Local (Equation (3)) brings together the conditions for defining the correlation structure for each area of the research area and complements the global spatial correlation index. The sum of the local indicators for each observation is proportional to the global spatial correlation indicator:
where n = number of spatial units (e.g., regions) with power granted from sugar-energy biomass; Wij = value of the weighting matrix; Yi = power granted from sugar-energy bioelectricity at location i; Yj = power granted from sugar-energy bioelectricity at neighboring location j; and = average of the power granted from sugar-energy bioelectricity in the study region.
As with the IMoran_Global scatter diagram, positive values of the local Moran’s Index indicate the presence of spatial clusters with similar patterns (high or low) for the observed variable. Negative values suggest that there are spatial clusters with opposite values of the variable between the areas and their neighbors (i.e., high-low or low-high). As with IMoran_global, the significance level of the test was 5%.
2.2.2. Multivariate Spatial Autocorrelation
Global Multivariate Moran’s I
In addition to univariate analysis, the Moran’s I statistic can be used to assess the degree of spatial correlation between two different variables. High values of the multivariate global Moran’s I imply that a given variable in one area has some relationship with another variable in neighboring areas [22].
The multivariate analysis was conducted for the state level. If the matrix (W) is row-normalized, the multivariate coefficient can be represented by Equation (4):
where Z1 is the supply of bioelectricity from sugarcane in the state of analysis i, Z2 is the demand for electricity in the state, and is the spatial lag of the standardized variable Z2.
Multivariate Local Moran’s I
For Bivariate Local Spatial Autocorrelation, considering the existence of the variables of interest Xi and Yi, Z1 and Z2, are obtained by standardization. Thus, the multivariate local Moran’s I formula can be provided by Equation (5):
where is the spatial lag of the standardized variable Z2. Only the neighbors of sample i are included in the calculation. The interpretation of the index is similar to the univariate IMoran_Local.
3. Results and Discussion
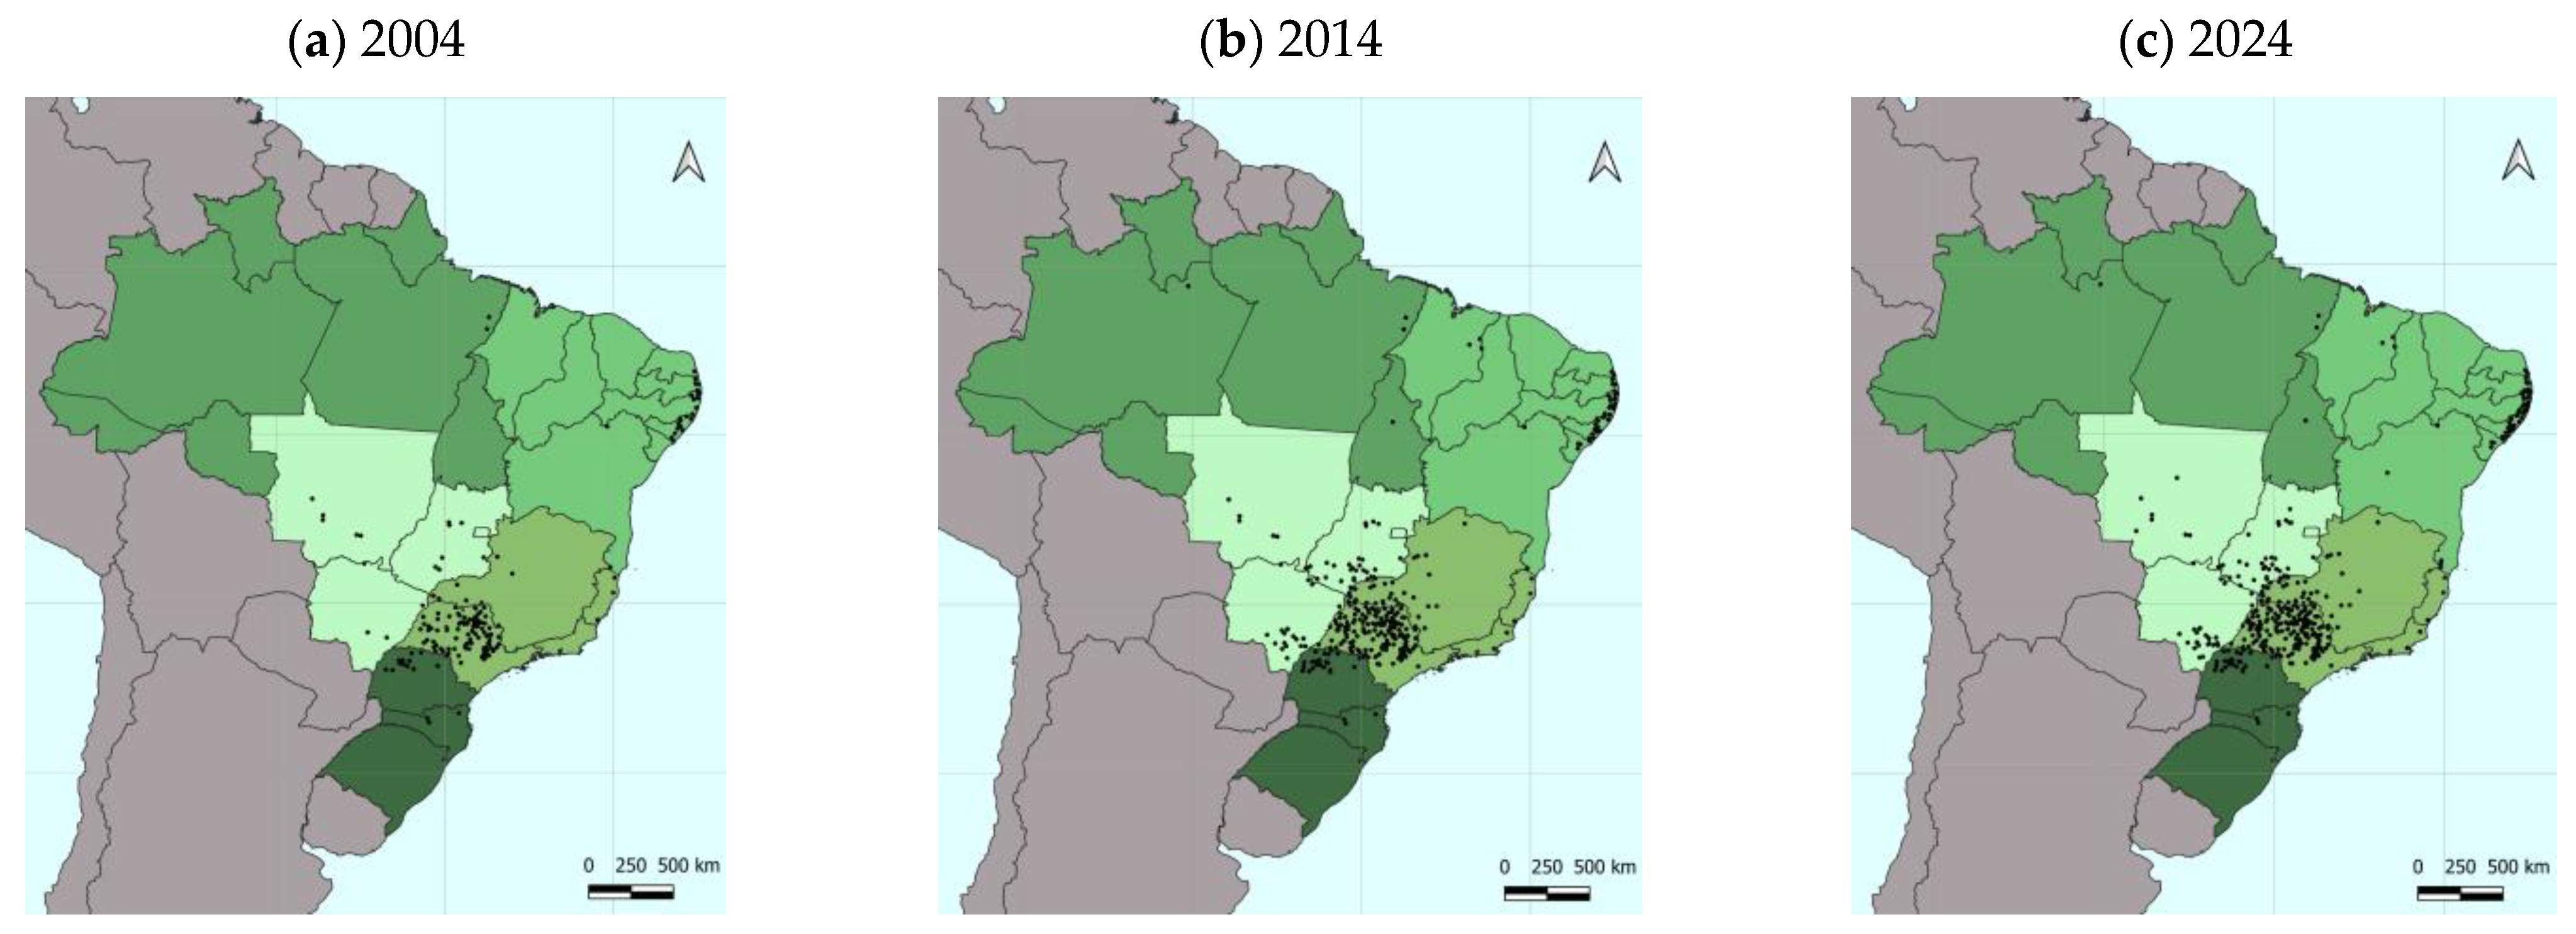
Figure 4 shows the evolution of the number of sugarcane power plants installed in Brazil from 2004 to 2024. In the initial year of the analysis, the total installed capacity was 4.11 GW, distributed across 189 power plants. The southeast stood out with the highest number of plants, accounting for 121 units and 3.04 GW (74.11% of the national total power). The northeast was also noteworthy, with its economy centered on sugar and alcohol production for many decades. The region had 31 power plants generating 0.44 GW.
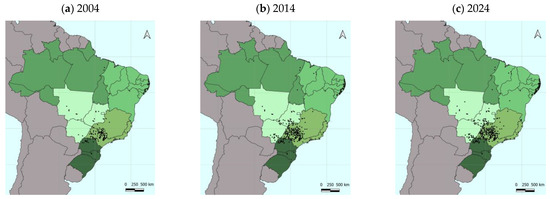

Figure 4.
Spatial distribution of sugarcane power plants, by region, from 2004 to 2024.
In 2014, significant progress was observed, particularly in the midwest and southeast regions. Nationwide, the total installed capacity reached 11.29 GW, corresponding to an average annual growth of 10.63%, with a total of 377 thermal power plants. The midwest experienced a 12.54% increase per annum (p.a.) in the number of thermal plants, reaching 62 units, and a 20.81% increase p.a. in installed capacity, totaling 2.81 GW. The southeast expanded its capacity to 7.05 GW, with an 8.74% annual growth rate, across 232 plants.
In 2024, the power granted nationally was 13.55 GW (+1.84% p.a.), distributed across 442 power plants. Over the past 20 years, Brazil’s sugarcane power generation has tripled in capacity, while the number of plants has doubled. This growth over the last two decades not only demonstrates the expansion of investments and the evolution of decarbonization policies, but also reflects improvements in the efficiency and technology within the segment. In 2024, the southeast remained the region with the highest power granted, with 8.61 GW across 274 plants. This was followed by the midwest, with 3.24 GW and 75 thermal plants, and the northeast, which had 57 thermal plants, with installed capacity of 0.99 GW.
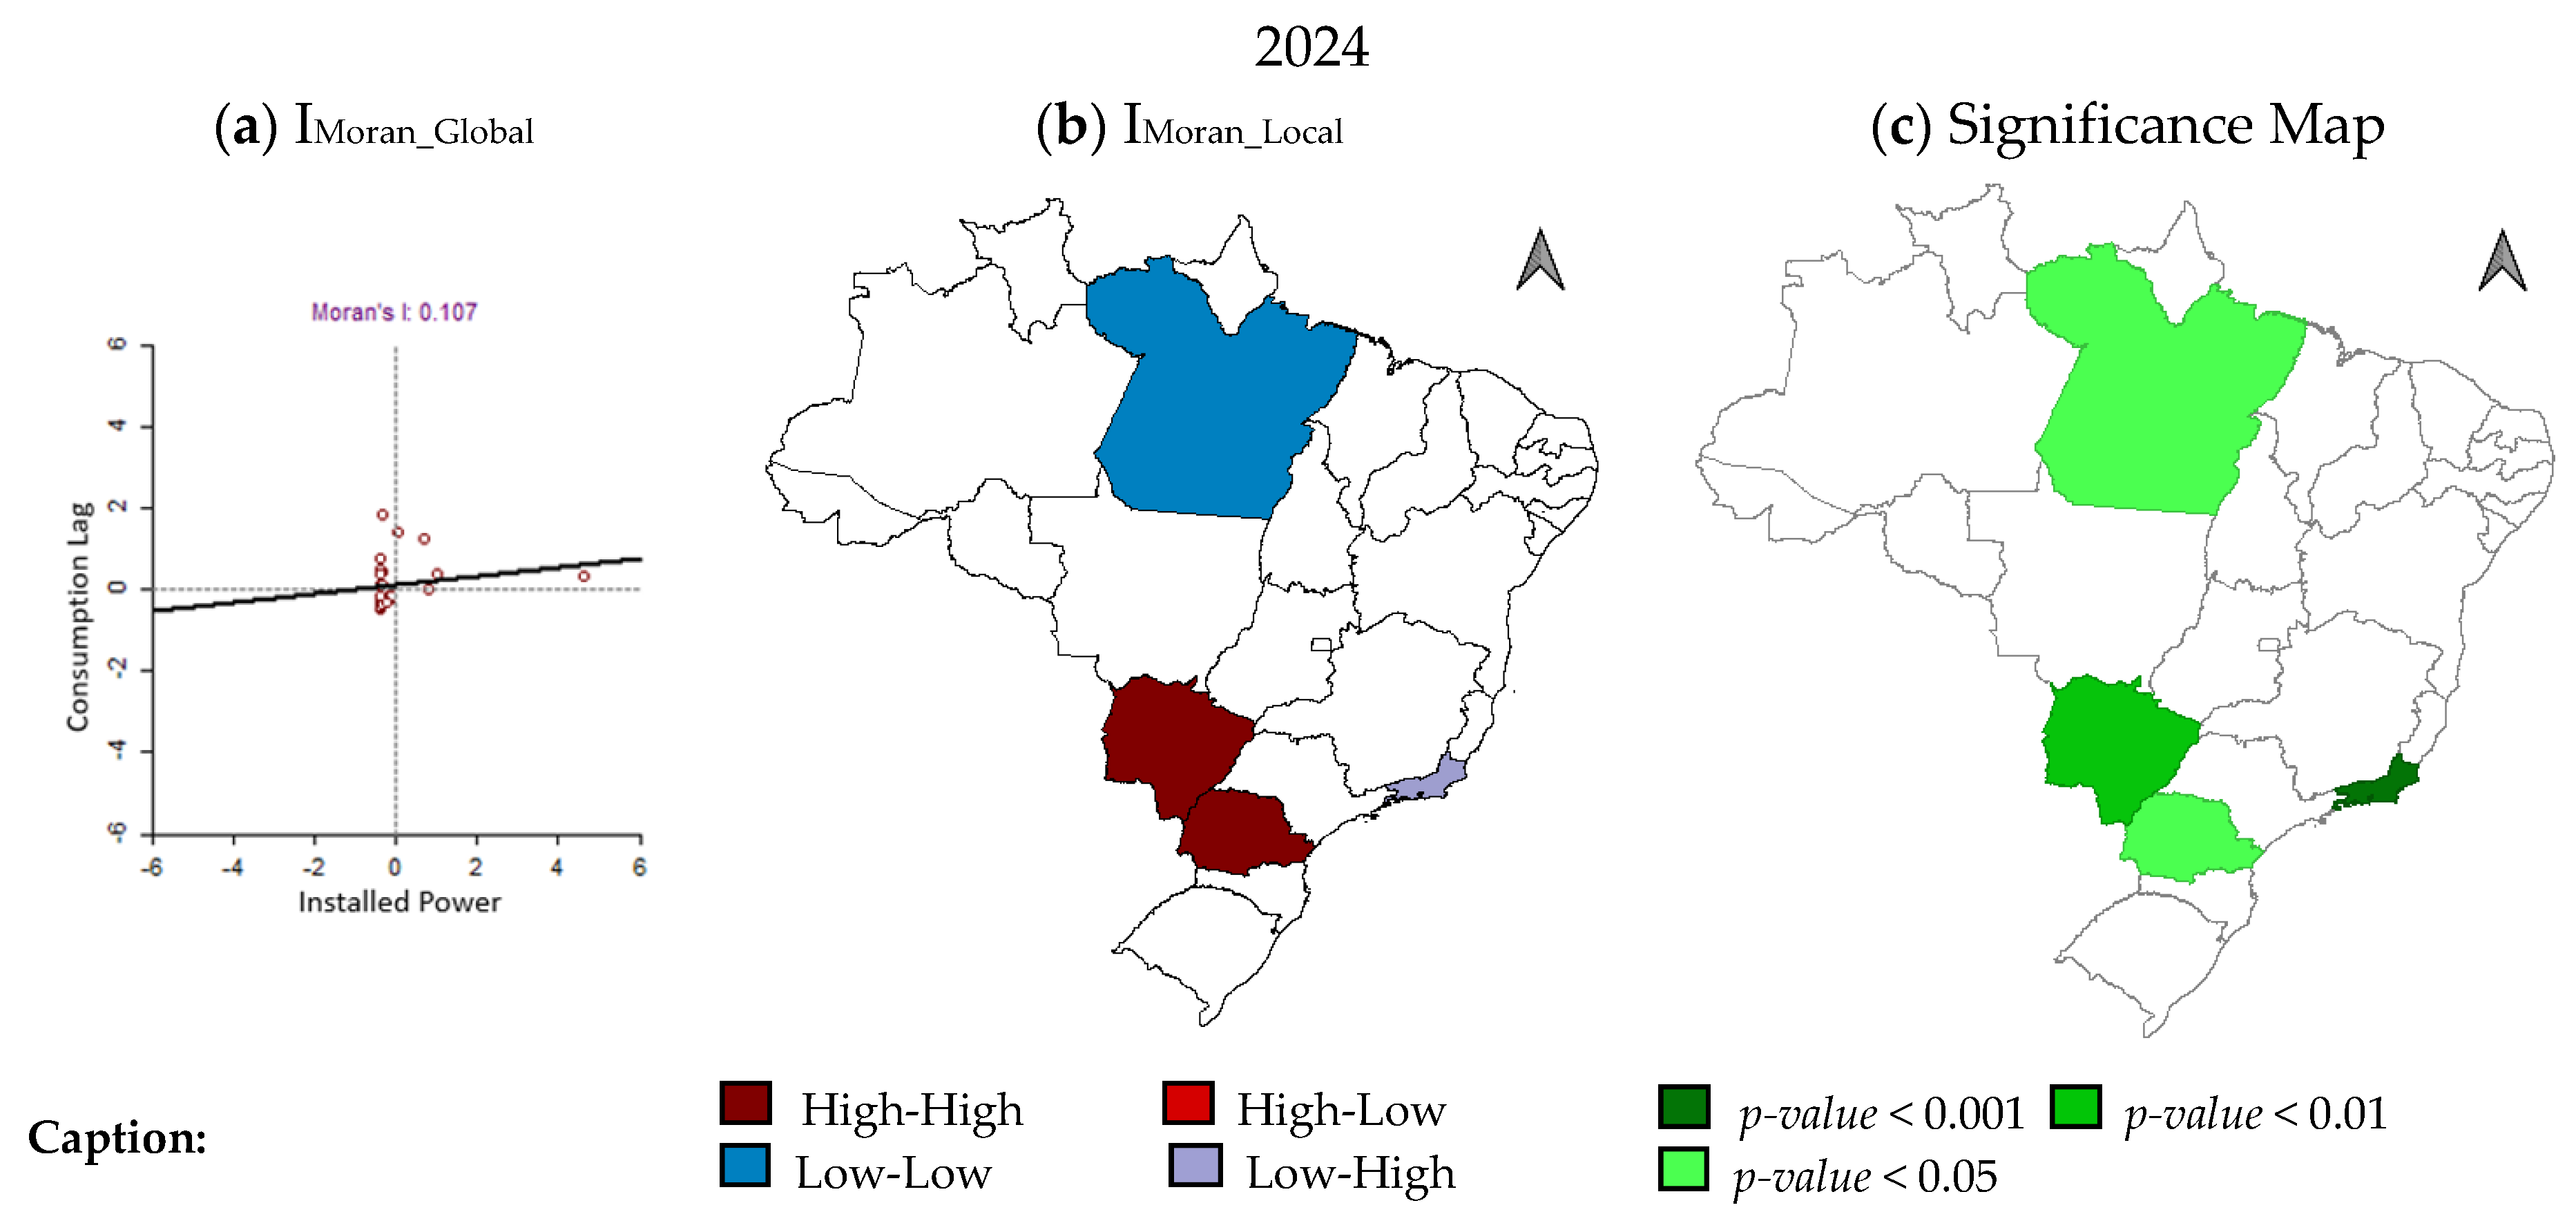
Figure 5 presents the IMoran_global and local bivariate index for the supply of sugar-energy bioelectricity and total consumption across Brazilian states. The global index of 0.107 represents a low positive association, suggesting that power plants are not clustered based on electricity demand. Only the states of São Paulo and Mato Grosso do Sul deviated from the national pattern. The state of São Paulo, in particular, had a supply of 6.62 GW of sugarcane-based power (48.76% of the national scenario) and a consumption of 11.78 TWh (26.58%).

Figure 5.
Spatial distribution of the bivariate IMoran_Global and IMoran_Local between the supply of sugar-energy bioelectricity and electricity consumption in the states of Brazil in 2024.
In addition to the association with total consumption, the states of São Paulo, Mato Grosso do Sul, and Minas Gerais demonstrated an association from the perspective of electricity consumption in the industrial sector, reinforcing the existence of a strong localization pattern for sugar-energy biomass supply in this region. All identified patterns showed statistical significance (Figure 5c). Rio de Janeiro was significant at the lowest level of the test, considering its proximity to the state of São Paulo, which has the largest supply and consumption in the country.
In Brazil, energy supply is spatially distributed and associated with factors of natural availability. As a result, sugar-energy bioelectricity exhibits a spatial association with areas that have comparative advantages in sugarcane production, which is why the grouping in this region was noted.
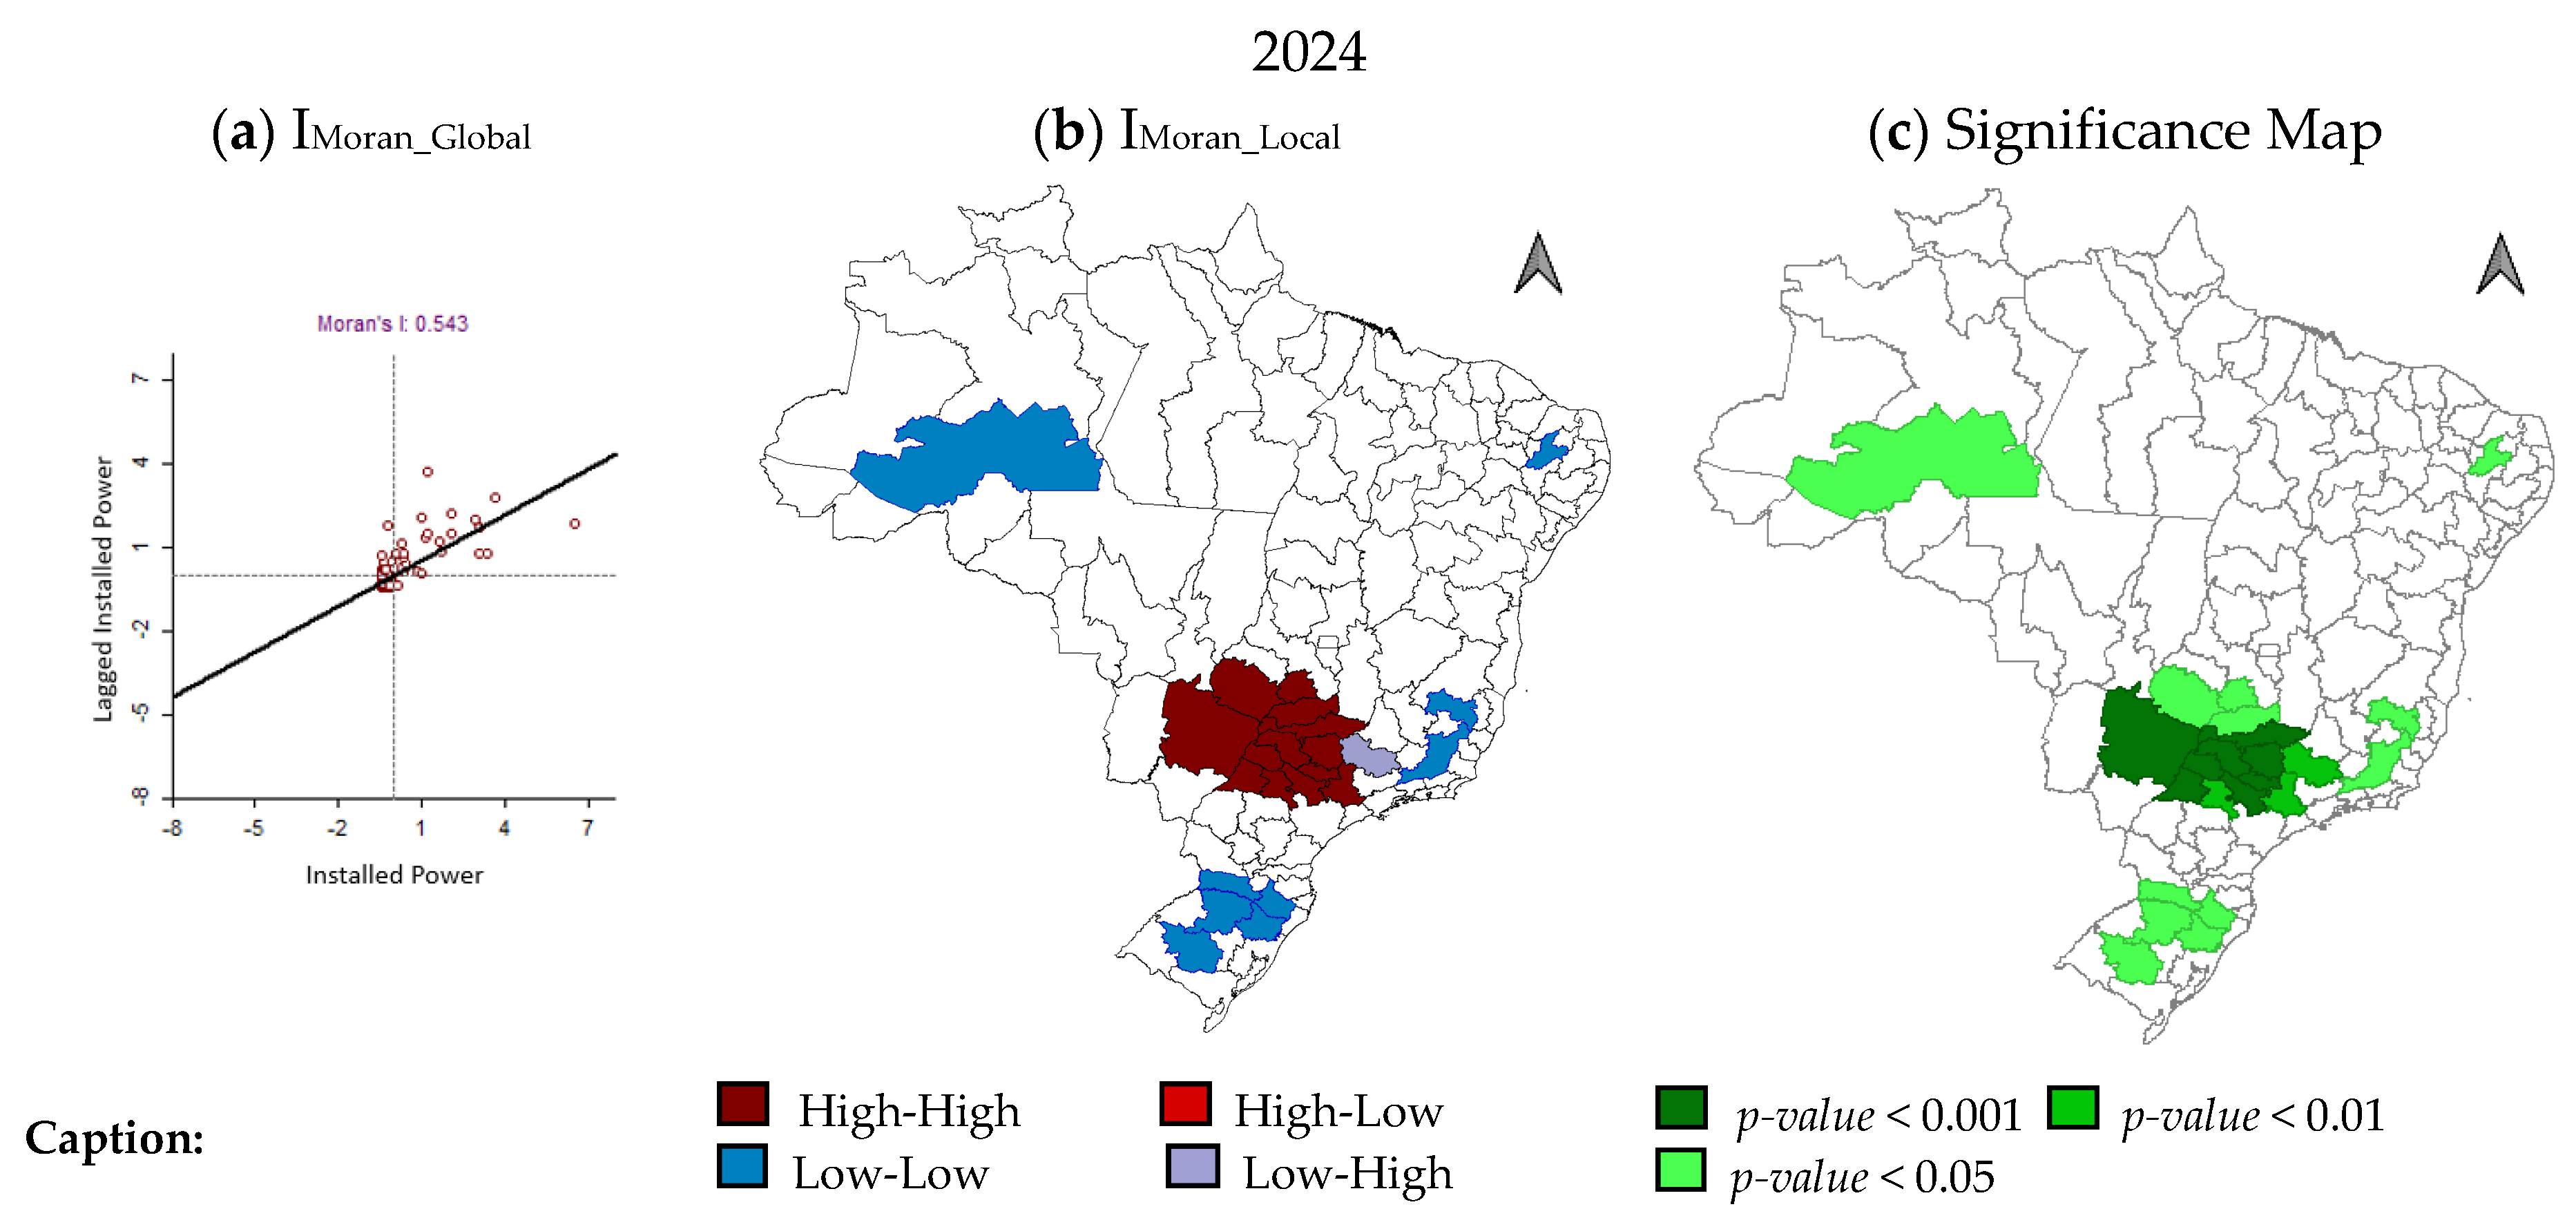
In addition to the bivariate analysis, Figure 6 shows the autocorrelation of sugar-energy bioelectricity supply, based on the IMoran_global and local index, for the intermediate regions of Brazil. At the intermediate level, it was possible to observe a high supply cluster in the center-west and southeast regions, with 8.39 GW installed. The high supply cluster accounted for 61.92% of Brazil’s total supply. The global IMoran demonstrated a positive correlation between the intermediate regions, with a value of 0.543, reflecting a moderate to strong positive spatial autocorrelation.

Figure 6.
Spatial distribution of IMoran_Global and IMoran_Local for the supply of sugarcane bioelectricity in intermediate regions, in Brazil, in 2024.
Only 12 intermediate regions were part of this cluster. In the state of São Paulo, these included Ribeirão Preto (1723.17 MW), São José do Rio Preto (1052.11 MW), Uberaba (921.23 MW), Bauru (822.63 MW), Araçatuba (593.25 MW), Presidente Prudente (560.83 MW), Campinas (482.84 MW), Marília (437.55 MW), and Araraquara (365.48 MW). For the state of Mato Grosso do Sul, these included the regions of Rio Verde (856.43 MW), Campo Grande (373.17 MW), and Itumbiara (202.24 MW). Climatic suitability is one of the main factors driving regional productivity, with rainfall concentrated in the summer and droughts in the winter [22]. The most statistically significant observations were located within the High-High cluster.
Coelho Junior et al. [23], using the Scan statistics methodology, highlighted the existence of clusters in this region of the country. Cluster formation is associated with the proximity of raw materials and skilled labor, which is common in this region of northwestern São Paulo. The proximity of resources and technical expertise significantly reduces transportation and logistics costs, while also supporting a reliable supply chain [24,25].
For the Low-Low pattern, the identified regions were Lábrea (AM), Patos (PB), Governador Valadares (MG), Juiz de Fora (MG), Lages (SC), Chapecó (SC), Santa Maria (RS), Passo Fundo (RS), and Caxias do Sul (RS). This pattern indicates that these regions are located in areas where neighboring regions have little to no production. None of the Low-Low intermediate regions had production of sugar-energy bioelectricity. In the intermediate regions related to the south, the biomass energy generation profile differs, which justifies the pattern observed in our analysis.
Brazil has numerous resources for generating electricity, and in addition to sugarcane production, other areas concentrate their bioenergy generation on renewable wood resources. Coelho Junior and Santos Júnior [26] identified the existence of conglomerates in the forest bioelectricity sector in the center-south region of Brazil, where the main inputs are black liquor and forest residues, located in the states of Paraná and Rio Grande do Sul. Some areas stand out for their development in this sector, such as the mesoregions of Imperatriz (MA), Sinop (MT), Campo Grande (MS), and Lages (SC). This pattern suggests that regions within these clusters hold advantages over others.
In addition to the bivariate observation, Figure 5 shows the autocorrelation of the supply of sugar-energy bioelectricity, based on the IMoran_global and local index, for the intermediate regions of Brazil. At the intermediate level, it was possible to observe a high-supply cluster in the center-west and southeast regions, with 8.39 GW installed. The high-supply cluster accounted for 61.92% of Brazil’s total supply. The global IMoran demonstrates a positive correlation between the intermediate regions, with a value of 0.543; this scenario reflects a medium to strong positive spatial autocorrelation.
Although it has a supply of 38.09 MW, the region is surrounded by intermediate regions with high installed potential, such as Campinas, Ribeirão Preto, and Uberaba, but it also neighbors Juiz de Fora, which has zero sugar-energy power. For the intermediate regions, no observations were found in the High-Low pattern.
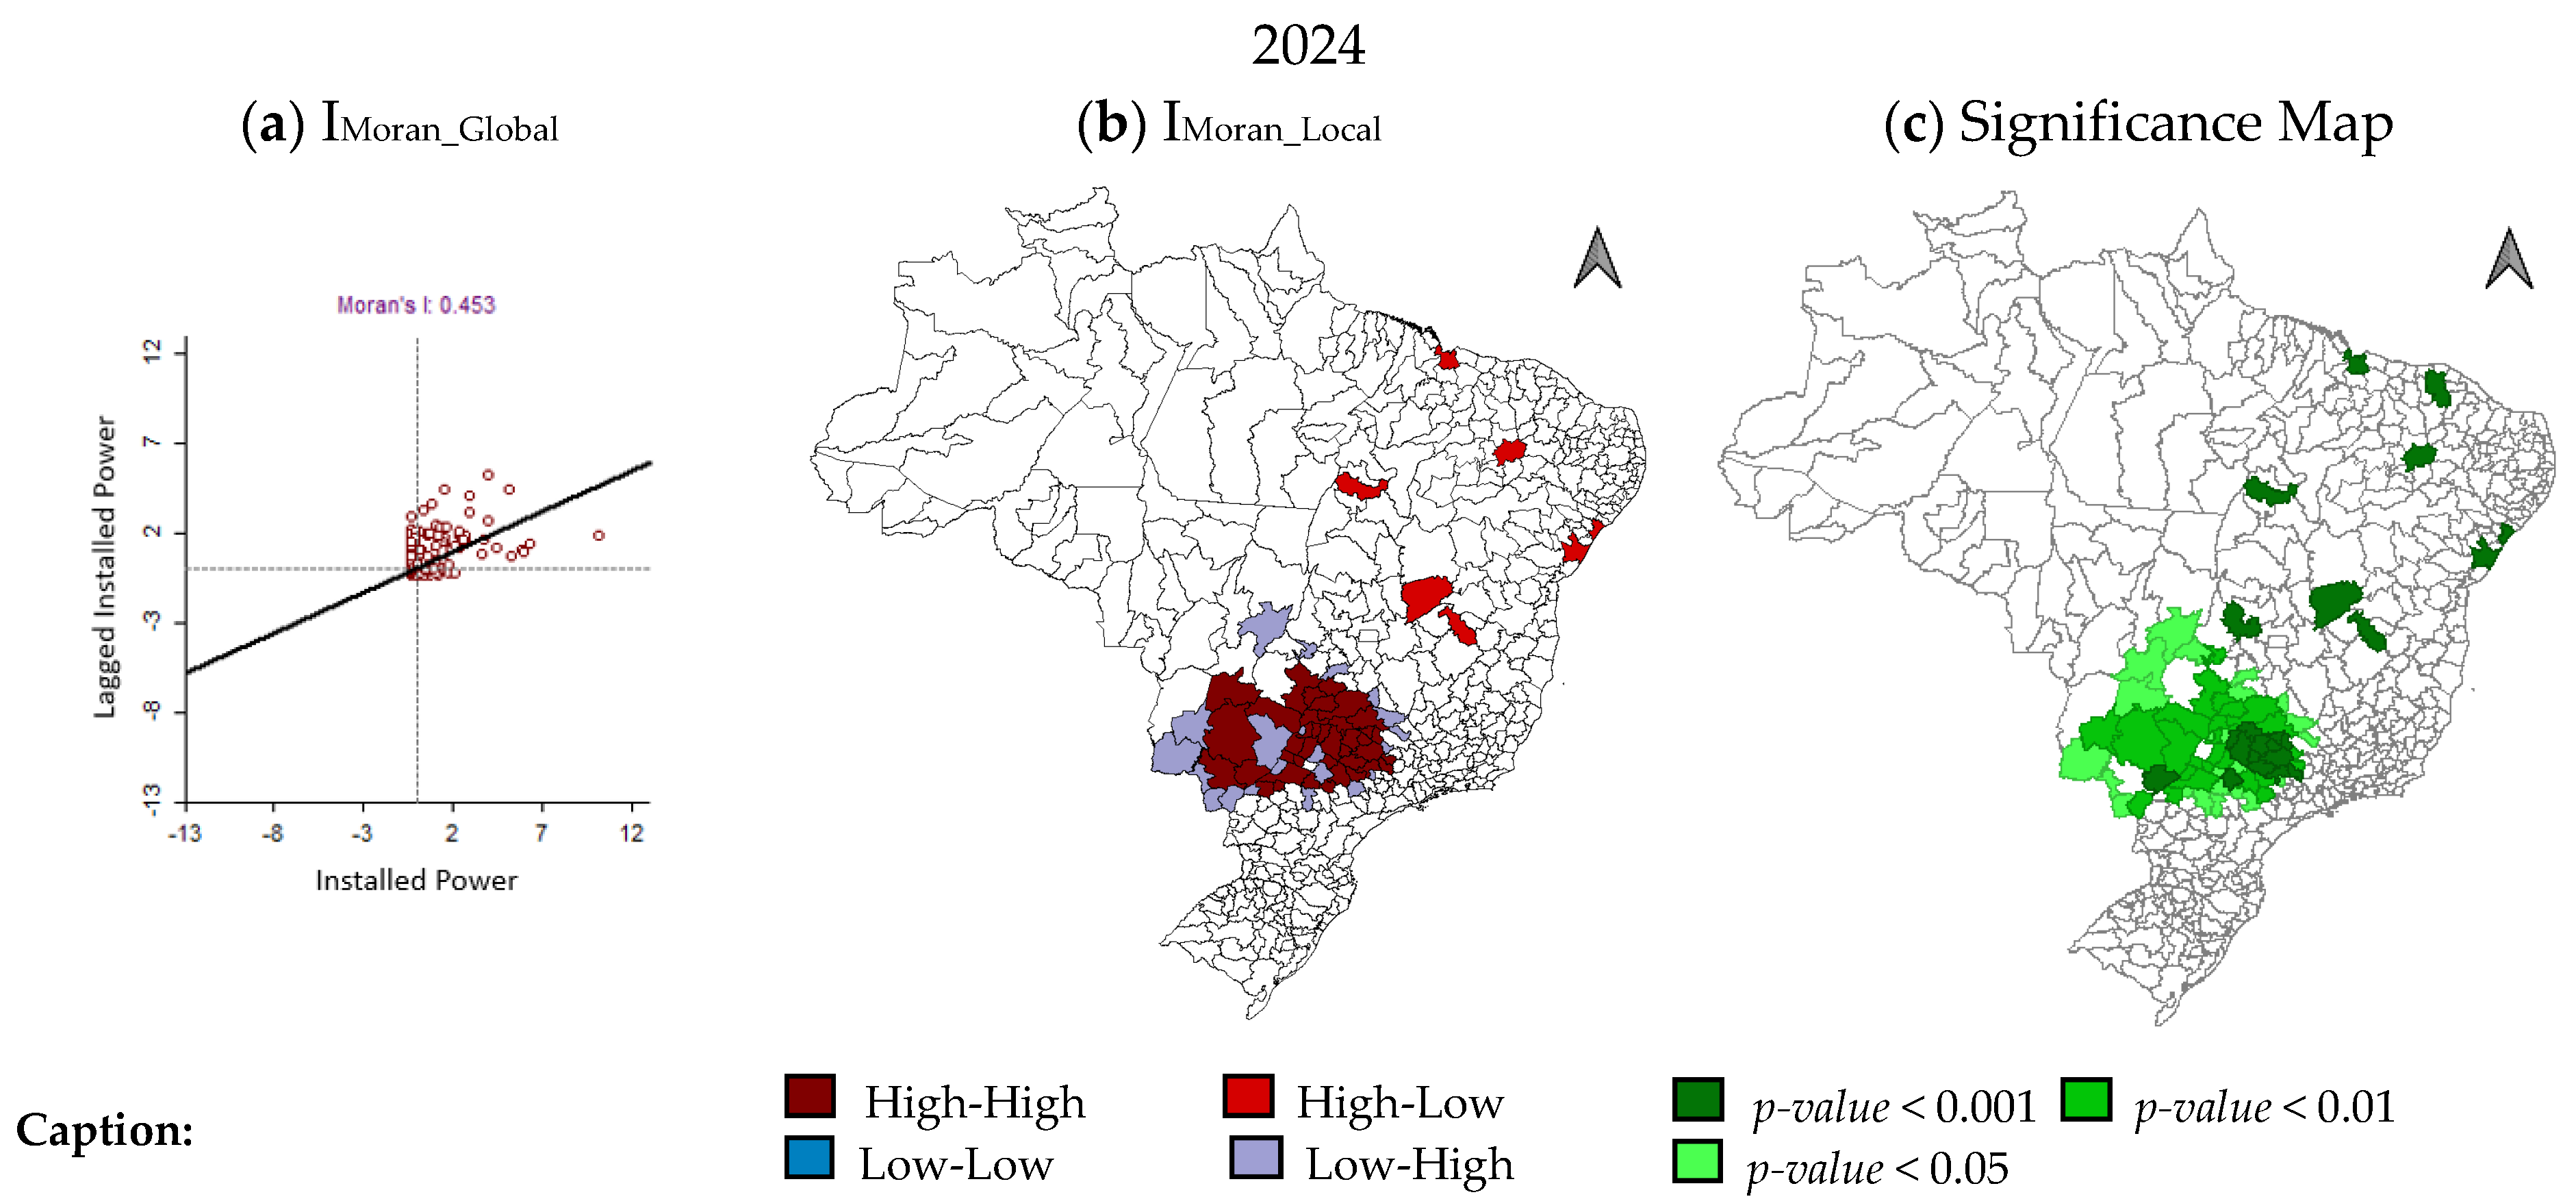
To increase the accuracy of the analysis, a spatial evaluation was also conducted for the immediate regions, for which the Global and Local IMoran indices were presented (Figure 7). Similar to the intermediate and state levels, high-level clustering was observed in the regions belonging to the states of São Paulo and Mato Grosso do Sul, reinforcing their roles as the main hubs for national generation. As with the intermediate level, it was possible to observe a positive autocorrelation for the Brazilian scenario. From I_MoranGlobal, the regions are spatially associated; however, a few neighbors escape the general distribution pattern.
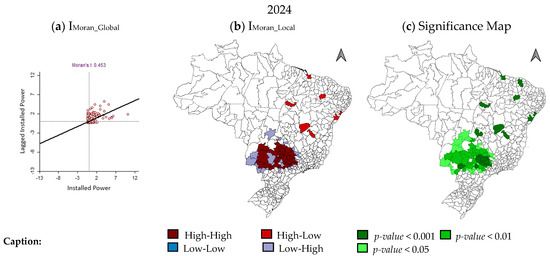
Figure 7.
Spatial distribution of IMoran_Global and IMoran_Local for the supply of sugarcane bioelectricity in immediate regions, in Brazil, in 2024.
For the High-High cluster, 39 immediate areas were involved. The total power found in this cluster was 7.33 GW granted. The decrease in value when compared to the intermediate level is due to the grouping together of regions with a smaller share of the national supply alongside others of greater prominence, due to the regional classification. In any case, 54.1% of the national total is concentrated in these regions. It should be noted that Brazil has 510 immediate units, and that only 39 units (7.64% of Brazil’s immediate units) concentrate more than half of the potential granted in 2024.
Some of the main sites are Ribeirão Preto (857.90 MW), Nova Andradina (542.68 MW), Uberaba (504.41 MW), Barretos (449.91 MW), Presidente Prudente (390.01 MW), Catanduva (353.54 MW), São José do Rio Preto (346.66 MW), Bauru (334.84 MW), and São Joaquim da Barra/Orlândia (267.40 MW).
In addition to the High-High pattern observations, another pattern that was more prominent at this level of detail was the Low-High regions, highlighting locations with not-so-high potential that were grouped together at the intermediate level. There were 20 immediate areas for this self-correlation pattern in total. Only Iporá (GO), Birigui—-Penápolis (SP), Ponta Porã (MS), Naviraí-Mundo Novo (MS), Botucatu (SP), and Araxá (MG) had power granted from sugarcane biomass, but in significantly lower quantities than their neighbors. The other 14 immediate areas had no potential from this resource.
In the midwest, the Ceres-Rialma-Goianésia region stood out in an isolated way, with 200.3 MW granted, but with no direct proximity to other regions with similar potential. Unlike the intermediate level, some of the immediate regions in the north-northeast stood out for their High-Low pattern, indicating themselves to be outliers within these regions. The northeast region of Brazil has a high dependence on biomass energy, mainly sugarcane ethanol, produced in the coastal area from Rio Grande do Norte to the state of Alagoas, but the installed potential is small compared to the expansion of the sector in the midwest and southeast [27]. An independent assessment of this region could generate some clusters, making it pertinent for more specific and regionalized studies. In addition, this region is currently showing a strong increase in specialization in solar photovoltaic and wind power generating units, which means that investments in sugar-energy biomass are lower than at other times [28].
Santos Júnior et al. [27] estimated that it is still possible to obtain up to 6.33 million toe in the northeast region from sugar cane. Of this amount, sugarcane bagasse would be the main vector, accounting for 51.96% of the energy offered. Among the states, Alagoas would be the primary highlight with 1.87 million toe, followed by the state of Pernambuco.
The main immediate region outside the Mato Grosso do Sul-São Paulo axis was Santa Maria da Vitória, in Bahia, with 125 MW granted from sugarcane. The regions of Picos (PI), with 85 MW; Aracaju (SE), with 42.50 MW; São Luís (MA), with 41.1 MW; and Alagoinhas (BA), with 38.10 MW also stood out. All the observations in the interior of the northeast were statistically significant, at a p-value < 0.01.
The national supply structure for sugar-energy bioelectricity in Brazil has been shown to depend on locational and regional factors, with regions having higher supply densities gaining advantages associated with spatial groupings.
According to Wang et al. [29], spatial differences and disparities complicate the management and formulation of public policies aimed at regional energy development, requiring spatial techniques to identify areas with similar characteristics. Some international results highlight the need to understand spatial dynamics in order to manage private investments and regional public policies. For instance, Xu et al. [30] analyzed spatial patterns of agglomeration for renewable energy sources in China. The authors showed that both environmental regulation and renewable generation exhibited positive spatial autocorrelation. This effect illustrates how the implementation of appropriate policies in the Brazilian territory, particularly in cluster regions, can intensify the increase in clean generation, favoring sustainable energy development.
Liu et al. [31] also observed that regions with high innovation in renewable energy technologies tend to be close to regions with high degrees of green industrial transformation and modernization, which helps boost regional development. The authors also suggest that agglomeration can generate a “siphon effect,” attracting capital, technology, and talent from neighboring areas, and that local policies are necessary to prevent harm to less developed areas.
As for private investment, Li et al. [32] pointed out that the level of economic development and demand for electricity in the regions surrounding conglomerates should be considered. In regions with high demand and low development, investments in renewable energy can have a more significant impact on sustainable, regional development.
In Brazil, the main challenges for investments in bioelectricity involve site selection, licensing, and grid connection [3]. Many bioelectricity production plants are located far from pumping substations that are capable of delivering the electricity produced. As a result, access to the grid becomes a barrier to the incorporation of new bioelectricity generation projects [33]. Therefore, analyzing the spatial distribution of supply can be useful for energy planning. This analysis would help optimize the construction of new projects by highlighting areas with greater regional and technological development, thus reducing investment risks [34,35].
In Brazil’s short-term plan, the Ten-Year Energy Expansion Plan 2030, an 18.52% increase in the supply of energy from sugar-energy biomass is expected. The results presented in this study are directly linked to the sector’s progress, demonstrating areas of great opportunity for implementation, as well as other areas with potential for expansion.
Regional studies show investors and public authorities how the dynamics of the sector work and highlight opportunities for new investments. These new investments are part of Brazil’s national energy transition goals, which are aligned with SDG 7, and aim to keep the share of renewable energy in the national energy matrix high, and to expand infrastructure and improve technology for the provision of modern and sustainable energy services for all [34].
Thus, the results presented in this essay, along with international experiences, provide valuable insights for the private investment sector in the area of sugarcane bagasse bioenergy, while also assisting public policymakers. A practical example could be the creation of incentive policies to promote the implementation of sugar-energy power plants in regions neighboring those with High-Low patterns, which could generate future High-High clusters through the competitive advantages that may exist in that region. Therefore, the spatial differentiation of energy policy must be thoroughly considered.
4. Conclusions
This paper analyzed the global and local spatial autocorrelation of sugarcane bioelectricity in Brazil at various regional levels, using Moran’s I statistics.
The results indicate that the supply of sugarcane bioelectricity exhibited a weak correlation between supply and total consumption, with an IMoran_Global value of 0.107. Moreover, only two states fell into the High-High pattern for electricity supply and demand.
For autocorrelation, the supply was positive, especially at the intermediate level (IMoran_Global = 0.543). This index highlights the existence of a high supply cluster in the central-southern part of the country, which could be exploited for generation development. With a lesser impact, the autocorrelation for the immediate levels (IMoran_Global = 0.453) reveals a disparity characterized by significant clustering. The presence of these clusters, mainly High-High ones, in the states of São Paulo and Mato Grosso do Sul reinforces the existence of sugarcane supply clusters in Brazil, as already observed in the supply of forest biomass in the literature. The results also have implications for investment and public policies.
The identification of clusters helps optimize the selection of locations for new projects, highlighting areas with greater regional and technological development, thereby reducing investment risks. Understanding cluster dynamics makes it possible to create appropriate infrastructure and qualification programs aligned with the sector’s needs, promoting synergies and strengthening production chains. The existence of clusters also indicates areas with strong technological development, which may facilitate sector expansion and enhance regional competitiveness.
In addition to highlighting areas with significant development in the generation of electricity from sugarcane bagasse, the results help identify regions of low supply (Low-High pattern), which should be prioritized for the creation of specific incentives aimed at expanding the sector.
Although spatial analysis has its limitations in terms of data availability and the scale of the territories analyzed, this paper makes progress by evaluating the relationship between sugar-energy biomass generation and electricity demand at the state level, even though it is not yet possible to conduct the same analysis at smaller territorial levels. The univariate analyses were successful for the different regional subdivisions. Other spatial methods could be tested to further develop this approach. Future studies could incorporate econometric models with additional variables, thus enhancing the understanding of the complex national supply.
Author Contributions
Conceptualization, E.P.S.J. and L.M.C.J.; methodology, E.P.S.J. and L.M.C.J.; software, E.P.S.J.; validation, L.M.C.J.; formal analysis, E.P.S.J., F.F.D. and L.M.C.J.; investigation, E.P.S.J. and F.F.D.; resources, L.M.C.J.; data curation, E.P.S.J.; writing—original draft preparation, E.P.S.J. and L.M.C.J.; writing—review and editing, E.P.S.J., V.B.S., F.S. and L.M.C.J.; visualization, E.D.D., V.B.S., F.S., R.S.C.M. and L.M.C.J.; supervision, L.M.C.J.; project administration, L.M.C.J.; funding acquisition, L.M.C.J. All authors have read and agreed to the published version of the manuscript.
Funding
This work was funded by FAPESQ—Call N 19-2022 Programme to Support Consolidating Nucleus in the State of Paraíba—Project N 057-2023—Market structure and eco-efficiency of the Brazilian supply of sugar-energy bioelectricity.
Data Availability Statement
The original contributions presented in the study are included in the article; further inquiries can be directed to the corresponding author.
Acknowledgments
The authors thank the National Council for Scientific and Technological Development-CNPq (Productivity Research Grants 310871/2021-2, 307449/2023-8 and Institutional Scholarship Program for Scientific Initiation), and the Foundation for Science and Technology Support of the State of Pernambuco-FACEPE Brazil (IPECTI Energias Renováveis e descarbonização: APQ-1287-24-72692). Thanks are also extended to the Coordination for the Improvement of Higher Education Personnel-CAPES.
Conflicts of Interest
The authors declare no conflicts of interest.
References
- Nunes, L.J.R.; Matias, J.C.O.; Catalão, J.P.S. Biomass in the Generation of Electricity in Portugal: A Review. Renew. Sustain. Energy Rev. 2017, 71, 373–378. [Google Scholar] [CrossRef]
- Tedesco, M.; Simioni, F.J.; Sehnem, S.; Soares, J.F.; Coelho Junior, L.M. Assessment of the Circular Economy in the Brazilian Planted Tree Sector Using the ReSOLVE Framework. Sustain. Prod. Consum. 2022, 31, 397–406. [Google Scholar] [CrossRef]
- Santos Júnior, E.P.; da Silva, M.V.B.; Simioni, F.J.; Rotella Junior, P.; Menezes, R.S.C.; Coelho Junior, L.M. Location and Concentration of the Forest Bioelectricity Supply in Brazil: A Space-Time Analysis. Renew. Energy 2022, 199, 710–719. [Google Scholar] [CrossRef]
- Milanez, A.Y.; de Souza, J.A.P.; Mancuso, R.V. Panoramas Setoriais 2030 Sucroenergético; Banco Nacional de Desenvolvimento Econômico e Social: Rio de Janeiro, Brazil, 2020. [Google Scholar]
- União da Indústria de Cana-de-Açúcar e Bioenergia—ÚNICA Bioeletricidade Gerada Com Bagaço Cresce 14% Em 2023. Available online: https://unica.com.br/noticias/bioeletricidade-gerada-com-bagaco-e-palha-cresce-14-em-2023/ (accessed on 13 May 2024).
- Empresa de Pesquisa Energética. Brazilian Energy Balance 2022 Year 2021; Empresa de Pesquisa Energética: Rio de Janeiro, Brazil, 2022; 292p. [Google Scholar]
- União da Indústria de Cana-de-Açúcar e Bioenergia. Setor Sucroenergético. Available online: https://unica.com.br/setor-sucroenergetico/etanol/ (accessed on 5 May 2024).
- Mathur, M. Spatial Autocorrelation Analysis in Plant Population: An Overview. J. Appl. Nat. Sci. 2015, 7, 501–513. [Google Scholar] [CrossRef]
- Su, Y.; Yu, Y. Spatial Agglomeration of New Energy Industries on the Performance of Regional Pollution Control through Spatial Econometric Analysis. Sci. Total Environ. 2020, 704, 135261. [Google Scholar] [CrossRef]
- Perry, M. Controversies in Local Economic Development; Routledge: London, UK, 2010; ISBN 9781136955754. [Google Scholar]
- Anselin, L. Spatial Externalities, Spatial Multipliers, And Spatial Econometrics. Int. Reg. Sci. Rev. 2003, 26, 153–166. [Google Scholar] [CrossRef]
- de Assis Cabral, J.; Legey, L.F.L.; de Freitas Cabral, M.V. Electricity Consumption Forecasting in Brazil: A Spatial Econometrics Approach. Energy 2017, 126, 124–131. [Google Scholar] [CrossRef]
- Li, J.; Wan, G.; Wang, C.; Zhang, X. Which Indicator of Income Distribution Explains Crime Better? Evidence from China. China Econ. Rev. 2019, 54, 51–72. [Google Scholar] [CrossRef]
- Coelho Junior, L.M.; de Lourdes da Costa Martins, K.; de Almeida Pinto, P.A.L.; da Silva, M.V.B. Spatial Distribution of Firewood Production in Northeastern Brazil (1994–2013). Rev. Árvore 2018, 42, e420402. [Google Scholar] [CrossRef]
- Dunn, L.N.; Sohn, M.D.; LaCommare, K.H.; Eto, J.H. Exploratory Analysis of High-Resolution Power Interruption Data Reveals Spatial and Temporal Heterogeneity in Electric Grid Reliability. Energy Policy 2019, 129, 206–214. [Google Scholar] [CrossRef]
- Zhang, C.; Zhao, L.; Zhang, H.; Chen, M.; Fang, R.; Yao, Y.; Zhang, Q.; Wang, Q. Spatial-Temporal Characteristics of Carbon Emissions from Land Use Change in Yellow River Delta Region, China. Ecol. Indic. 2022, 136, 108623. [Google Scholar] [CrossRef]
- Szaruga, E.; Załoga, E.; Drewnowski, A.; Dąbrosz-Drewnowska, P. Convergence of Energy Intensity of the Export of Goods by Rail Transport: Linkages with the Spatial Integration and Economic Condition of Countries. Energies 2023, 16, 3823. [Google Scholar] [CrossRef]
- National Electric Energy Agency Aneel’s Generation Information System—SIGA. Available online: https://app.powerbi.com/view?r=eyJrIjoiNjc4OGYyYjQtYWM2ZC00YjllLWJlYmEtYzdkNTQ1MTc1NjM2IiwidCI6IjQwZDZmOWI4LWVjYTctNDZhMi05MmQ0LWVhNGU5YzAxNzBlMSIsImMiOjR9 (accessed on 21 March 2023).
- Empresa de Pesquisa Energética—EPE. Brazilian Energy Balance 2024 Year 2023; Empresa de Pesquisa Energética: Rio de Janeiro, Brazil, 2024. [Google Scholar]
- Jing, N.; Cai, W. Analysis on the Spatial Distribution of Logistics Industry in the Developed East Coast Area in China. Ann. Reg. Sci. 2010, 45, 331–350. [Google Scholar] [CrossRef]
- da Silva, N.C.N.; de Oliveira, M.S.; dos Santos, G.R.; da Silva Braga, A. Area Data Analysis Applied to two economic indicators of mesoregions in the state of Minas Gerais. (In Portuguese: Análise de dados de área aplicada a doisindicadores econômicos de mesorregiões do estado de Minas Gerais). Rev. Bras. Biom. 2011, 29, 369–395. [Google Scholar]
- Almeida, E. Applied Spatial Econometrics. (In Portuguese: Econometria Espacial Aplicada); Alínea: Campinas, São Paulo, Brazil, 2012; ISBN 9788575166017. [Google Scholar]
- Coelho Junior, L.M.; Santos Júnior, E.P.; da Silva, C.F.F.; de Oliveira, B.H.C.; Dantas, J.B.C.; dos Reis, J.V.; Schramm, V.B.; Schramm, F.; Carvalho, M. Supply of Bioelectricity from Sugarcane Bagasse in Brazil: A Space–Time Analysis. Sustain. Environ. Res. 2024, 34, 17. [Google Scholar] [CrossRef]
- Hagadone, T.A.; Grala, R.K. Business Clusters in Mississippi’s Forest Products Industry. For. Policy Econ. 2012, 20, 16–24. [Google Scholar] [CrossRef]
- Sodiya, O.E.; Parajuli, R.; Abt, R.C.; Gray, J. Spatial Analysis of Forest Product Manufacturers in North Carolina. For. Sci. 2023, 69, 24–36. [Google Scholar] [CrossRef]
- Coelho Junior, L.M.; Santos Júnior, E.P. Space-Time Conglomerates Analysis of the Forest-Based Power Plants in Brazil (2000–2019). Energies 2022, 15, 4113. [Google Scholar] [CrossRef]
- Santos Júnior, E.P.; Silva, E.G.M.; Sousa, M.H.d.; Dutra, E.D.; Silva, A.S.A.d.; Sales, A.T.; Sampaio, E.V.d.S.B.; Coelho Junior, L.M.; Menezes, R.S.C. Potentialities and Impacts of Biomass Energy in the Brazilian Northeast Region. Energies 2023, 16, 3903. [Google Scholar] [CrossRef]
- Antunes Campos, R.; Rafael do Nascimento, L.; Rüther, R. The Complementary Nature between Wind and Photovoltaic Generation in Brazil and the Role of Energy Storage in Utility-Scale Hybrid Power Plants. Energy Convers. Manag. 2020, 221, 113160. [Google Scholar] [CrossRef]
- Wang, S.; Liu, H.; Pu, H.; Yang, H. Spatial Disparity and Hierarchical Cluster Analysis of Final Energy Consumption in China. Energy 2020, 197, 117195. [Google Scholar] [CrossRef]
- Xu, J.; Lv, T.; Hou, X.; Deng, X.; Li, N.; Liu, F. Spatiotemporal Characteristics and Influencing Factors of Renewable Energy Production in China: A Spatial Econometric Analysis. Energy Econ. 2022, 116, 106399. [Google Scholar] [CrossRef]
- Liu, C.; Xin, L.; Li, J.; Sun, H. The Impact of Renewable Energy Technology Innovation on Industrial Green Transformation and Upgrading: Beggar Thy Neighbor or Benefiting Thy Neighbor. Sustainability 2022, 14, 11198. [Google Scholar] [CrossRef]
- Li, M.; Han, C.; Meng, L.; Liu, P. Spatiotemporal Dynamics and Factors of Renewable Energy Mismatch in China. Renew. Sustain. Energy Rev. 2025, 212, 115424. [Google Scholar] [CrossRef]
- Araujo, G.J.F.; Calia, R.C. The barriers to the expansion of sugar-energy bioelectricity in Brazil: Political and economic proposals for the sector. (In Portuguese: As barreiras de ampliação da bioeletricidade sucroenergética no Brasil: Propostas políticas e econômicas para o setor). Cad. Adm. 2019, 26, 75. [Google Scholar] [CrossRef]
- Empresa de Pesquisa Energética. Plano Decenal de Expansão de Energia 2030; Empresa de Pesquisa Energética: Rio de Janeiro, Brazil, 2021. [Google Scholar]
- Tolmasquim, M.T.; de Barros Correia, T.; Addas Porto, N.; Kruger, W. Electricity Market Design and Renewable Energy Auctions: The Case of Brazil. Energy Policy 2021, 158, 112558. [Google Scholar] [CrossRef]

Disclaimer/Publisher’s Note: The statements, opinions and data contained in all publications are solely those of the individual author(s) and contributor(s) and not of MDPI and/or the editor(s). MDPI and/or the editor(s) disclaim responsibility for any injury to people or property resulting from any ideas, methods, instructions or products referred to in the content. |
© 2025 by the authors. Licensee MDPI, Basel, Switzerland. This article is an open access article distributed under the terms and conditions of the Creative Commons Attribution (CC BY) license (https://creativecommons.org/licenses/by/4.0/).