Article

Simulation and Experimental Design of an Axial Flow Cyclone Separator Suitable for High-Wind–Sand Environments

College of Mechanical Engineering, Xinjiang University, Urumqi 830046, China
*
Author to whom correspondence should be addressed.
Sustainability 2025, 17(8), 3355; https://doi.org/10.3390/su17083355
Submission received: 19 February 2025 / Revised: 4 April 2025 / Accepted: 7 April 2025 / Published: 9 April 2025

Abstract

:
In order to meet the demand for both efficient sand particle separation and low-cost operation and maintenance in harsh high-wind-blown sand environments, a novel axial flow cyclone separator was optimized and designed. The effects of structural and operational parameters on pressure drop and separation efficiency were investigated through numerical simulations. Finally, orthogonal experiments were conducted on a 1:1 stainless-steel axial flow cyclone separator model using a wind tunnel experimental platform. The performance of the optimized cyclone separator in terms of separation efficiency and pressure drop under high-wind-blown sand conditions was studied.

1. Introduction

In recent years, with the expansion of nuclear power plant site selection, some sites are located in harsh high-wind-blown sand environments. Sand control has become an important issue to consider in the fresh air treatment systems of nuclear power plants, particularly for electrical buildings where the ingress of large dust particles into indoor spaces can lead to the operational failure of electrical equipment [1]. Therefore, the fresh air treatment system is a critical component of the plant’s ventilation system.
Currently, the most commonly used separation method in fresh air systems is the use of filters to separate wind-blown sand particles from the air. This separation method offers advantages such as a high separation efficiency and its ease of installation [2]. However, when the outdoor air contains high concentrations of wind-blown sand particles, larger particle sizes, or when handling large air volumes, this method faces significant challenges, including large pressure drops, internal clogging of filters, and higher operational costs due to frequent cleaning and replacement.
Therefore, there is a need to develop a corresponding wind-blown sand filtration technology that not only provides sufficient separation efficiency but also allows particles to be automatically diverted and collected after separation, keeping the device clean internally without requiring manual maintenance over long periods of operation. Additionally, the pressure drop should be further reduced to save operational costs. The existing mainstream separation technologies include filtration, electrostatic precipitation, wet separation, and mechanical separation. When outdoor air contains a high concentration of particulate matter and the air volume to be processed is large, filtration faces significant challenges, such as filter clogging and frequent cleaning or replacement, leading to high operational costs. Electrostatic precipitation is effective for fine particles smaller than 1 micron, but its collection efficiency for larger sand particles is low, and it may generate ozone, which deteriorates air quality, resulting in higher operational costs. Wet separation relies on water mist to capture particles, which, although effective in reducing dust concentration, is limited in water-scarce regions such as deserts and incurs high operational costs.
Mechanical separation devices include inertial separators, gravity settling chambers, and cyclone separators. Inertial dust collectors use the inertial force of particles as the primary mechanism for separating particles. Typically, the inertial force acting on particles in an inertial dust collector is much greater than gravitational force, leading to a higher separation efficiency compared with gravity settling chambers. However, it still struggles to effectively separate particles larger than 10 microns [3]. Gravity settling chambers rely on gravity for particle separation, and they exhibit high efficiency for particles larger than 80 microns. However, their separation efficiency for particles larger than 10 microns, which can significantly impact industrial production, is quite low. Cyclone dust collectors use centrifugal force as the main mechanism for particle separation and can effectively separate particles larger than 10 microns.
Based on the primary flow direction of the dust-laden gas, cyclone separators can be further classified into counterflow and axial flow types. While counterflow cyclone separators offer higher particle separation efficiency, they require a change in the primary airflow direction, resulting in higher operational pressure drops [4]. Furthermore, in high dust-load environments, the concentration of particles significantly increases, especially larger particles, which tend to settle within the cyclone separator. Due to the change in airflow direction, particles struggle to maintain sufficient velocity during the separation process, leading to the deposition of larger particles on the inner walls of the separator. When particle accumulation reaches a certain level, it can cause local blockages [5]. Additionally, the installation constraints of counterflow cyclone separators make them difficult to apply in ventilation systems. In contrast, axial flow cyclone separators use their structure to induce rotational motion in the fluid, generating centrifugal force through this motion to separate denser fluids or solid particles from another fluid. This device features a compact structure, low manufacturing costs, simple maintenance, low operating costs, and good flexibility. If the structural design is optimized, particularly through the design of the guide vanes, the separator can effectively separate particles larger than 10 microns while maintaining a low pressure drop [6]. Moreover, optimizing the particle collection system allows for the efficient collection of particles and the automatic discharge of the collected particles. The main objective of this study is to design an axial flow cyclone separator that meets the dust removal requirements of ventilation systems in specific environments by analyzing the influence of different structural parameters on its performance [7].
This study investigates the impact of various structural parameters on the performance of an axial flow cyclone separator and optimizes the design of a novel separator to meet the sand separation requirements of fresh air systems in high-wind-blown sand environments. Using orthogonal experimental design and CFD-DEM coupled numerical simulations, the performance of the axial flow cyclone separator was analyzed, with a specific focus on how the blade structure influences separation efficiency [8]. The key innovation of this study lies in the hybrid blade design, which has the potential to improve separation efficiency while maintaining a low pressure drop. To assess the separation performance under high-wind-blown sand conditions, the separation efficiency and pressure drop were tested under a fixed airflow rate of 8000 m3/h and varying sand particle sizes. The airflow rate of 8000 m3/h was selected as it represents a typical wind speed condition in high-wind-blown sand environments [9]. Finally, a wind tunnel test platform was established to validate the separation efficiency, pressure drop, and the automatic self-cleaning function (which requires no manual maintenance) of the 1:1 scale axial flow cyclone separator model [10]. The proposed separator is particularly suited for deployment in arid and semi-arid regions where sandstorms pose a significant challenge to infrastructure, including electrical buildings and fresh air systems in industrial facilities [11]. By effectively mitigating wind-blown sand intrusion, the separator enhances the operational reliability and longevity of critical infrastructure, reducing maintenance costs and resource consumption. This contributes to sustainability by minimizing the environmental impact associated with frequent filter replacements and energy-intensive maintenance activities. Furthermore, the design of an energy-efficient, low-pressure-drop cyclone separator aligns with global efforts to promote sustainable engineering solutions that optimize resource utilization and reduce the carbon footprint. These findings provide a theoretical and technical foundation for the development of resilient sand mitigation technologies, supporting sustainable development initiatives in sandstorm-prone regions.

2. Research Methodology

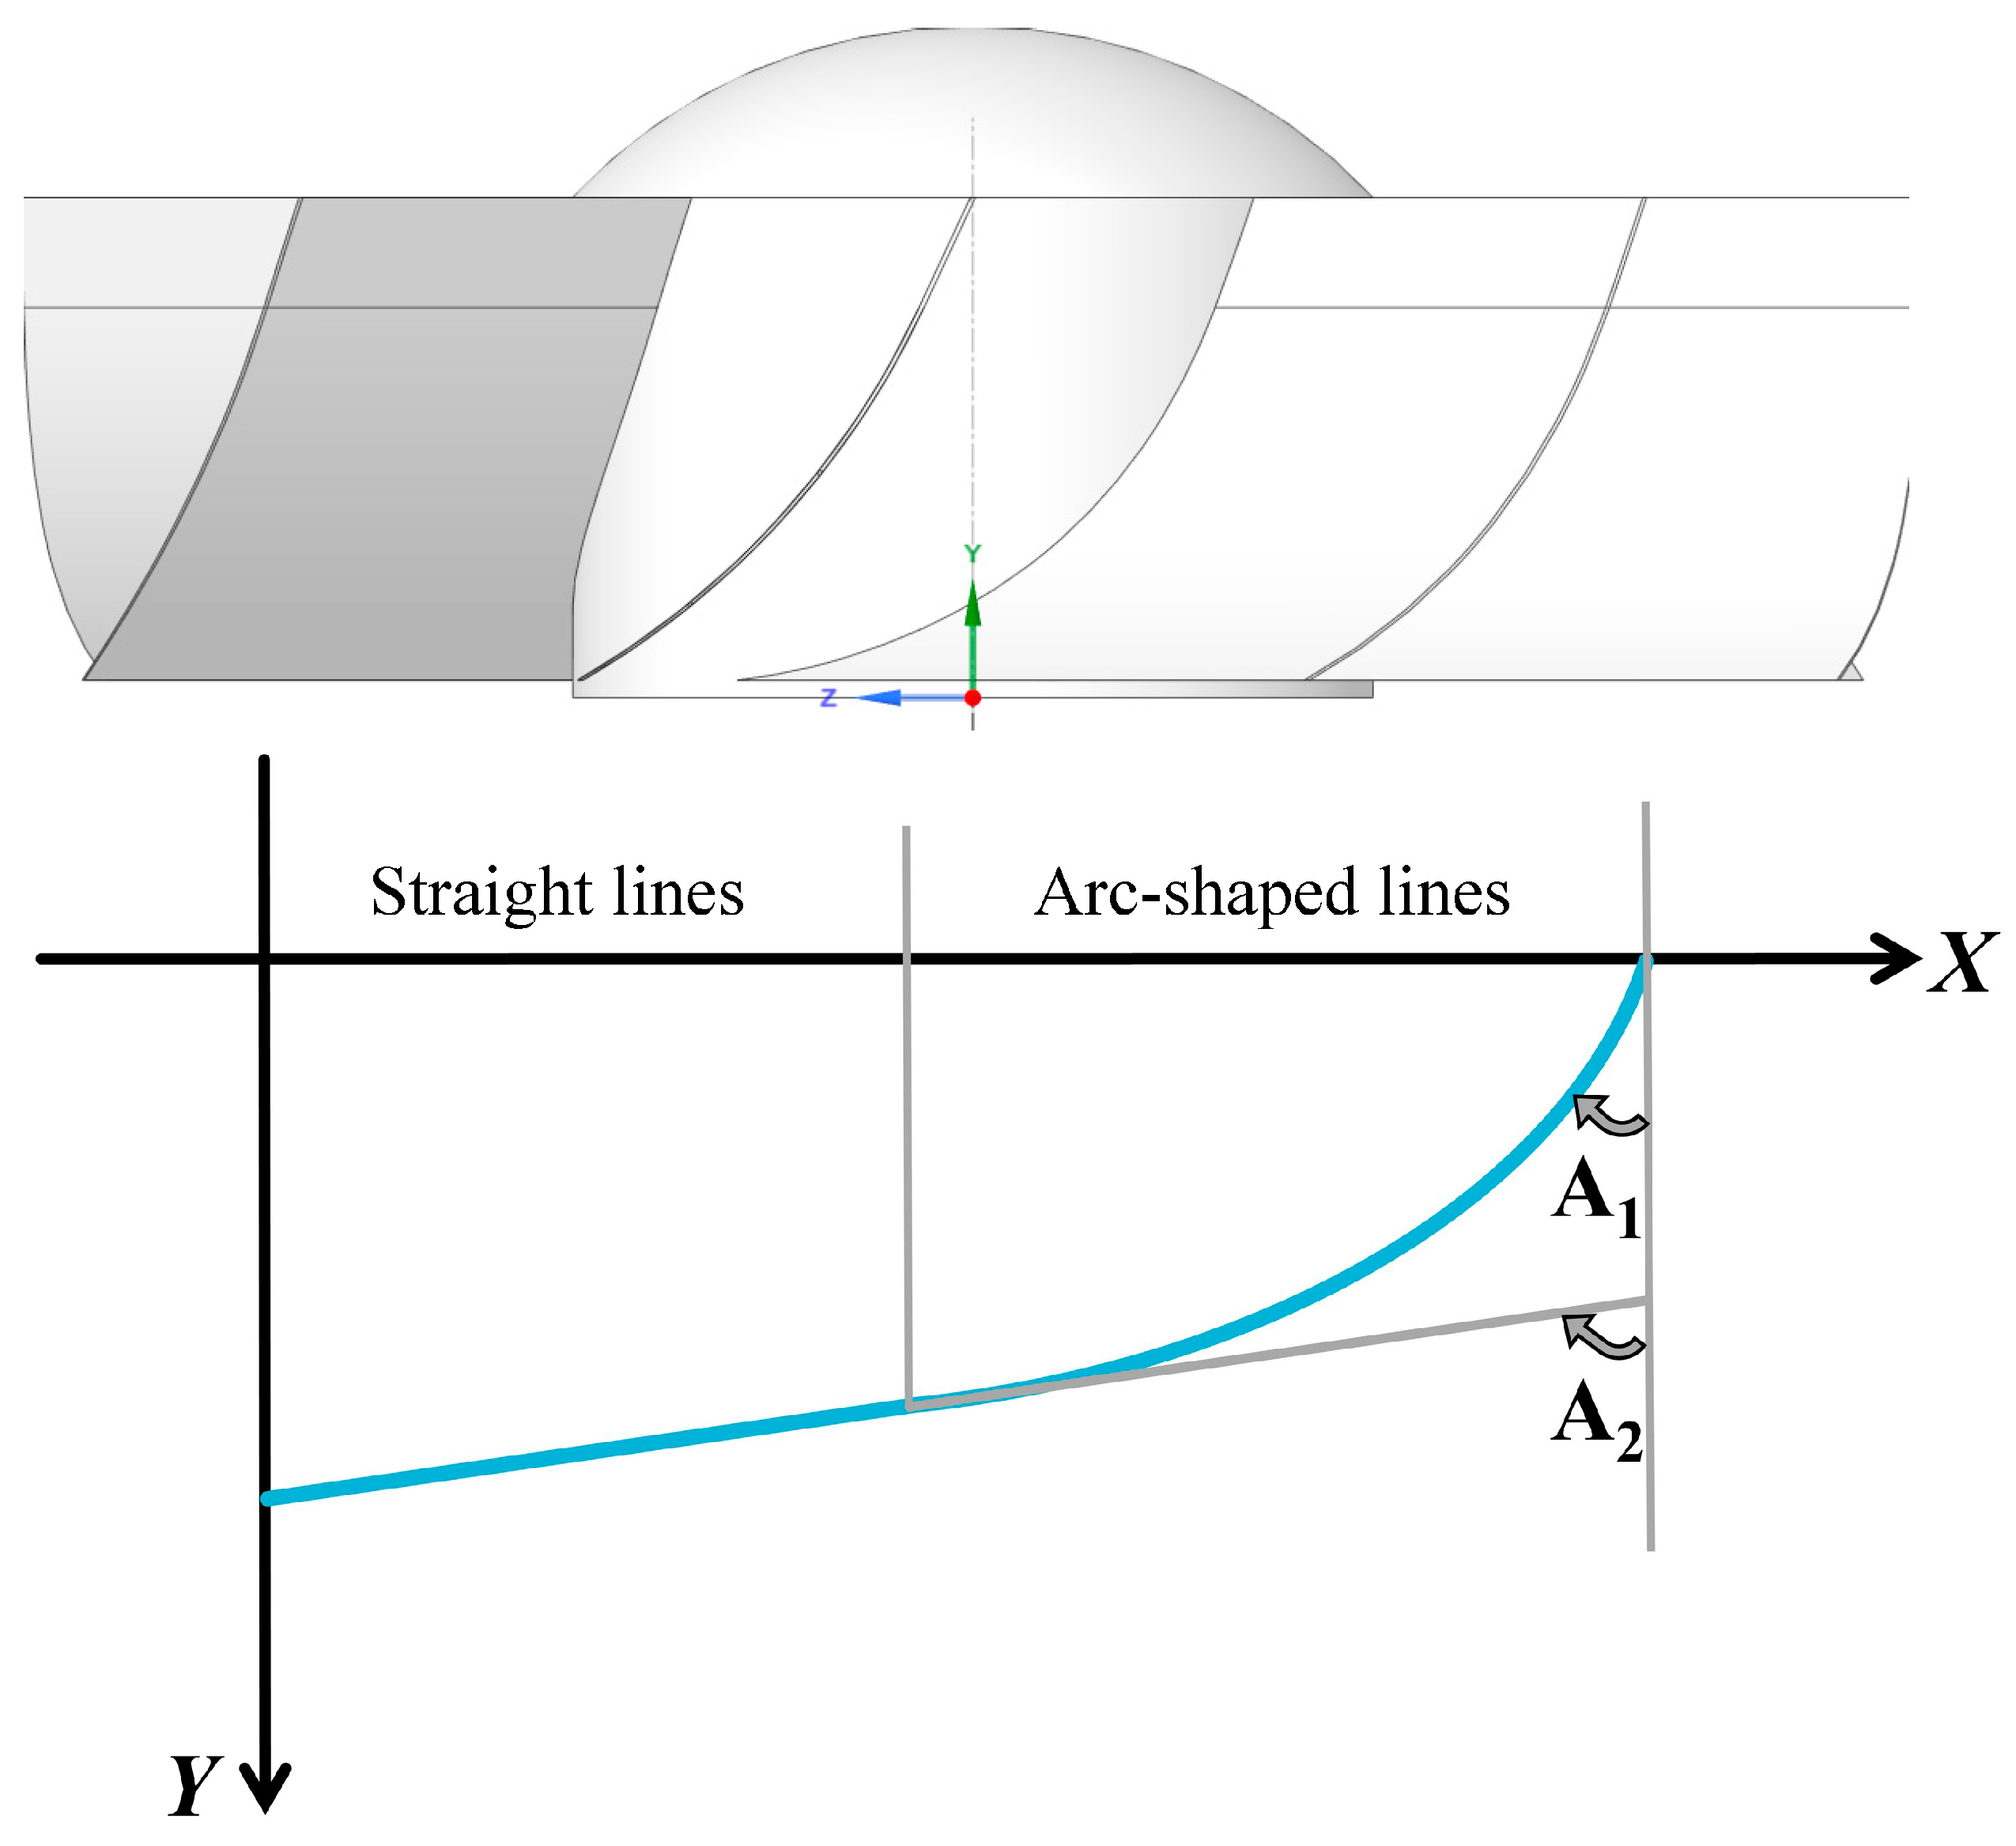
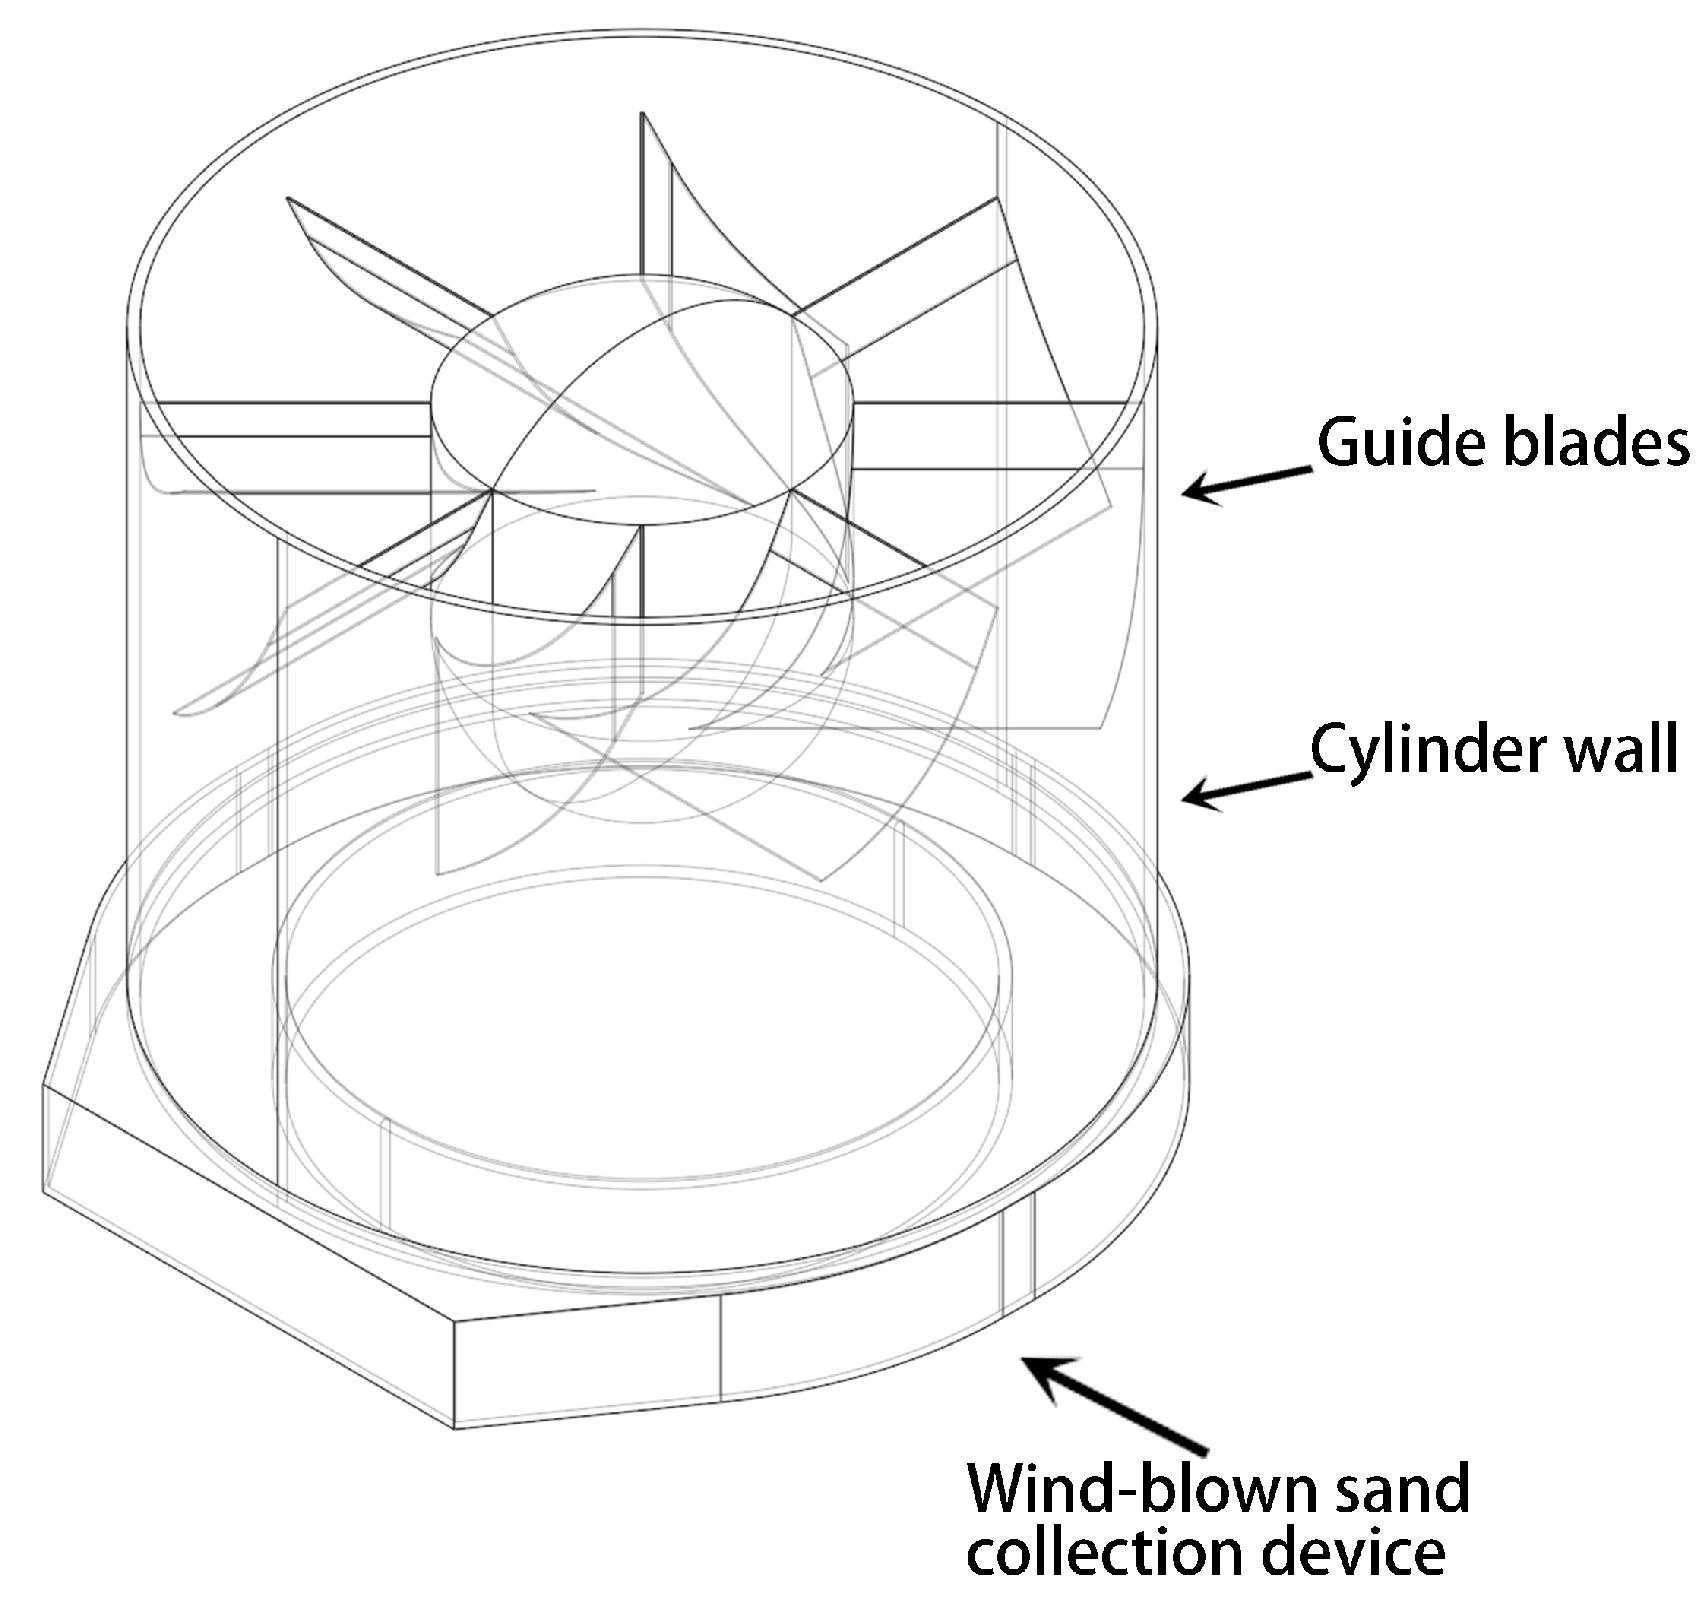
2.1. Axial Flow Cyclone Separator Model

The cyclone separator studied in this manuscript is shown in Figure 1 and mainly consists of the following components: outer casing, flow guide body, guide blades, and airflow outlet. The specific dimensions are as follows: the length of the wind-blown sand collection device is a1 = 100 mm, the length of the guide blades is a3 = 270 mm, and the spacing between these two components is a2 = 330 mm. The diameter of the airflow outlet is D1 = 540 mm, while the diameter of the airflow inlet is D2 = 780 mm.
The axial flow cyclone separator operates by inducing a strong swirling motion in the incoming dust-laden airflow through its guide blades. As the airflow enters the separator, the guide blades impart a tangential velocity component, generating a high-speed rotational flow field. This swirling motion creates centrifugal forces, which drive the heavier sand and dust particles outward toward the separator walls [4]. The separated particles lose momentum upon contact with the wall, causing them to gradually fall into the sand collection chamber, where they are discharged.
To evaluate the impact of key design parameters on separation efficiency and pressure loss, this study conducted a sensitivity analysis. Sensitivity analysis is a widely used method for quantifying the effects of small variations in input parameters on system performance [12]. In this study, the sensitivity analysis focuses on the following key parameters: number of guide blades, blade deflection angle, blade thickness, blade length, and guide cylinder diameter. The results of the analysis are summarized in Table 1, illustrating the relative influence of each design parameter on separation efficiency and pressure loss. The findings indicate that the blade count and deflection angle are the most critical parameters, exerting the most significant impact on the system performance.
The guide blades are of a hybrid type, with the inner profile of the blades formed by a combination of arc-shaped and straight lines [13]. The unwrapped trajectory of the cylindrical surface of the inner profile is shown in Figure 2. The arc-shaped blade segments have lower local resistance, but the effect of inducing airflow rotation is limited. The spiral-shaped blades, while effectively inducing airflow rotation, result in higher local resistance in the blade segments. By combining both types, a hybrid guide blade structure is designed to achieve inertial separation of the wind-blown sand and gas [13]. When the gas flow, carrying solid particles, passes through the blade channel at a certain velocity, the flow direction continuously changes. Larger particles are more easily affected by the guiding action of the blades, leading to their separation from the main gas flow, while the gas smoothly passes through the guide blades and exits through the airflow outlet.
Through extensive simulation and computational analysis, it was found that changing the deflection angles A1 of the arc-shaped blades and A2 of the straight-line blades leads to significant changes in the filtration efficiency and pressure drop of the cyclone separator. The subsequent orthogonal experiments primarily focused on these two parameters.
After passing through the guide blades, sand particles are deflected away from the solid walls and accumulate near the cylinder wall. As the sand particles move toward the air outlet along with the airflow, they are collected by the external sand collection device and then discharged from the cyclone separator through the device’s opening. The structure of the wind-blown sand collection device is shown in Figure 3. The central part serves as the air outlet, which is surrounded by an outer casing designed to collect sand particles.

2.2. Numerical Simulation

2.2.1. Turbulence Model

Fluids can be classified into two types based on their flow regimes: laminar flow and turbulent flow. To characterize turbulent flow, various numerical simulation methods have been proposed. These methods can be divided into direct numerical simulation (DNS) and indirect numerical simulation (non-DNS), based on how the turbulence governing equations are solved. DNS does not require any model simplifications or empirical constants, directly solving the instantaneous turbulence governing equations to obtain the distribution of flow parameters. It is the most accurate method, but it requires high computational power. Currently, DNS can only be applied to simple flows at low Reynolds numbers, making it difficult to simulate complex flows commonly encountered in engineering.
Non-DNS methods do not directly resolve the fluctuating characteristics of turbulence, instead simplifying the turbulence to a certain extent. Depending on the level of simplification, they can be further categorized into large eddy simulation (LES) and Reynolds-averaged Navier–Stokes (RANS) methods [14]. Compared to RANS, LES still demands significant computational resources, which limits its application in engineering practice.
The RANS method simplifies the governing equations by time-averaging [15], thereby avoiding the large computational burden associated with direct simulations. It requires less computational power and provides statistical averaged parameters of interest in engineering applications, making it widely used in the field. However, the time-averaging process introduces the Reynolds stress terms, which lead to an incomplete set of governing equations. Depending on how the Reynolds stresses are handled, the RANS method can be further classified into two types: one assumes the Boussinesq hypothesis for the turbulent viscosity coefficient, which is as follows
ρ u i u j ¯ = 2 μ T S i j 2 3 ρ k δ   i j S i j = 1 2 ( U i x j + U j x i )
where μ T represents the turbulent viscosity coefficient, and k is the turbulent kinetic energy. Depending on the number of equations required to compute μ T , turbulence models can be categorized into zero-equation, one-equation, and two-equation models [16]. Among all turbulence models of this type, the simplified relationship between the Reynolds stress and strain rate leads to poor simulation performance in complex turbulent flows, such as rotating flows, flows with strong curvature, and separation flows induced by curved surfaces. As a result, these models are not suitable for simulating the strong rotational flow inside cyclone dust collectors.
Another type of model abandons the Boussinesq hypothesis for turbulent viscosity and closes the governing equations by directly solving the differential equation for the Reynolds stress. This is known as the Reynolds stress model (RSM) [17]. In this study, the internal flow of the cyclone separator exhibits strong rotational and turbulent characteristics, accompanied by significant anisotropic stress distribution. Traditional RANS turbulence models (e.g., k-ε or k-ω SST) typically assume isotropic turbulence, making them less effective in accurately capturing stress anisotropy in rotational flow fields. The k-ε model performs well in predicting globally averaged turbulence; however, due to its closure formulation based on turbulent kinetic energy and the dissipation rate, it struggles to accurately describe rotational flows and intense turbulent separation phenomena. The k-ω SST model provides better predictions near the boundary layer but may overestimate turbulent viscosity in highly rotational flow environments, thereby affecting particle trajectory predictions. The Reynolds stress model (RSM) solves each component of the Reynolds stress tensor individually, avoiding the turbulence viscosity assumption and enabling a more precise description of turbulence anisotropy. This makes RSM particularly suitable for simulating rotational and complex shear flows. Compared to large eddy simulation (LES), which directly resolves large-scale turbulent structures while modeling only the smaller scales, LES offers higher accuracy in complex flow environments such as cyclone separators. However, LES requires significantly finer grid resolutions, especially in near-wall regions, leading to a substantial increase in computational cost [18]. Considering the computational resource constraints of this study and the feasibility of practical engineering applications, RSM provides a favorable balance between accuracy and computational cost, making it the preferred choice for this investigation. Compared to one-equation and two-equation models, the RSM more accurately considers the effects of flowline curvature, rotation, and the sharp variations in flowlines, making it more suitable for solving the flow field inside cyclone dust collectors. Given the advantages of the RSM turbulence model, it is widely used for solving the flow field inside cyclone dust collectors [19]. Therefore, in this study, the turbulence model employed is the RSM.

2.2.2. Equations of Particle Motion

The motion state of particles in the flow field is determined by their initial conditions when entering the flow field and the forces acting on them within the flow field. The initial state of the particles when they enter the flow field should be set based on real conditions. Once the initial state is determined, the particle motion state can be obtained by considering the forces acting on the particles within the flow field [20]. Based on the forces acting on the particles in the flow field, the particle motion equation can be expressed as follows:
d u p d t = F D ( u u p ) + g ( ρ p ρ ) ρ p + F
The expression for FD is given by the following:
F D = 18 μ ρ p d p 2 C D R e p 24
In Equation (2), u represents the fluid velocity, u p is the particle velocity, μ is the dynamic viscosity coefficient, ρ p is the particle density, ρ is the fluid density, and R e p is the particle Reynolds number, which is expressed as follows:
R e p = ρ d p u p u μ
C D is the drag coefficient, which is expressed as follows:
C D = 24 R e p ( 1 + b 1 R e p b 2 ) + b 3 R e p b 4 + R e p
In Equation (5), b 1 , b 2 , b 3 , and b 4 are defined as follows:
b 1 = e x p ( 2.3222 6.4581 Φ + 2.4486 Φ 2 )
b 2 = 0.0964 + 0.5565 Φ
b 3 = e x p ( 4.905 13.8944 Φ + 18.4222 Φ 2 10.2599 Φ 3 )
b 4 = e x p ( 1.4681 + 12.2584 Φ 20.7322 Φ 2 + 15.8855 Φ 3 )
where Φ is the shape factor, which is used to characterize the degree of difference between the particle shape and an ideal spherical particle [21], and is defined as follows:
Φ = s S
where in this equation, s represents the surface area of an ideal sphere with the same volume as the particle, and S is the actual surface area of the particle.
In Equation (2), the first term on the right-hand side represents the Stokes drag force acting on a unit mass of the particle; the second term represents the difference between the gravitational force and buoyant force acting on a unit mass of the particle; the third term represents the additional forces acting on a unit mass of the particle, including the virtual mass force, Magnus force, Basset force, Saffman lift, thermophoretic force, and electrophoretic force, among others. In a cyclone dust collector, compared to other forces, when the particle size is very small [22], the Stokes drag force plays the dominant role in particle motion, and other forces can be neglected [23].

2.2.3. Numerical Simulation Methods

The internal flow characteristics of the axial flow cyclone separator are influenced by the upstream and downstream airflow conditions. Therefore, in numerical simulations, the boundary conditions should closely match real operating conditions to ensure accuracy. The computational domain and mesh, as shown in Figure 4, was established accordingly.
For mesh generation, a hybrid approach combining structured and unstructured grids was used, with local refinement applied to critical regions. This method effectively controls the total number of grid elements while ensuring that the mesh accurately represents the physical boundaries. The final mesh consists of approximately 300,000 elements.
To ensure the grid independence of the numerical solution, the final results should depend only on the boundary conditions rather than the mesh configuration. In this study, an adaptive grid refinement approach was employed to meet this requirement. Grid independence was confirmed when further mesh adjustments did not lead to significant changes in the computed results. The specific verification process is as follows:
(1)
Monitoring mass flow rate, momentum, and residuals to ensure residuals remain below 10−4.
(2)
Tracking the average static pressure, total pressure, and velocity at the inlet and outlet cross-sections, ensuring their values remain stable.
(3)
Applying adaptive mesh refinement once the numerical solution converges under the above conditions.
(4)
Checking for changes in computed results after mesh refinement. If no significant variations occur, the solution is considered grid independent. Otherwise, further mesh refinement is performed until a grid-independent converged solution is obtained.
The flow inside the axial cyclone separator is characterized by a strongly rotating flow field, and the Reynolds stress model (RSM) was selected as the turbulence model [24]. The motion of wind-blown sand within the flow field was simulated using the discrete phase model (DPM) in computational fluid dynamics (CFDs) software (The simulations in this study were performed using ANSYS Fluent 2020 R2). Coupled velocity–pressure calculations were performed using the coupled algorithm, with the momentum equations, turbulent kinetic energy, and turbulent dissipation rate equations formulated in first-order windward format, and the differential pressure correction was handled using the PRESTO! scheme. The sand particle trajectories were calculated based on the Euler–Lagrange method for DPM simulations [25]. In the DPM, there is unidirectional coupling between the particles and the airflow, where the airflow influences the particle motion but the particles do not affect the airflow. The convergence criterion for the simulation was set to 0.001.
In this simulation, the continuous phase is solved separately from the discrete phase. The continuous phase, which is air, is simulated using CFDs software and requires initialization after setting the boundary conditions based on the actual situation to obtain a definite solution. The boundary conditions include fluid inlet and outlet conditions, wall conditions, and inner surface boundary conditions, which are set as follows:
(1)
The inlet boundary condition is a velocity inlet, providing the inlet air with a certain initial velocity, and the airflow in the cyclone separator is treated as a constant incompressible flow.
(2)
The outlet boundary condition is set as a pressure outlet, with the assumption that the air remains at a constant temperature throughout the simulation.
(3)
The wall boundary conditions stipulate that both the tube wall and baffles are adiabatic, and there is no wall slip.
The boundary condition of the sand collection device is set to “trap”, meaning particles in contact with the device are considered to be captured. The remaining wall surfaces are set to “reflect.”
The continuous phase is air with a density of 1.204 kg/m3, turbulence intensity is 5%, the airflow rate is set to 8000 m3/h, and the calculated wind speed is 4.9 m/s.
The discrete phase consists of wind-blown sand particles with a density of 2650 kg/m3 and a particle size range of 10 to 100 μm. At the inlet, the particle velocity is assumed to be identical to that of the gas phase, and the particles are uniformly distributed along the inlet surface. At the outlet, particles are assumed to escape. The outer wall surface is set to reflect, meaning that particles that come into contact with the wall surface are assumed to reflect off it. The wall surface of the sand collection device is set to trap, meaning that particles in contact with the collection device’s wall surface are considered trapped.
To simulate the natural wind–sand conditions as closely as possible to real-world environments, the sand particle sizes used in this study reference data observed by Mao Donglei and others from the Cele oasis, Xinjiang [26]. According to their observations, the coarser silt and fine sand, which have the highest percentage content, are found on the surfaces of sand dunes, flowing dunes, bare sandy plains, and the sand-bearing material of the atmosphere and dust deposition. The particle size distributions of these two types are 31–63 μm and 63–125 μm, respectively. In addition, there are some medium silt and coarse silt particles, with a particle size range of 8–31 μm. Thus, the majority of sand particles in the wind-blown sand range from 8 to 125 μm in diameter. Accordingly, for both the simulation calculations and experiments, the sand particle sizes were set within the range of 10 μm to 100 μm, based on actual conditions. Detailed parameters are shown in Table 2.

2.3. Experimental System and Methods

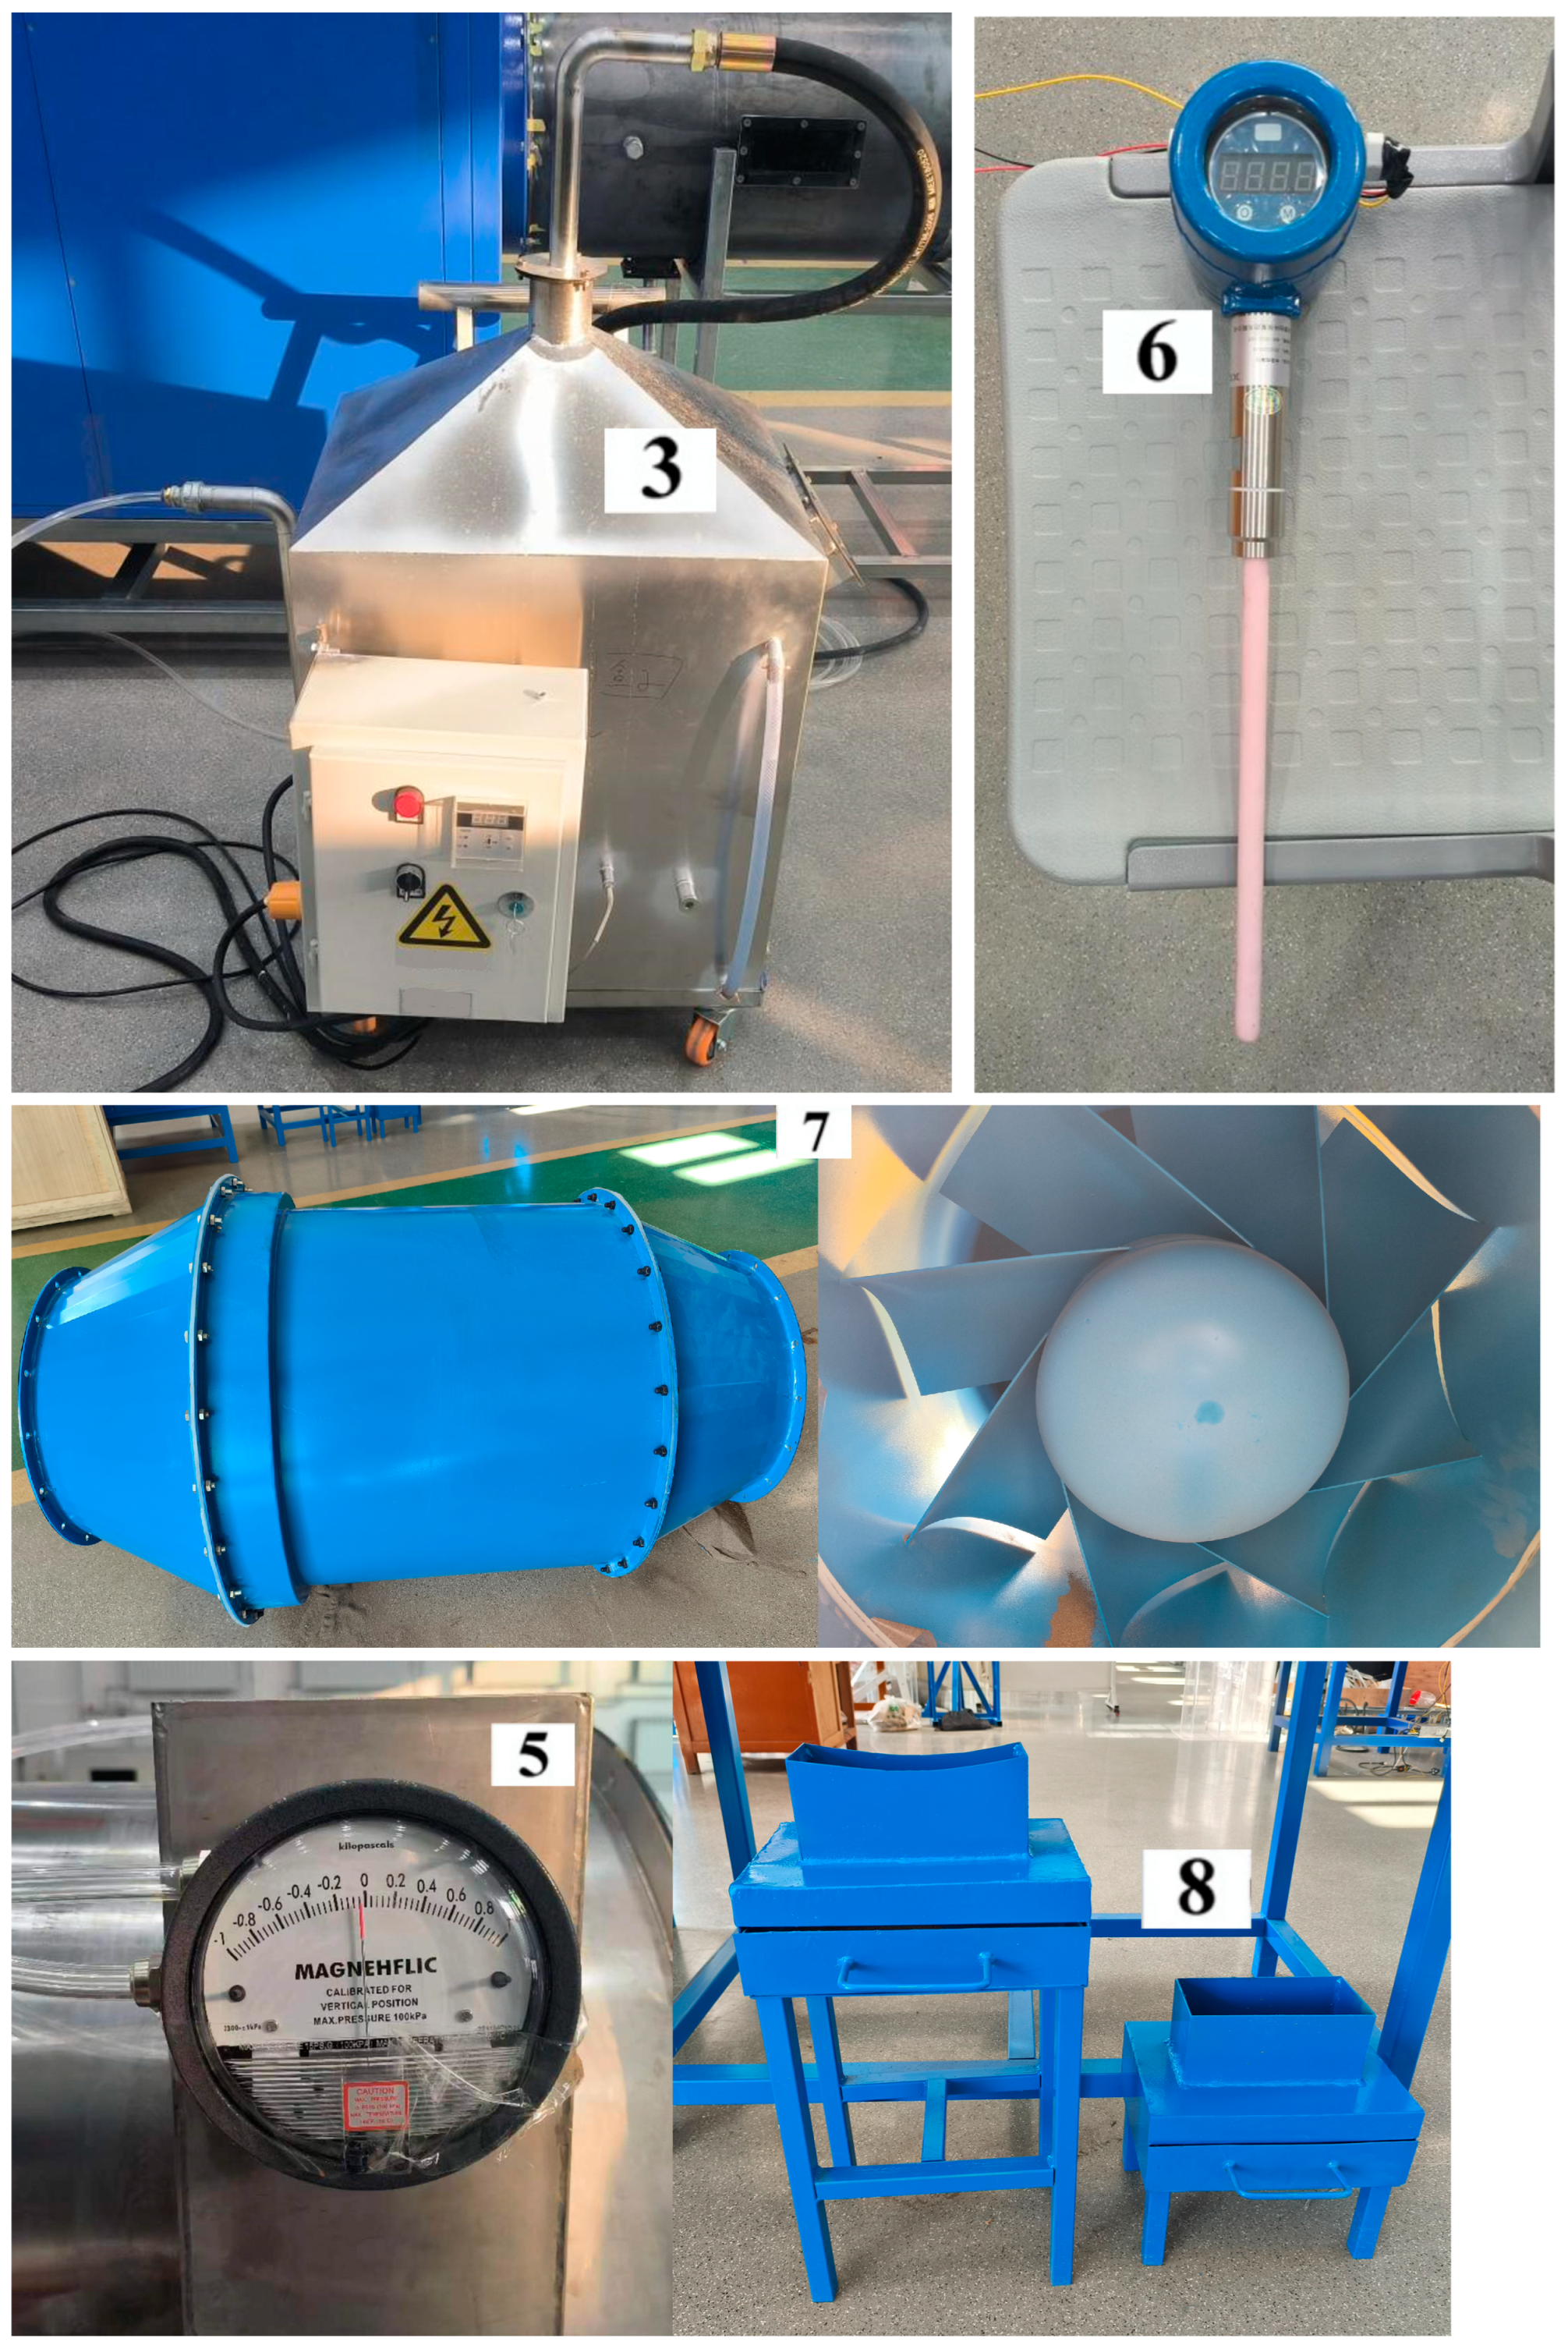
2.3.1. Experimental System Description

The design of the wind tunnel experimental platform is shown in Figure 5. It primarily consists of the following components: (1) a variable frequency fan, (2) a medium-efficiency filter, the wind tunnel duct, (3) sand injection equipment, (4) a flow monitor, (5) a differential pressure meter, (6) an electrostatic dust detector, (7) an axial flow cyclone separator, (8) sand collection box, and a temperature and humidity meter, as illustrated in the figure.
The variable frequency fan is used to provide a certain airflow rate, and by adjusting the frequency of the fan, the incoming airflow velocity can be modified.
The medium-efficiency filter is used to filter the air entering the experimental duct and the exhaust air, preventing external dust and impurities from interfering with the experimental results, thus improving the experimental accuracy and preventing environmental contamination.
The wind tunnel duct connects the medium-efficiency filter and the axial flow cyclone separator while also linking the various experimental testing instruments, ensuring that the experiment is conducted in a closed internal environment.
The sand injection device is primarily a screw feeding mechanism. The rotation of the internal screw effectively disperses the added wind-blown sand particles and ensures their uniform injection. It is connected to the wind tunnel duct to introduce a specific weight of sand particles into the airflow path.
The flow monitor is used to measure the airflow rate and velocity entering the axial flow cyclone separator, with a measurement accuracy of 1%. The measurement range of the flow monitor is 1000 to 10,000 m3/h.
The differential pressure meter is used to detect the pressure difference between the inlet and outlet of the axial flow cyclone separator in real-time, with a measurement accuracy of 0.5%. The pressure taps are placed at the inlet and outlet of the separator. The measurement range of the differential pressure meter is 0 to 1000 Pa.
The electrostatic dust detector is used to measure the wind-blown sand concentration at both the inlet and outlet of the axial flow cyclone separator in real-time. The dust particle size range measured is from 1 to 200 μm, with a measurement accuracy of 1.5%.
The temperature and humidity meter is used to monitor the temperature and humidity in the wind tunnel in real-time, ensuring stable temperature and humidity conditions to avoid any interference with the experimental results.
The experimental particles selected are spherical silica dioxide, with a density ranging from 2.319 to 2.653 g/cm3, which is similar to the density of wind-blown sand. The particles are chemically stable, and their particle size range is selected to be between 10 and 100 microns, with a uniform distribution of particle sizes [27]. The particle shapes under the microscope are shown in Figure 6. The experimental particles are classified by particle size, and after mixing the particles of different sizes, they are evenly grouped. The groups are then weighed using an electronic balance to ensure equal mass distribution across the groups.
The experimental particles are introduced into the wind tunnel duct system through the sand injection device, with the particle addition rate controlled by adjusting the rotational speed of the screw. The airflow rate is controlled by a variable frequency fan and a flow monitor. After passing through the medium-efficiency filter, the experimental particles are directed into the axial flow cyclone separator. The particle concentration and pressure drop before and after the cyclone are measured as key parameters, using electrostatic dust detectors and differential pressure gauges installed at the inlet and outlet of the cyclone to do so. Most of the separated particles are collected by the particle collection device, while a small portion remains inside the axial flow cyclone separator. The unseparated particles are directed through another medium-efficiency filter installed at the end of the wind tunnel duct to prevent environmental contamination.

2.3.2. Wind Tunnel Experiment

To obtain the accurate operational performance of the axial flow cyclone separator, a practical experimental method must be designed to measure the two main parameters: pressure drop and wind–sand separation efficiency. The variable in the experiment is the particle concentration at the inlet of the cyclone separator, which is tested at six different levels: 60 mg/m3, 70 mg/m3, 80 mg/m3, 90 mg/m3, 100 mg/m3, and 110 mg/m3. The following experimental steps have been established, and strict adherence to these steps will be ensured during the actual implementation.
(1)
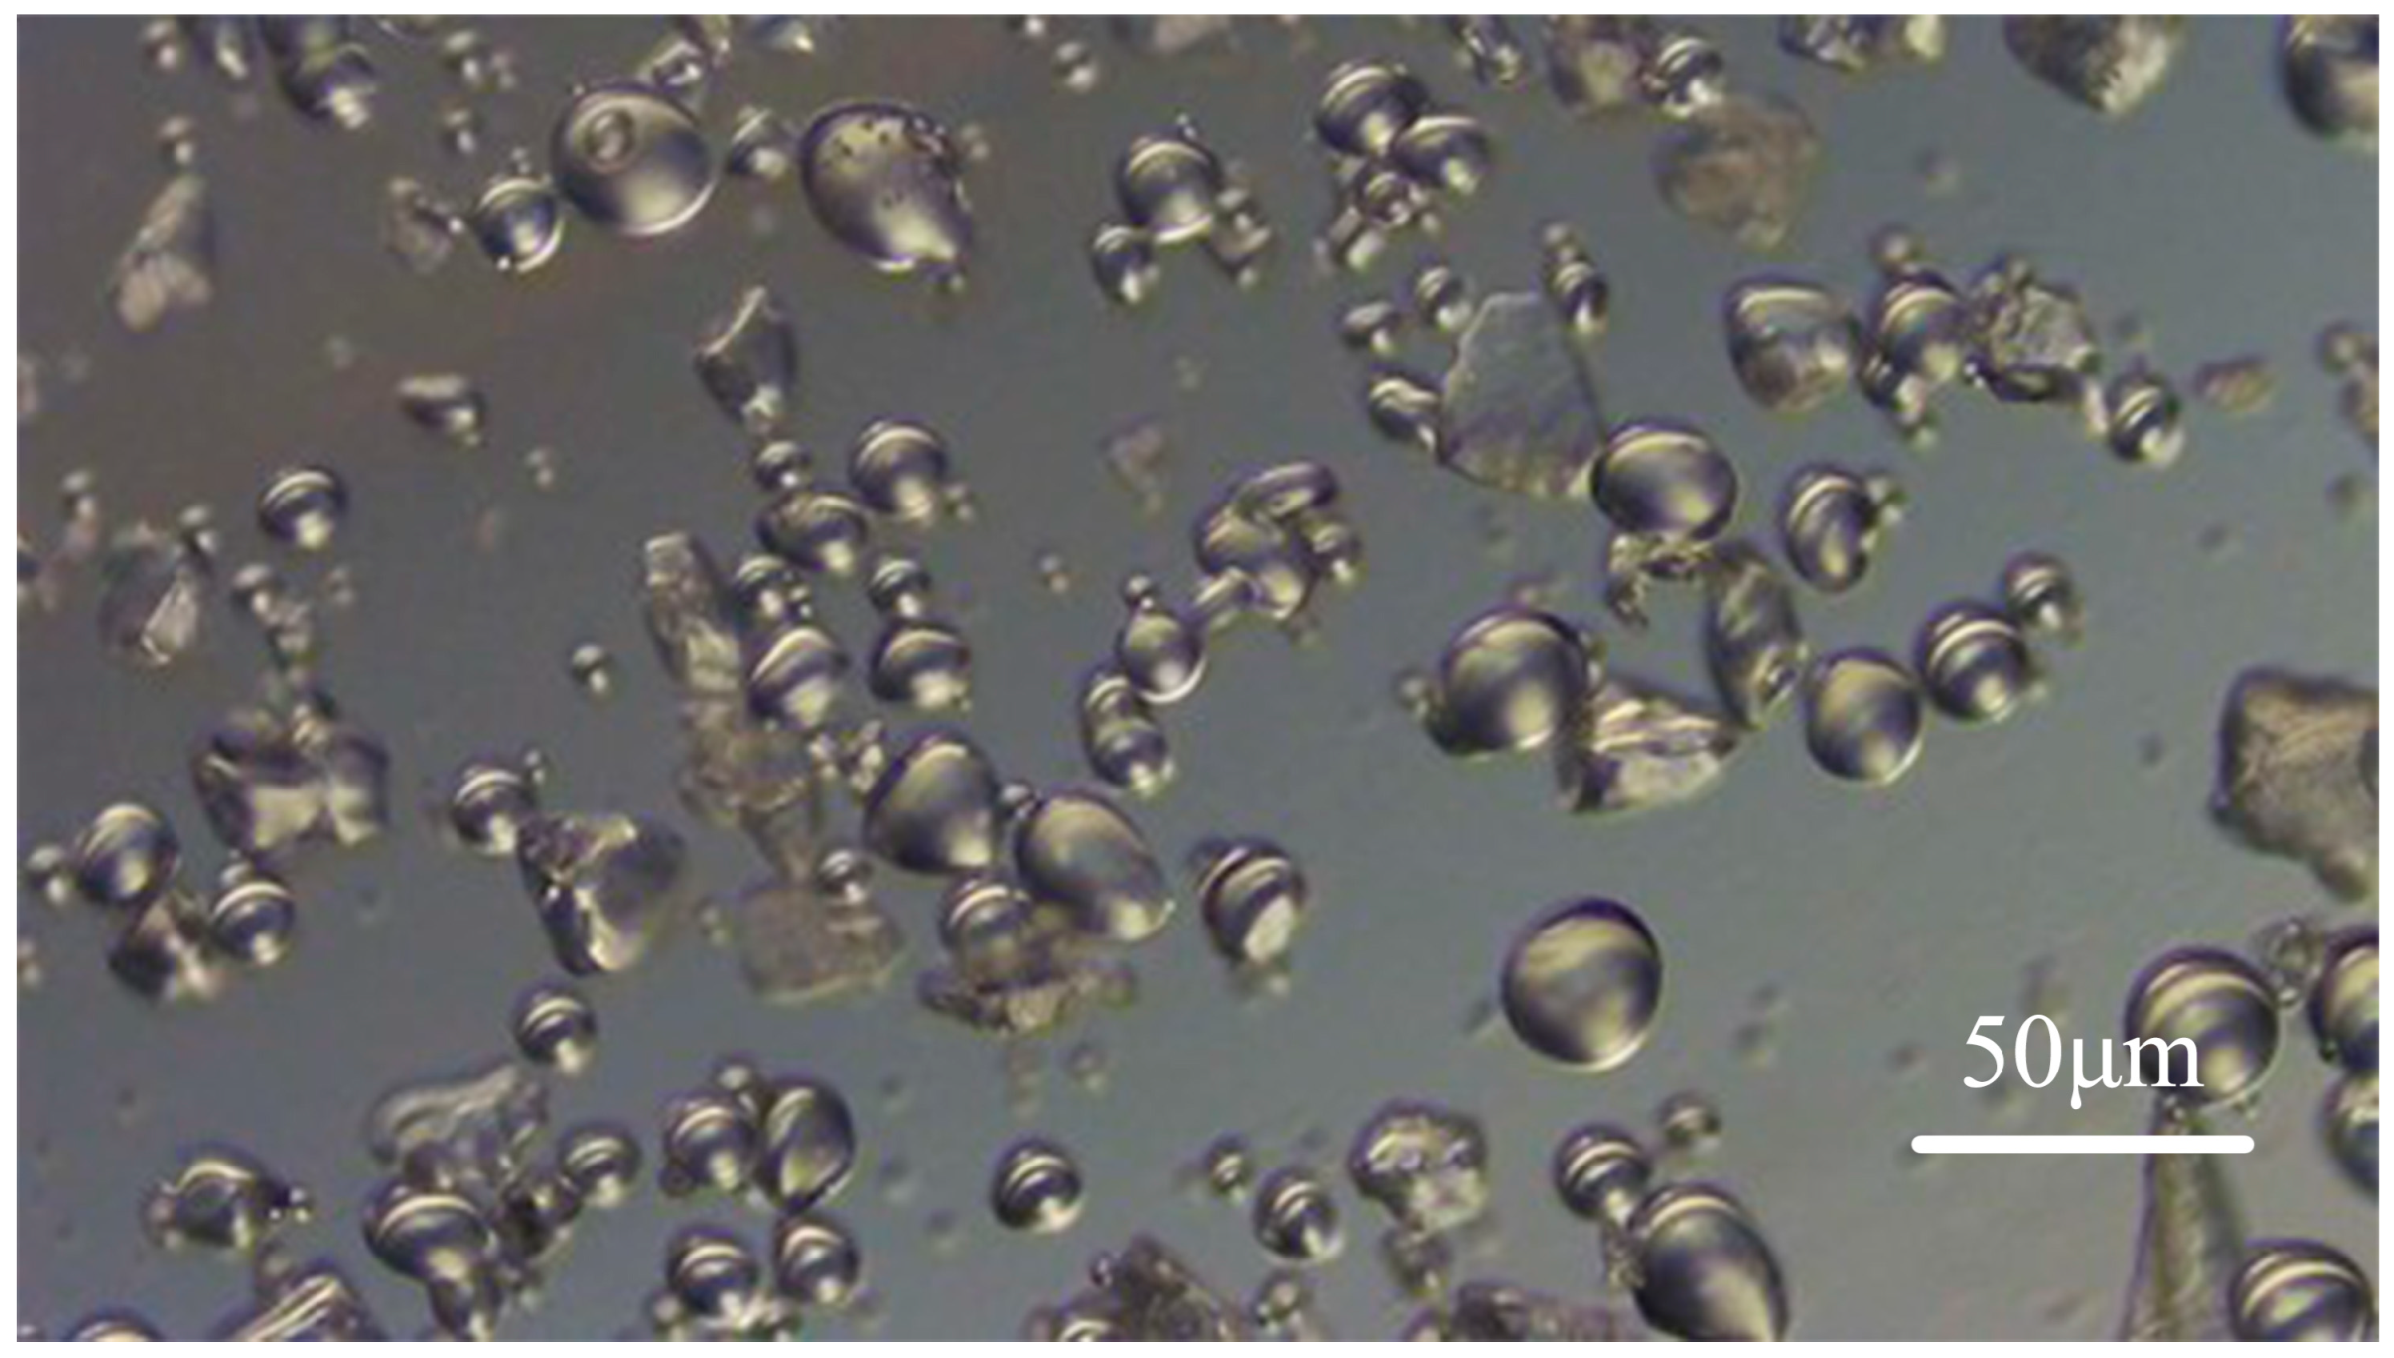
The experimental particles are placed in a drying oven and heated to 200 °C for 30 min. Afterward, they are allowed to cool naturally to room temperature before being removed. The sand particles of different sizes are mixed evenly, divided into groups, and the initial mass of the particles is weighed using an electronic balance. The particles are then divided into several portions of equal mass.
(2)
The experimental setup on the wind tunnel test platform is adjusted to the appropriate position. The environmental atmospheric pressure, temperature, and humidity at this time are recorded, and the flow monitor, differential pressure gauge, and electrostatic dust detector are put to zero.
(3)
The fans power supply is turned on and the frequency of the variable frequency fan is adjusted to set the airflow rate at the inlet of the axial flow cyclone separator to 8000 m3/h.
(4)
Once the fan has reached stable operation, the differential pressure gauge is used to measure the pressure drop between the inlet and outlet of the axial flow cyclone separator and the values are recorded.
(5)
The prepared experimental particles are added into the screw feeding device. The sand injection unit is started and the screw speed adjusted to different preset values to control the particle addition rate, thereby adjusting the inlet particle concentration of the cyclone separator.
(6)
During the sand injection process, a stable airflow is maintained. Once the particles have been fully added to the experimental system, the sand injection unit is stopped, and the fan is allowed to run for 1 min before stopping. Throughout the process from the start of sand injection to the stopping of the fan, all data are recorded in real-time using an electrostatic dust detector.
(7)
The recorded data are saved for subsequent analysis.
(8)
Steps 2–7 were repeat three times to obtain four sets of experimental data under the same operating conditions.
(9)
The fan, sand injection device, and other experimental equipment were turned off to conclude the experiment.

3. Numerical Simulation Results and Analysis

3.1. Parameter Study Scheme

In this manuscript, a total of twenty different parameter configurations for the cyclone separator were designed, as shown in Table 1. We have provided a detailed explanation of the orthogonal experimental method in our study. Orthogonal experimental design is a statistical approach that systematically varies experimental parameters to analyze the effects of multiple factors on system performance with a minimal number of trials [28]. This method is particularly well-suited for cyclone separator structural optimization as it allows for a balanced and factorial evaluation of key design variables, such as blade count and deflection angles, ensuring an efficient and comprehensive analysis [9]. The structural parameters were optimized from three aspects: the number of guide vanes, the angle of the straight segment of the inner contour line of the guide vanes, and the angle of the arc segment of the guide vanes. The number of guide vanes was set into four groups of 6, 8, 10, and 12 vanes. The angle of the arc segment of the guide vanes (A1) was varied at five values of 15°, 20°, 25°, 30°, and 35°. The angle of the straight segment of the guide vanes (A2) was varied at five values of 50°, 55°, 60°, 65°, and 70°. To optimize the separation device, it is crucial to minimize the pressure drop while maintaining a given separation efficiency. In this study, the target separation efficiency was set at no less than 90%. Therefore, the optimization process focused on achieving the lowest possible pressure drop while ensuring that the separation efficiency remained above this threshold.
The separation efficiency (η) of particles in a cyclone separator is typically defined as the ratio of the mass of particles captured by the separator to the total mass of particles entering the system. It can be expressed as follows:
η = n m c a p t u r e d n i n l e t × 100 %
where η is the separation efficiency (%), n m c a p t u r e d is the number of particles captured by the separator, and n i n l e t is the total number of particles entering the separator.

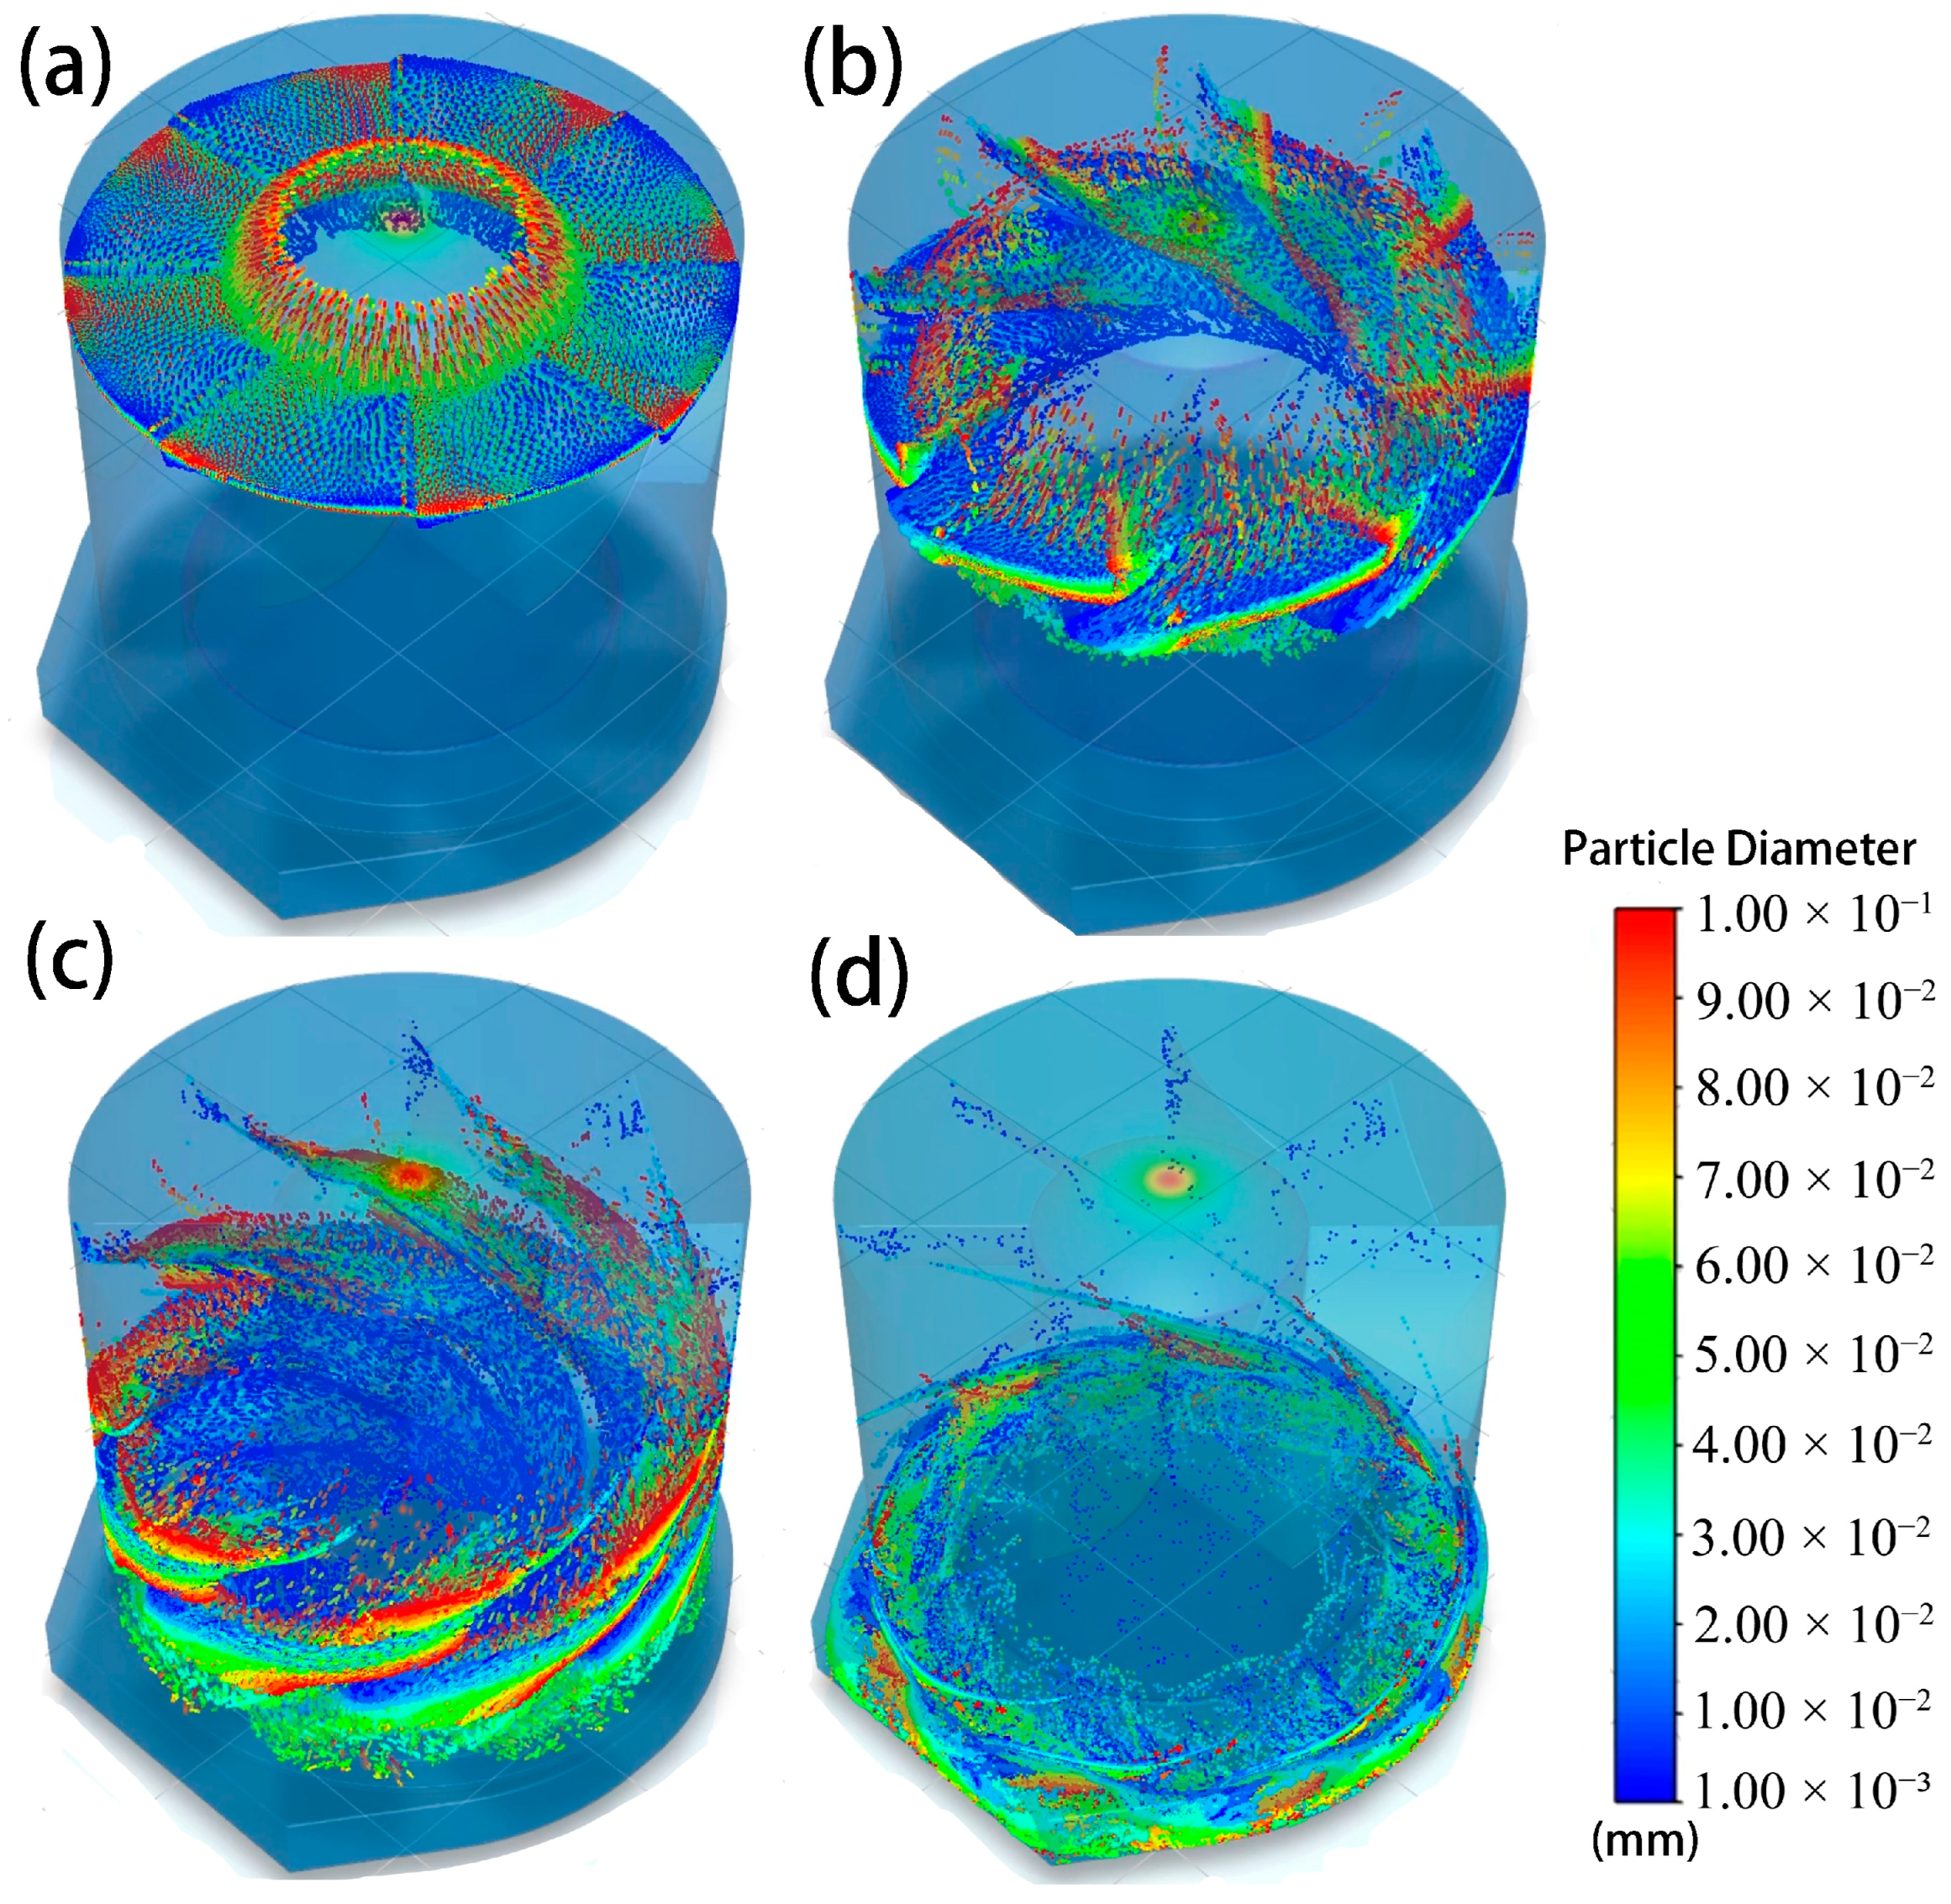
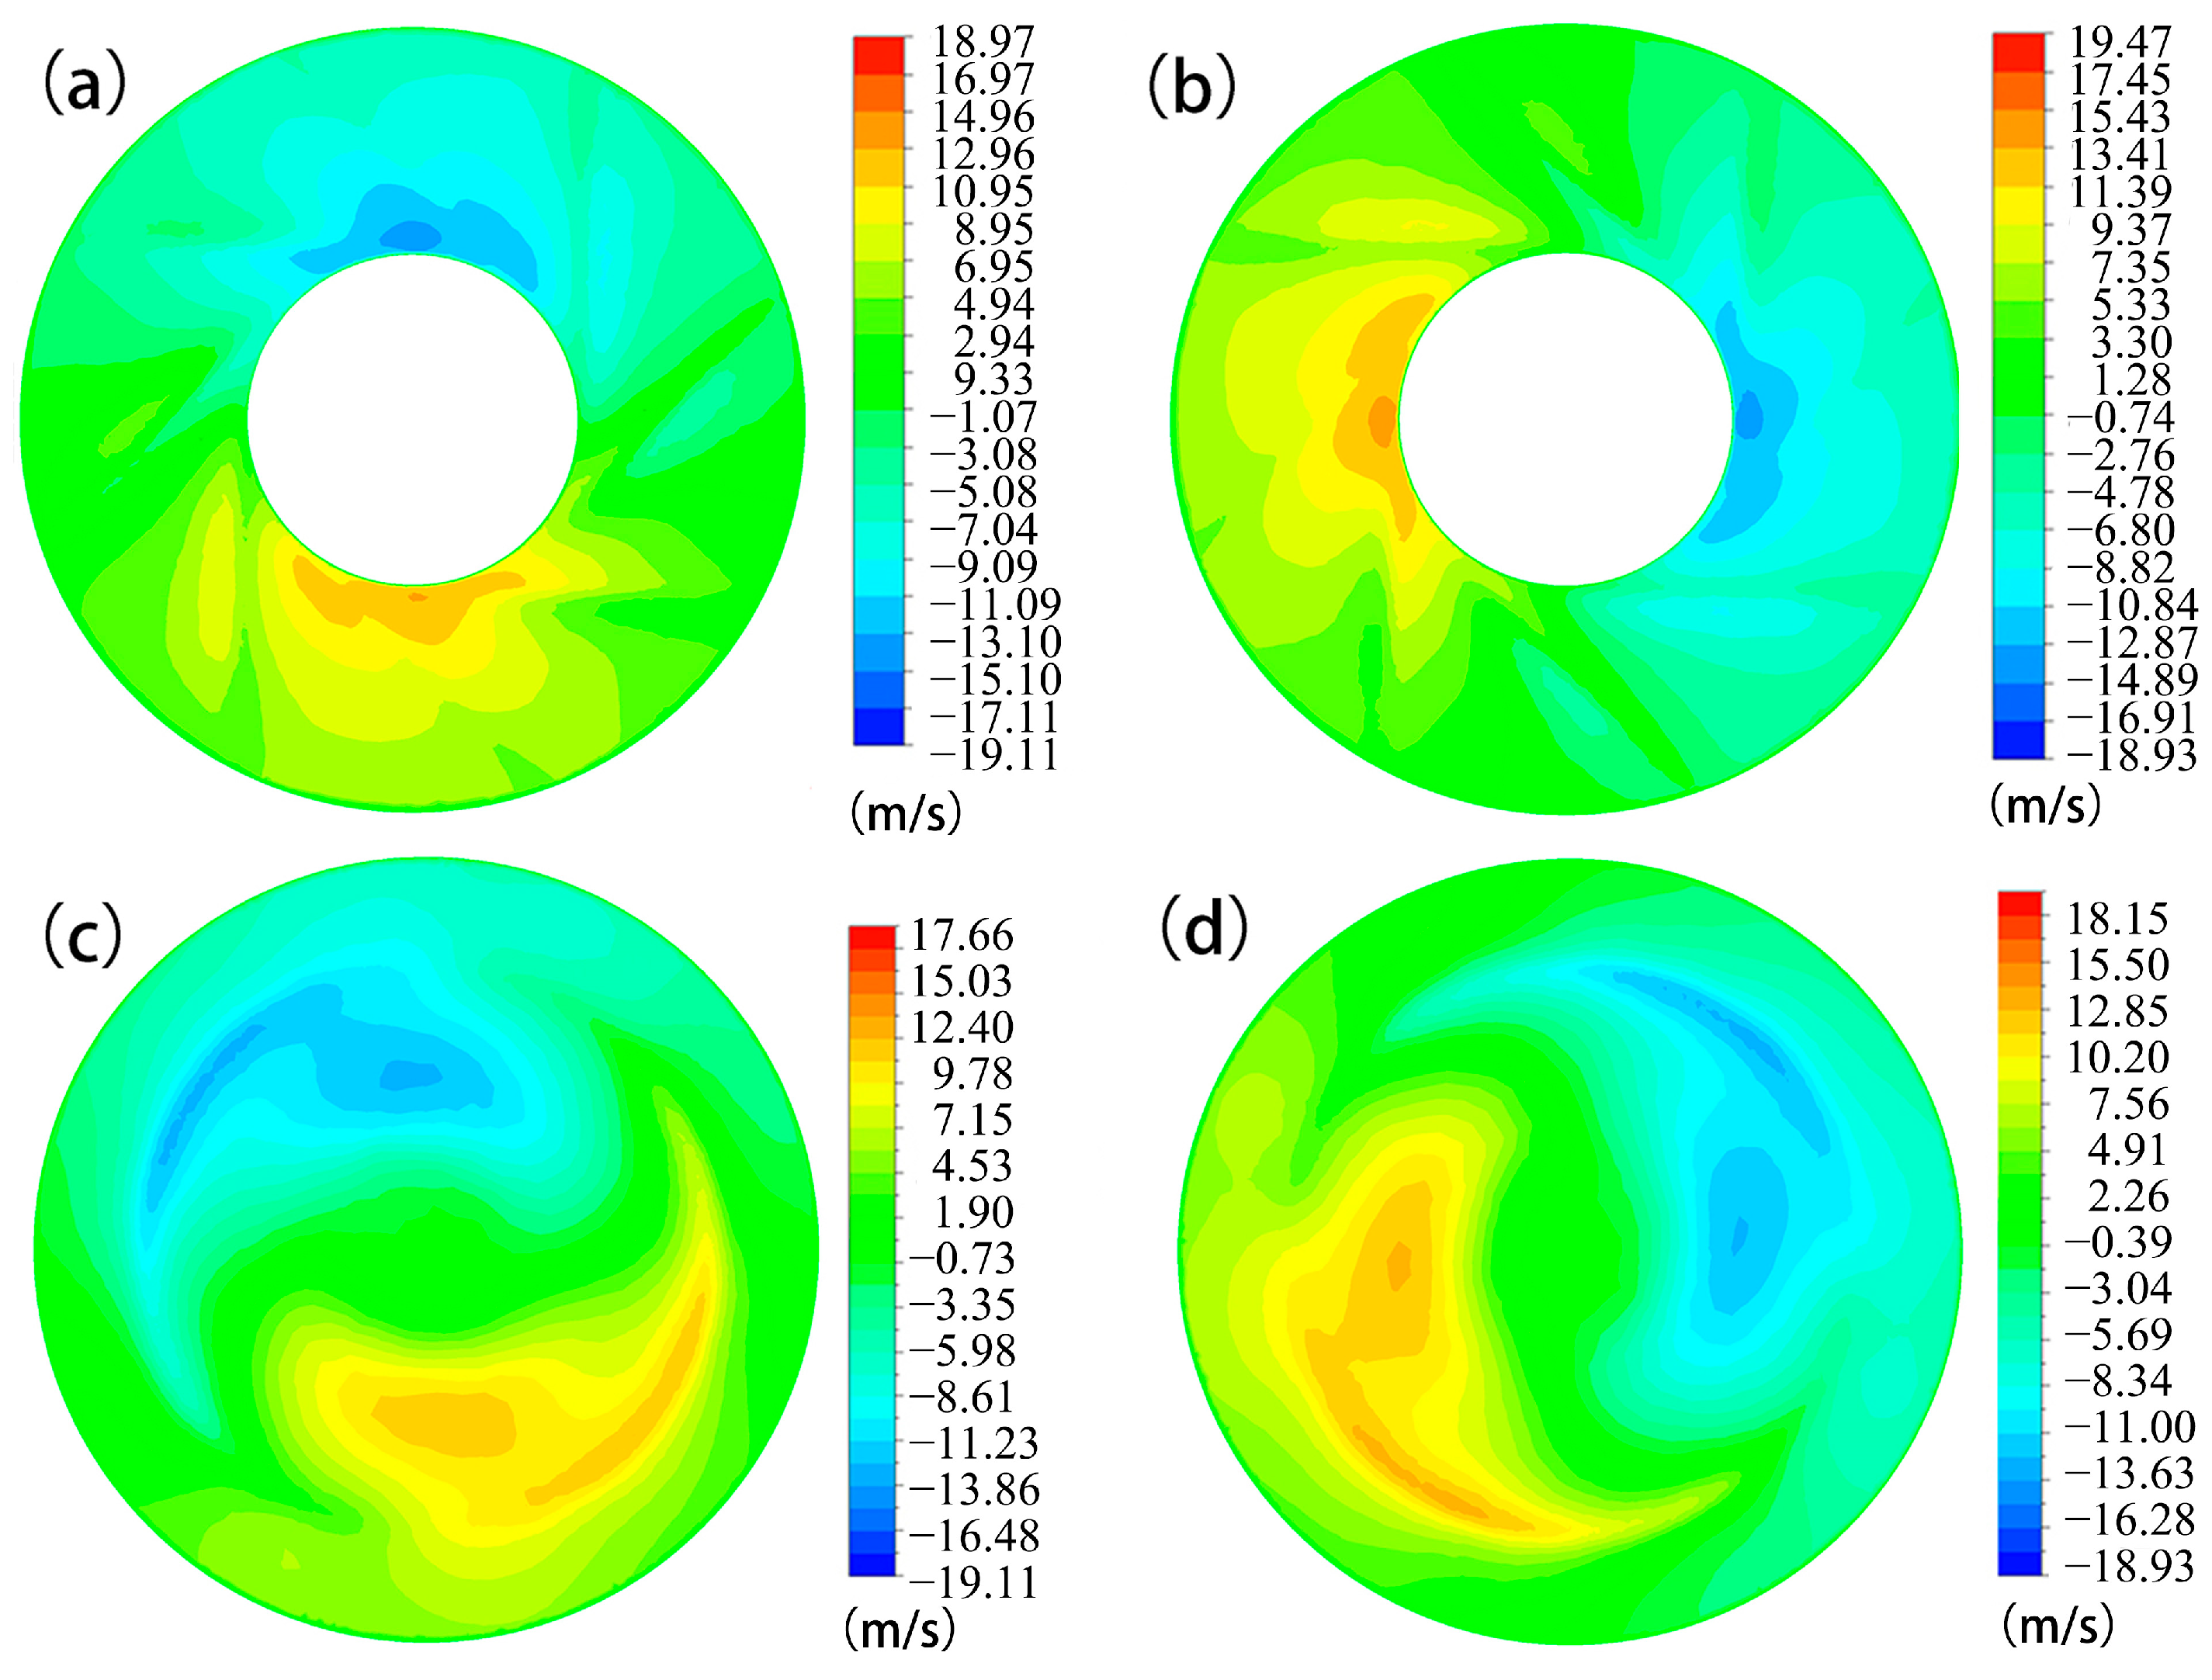
3.2. Internal Flow Field Analysis

The internal flow field of a uniflow cyclone dust collector is highly complex, making it difficult to obtain a reasonable and accurate explanation of the effects of structural parameters on device performance solely through theoretical analysis. Since key performance indicators, such as pressure loss and separation efficiency, are directly determined by the internal flow field, investigating its characteristics is crucial for understanding how variations in structural parameters influence performance. This, in turn, provides essential insights for optimizing the structural design of the device.
As shown in Figure 7, the particle trajectory distribution inside the axial flow cyclone separator is illustrated, with particle sizes color-coded. Figure 7a–d correspond to particle motion trajectories at t = 0.01 s, t = 0.05 s, t = 0.1 s, and t = 0.2 s, respectively.
At t = 0.01 s, particles have just entered the cyclone separator and are mainly concentrated near the guide vanes. At this stage, their motion is primarily influenced by the initial airflow, and a stable swirling flow has yet to form. By t = 0.05 s, the particle trajectories gradually elongate, forming a spiral flow pattern, indicating the establishment of the swirling motion within the cyclone separator.
Under the influence of tangential velocity, particles move along the cyclone wall, with larger particles migrating outward, while smaller particles remain dispersed within the flow field. At t = 0.1 s, particle motion stabilizes, and the swirling structure is fully developed. Most of the larger particles settle downward along the wall, exhibiting a distinct stratification effect where larger particles concentrate near the wall while smaller particles remain suspended in the central region.
At t = 0.2 s, most large particles have been separated and settled into the bottom collection region, while small particles continue to move with the airflow, albeit at a significantly lower concentration.
According to the numerical simulation results, the separation of large particles is largely completed between t = 0.1 s and t = 0.2 s, and further increasing the residence time does not significantly improve separation efficiency. However, a small fraction of fine particles still experience re-entrainment, primarily concentrated in the central region.
Based on the structural characteristics of the axial flow cyclone separator, the internal flow field can be divided into four regions, the inlet region, the mid-section of the guide blades, the trailing edge of the guide blades, and the outlet region. The following analysis examines the flow field characteristics in each of these regions.
Figure 8 presents the velocity vector distribution at different cross-sections of the cyclone separator, specifically at (a) the inlet region, (b) the mid-section of the guide vanes, (c) the trailing edge of the guide vanes, and (d) the outlet region. At the inlet region (Figure 8a), the flow remains relatively uniform as the gas enters the cyclone separator. The velocity vectors indicate an initial acceleration towards the guide vanes, where flow redistribution begins. The presence of guide vanes significantly alters the flow structure, promoting a more controlled entry into the separation chamber. In the mid-section of the guide vanes (Figure 8b), the flow begins to develop a strong swirling motion. The interaction between the guide vanes and the incoming gas induces tangential velocity components, which are crucial for particle separation. However, improper vane angles may lead to excessive turbulence, increasing pressure loss while reducing the effectiveness of centrifugal separation. At the trailing edge of the guide vanes (Figure 8c), the swirling motion becomes more prominent. The formation of secondary flow structures, such as recirculation zones, is observed. These recirculation regions can trap particles, leading to re-entrainment and potentially reducing the separation efficiency. Additionally, strong recirculation can contribute to energy dissipation, increasing the overall pressure drop. Finally, at the outlet region (Figure 8d), the flow achieves a more stable swirling pattern, with the high-velocity core concentrated near the center. The presence of residual vortices suggests that a portion of the separated particles may be re-entrained into the gas stream, negatively affecting the separation efficiency. Furthermore, excessive vortex intensity near the outlet could result in additional pressure losses, further impacting the overall system performance.
Figure 9 presents the tangential velocity contours at different cross-sections of the cyclone separator. Figure 9a,b correspond to the mid-section of the guide vanes, showing the tangential velocity distribution in two perpendicular directions, while Figure 9c,d represent the trailing edge of the guide vanes, also depicting the tangential velocity distribution in two different directions. In the mid-section of the guide vanes (Figure 9a,b), the tangential velocity distribution reveals the initial formation of the swirling flow. In the trailing edge region of the guide vanes (Figure 9c,d), the rotational flow gradually stabilizes. A stable swirling motion enhances centrifugal force, thereby improving particle separation efficiency. However, localized negative velocity regions are still observed in Figure 9c,d, indicating the presence of certain recirculation zones, which may lead to particle re-entrainment and additional pressure losses.

3.3. Numerical Simulation Results

As shown in Table 3, when the number of guide vanes is selected as eight, the angle of the arc segment (A1) is set to 25°, and the angle of the straight segment (A2) is set to 60°, the filtration efficiency for wind–sand particles in the range of 10–100 μm is optimal. When the number of vanes and the angles are further increased, there is no significant improvement in the filtration efficiency, while the pressure loss increases substantially. Table 4 presents the particle-size classification separation efficiency under the given structural parameters. It can be observed that the model exhibits high separation efficiency for particles larger than 30 μm, with an average overall separation efficiency of 91.68%.
The effects of the number of fan blades and the variation in A1–A2 angles on the pressure drop and separation efficiency are shown in Figure 10 and Figure 11. As observed, increasing the number of fan blades enhances the swirling motion within the cyclone separator, thereby improving the centrifugal force-driven separation efficiency. However, beyond eight blades, the increase in turbulence intensity and viscous dissipation outweighs the benefits of a stronger swirl, leading to a diminished improvement in separation efficiency while significantly increasing pressure drop. This trend indicates that excessive blade count results in higher energy losses without proportional gains in efficiency.
Similarly, as the blade deflection angles (A1–A2) increase, the induced swirling flow strengthens, leading to an initial rise in separation efficiency. However, when the A1–A2 angle exceeds 25–60°, flow separation and excessive turbulence occur, causing a steep increase in the pressure drop while the separation efficiency remains nearly unchanged. This suggests that an optimal balance exists between swirl enhancement and flow resistance, beyond which further increasing the blade angles is counterproductive.
After a comprehensive evaluation of these effects, a 1:1 physical model with eight blades and an A1–A2 angle of 25–60° was selected for wind tunnel testing, as this configuration provides an optimal trade-off between separation performance and operational resistance.

4. Experimental Results

This manuscript utilizes separation efficiency and pressure drop as two key indicators to analyze the performance of the axial flow cyclone separator under varying dust concentrations. The performance of a 1:1 scale axial flow cyclone separator in high-wind-blown sand environments with different sand dust concentrations is tested, and the experimental results are presented in the table below.
The data presented in Table 5 demonstrate the repeatability and reliability of the experimental results. The average separation efficiency for wind–sand particles in the 10–100 μm range obtained from physical tests was 87.30%, which is slightly lower than the 91.68% calculated from the simulations. This discrepancy can be attributed to several factors, including wall roughness effects and measurement uncertainties.
The CFDs model assumes smooth internal surfaces, while the actual cyclone separator has surface roughness, which can alter near-wall turbulence characteristics, slightly reducing separation efficiency in experiments. Experimental efficiency measurements are influenced by sensor precision, calibration errors, and environmental variations, contributing to slight deviations from numerical predictions.
Despite these differences, the experimental and numerical results show strong agreement, with the physical tests yielding an average pressure drop of 191.1 Pa, which closely matches the 189.7 Pa obtained from simulations.
Figure 12 presents the influence of particle concentration on separation efficiency. As the particle concentration increases, the frequency of particle collisions and turbulence intensity within the separator rises, disrupting the flow field and diminishing separation performance. This trend is evident from the gradual decline in efficiency, particularly when the particle concentration exceeds 90 mg/m3. Nevertheless, even under elevated dust loading conditions, the separation efficiency remains consistently above 80%, underscoring the robustness and reliability of the proposed cyclone separator design. The presence of error bars suggests minor experimental variations, potentially due to fluctuations in flow dynamics and particle interactions.
Overall, these results highlight the effectiveness of the separator in maintaining high efficiency despite increasing particle concentrations, demonstrating its suitability for high-wind–sand environments where dust loading is a critical concern.

5. Conclusions

This study presents the design and optimization of an axial flow cyclone separator tailored for long-term, maintenance-free operation in environments affected by wind and sand. The developed separator effectively filters dust particles, minimizes operational costs associated with filter clogging, and reduces the frequency of component replacements. The key findings and their practical implications are summarized as follows:
(1)
Optimization of swirling blade parameters: Through orthogonal experimental design, this study optimized the structure of the swirling blades, achieving a pressure drop of 189.7 Pa and a separation efficiency of 91.68% under a zero-extraction ratio. These results demonstrate the separator’s ability to efficiently remove dust particles while minimizing energy loss.
(2)
Impact of blade number and angles on performance: The findings highlight that both the deflection angle (A1–A2) and the number of blades in the hybrid fan blade design significantly influence the pressure drop and separation efficiency. Specifically, increasing the number of blades from six to eight results in a notable improvement in the separation efficiency, while further increases provide only marginal benefits. Additionally, an A1–A2 deflection angle between 25° and 60° enhances the separation efficiency; however, further increases lead to a significant rise in the pressure drop with little to no efficiency improvement.
(3)
Experimental validation of the physical model: A 1:1 scale physical model of the optimized axial flow cyclone separator was tested, achieving an average separation efficiency of 87.30% for 10–100 μm particles with a pressure drop of 191.1 Pa. These experimental results confirm the practical feasibility of the proposed design under real-world conditions.
(4)
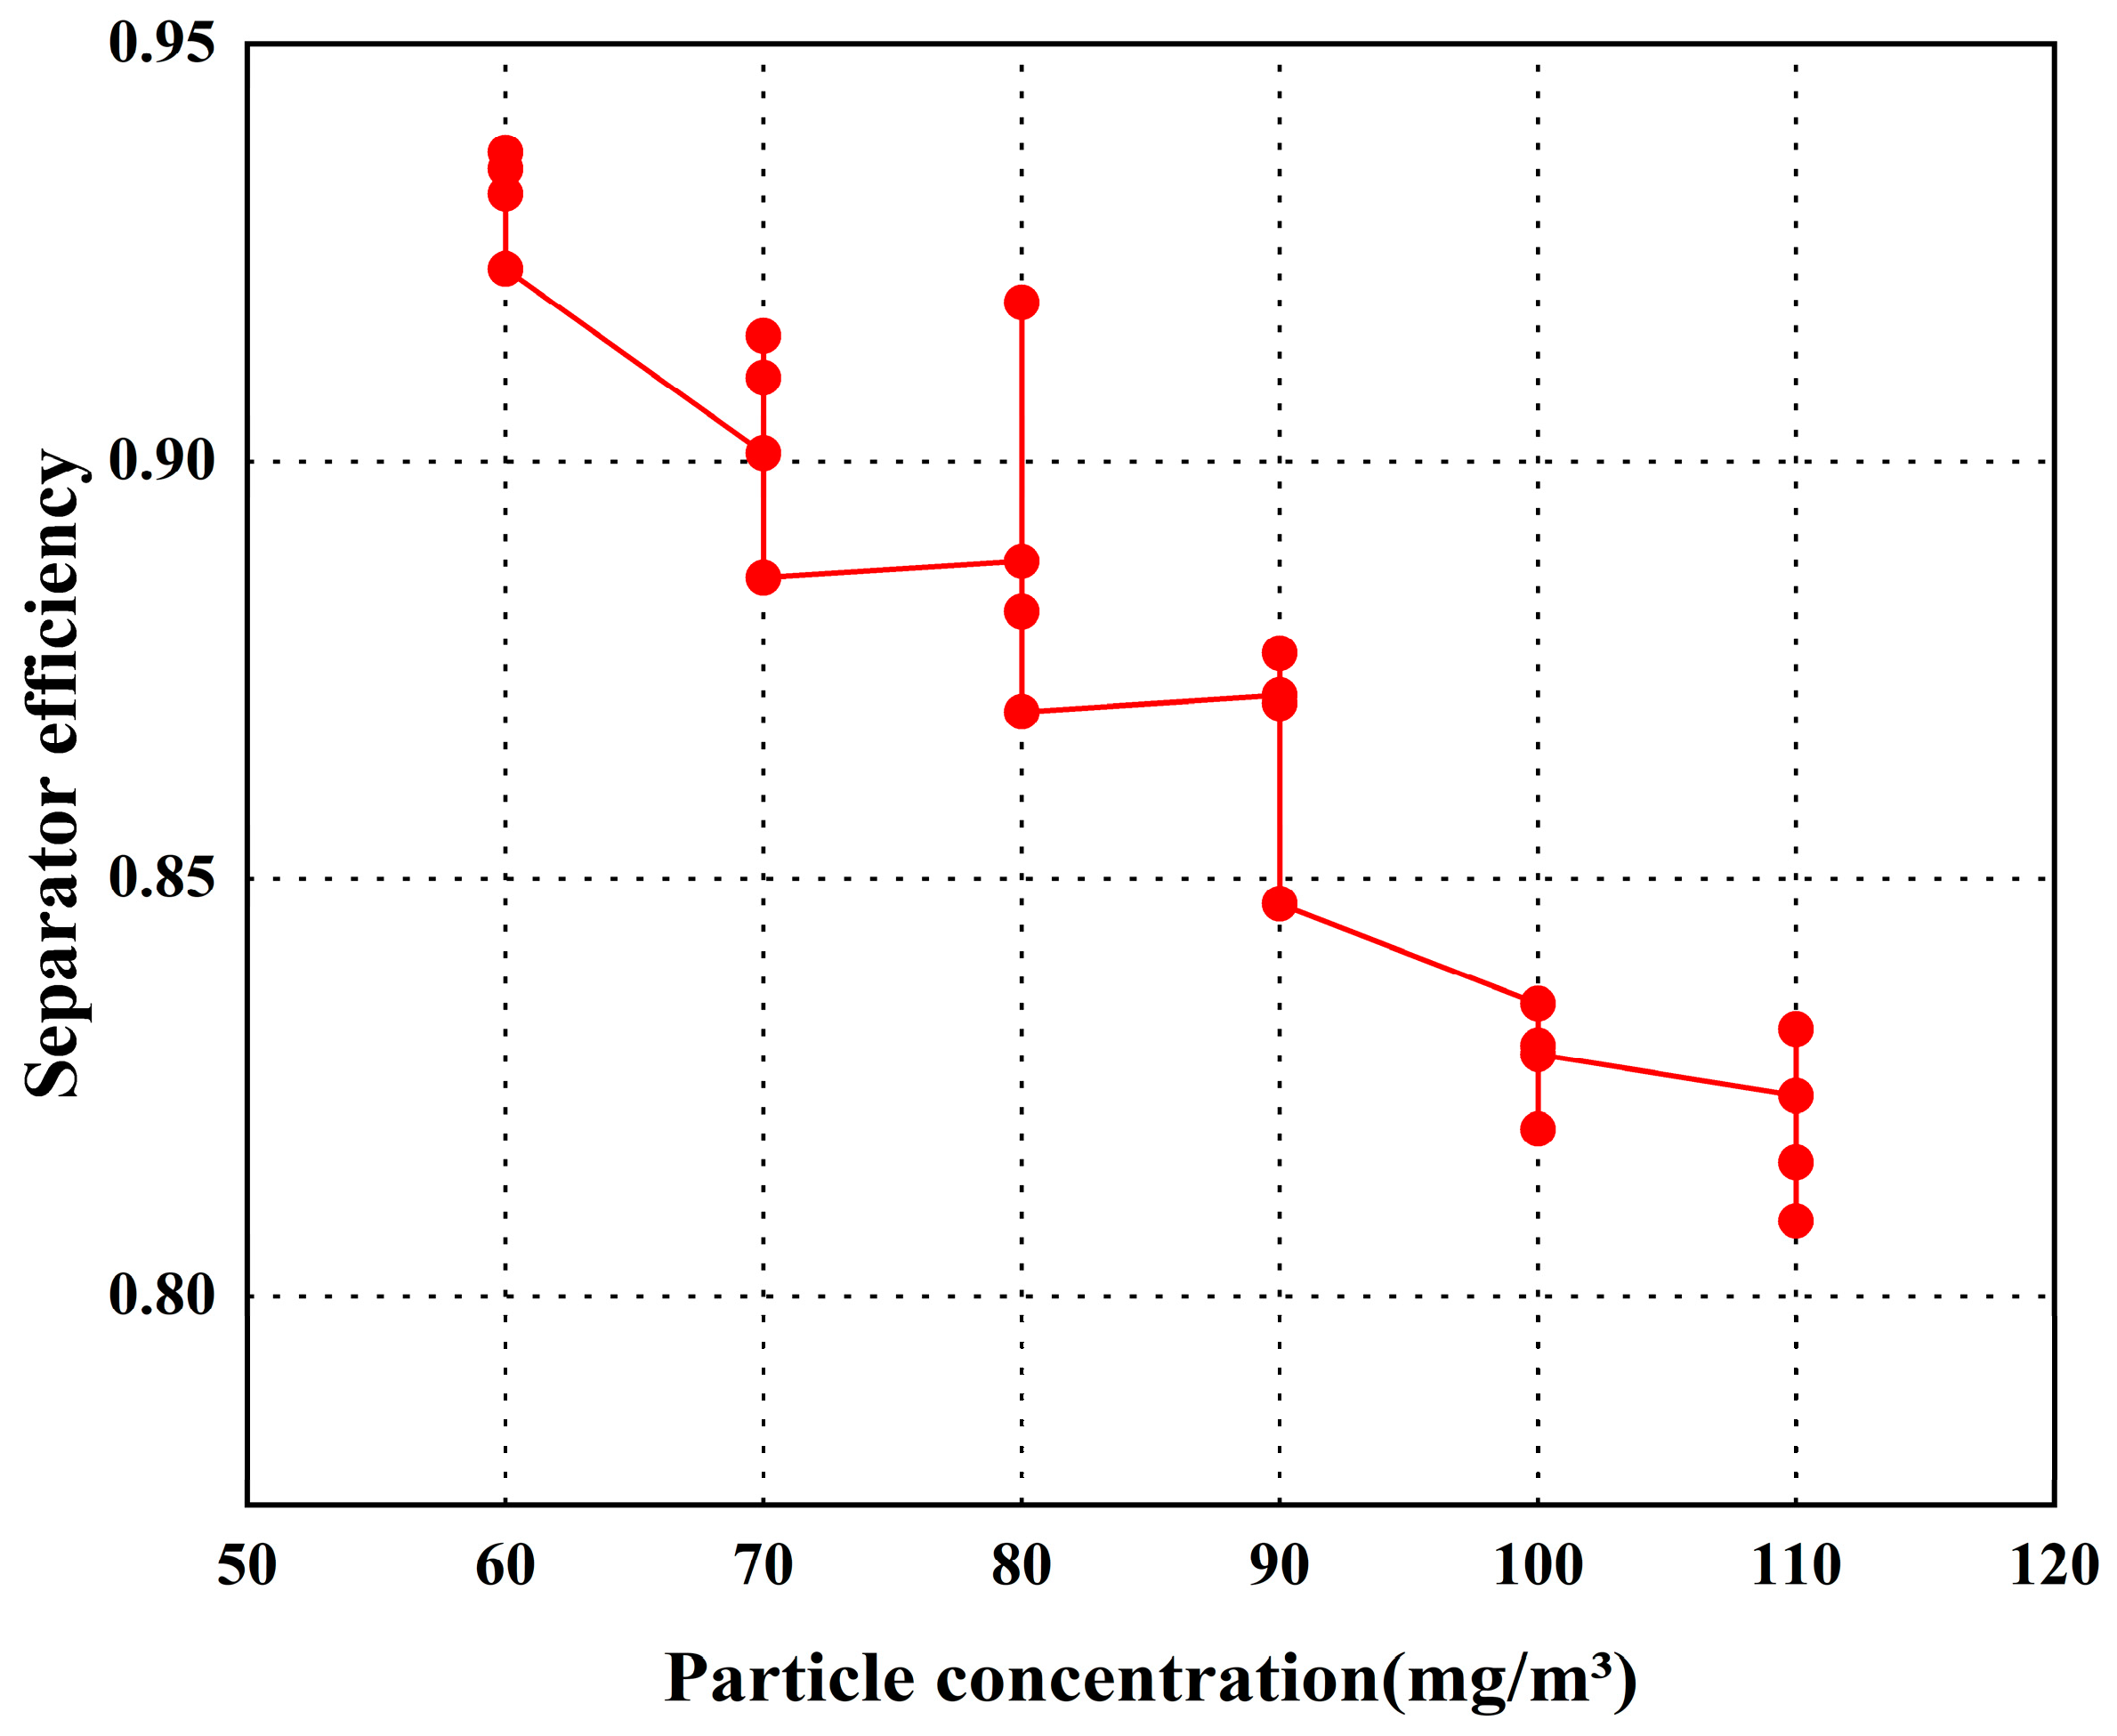
Effects of dust concentration on performance: Experimental results indicate that as the sand and dust concentration increases, the separation efficiency slightly decreases, while the pressure drop remains relatively stable. This finding is essential for understanding the separator’s performance under variable environmental conditions, particularly in areas with fluctuating dust concentrations.
The proposed axial flow cyclone separator offers significant advantages in wind–sand-prone regions, particularly in protecting critical infrastructure such as electrical buildings and nuclear power plants located in northern China’s coastal areas. These regions suffer from severe wind–sand and salt mist, causing substantial economic losses due to equipment damage and operational disruptions. By providing an effective solution for sand particle separation, this study contributes to wind–sand mitigation engineering and supports the long-term sustainability of critical infrastructure.
Additionally, the separator’s design aligns with sustainable development goals by reducing operational costs associated with frequent maintenance and replacements, leading to more energy-efficient systems. Its robust and low-maintenance features enable continuous operation with minimal environmental impact, promoting green technology in industrial applications. While this study has demonstrated the effectiveness of the proposed separator, further research is needed to enhance its long-term performance and adaptability to extreme conditions. Future studies could focus on the following:
(1)
Advanced blade geometry optimization: exploring adaptive- or variable-angle blade designs to further balance the separation efficiency and the pressure drop under different airflow conditions.
(2)
Long-term performance evaluation: conducting field tests in real-world environments to assess the durability, efficiency, and clogging resistance of the separator over extended operational periods.

Author Contributions

Conceptualization, Z.W.; methodology, Z.W.; software, Z.W.; validation, Z.W.; formal analysis, Z.W.; investigation, Z.W.; resources, Z.W.; data curation, Z.W. and M.L.; writing—original draft preparation, Z.W.; writing—review and editing, Z.W. and M.L.; visualization, Z.W.; supervision, A.J.; project administration, A.J. All authors have read and agreed to the published version of the manuscript.

Funding

This work was supported by the National Natural Sciences Foundation of China (Grant/Award Number: 12362033).

Data Availability Statement

The data presented in this study are available on request from the corresponding author.

Acknowledgments

The authors would like to thank the anonymous reviewers and the editor for providing valuable comments that helped improve the quality of this paper.

Conflicts of Interest

The authors declare no conflicts of interest.

References

  1. Dziubak, T.; Boruta, G. Experimental and theoretical research on pressure drop changes in a two-stage air filter used in tracked vehicle engine. Separations 2021, 8, 3577. [Google Scholar] [CrossRef]
  2. Han, S.; Kim, J.; Ko, S.H. Advances in air filtration technologies: Structure-based and interaction-based approaches. Mater. Today Adv. 2021, 9, 100134. [Google Scholar] [CrossRef]
  3. Dong, J.; Guanghui, C.; Pan, Z.; Li, J. Separation performance enhancement of gas-solid cyclone separators by flow control and coupling physical fields. Sep. Purif. Rev. 2025, 1–16. [Google Scholar] [CrossRef]
  4. Yan, Z.; Zhou, J.; Liu, Y.; Lu, C. Performance of an axial inlet cyclone separator and the programming design of guide vanes. Chem. Eng. Process.—Process Intensif. 2022, 179, 109077. [Google Scholar] [CrossRef]
  5. Wang, C.; Ma, Y.; Sui, W. The secondary flows in a cyclone separator: A review. Processes 2023, 11, 2935. [Google Scholar] [CrossRef]
  6. Deng, Y.; Yu, B.; Sun, D. Multi-objective optimization of guide vanes for axial flow cyclone using cfd, svm, and nsga ii algorithm. Powder Technol. 2020, 373, 637–646. [Google Scholar] [CrossRef]
  7. Mao, Y.; Chertovskih, R.; Cai, L. Numerical study of the gas–solid separation performance of axial flow cyclone separators. Inventions 2024, 9, 34. [Google Scholar] [CrossRef]
  8. Dziubak, T.; Bąkała, L. Computational and experimental analysis of axial flow cyclone used for intake air filtration in internal combustion engines. Energies 2021, 14, 2285. [Google Scholar] [CrossRef]
  9. Liu, W.; Li, L.; Cao, H.; Dou, J.; Yang, X.a. Structural optimization design and adaptability analysis of a novel axial-flow cyclone. Ind. Eng. Chem. Res. 2024, 63, 17324–17338. [Google Scholar] [CrossRef]
  10. Patel, P.; Aggarwal, S.G. Theoretical and experimental evaluation of a compact aerosol wind-tunnel and its application for performance investigation of particulate matter instruments. Aerosol Air Qual. Res. 2021, 21, 210006. [Google Scholar] [CrossRef]
  11. Huang, B.; Li, Z.; Zhang, Z.; Zhao, Z.; Gong, B. Wind tunnel test on windblown sand two-phase flow characteristics in arid desert regions. Appl. Sci. 2021, 11, 11349. [Google Scholar] [CrossRef]
  12. Qiu, S.; Zhong, L.; Wang, G.; Fang, X.; Yang, Y.; Liu, Q. Effect of structural parameters on the performance of axial-flow inlet hydrocyclones for in situ desanding from natural gas hydrate mixed slurry. ACS Omega 2023, 8, 28531–28542. [Google Scholar] [CrossRef] [PubMed]
  13. Kou, J.; Jiang, Z.; Cong, Y. Separation characteristics of an axial hydrocyclone separator. Processes 2021, 9, 2288. [Google Scholar] [CrossRef]
  14. Babaoğlu, N.U.; Parvaz, F.; Foroozesh, J.; Hosseini, S.H.; Ahmadi, G.; Elsayed, K. Geometry optimization of axial cyclone for high performance and low acoustic noise. Powder Technol. 2023, 427, 118738. [Google Scholar] [CrossRef]
  15. Dziubak, S.; Małachowski, J.; Dziubak, T.; Tomaszewski, M. Numerical studies of an axial flow cyclone with ongoing removal of separated dust by suction from the settling tank. Chem. Eng. Res. Des. 2024, 208, 29–51. [Google Scholar] [CrossRef]
  16. Brunazzi, E.; Paglianti, A.; Talamelli, A. Simplified design of axial-flow cyclone mist eliminators. AIChE J. 2004, 49, 41–51. [Google Scholar] [CrossRef]
  17. Wang, Y.; Wang, L.; Duan, C.; Zheng, J.; Liu, Z.; Ma, G. Cfd simulation on wind turbine blades with leading edge erosion. J. Theor. Appl. Mech. 2021, 59, 579–593. [Google Scholar] [CrossRef]
  18. Corrêa, R.G.; Andrade, J.R.; de Souza, F.J. Improving separation prediction of cyclone separators with a hybrid urans-les turbulence model. Powders 2023, 2, 607–623. [Google Scholar] [CrossRef]
  19. Wang, S.; Li, H.; Wang, R.; Wang, X.; Tian, R.; Sun, Q. Effect of the inlet angle on the performance of a cyclone separator using cfd-dem. Adv. Powder Technol. 2019, 30, 227–239. [Google Scholar] [CrossRef]
  20. Feng, M.; Gui, C.; Zhou, Y.; Lei, Z. Numerical study on performance optimization and flow mechanism of a new cyclone separator. Green Chem. Eng. 2025, 6, 76–84. [Google Scholar] [CrossRef]
  21. Chen, S.-C.; Tsai, C.-J. An axial flow cyclone to remove nanoparticles at low pressure conditions. J. Nanopart. Res. 2006, 9, 71–83. [Google Scholar] [CrossRef]
  22. Chengming, S.; Pei, B.; Jiang, M.; Wang, B.; Xu, D.; Chen, Y. Numerical analysis of forces exerted on particles in cyclone separators. Powder Technol. 2016, 294, 437–448. [Google Scholar]
  23. Nakhaei, M.; Lu, B.; Tian, Y.; Wang, W.; Dam-Johansen, K.; Wu, H. Cfd modeling of gas–solid cyclone separators at ambient and elevated temperatures. Processes 2020, 8, 228. [Google Scholar] [CrossRef]
  24. Liu, S.Y.; Zhang, Y.; Wang, B.G. Cyclone separator three-dimensional turbulent flow-field simulation using the reynolds stress model. Trans. Beijing Inst. Technol. 2005, 25, 377–379+383. [Google Scholar]
  25. Kang, L.Q.; Guo, L.J. Simulation of windblown sand movement by discrete particle model. J. Eng. Thermophys. 2006, 27, 441–444. [Google Scholar]
  26. Mu, G.; He, J.X.; Lei, J.Q.; Pang, Y.J.; Xing, W.J.; Yang, F.X.; Liu, G.J.; Mao, D.; Yue, J. A discussion on the transitional zone from oasis to sandy desert: A case study at cele oasis. Arid Land Geogr. 2013, 36, 195–202. [Google Scholar]
  27. Dziubak, T. Experimental studies of dust suction irregularity from multi-cyclone dust collector of two-stage air filter. Energies 2021, 14, 3577. [Google Scholar] [CrossRef]
  28. Mao, Y.; Pu, W.; Zhang, H.; Zhang, Q.; Song, Z.; Chen, K.; Han, D. Orthogonal experimental design of an axial flow cyclone separator. Chem. Eng. Process.—Process Intensif. 2019, 144, 107645. [Google Scholar] [CrossRef]
Figure 1. Schematic diagram of the axial flow cyclone separator structure.
Sustainability 17 03355 g001
Figure 2. Schematic diagram of the guide blade structure in the air–sand separation zone.
Sustainability 17 03355 g002
Figure 3. Schematic diagram of the structure of the wind and sand collecting device.
Sustainability 17 03355 g003
Figure 4. Schematic of computational domain and mesh.
Sustainability 17 03355 g004
Figure 5. Schematic diagram of wind tunnel experimental platform: (1) variable frequency fan; (2) medium-efficiency filter; (3) sand injection equipment; (4) flow monitor; (5) differential pressure meter; (6) electrostatic dust detector; (7) axial flow cyclone separator; (8) sand collection box.
Sustainability 17 03355 g005aSustainability 17 03355 g005b
Figure 6. Microscopic view of spherical silica.
Sustainability 17 03355 g006
Figure 7. Particle trajectory distribution at different time intervals: (a) t = 0.01 s; (b) t = 0.05 s; (c) t = 0.1 s; (d) t = 0.2 s.
Sustainability 17 03355 g007
Figure 8. Velocity vector diagrams: (a) inlet region; (b) mid-section of the guide vanes; (c) trailing edge of the guide vanes; (d) outlet region.
Sustainability 17 03355 g008
Figure 9. Tangential velocity contour plots: (a,b) correspond to the mid-section of the guide vanes; (c,d) represent the trailing edge of the guide vanes.
Sustainability 17 03355 g009
Figure 10. Pressure drop under different numbers of blades and different A1–A2.
Sustainability 17 03355 g010
Figure 11. Separation efficiency under different numbers of blades and different A1–A2.
Sustainability 17 03355 g011
Figure 12. Separation efficiency under different particle concentrations.
Sustainability 17 03355 g012
Table 1. Sensitivity analysis results.
Number of BladesBlade Deflection AngleBlade ThicknessBlade LengthGuide Cylinder DiameterPressure DropSeparator Efficiency
650°2 mm250 mm200 mm128.3 Pa53.88%
850°2 mm250 mm200 mm178.6 Pa72.14%
1050°2 mm250 mm200 mm214.6 Pa84.35%
840°2 mm250 mm200 mm147.7 Pa64.91%
850°2 mm250 mm200 mm178.6 Pa72.14%
860°2 mm250 mm200 mm207.0 Pa86.22%
850°1 mm250 mm200 mm169.5 Pa68.43%
850°2 mm250 mm200 mm178.6 Pa72.14%
850°3 mm250 mm200 mm184.3 Pa77.27%
850°2 mm200 mm200 mm165.7 Pa67.27%
850°2 mm250 mm200 mm178.6 Pa72.14%
850°2 mm300 mm200 mm186.2 Pa74.44%
850°2 mm250 mm150 mm183.0 Pa75.38%
850°2 mm250 mm200 mm178.6 Pa72.14%
850°2 mm250 mm250 mm174.7 Pa68.39%
Table 2. Particle size distribution.
Particle DiameterParticle CountProportion
10 μm99839%
20 μm11,50410%
30 μm12,23711%
40 μm12,61811%
50 μm12,05210%
60 μm11,64311%
70 μm10,94911%
80 μm10,2369%
90 μm99039%
100 μm97299%
Table 3. Separator performance of different swirls.
NumberNumber of BladesA1A2Pressure DropSeparator Efficiency
1615°50°131.9 Pa42.34%
2620°55°147.3 Pa63.14%
3625°60°155.9 Pa70.88%
4630°65°179.5 Pa75.56%
5635°70°198.1 Pa84.63%
6815°50°142.0 Pa53.43%
7820°55°167.6 Pa72.13%
8825°60°189.7 Pa91.68%
9830°65°231.5 Pa91.08%
10835°70°277.8 Pa92.96%
111015°50°172.5 Pa50.18%
121020°55°196.3 Pa71.50%
131025°60°231.8 Pa79.28%
141030°65°253.2 Pa89.51%
151035°70°297.4 Pa92.13%
161215°50°193.8 Pa59.51%
171220°55°235.8 Pa81.36%
181225°60°251.9 Pa91.68%
191230°65°274.5 Pa92.14%
201235°70°317.6 Pa93.45%
Table 4. Fractional separation efficiency of the separator.
Particle DiameterInlet Particle CountOutlet Particle CountSeparation Efficiency
10 μm9983425657.37%
20 μm11,504246778.56%
30 μm12,237124789.81%
40 μm12,61863794.95%
50 μm12,05246896.12%
60 μm11,64310999.06%
70 μm10,9497399.33%
80 μm10,2363599.66%
90 μm99032799.73%
100 μm97294899.51%
Table 5. Experimental performance of cyclone separators.
NumberParticle ConcentrationPressure DropSeparator Efficiency
160 mg/m3194.1 Pa93.20%
260 mg/m3186.3 Pa93.50%
360 mg/m3191.1 Pa93.70%
460 mg/m3189.3 Pa92.30%
570 mg/m3184.6 Pa90.10%
670 mg/m3186.2 Pa91.50%
770 mg/m3196.6 Pa91.00%
870 mg/m3185.5 Pa88.60%
980 mg/m3187.8 Pa88.80%
1080 mg/m3193.1 Pa91.90%
1180 mg/m3196.2 Pa88.20%
1280 mg/m3184.1 Pa87.00%
1390 mg/m3187.6 Pa87.20%
1490 mg/m3194.4 Pa87.10%
1590 mg/m3186.6 Pa87.70%
1690 mg/m3195.5 Pa84.70%
17100 mg/m3187.7 Pa83.50%
18100 mg/m3195.3 Pa82.00%
19100 mg/m3194.2 Pa83.00%
20100 mg/m3193.2 Pa82.90%
21110 mg/m3196.0 Pa82.40%
22110 mg/m3195.1 Pa80.90%
23110 mg/m3192.8 Pa81.60%
24110 mg/m3193.4 Pa83.20%
Disclaimer/Publisher’s Note: The statements, opinions and data contained in all publications are solely those of the individual author(s) and contributor(s) and not of MDPI and/or the editor(s). MDPI and/or the editor(s) disclaim responsibility for any injury to people or property resulting from any ideas, methods, instructions or products referred to in the content.

