Article

Characteristics of Ecosystem Services in Megacities Within the Yellow River Basin, Analyzed Through a Resilience Perspective: A Case Study of Xi’an and Jinan

1
School of Architecture and Urban Planning, Lanzhou Jiaotong University, Lanzhou 730070, China
2
School of Architecture, Xi’an University of Architecture and Technology, Xi’an 710000, China
*
Author to whom correspondence should be addressed.
Sustainability 2025, 17(8), 3371; https://doi.org/10.3390/su17083371
Submission received: 23 February 2025 / Revised: 28 March 2025 / Accepted: 8 April 2025 / Published: 10 April 2025

Abstract

:
Megacities in developing countries are still undergoing rapid urbanization, with different cities exhibiting ecosystem services (ESs) heterogeneity. Evaluating ESs among various cities and analyzing the influencing factors from a resilience perspective can effectively enhance the ability of cities to deal with and react quickly to the risks of uncertainty. This approach is also crucial for optimizing ecological security patterns. This study focuses on Xi’an and Jinan, two important megacities along the Yellow River in China. First, we quantified four ecosystem services for both cities: carbon storage (CS), habitat quality (HQ), food production (FP), and soil conservation (SC). Second, we analyzed the synergies and trade-offs between these ESs using bivariate local spatial autocorrelation and Spearman’s rank correlation coefficient. Finally, we conducted a driver analysis using the Geographic Detector. Results: (1) The spatial and temporal distribution of the four ESs in Xi’an and Jinan is quite different, but both cities show lower ES levels in the urban core area. (2) ESs in Xi’an showed a strong synergistic effect. Among them, CS-HQ had the strongest synergy of 0.93. In terms of space, the north is dominated by low–low clustering, while the south is dominated by high–high clustering. The FP-SC in Jinan showed a trade-off effect of −0.35 in 2000, which gradually weakened over time and was mainly distributed in the northern area of the city where cropland and construction were concentrated. (3) Edge density, patch density, and NDVI have the greatest influence on CS in Xi’an and Jinan. DEM, slope, and patch density have the greatest influence on Xi’an HQ. Temperature, edge density, and patch density have the greatest impact on Jinan HQ. NDVI and temperature have the greatest influence on FP in the two cities. DEM, slope, and edge density have the greatest influence on SC. Landscape fragmentation has a great impact on CS, HQ, and SC in Xi’an and Jinan. Due to insufficient research data, this study focused on only four ESs in Xi’an and Jinan, the megacities in the middle and lower reaches of the Yellow River. However, the research results can provide a new perspective for solving the problem of regional sustainable development and new directions and ideas for follow-up research in this field.

1. Introduction

Cities are considered the most complex social-ecological systems, being responsible not only for producing the material necessities of human life but also for ensuring resilience to shocks and risks, enabling timely recovery [1,2]. However, while rapid urbanization can yield economic benefits, it also inevitably brings about environmental pollution, climate change, and resource depletion [3]. Building resilient cities as a strategy to withstand the uncertainties of risk is a crucial safeguard for achieving sustainable development [4]. Approaching the regional impacts of urban development through the perspective of ecosystem resilience can better harmonize the contradictions between human progress and the need for harmonious development with nature [5].
In the process of urbanization in China, the rapid growth of population is undoubtedly one of the main factors leading to urban expansion [6]. China’s population is projected to increase by 255 million by 2050 [7]. Rapid urban population growth has led to an increase in the number of megacities in China [8]. The increasing impact of these megacities on urban economic and social development as well as on ecosystem protection and resource conservation is significant [9]. However, due to their larger populations and higher densities, megacities face a much greater risk of resource depletion and ecological degradation [10,11]. Therefore, recent studies have sought to quantify the impacts of megacity expansion on ecosystems using various methods. For instance, urbanization leads to the fragmentation of ecological lands [12,13]. Yang K et al. [14] studied the relationship between land use and food-water-energy in the Beijing–Tianjin–Shanghai region from 2000 to 2030 and showed that the annual increase of construction land makes the distribution of cultivated land, forest land, and water bodies increasingly dispersed. Shi G et al. [15] showed that from 2000 to 2020, the construction land area of Jiangsu Province expanded significantly, increasing by 57.34%, and a large portion of ecological land was transformed into construction land. At the same time, the landscape fragmentation intensifies, and the urban heat island effect is obvious. Additionally, urbanization diminishes the surface water area and poses a significant threat to water quality [14]. Urban sprawl and the increasing frequency of human activities also affect the role of ecosystems in balancing carbon stocks and emissions [16]. Therefore, in terms of ecosystem protection and natural resource conservation, enhancing urban resilience can augment the level of urban environments by addressing the array of uncertain risks associated with urban expansion. Wen W et al. [17], by studying the relationship between the development of digital economy and urban ecological resilience, found that improving ecological resilience can effectively alleviate urban ecological environment problems and has great practical significance for promoting the development of new productivity. Zhou M et al. [18], through the evaluation of urban flood resilience in the Yangtze River Delta region, concluded that frequent flood disasters threaten urban public safety and sustainable development, and enhancing urban ecological resilience is crucial for flood control and disaster reduction.
ESs are the foundation upon which ecosystems provide the physical environment and resources necessary for human survival [19]. ESs represent the essential functions, goods, and services that humans derive from ecosystems [20], including soil and water conservation, climate regulation, water supply, and food production. Resilience reflects the ability of the urban system to prevent external influence [21], and this resilience is closely linked to ESs [22,23]. Therefore, effectively improving ESs in megacities and identifying the correlations between different ecosystem service functions is of great significance for optimizing ES policies and enhancing land use patterns in these cities. Since the 21st century, academic interest in ESs has grown substantially, with research increasingly focusing on the classification of ESs [23,24,25] by exploring the interrelationships between different service functions [26], dynamic trends in their spatial and temporal evolution [27,28], driving factors [29,30], and spatial heterogeneities [30,31] to gain insights into the underpinnings of ESs. Some scholars have even made innovative breakthroughs in quantitative methods. Liu J et al. [32] used logistic regression to calculate the probability of each land type appearing on the grid, and finally identified 11 representative drivers. Aniah P et al. [33] used linear weighted regression (LWR) to analyze the range of factors that affect smallholder farmers’ adaptation to changing ecosystem service expenditures, so as to explore adaptive strategies for ecosystem service compensation, and Ren Q et al. [34] used geographically weighted regression (GWR) to measure the interaction between ES and urban expansion in densely populated areas [35] and the impact of human activity intensity [36]. Furthermore, synergies and trade-offs are key indicators to measure the intrinsic linkages among ESs. Simultaneous increases or decreases in several ESs show a positive correlation in space and time, referred to as synergistic effects. Conversely, several ESs do not increase or decrease at the same time, with a negative correlation in space and time, indicating a trade-off effect [37]. However, to maintain a sustainable level of ES supply and capacity, we must promote a balanced relationship among the various ES functions, which is conducive to ensuring sustainable regional development [38].
Research on ESs in megacities has recently garnered increasing attention. However, most existing literature tends to evaluate ESs in a single city. Shi T et al. [39] quantified the spatio-temporal changes and driving mechanisms of urban green space ecosystem services in Suzhou city by using the extreme gradient lifting geographical weighted regression method, indicating that urbanization and industrialization lead to increased risks of soil erosion and landscape fragmentation. Lu Y et al. [40] assessed the risk of ecosystem service degradation in Wuhan from the perspective of land development, and reduced the probability of degradation risk by optimizing the land development model. Other studies have also highlighted the direct and indirect damage to ecosystems caused by the expansion of megacities. Fu Y et al. [41] studied the impact of land use/land cover change on urban vegetation net primary productivity (NPP) in Guangzhou, China, and found that the expansion of megacities was the main reason for the rapid degradation of urban carbon stocks. Xie W et al. [42] predicted the impact of urban expansion on ecosystem services in Beijing, China, in 2040, and the results showed that urban expansion would exacerbate the loss of ecosystem service functions at the same time. And the occupation of arable land and forest land is the main cause of loss. Despite these advances, several gaps remain. For instance, correlation analyses of ESs within a single city do not fully capture the changes in ESs across megacities or the underlying mechanisms at play. Additionally, cross-sectional comparative analyses between megacities in different geographic locations are challenging due to variations in geographic conditions and climatic factors [7].
Moreover, recent studies have demonstrated that land use cover fragmentation impacts ecosystem service value (ESV), leading to the continuous decline of ESs [43,44]. Fragmentation of forests, grasslands, and water bodies can significantly affect carbon stocks and soil retention [45]. However, current studies often overlook landscape fragmentation as a dimension of ecological resilience assessment [46], particularly in relation to the long-term effects of ESs in megacities within the Yellow River Basin. Both ecological resilience and ecosystem services are important evaluation factors for improving the quality of human settlements and protecting ecosystem security, while landscape fragmentation is a threat to the ecological environment protection of cities and regions or even larger areas. Therefore, from the perspective of ecological resilience, we considered the temporal and spatial changes of ecosystem service functions in megacities and analyzed the impact of landscape fragmentation factors on ecosystem security. We selected Xi’an and Jinan, two megacities in different sections of the Yellow River Basin, as the research objects from the perspective of resilient cities. Here, we conducted a comparative analysis of four ESs over three periods: 2000, 2010, and 2020. We also examined the different synergies and trade-offs between the two cities. Finally, the driving factors were analyzed, and the factors of landscape fragmentation were considered to explore the causes of ES heterogeneity among different megacities. In an attempt to provide valuable insights into the coordinated management of ecological security and the construction of resilient cities in megacities, landscape fragmentation was emphasized as the main factor affecting ESs to improve the level of urban ecological resilience and urban sustainable development.

2. Materials and Methods

2.1. Study Area

We selected Xi’an (Figure 1a) and Jinan (Figure 1b), two megacities in different sections of the Yellow River Basin, as the focal areas to study the variations in ESs and the correlations between different types of ESs.
Xi’an (107.40°~109.49° E, 33.42°~34.45° N) is located in Northwest China, in the central part of the Guanzhong Plain. It is bordered by the Weihe River Basin to the north and the Qinling Mountain Ecological Reserve to the south. As the largest central city in Northwest China, Xi’an serves as a political, economic, and cultural center and has one of the largest elevation gaps in the country. The city experiences a continental monsoon climate within a semihumid zone, with an average annual temperature ranging from 13.1 to 14.3 °C. The city is characterized by a distinct north–south boundary, with mountains in the south and plains in the north forming the primary landforms of Xi’an. Since the Chinese government unveiled its GPUA expansion program, Xi’an has emerged as a hub metropolis in Northwest China [47]. The geographic location of Xi’an and its special strategic positioning in northwestern China underscore its significance in ecological and environmental protection.
Jinan (116.11°~117.44° E, 36.01°~37.32° N) is located in the central and western regions of the Shandong province in the east of China. The city lies north of the Yellow River and south of Mount Taishan and experiences a warm temperate continental monsoon climate. Jinan features hilly areas in the south and plains in the center and north. It serves as a crucial meeting point for the Bohai Rim Economic Zone and the Beijing–Shanghai Economic Axis, while also functioning as the central hub of the southern wing of the Bohai Rim, as sanctioned by the State Council of China. Additionally, Jinan is a typical city with a diverse ecosystem that includes mountains, rivers, forests, fields, lakes, and grasslands [48]. By 2023, the city’s resident population had reached 9,347,000, with an urbanization rate of 75.3% [49]. As Jinan’s urbanization level and resident population have increased in recent years, the conflict between urban expansion and environmental protection has gradually intensified.

2.2. Data Sources and Processing

The land use data of Xi’an and Jinan in 2000, 2010, and 2020, as well as the annual precipitation data, were selected from the Data Center for Resources and Environmental Sciences, Chinese Academy of Sciences (http://www.resdc.cn/, accessed on 19 November 2024). Since the InVEST and RULSE models were used in this study to calculate ecosystem services, the calculated results could be easily verified with the parameters and results of similar research models. At the same time, it is convenient to connect with China’s territorial spatial planning. As a result, land use data were reclassified into six categories: cropland, forest, grassland, water bodies, construction, and unused, all with a resolution of 30 × 30 m. Digital elevation model (DEM) data were sourced from the EAA Copernicus Data Centre (https://panda.copernicus.eu/panda https://dataspace.copernicus.eu, accessed on 22 November 2024), also at a spatial resolution of 30 × 30 m. Population distribution were from the (https://www.worldpop.org/, accessed on 25 November 2024). Mean annual temperature and normalized difference vegetation index (NDVI) data were obtained from (http://data.cma.cn/, accessed on 1 December 2024). The values of CS, HQ, FP, and SC by year were calculated using the InVEST and RULSE models. Patch density (PD) and edge density (ED), which quantify landscape fragmentation, were calculated using Fragstats 4.2. All data were uniformly projected using WGS_1984_World_Mercator.

2.3. Assessment of Ecosystem Services

On account of the types of ESs proposed by the Millennium Ecosystem Assessment (MA), we selected the most representative ESs based on the principle of high-quality development in the Yellow River Basin. The land cover types in Xi’an and Jinan are mainly composed of cropland, forest, and grassland. Consequently, the primary service functions of Xi’an and Jinan are related to food production, climate regulation, and environmental purification, while cultural services are not prominent in this region. FP is the foundation of economic prosperity and the source of social progress [50]. HQ determines the resilience of urban ecosystems [51], while CS and SC are important indicators of high-quality urban development and environmental quality [52]. Consequently, CS and SC were selected as representatives of regulating services, HQ as supporting services, and FP as provisioning services to evaluate the level of ESs in Xi’an and Jinan.

2.3.1. Carbon Storage (CS)

We used the carbon storage and sequestration module of the InVEST model to assess CS in Xi’an and Jinan. This module calculates the total carbon density for each land use type, which primarily includes aboveground biomass carbon density, belowground biomass carbon density, soil carbon density [53], and dead organic matter carbon density. The specific formulas are outlined below:
T c = i = 1 n   L i × C i
C i = C a b o v e + C b e l o w + C s o i l + C d e a d
where T c represents the total carbon stock for each land use type (t), L i indicates the area of each land use type (hm2), C i represents the total carbon intensity for land use type i (t/hm2), C a b o v e refers to the aboveground biomass carbon density (t/hm2), C b e l o w represents the belowground biomass carbon density (t/hm2), C s o i l denotes soil carbon density (t/hm2), and C d e a d indicates dead organic matter carbon density (t/hm2).

2.3.2. Habitat Quality (HQ)

HQ in Xi’an and Jinan was quantified using the Habitat Quality Assessment Module of the InVEST model. This module measures habitat quality by evaluating the extent to which various threat sources impact different land use types [54]. The specific formulas are as follows:
Q x j = H j × 1 D x j z k z + D x j z
Q x j represents the habitat quality for each pixel; H j denotes the degree of habitat suitability for each land use type; D x j indicates the degree of habitat degradation for pixel; k is the half-saturation parameter in the module, set at 0.05; and z is the model’s default normalization constant, set at 2.5.

2.3.3. Food Production (FP)

FP is a crucial indicator of ecosystem provisioning services. We evaluated the grain yield distribution by quantifying the ratio of the NDVI of each pixel to the NDVI of cropland [55]. The specific formulas are as follows:
F i = N D V I i N D V I c × F t i
F i indicates the total value of food production in each pixel, N D V I i indicates the NDVI value of pixel i, N D V I c indicates the value of cropland NDVI, and F t i indicates total grain production in the study area.

2.3.4. Soil Conservation (SC)

We used InVEST’s SDR tool to evaluate SC in Xi’an and Jinan. This method primarily calculates soil retention by measuring the difference between latent and actual erosion based on an improved soil erosion equation [56]. The specific formulas are as follows:
S C s = Σ S C i A
S C i = R K L S i U S L E i
R K L S i = R i × K i × L S i
U S L E i = R i × K i × L S i × C i × P i
S C s indicates soil retention in the study area (t/hm2); Σ S C i represents the amount of soil retention in pixel i; A denotes the total area of each land use type in the study area (hm2); R K L S i indicates the potential soil erosion for pixel i (t/hm2); U S L E i represents the actual soil erosion of pixel i (t/hm2); R i denotes the rainfall erosion factor; K i indicates the soil erodibility factor; L S i indicates the slope length factor; C i indicates the vegetation cover factor; and P i indicates soil and water conservation factors.

2.4. Data Analysis

2.4.1. Bivariate Spatial Autocorrelations

Relevance evaluation is a key method for analyzing the interdependence between two geographic elements, encompassing both global and local correlations. We started with a grid of 3000 × 3000 m to enable clearer sampling of statistical data. We then used local bivariate spatial autocorrelation methods to analyze the spatial and temporal trade-offs and coordination dynamics between different ESs in Xi’an and Jinan for the years 2000, 2010, and 2020. Moran’s index was used in this analysis. If the index is positive, it proves that there is a positive correlation between the two, and if not, it is a negative correlation [57].

2.4.2. Spearman Correlation Analysis

Spearman correlation is often used as a method to express whether the trend of change between two random variables is consistent. This method assesses the degree of agreement between the rankings of two variables, reflecting their growth or decline [58]. We employed Spearman correlation analysis to further corroborate the trade-offs and synergies between different ESs in Xi’an and Jinan for the years 2000, 2010, and 2020.

2.5. Geographic Detector

Geodetector is one of the main geographic information models used to explain spatial dissimilarity between different variables and measure the strength of the independent variable’s impact on the dependent variable. This method includes four main modules: interaction detection, ecological detection, driving detection, and risk detection [59]. In this study, we conducted single-factor and interaction probing of the drivers for different ESs in Xi’an and Jinan for the years 2000, 2010, and 2020. The value of q ranges from 0 to 1, with values closer to 1 indicating a greater effect of the factor on the heterogeneity of the ESs.
The interpretation of the interaction results is as follows: If q(X1∩X2) < min(q(X1), q(X2)), the interaction of both X1 and X2 is considered to be nonlinearly decreasing. If min(q(Xa), q(Xb)) < q(X1)∩X2) < max(q(X1), q(X2)), this suggests a one-way nonlinear weakening effect from the interaction of X1 and X2. If q(X1∩X2) > max(q(X1), q(X2)), it indicates that the influence of both X1 and X2 is simultaneously enhanced. If q(X1∩X2) = q(X1) + q(X2), it means that X1 and X2 are independent of each other. If q(X1∩X2) > q(X1) + q(X2), it indicates that the influence of X1 and X2 is nonlinearly enhanced.

3. Results

3.1. ES Calculation Parameter Analysis

We incorporated the unique land use distribution of Xi’an and Jinan based on previous studies [18,60] and found that the carbon density of each land has a very important influence on the calculation of CS (Table 1 and Table 2).
The soil carbon density in Xi’an and Jinan is the highest of the four types of land cover, specifically forest, with a soil carbon density of 103.38 t/hm2 and 158.83 t/hm2, respectively. Grassland followed, with soil carbon densities of 83.28 t/hm2 and 99.94 t/hm2. Water had the lowest carbon density, with subsurface biomass carbon density, soil carbon density, and carbon density of dead organic matter all being 0. It is worth noting that the soil carbon density of Xi’an construction land is 58.67 t/hm2, while that of Jinan is 0.
The sensitivity and threat source parameters required by the module are listed in Table 3 and Table 4.
By comparing the different land use distributions of Xi’an and Jinan, we chose cropland, construction, and unused land types as the threat sources for calculating HQ. The impact distances of the three threat sources in Xi’an are 4 km, 8 km, and 4 km, respectively, while those of the three threat sources in Jinan are 8 km, 12 km, and 5 km. In addition, the weights of the three land types in Xi’an are 0.6, 0.8, and 0.5. The weights of the three land types in Jinan are 0.6, 1, and 0.4. In terms of sensitivity, forest, grassland, and water are the most sensitive ecological land types. The lowest sensitivity was observed in construction land, with a value of 0.

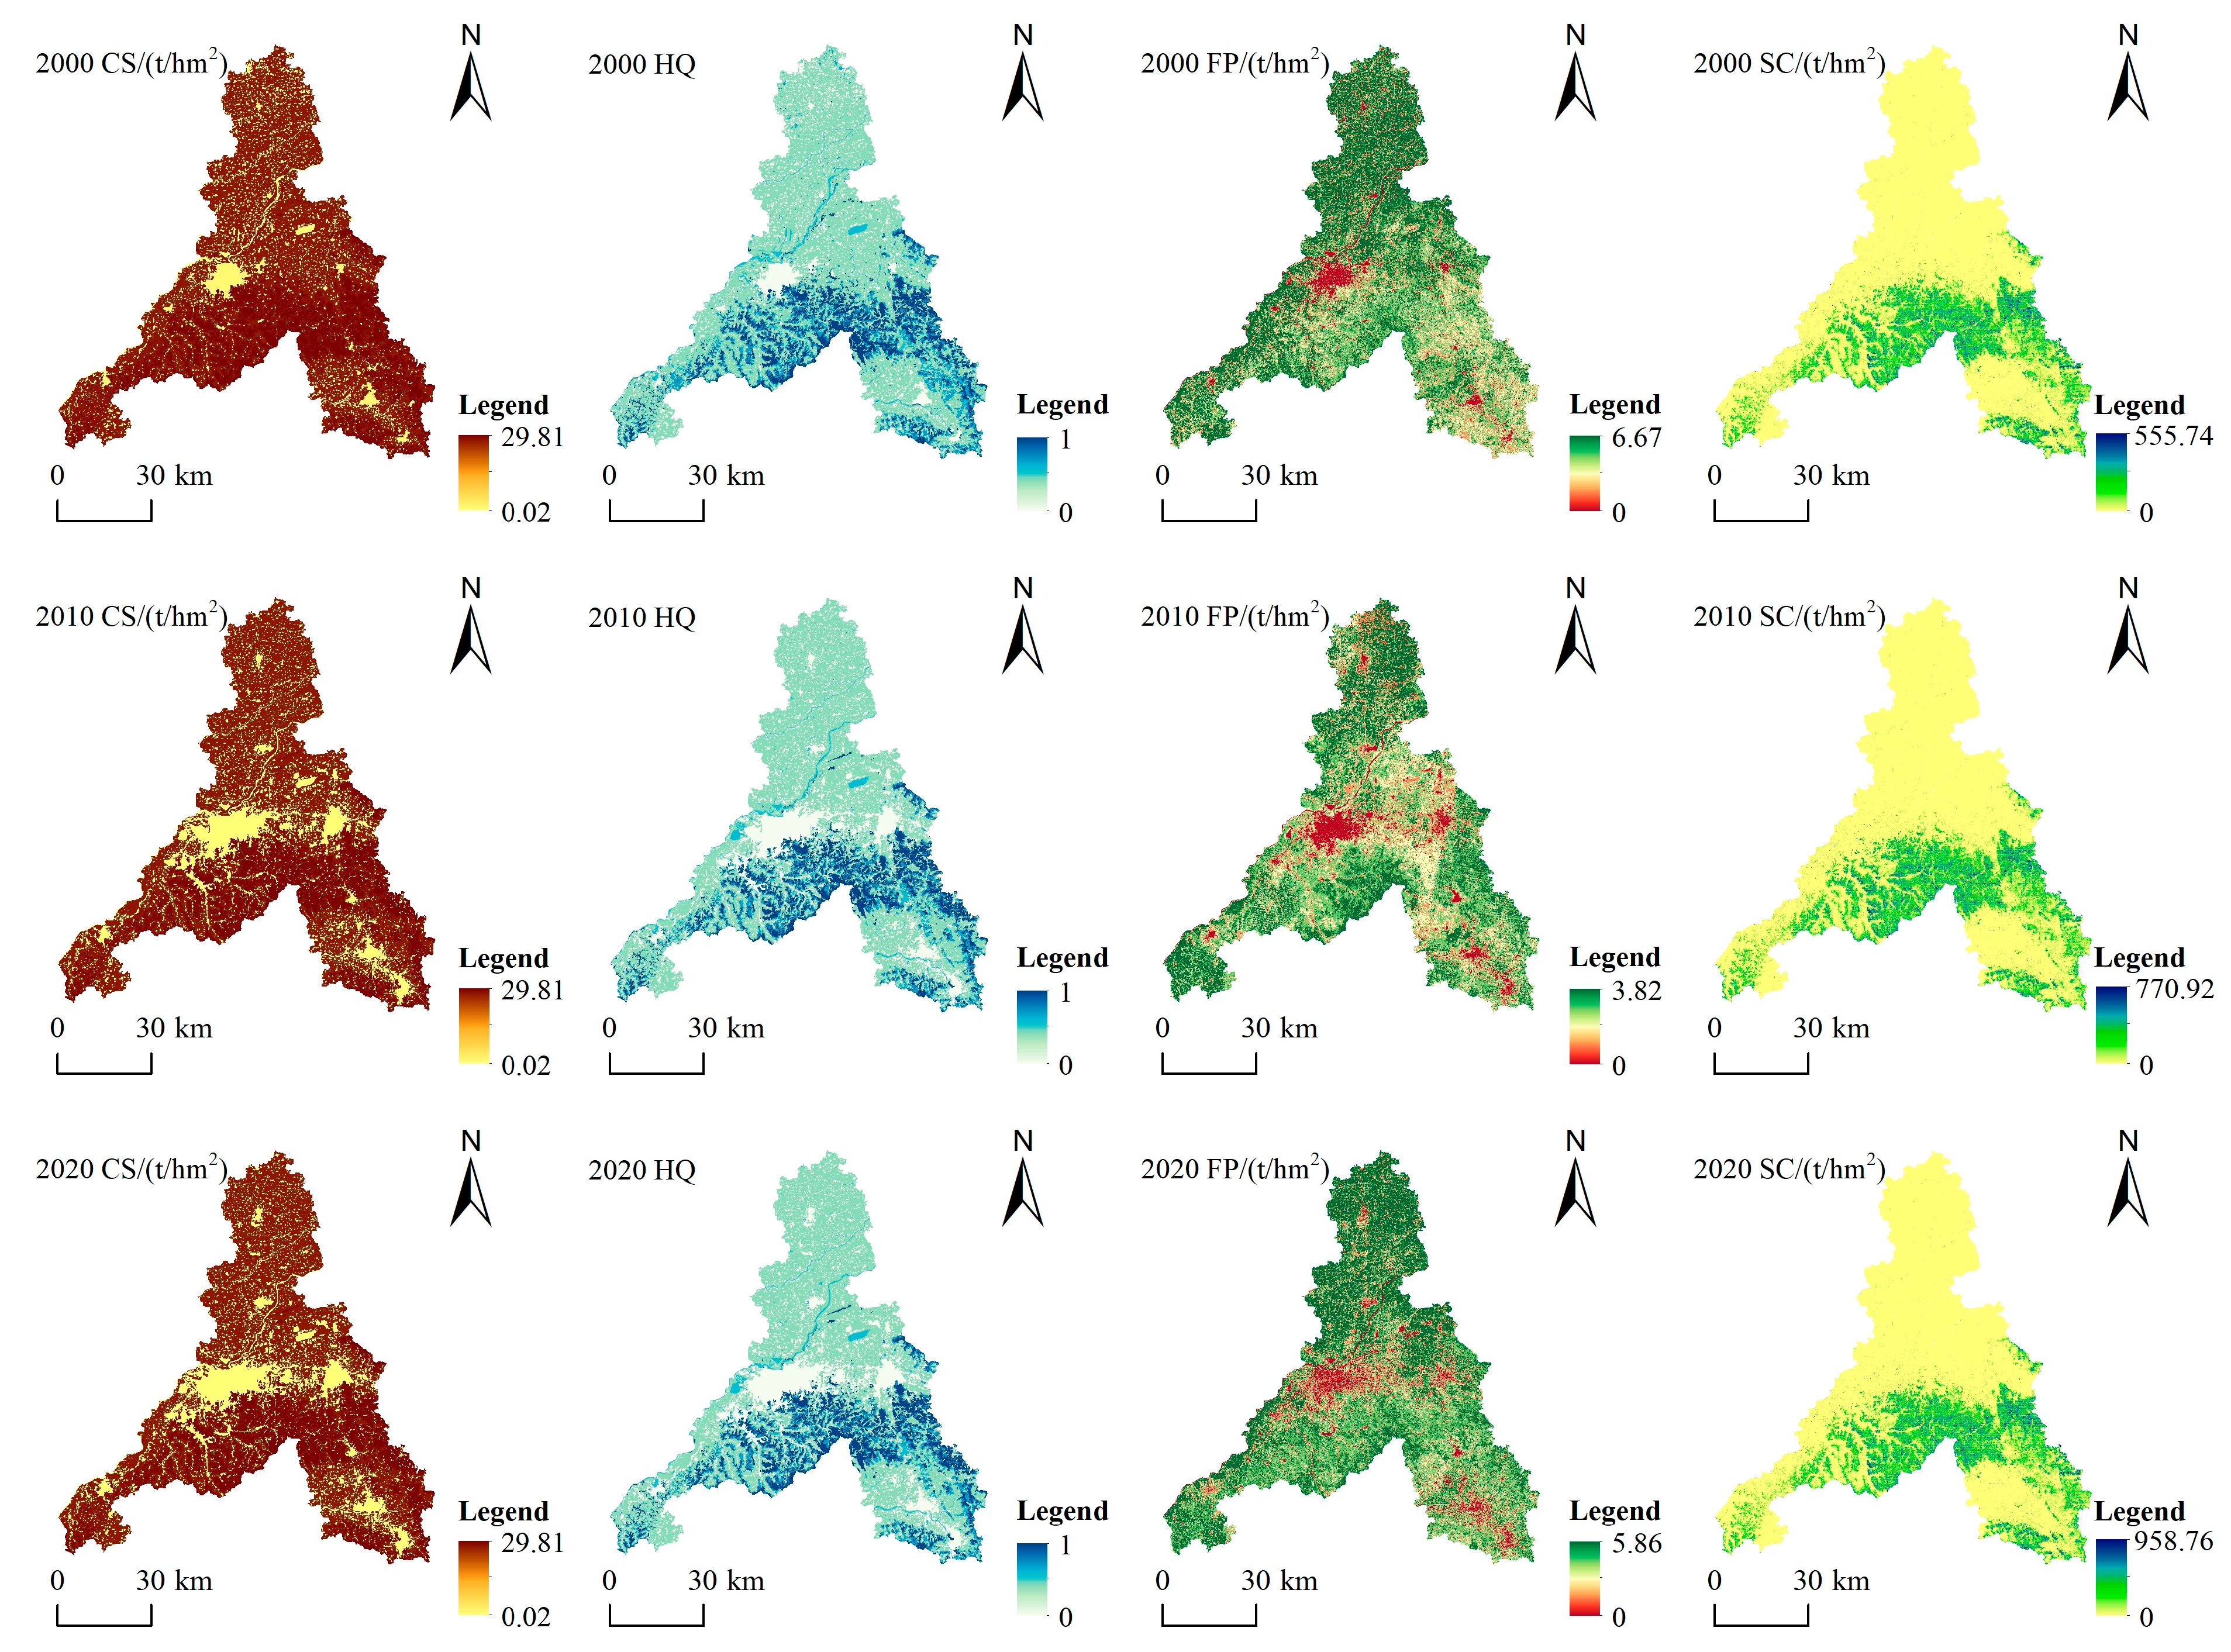
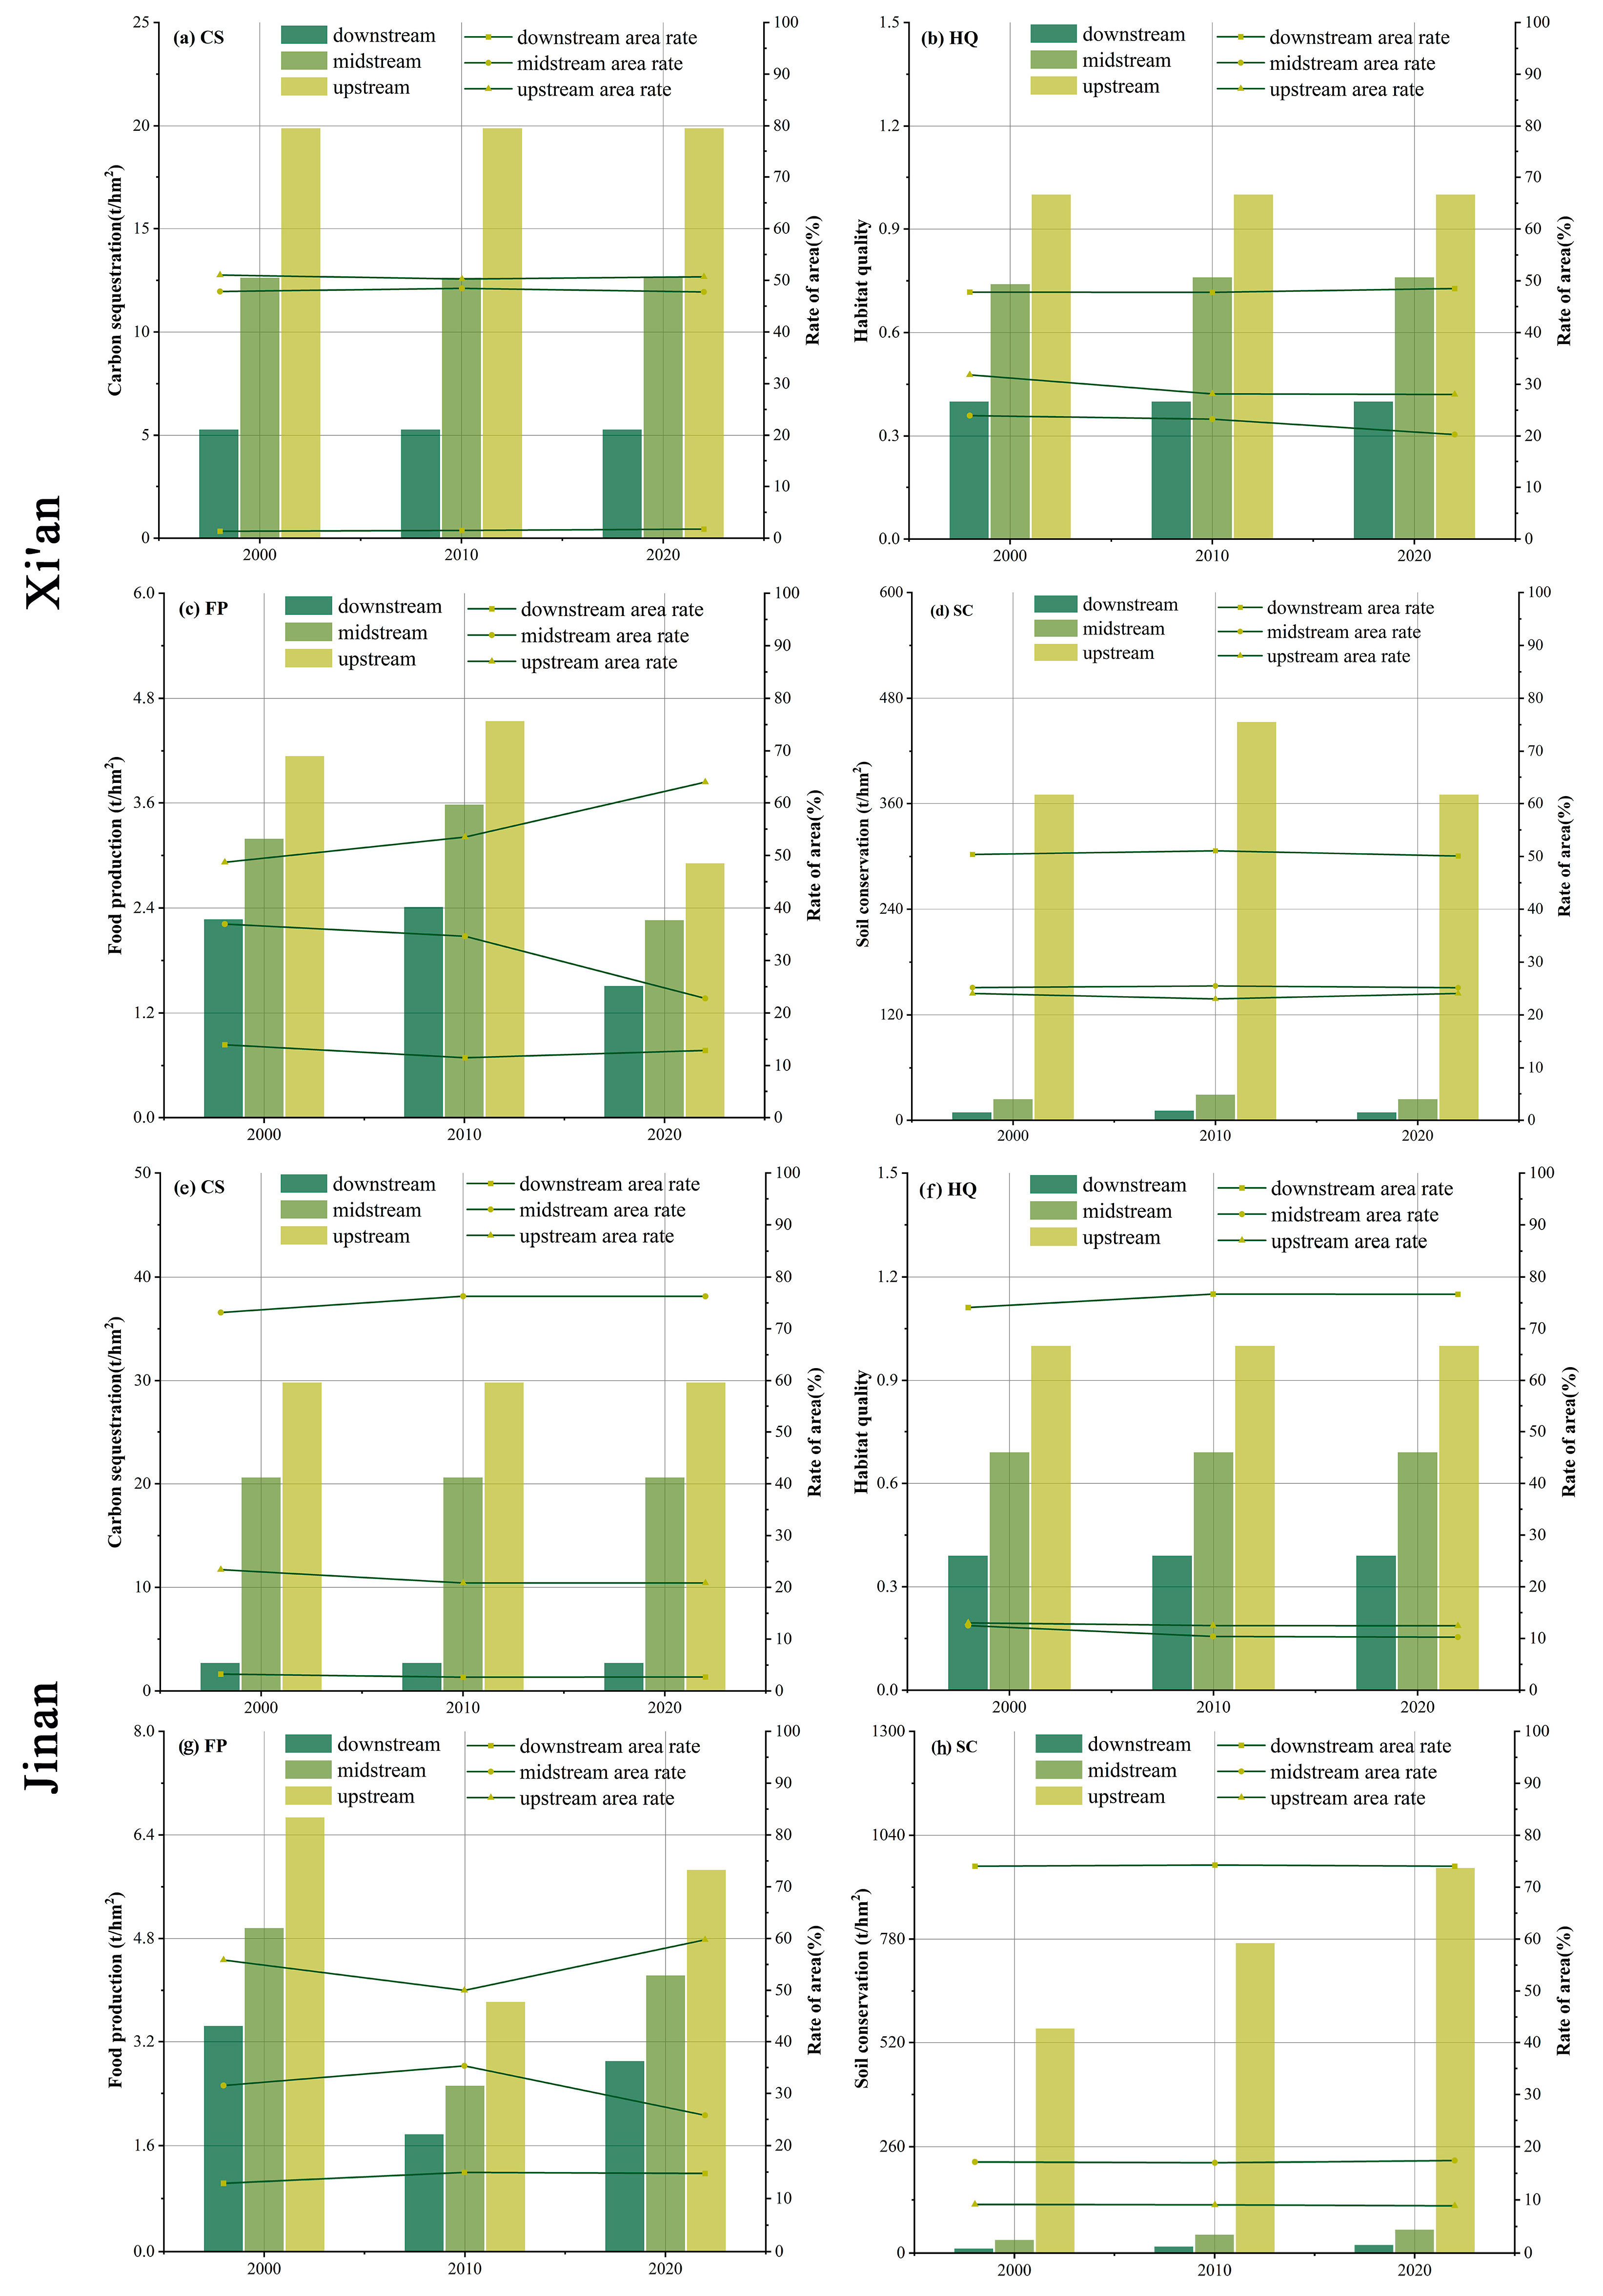
3.2. Spatiotemporal Variations of ESs

We observed significant heterogeneity of ES changes between Xi’an and Jinan (Figure 2, Figure 3 and Figure 4). In Xi’an, the function of the four ESs is generally low in the center and north, and high in the south, with a distinct high-to-low boundary running along the east–west axis. In contrast, Jinan did not exhibit a clear high-to-low boundary for the ESs. Instead, the overall spatial and temporal distribution pattern in Jinan was higher in the middle and lower in the north and south.
Spatially, both megacities exhibited lower ES functions in areas with high anthropogenic intensity. In Xi’an, the fragmentation of CS and HQ was more pronounced in the southern region compared to FP and SC. HQ values were generally low in the northern part, with higher values observed in watershed areas. SC showed the largest spatial distribution difference between the northern and southern regions, with the north-central area consistently low for all ESs. In Jinan, except for SC, the distribution of the other three ESs was more dispersed and fragmented compared to Xi’an, with low-value areas scattered throughout the city. FP in Jinan, unlike the other three ESs, had a spatial distribution pattern with higher values in the north and lower values in the south. Unlike Xi’an, Jinan did not display a clear boundary for the distribution of its ESs, and the variations were less pronounced.
In this study, we categorized the ESs in both cities into three classes (low, medium, and high) and examined their distribution over time (Figure 4). In both Xi’an and Jinan, the regions with low ES values expanded over time, with these areas primarily located in regions with intensive human activity. This expansion suggests that ESs are likely to decline with urban expansion. In Xi’an, the FP per unit area increased initially and then decreased, but the percentage of high-value FP areas grew. Specifically, the high-value FP area increased from 48.83% in 2000 to 64.09% in 2020, while the medium-value area decreased from 37.08% in 2000 to 22.91% in 2020. Conversely, in Jinan, FP per unit area initially decreased and then increased, with high-value areas rising from 55.77% in 2000 to 59.67% in 2020. Regarding HQ and SC, both cities experienced a larger proportion of low-value regions compared to medium- and high-value areas. Notably, Jinan had 76.8% of its HQ and 73.92% of its SC regions classified as low-value. In Xi’an, the distribution of lower areas for most ESs, except SC, expanded outward from the center over time. In contrast, Jinan displayed a dispersed point-like distribution of low-value regions, which gradually connected to form a line.

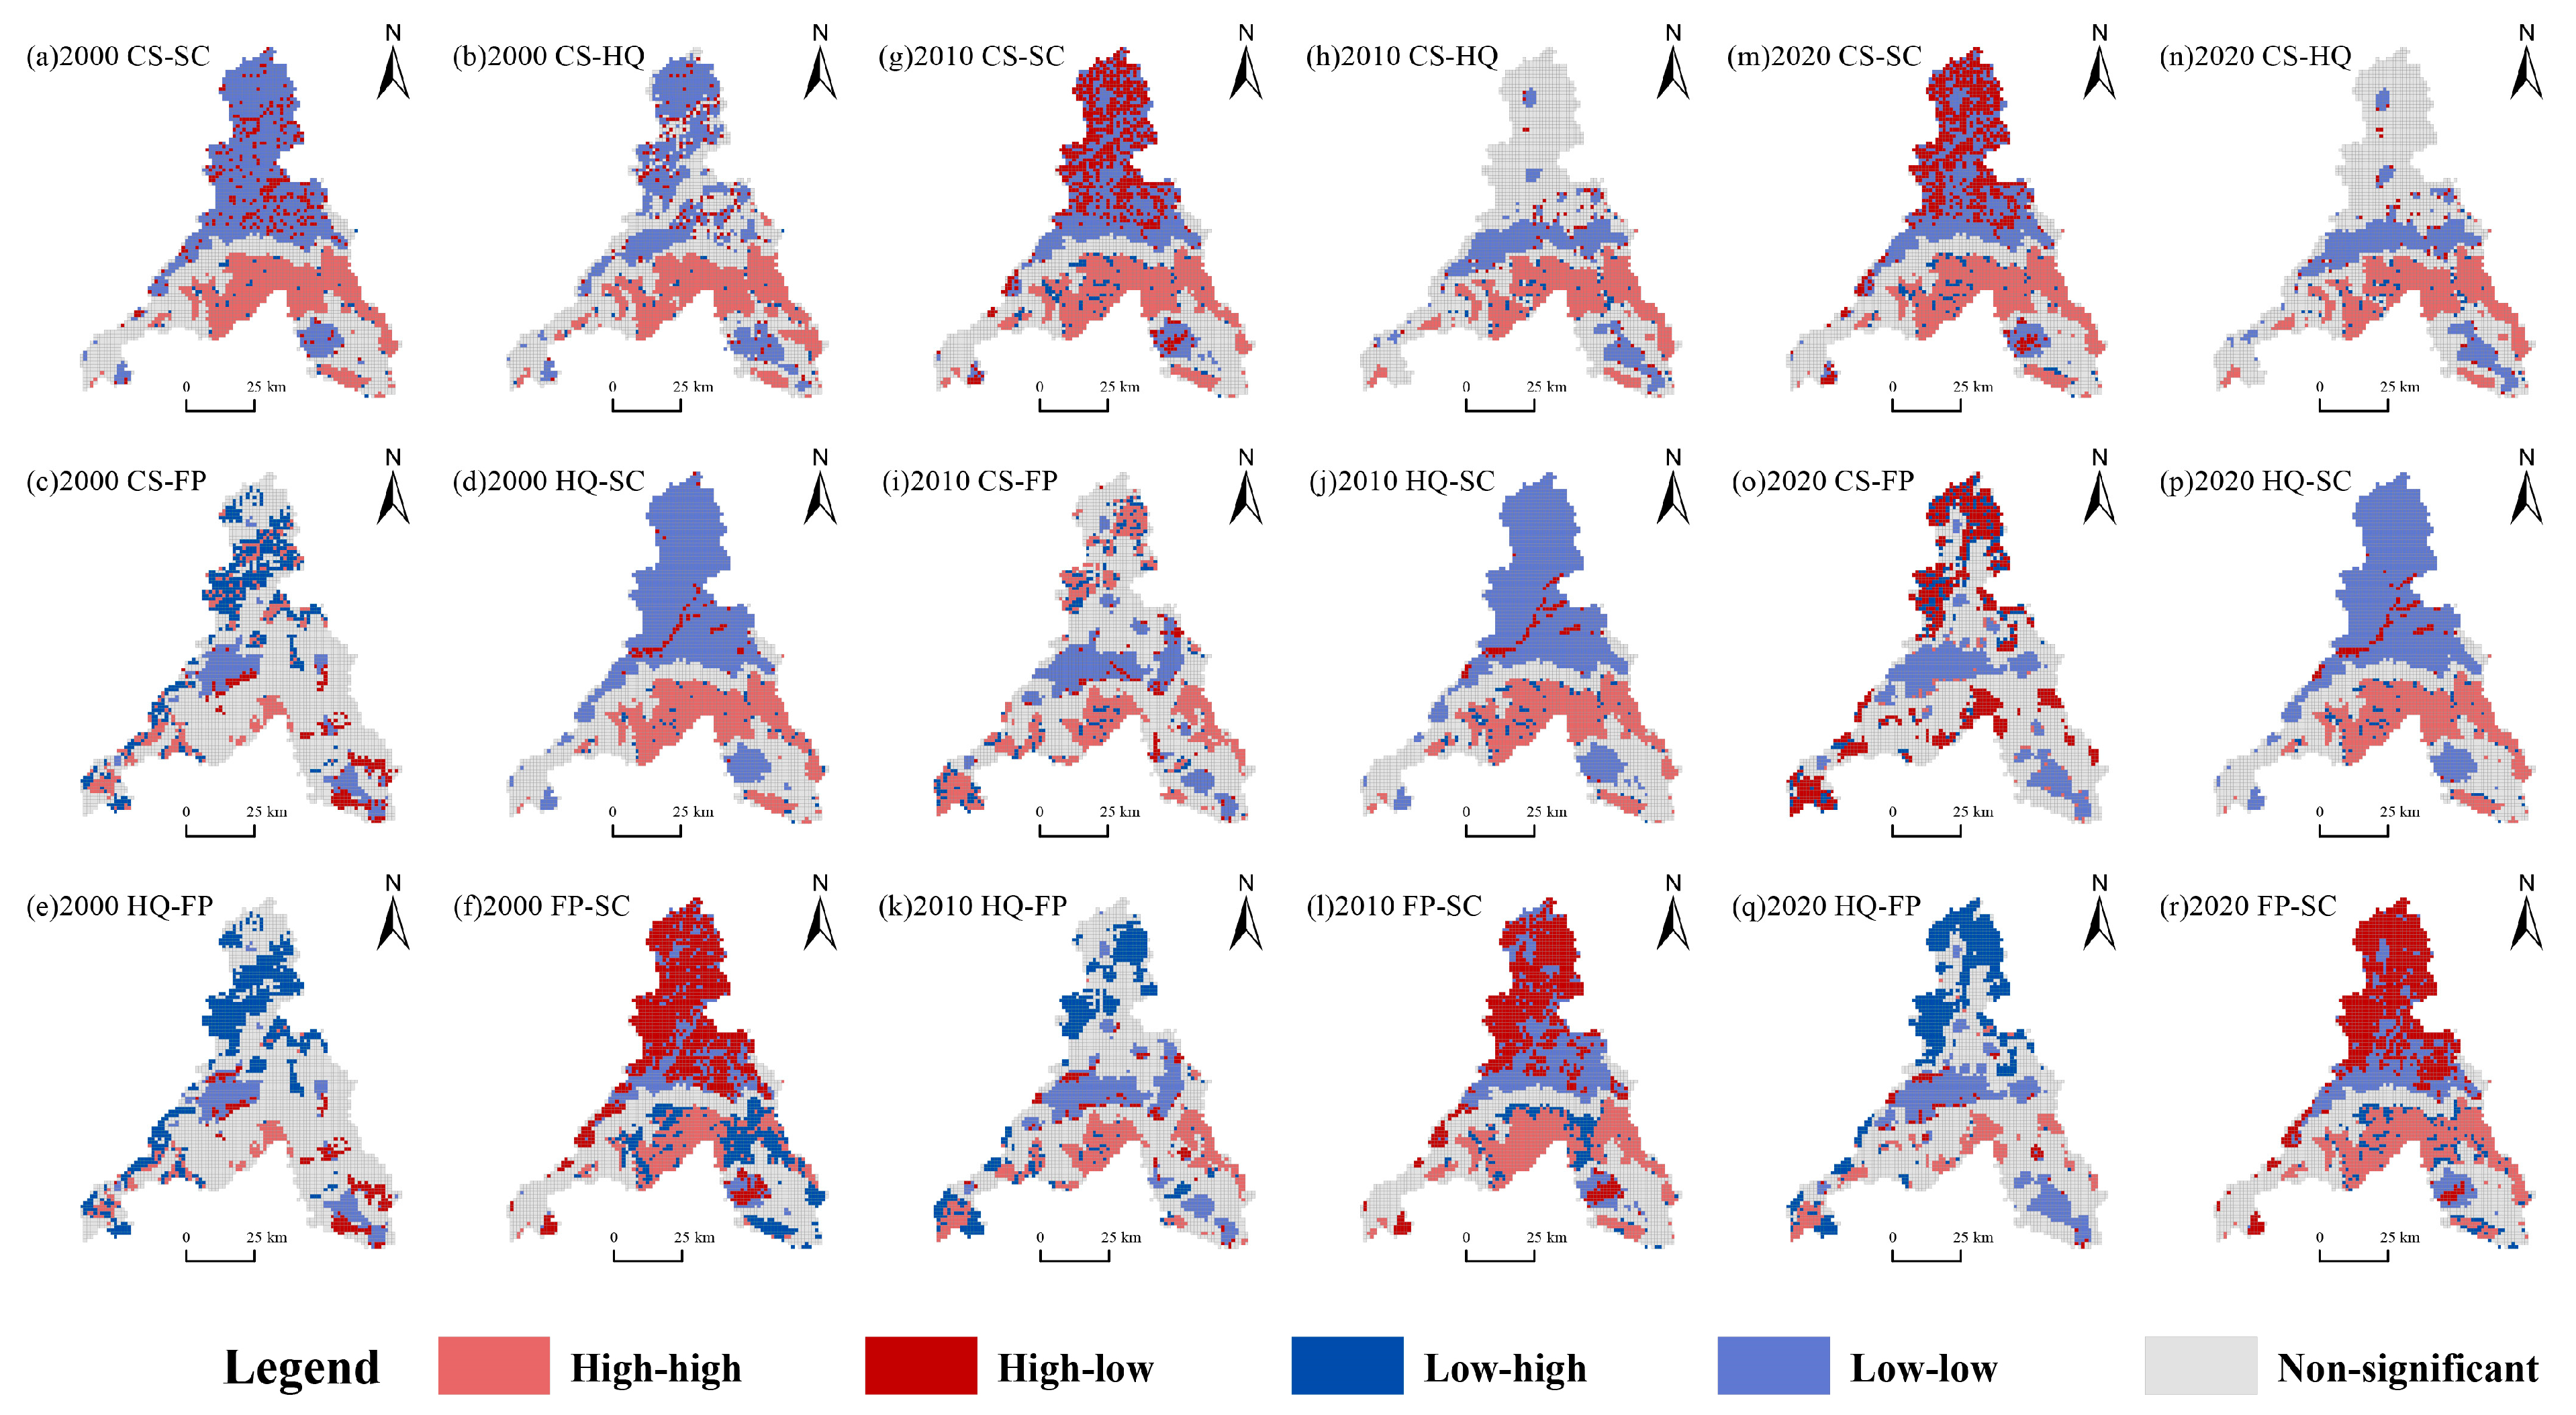
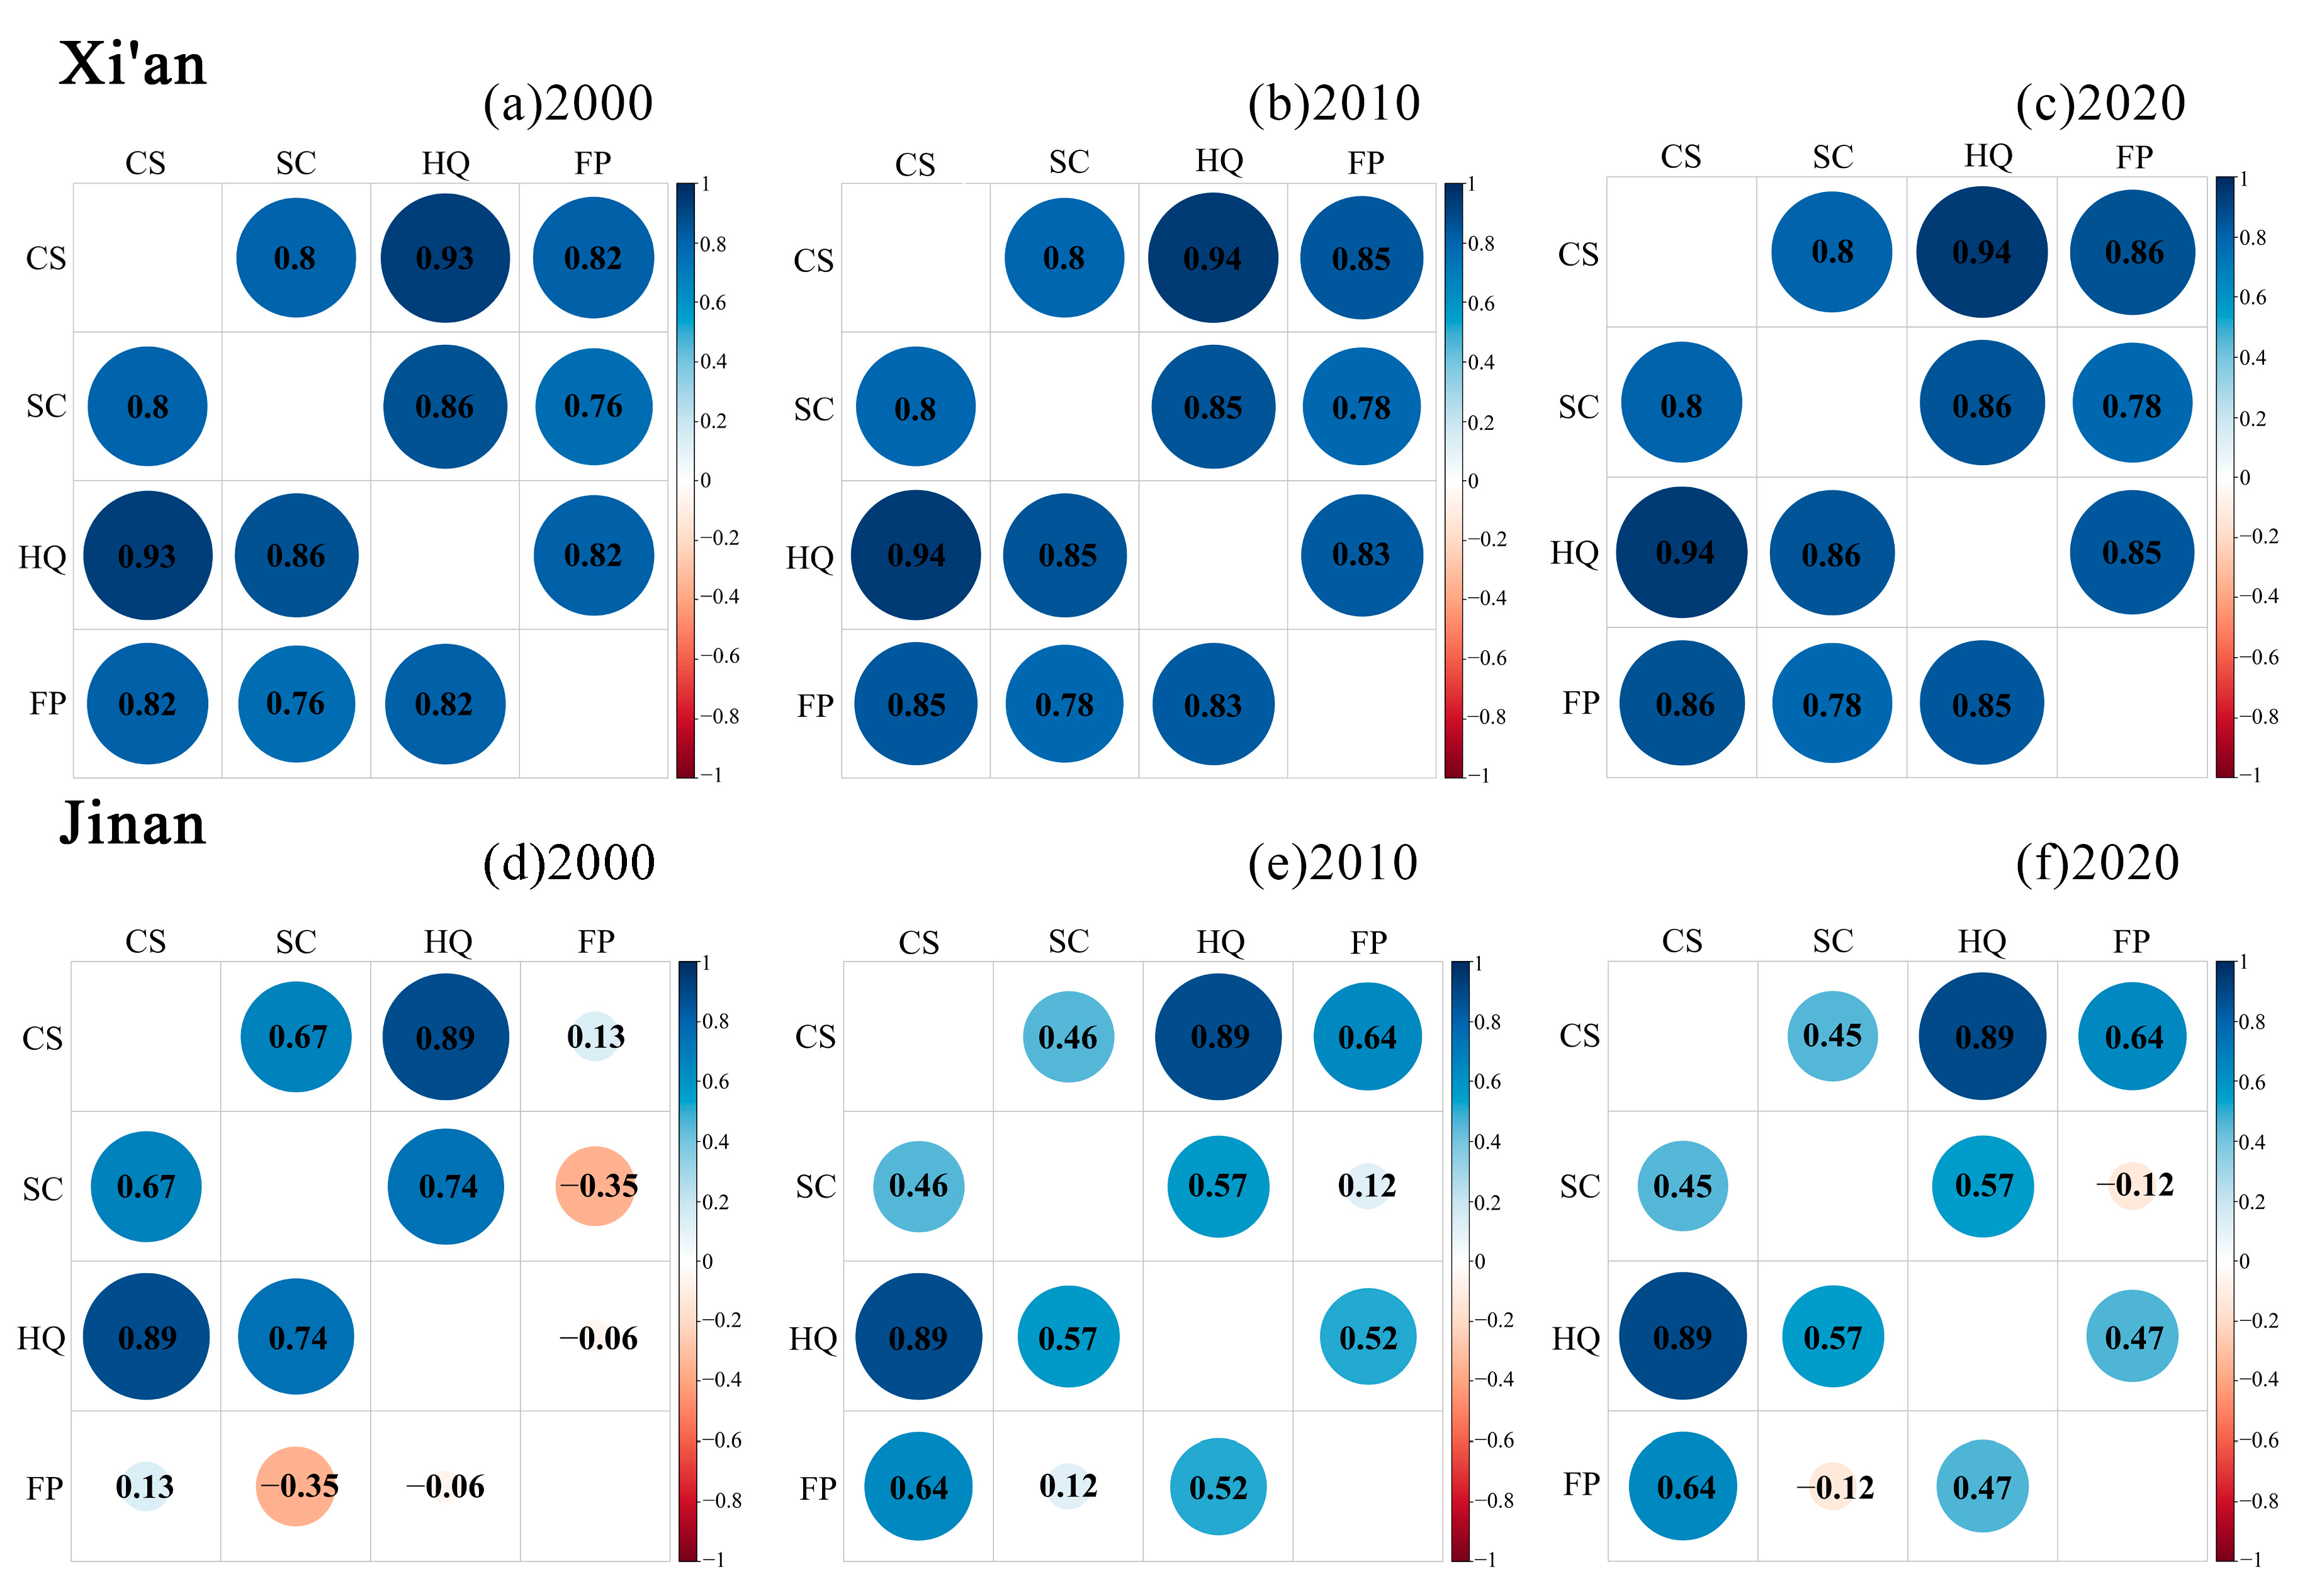
3.3. Changes in the Trade-Offs and Synergies of ESs

The results indicate that Xi’an is largely characterized by synergistic effects, with the northern region dominated by low–low clustering and the southern region by high–high clustering, creating a distinct north–south boundary (Figure 5 and Figure 6). High coordination was observed between CS and SC, CS and HQ, HQ and SC, and FP and SC, whereas synergies between CS and FP and HQ and FP were lower. The trade-off effects for CS-SC and CS-FP were mainly concentrated in the southeast. Overall, these spatial patterns remained relatively stable over time. In contrast, Jinan exhibited less pronounced spatial boundaries for trade-offs and synergies compared to Xi’an. Coordination effects dominated the relationships between CS-SC, CS-HQ, and HQ-SC, primarily in the north-central region. However, CS-SC experienced an increase in trade-off areas in the northern region over time. CS-FP and HQ-FP generally exhibited trade-off effects, except in the central areas with intensive human activity, where trade-off areas initially decreased and then increased over time. The synergistic effect in Jinan’s central region expanded over time, forming an east–west distribution pattern. For FP-SC, the northern region was dominated by trade-off effects, while the southern region was characterized by synergies. Notably, the synergistic area in the southern region expanded over time, while the trade-off area in the northern region gradually shrank.
The results revealed strong synergistic effects among six combinations of the four ESs in Xi’an. The strongest synergy was observed between CS and HQ, with a correlation of 0.93, which increased over time. The weakest synergy was between FP and SC at 0.76, though it remained consistently strong over time. In contrast, Jinan exhibited notable differences compared to Xi’an. While CS-SC, CS-HQ, and HQ-SC also displayed strong synergies in Jinan, with CS-HQ being the strongest at 0.89, the synergy between CS and FP was initially weak, with a correlation of 0.13 in 2000. However, this relationship strengthened over time. HQ and FP started as the weakest trade-off in 2000 but gradually shifted towards synergy, reaching 0.47 by 2020 (Figure 7).

3.4. Influence of Driving Factors on ESs

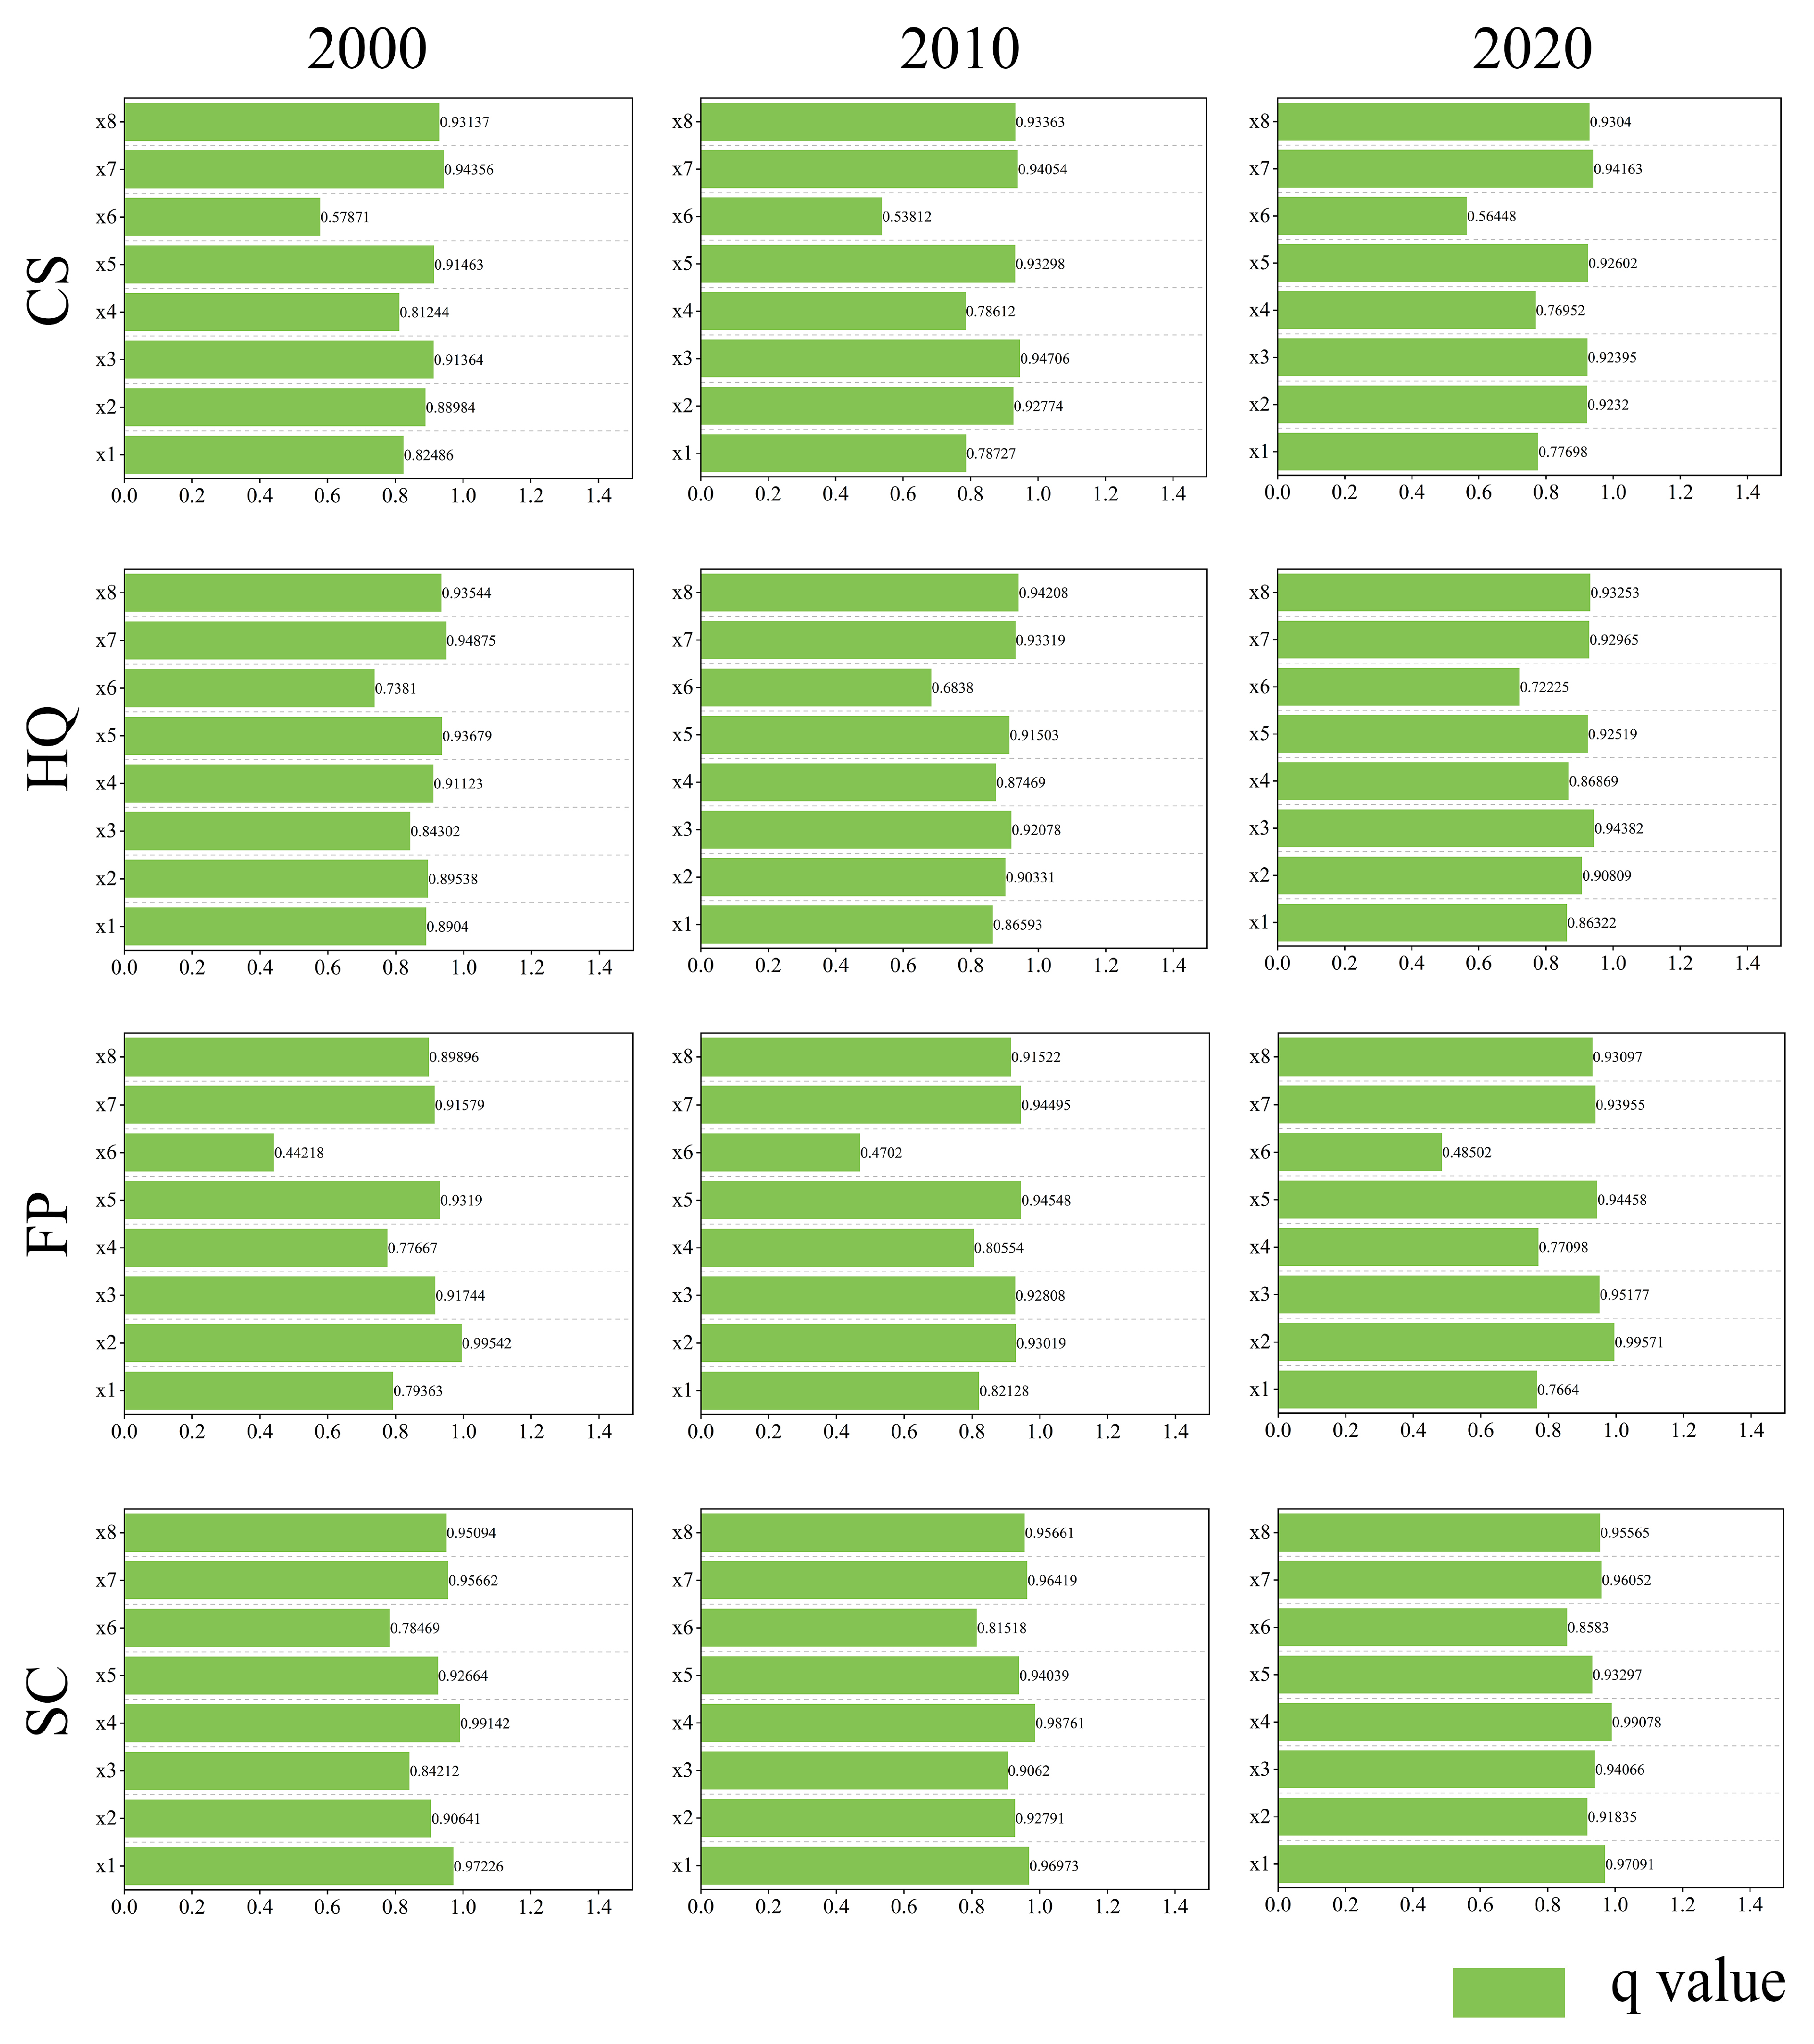
3.4.1. Influence of Single Influencing Factors on ESs

We obtained one-way q-values from the driver analysis of each ES in Xi’an and Jinan for the years 2000, 2010, and 2020, with all results passing the 0.5% significance test (Figure 8 and Figure 9). We identified the three factors with the largest q-values as the main influencing factors for each ES. The analysis showed that for CS in Xi’an, the main influencing factors in 2000 were edge density (0.9530), patch density (0.9431), and NDVI (0.9424). In 2010 and 2020, the key factors were edge density (0.9532), precipitation (0.9394), and patch density (0.9283). A similar pattern was observed in Jinan, where edge density and patch density consistently had a major influence on CS across all years.
For HQ in Xi’an, the dominant factors were DEM (0.9658), slope (0.9577), and patch density (0.9502). In Jinan, the main influences on HQ were temperature, edge density, and patch density. Regarding food production (FP) in Xi’an, the primary factors in 2000 were NDVI (0.9983), temperature (0.9501), and edge density (0.9522). However, in 2010 and 2020, the influential factors shifted to precipitation, NDVI, and temperature, mirroring the pattern observed in Jinan. In 2000, NDVI, temperature, and edge density were the main influences on FP in Jinan, but in 2010 and 2020, these shifted to precipitation, NDVI, and temperature, showing convergence with Xi’an. For SC in Xi’an, the main influencing factors in 2000 and 2020 were DEM, slope, and patch density, while in 2010, the key factors were DEM, slope, and edge density. These findings are consistent with the main influencing factors for FP in Jinan. Among all the influencing factors, population had the lowest impact on the four ESs in both Xi’an and Jinan, particularly for FP in Jinan, where the q-values were all below 0.5.
In summary, the single-factor driver analysis of each ES in Xi’an and Jinan showed that the main drivers of all three ESs except FP included edge density and patch density, which indicated that landscape fragmentation has a very important effect on ESs [61].

3.4.2. The Influence of Factor Interaction

We performed an interaction analysis to determine the interaction factor q-values for the drivers of each ES in Xi’an and Jinan (Figure 10 and Figure 11). The results indicated that the q-values for single-factor drivers were consistently lower than those for factor interactions, demonstrating that each driver exhibited a two-factor interaction enhancement.
In Xi’an, the interaction effect of edge density and patch density (0.9733) was the highest for CS in 2000, while slope and patch density (0.9671) showed the strongest interaction for CS in 2010. By 2020, the interaction effect of edge density and patch density (0.9642) remained the most significant. For Jinan’s CS, the highest interaction effect in 2000 and 2010 was between precipitation and edge density, whereas edge density and patch density (0.9642) had the highest interaction in 2020.
For Xi’an’s HQ, the interaction between temperature and patch density (0.9820) was the most pronounced in 2000, shifting to DEM and NDVI in 2010 and 2020. In Jinan, the interaction between slope and temperature (0.9782) was the highest for HQ in 2000, followed by NDVI and slope (0.9640) in 2010, and precipitation and slope (0.9629) in 2020. For FP in Xi’an, the interaction between NDVI and temperature (0.9986) was the strongest in 2000, with precipitation and temperature showing the highest interaction in both 2010 and 2020. Similarly, in Jinan, the NDVI and temperature interaction (0.9957) was the highest in 2000, consistent with the patterns observed in Xi’an. However, in 2010 and 2020, edge density showed the strongest interactions with DEM and NDVI, respectively. Finally, for SC in Xi’an, the highest interaction effects were observed between slope and patch density (0.9870) in 2000, NDVI and slope (0.9872) in 2010, and DEM and NDVI (0.9882) in 2020. In Jinan, the strongest interactions for SC were between slope and patch density (0.9910) in 2000, slope and temperature (0.9913) in 2010, and DEM and slope (0.9917) in 2020.
In summary, the interaction factor-driven analysis for the individual ESs in Xi’an and Jinan revealed that the interaction effects between edge density, patch density, and slope were notably high for CS. For HQ, significant interaction effects were observed between DEM, NDVI, and slope. In the case of FP, the interaction between temperature, NDVI, and precipitation was particularly strong. For SC, there were notable differences between Xi’an and Jinan. Notably, in Xi’an, the highest interactions occurred between DEM, NDVI, and patch density, while in Jinan, the strongest interactions were between patch density, slope, and DEM. The higher interaction effects involving patch density and edge density for CS and HQ are consistent with previous findings [62,63].

4. Discussion

4.1. Heterogeneity of ESs in Megacities from the Perspective of Resilience

In this study, we evaluated the ESs of two megacities in the Yellow River Basin, Xi’an and Jinan, from a resilience perspective. This perspective, which serves as a crucial indicator of high-quality urban development, offers a new dimension for achieving intensification, conservation, and sustainability while addressing urban challenges [64]. When analyzing the spatial and temporal distribution patterns of ESs in Xi’an and Jinan, we found that except SC, the other three low values of ESs were distributed in urban construction land concentration areas, and FP was the most obvious. This is because urban construction land does not bear any ecological function in ecosystem services, so FP in areas with intensive human activity is 0. The research conclusions of Xu W et al. [65] can support this point. In addition, the HQ high value of Xi’an is concentrated in the southern region, and the north–south difference is obvious. The high value of Jinan is more dispersed in the middle of the city. This is due to the large difference in the distribution of land types with good ecological quality, such as forest and grassland, in Xi’an and Jinan. Forests and grasslands in Xi’an are widely distributed in the southern mountainous areas, while those in Jinan are concentrated in the middle of the city. It is worth noting that the SC of Xi’an shows a relatively clear north–south distinction, and there is a large area of low SC value in the north. This indicates that the concentrated distribution of cropland and construction land has a great impact on SC. In addition, due to the existence of a large area of cropland and construction in the north of Xi’an, the vegetation type is single, and it is difficult to resist the erosion effect of rain on the surface, resulting in a low SC in the north. Jinan shows a similar pattern. This has been confirmed in previous studies [66].

4.2. What Is the Relationship Between ESs? What Are the Key Characteristics Affecting ESs?

In Xi’an, ESs generally exhibit synergistic effects across the entire area, with a clear distinction between north and south. In contrast, Jinan displayed predominantly trade-off effects among CS-FP, HQ-FP, and FP-SC, particularly in the northern region, where CS-FP and HQ-FP showed low–high clustering, and FP-SC showed high–low clustering. This northern part of Jinan, marked by the alternating distribution of cultivated and construction land with minimal ecological land, reflects how land use changes significantly impact ESs [67]. In contrast to previous studies, we highlight the heterogeneity of the spatial distribution of trade-off effects of different ESs. It was found that the trade-off effect of different ESs in Xi’an and Jinan is very different in space. Xi’an has a clearer north–south distribution difference, while Jinan shows an irregular distribution.
NDVI, temperature, and precipitation were the main factors influencing FP, with NDVI having the highest impact. NDVI, which reflects plant cover extent, is crucial for ESs [68]. However, urban sprawl has led to an increase in land types where human activity is concentrated, such as cropland and construction, resulting in lower levels of SC and HQ [69]. Therefore, FP-SC and HQ-FP appear to have obvious trade-off responses in the north of Jinan.
The primary driving factors for HQ and SC were NDVI, slope, and temperature. Sparse vegetation cover in the north and the essential role of temperature and slope for vegetation [69] growth highlight the pronounced effect of slope interacting with other factors on SC, aligning with the findings of [70]. Thus, there is a significant harmonization effect of HQ-SC in areas with less ecological land in northern Jinan and major ecological land distribution in the central region.
It is worth noting that landscape fragmentation has a great impact on CS, HQ, and SC in Xi’an and Jinan, especially in Jinan. In contrast to previous studies, we found that the effects of patch density and edge density on FP increased over time but were not very obvious. This may be because FP, unlike the other three ESs, does not depend on the concentrated distribution of cropland, forest, and grassland. This also indirectly explains the reason why FP and CS, as well as HQ and SC, have a large area of spatial uncorrelation.

4.3. Implications of Comparative Analysis of ESs Among Megacities

Our comparative analysis underscores the need to focus on the distribution patterns of various ESs in rapidly urbanizing megacities and to develop locally adapted planning strategies that reflect the distinct ecosystem conditions revealed by ES heterogeneity. Understanding the factors that contribute to the differences among cities will improve the effectiveness of these strategies, enhance resilience to complexity and uncertainty, and prevent overly broad generalizations. Additionally, landscape fragmentation resulting from anthropogenic impacts must be considered a key factor in optimizing land resource allocation. It is crucial to address the impacts of land use fragmentation on ESs, ensure high-quality land resource utilization, maintain ecological land scales and connectivity, and mitigate irreversible damage to ecosystems caused by urban expansion. To support these efforts, establishing a robust, scientific monitoring mechanism is essential. This system should dynamically assess ESs over time and across regions, enabling the timely identification and adjustment of construction projects that may affect ESs.

5. Conclusions

The main findings of this study are outlined below:
(1)
ESs are higher in the south and lower in the north of Xi’an. With the change in time, the low-value regions except SC increased. There is no clear boundary between ESs in Jinan. HQ and SC were higher in the central region and lower in the north central region. With the change in time, the low-value area increased.
(2)
Xi’an exhibited strong coordination effects among most ESs, except for CS-FP and HQ-FP. In Jinan, CS-SC, CS-HQ, and HQ-SC exhibited strong coordination, while HQ-FP and FP-SC displayed weak trade-off effects, gradually transitioning to a coordinated relationship over time.
(3)
Edge density, patch density, and NDVI significantly impacted CS in both Xi’an and Jinan. For HQ, DEM, slope, and patch density were most significant in Xi’an, while temperature, edge density, and patch density were most significant in Jinan. NDVI and temperature were key drivers of FP in both cities, whereas DEM and slope had a strong influence on SC.
Despite the valuable insights derived from this study, we also encountered some noteworthy limitations:
(1)
This study focused on megacities in the middle and lower reaches of the Yellow River Basin, excluding cities in the upstream region. Therefore, future research should include representative cities in the entire Yellow River Basin for a more comprehensive comparison.
(2)
The study’s time span extends only to 2020. Future studies could incorporate simulation and scenario predictions to assess future ES conditions and influencing factors, providing a theoretical basis for ecosystem security and sustainable urban development.
(3)
Our study focused on four ESs due to data constraints. Future research should explore additional ES types to provide a more detailed understanding of ES dynamics in the Yellow River Basin and the primary factors influencing them.
(4)
Future research could investigate the impacts of various landscape patterns, such as fragmentation, connectivity, and stability, on ES functions and conduct more in-depth mechanistic studies.
Taken together, our findings provide valuable insights for high-quality sustainable development, urban ecosystem protection, resilient city construction, and urban ES management in the Yellow River Basin.

Author Contributions

Conceptualization, B.Z. and X.T.; methodology, B.Z.; software, J.C.; validation, L.C., B.Z. and X.T.; formal analysis, J.C.; investigation, X.T.; resources, X.T.; data curation, B.Z.; writing—original draft preparation, J.C.; writing—review and editing, B.Z.; visualization, B.Z.; supervision, X.T.; project administration, X.T.; funding acquisition, X.T. All authors have read and agreed to the published version of the manuscript.

Funding

This research was supported by research funds from the National Natural Science Foundation of China, grant number 52068040, and the Education Technology Innovation Project of Gansu Province, grant number 2025CXZX-700.

Institutional Review Board Statement

Not applicable.

Informed Consent Statement

Not applicable.

Data Availability Statement

Some or all data, models, or code generated or used during the study are available from the corresponding author upon request.

Conflicts of Interest

The authors declare no conflicts of interest.

References

  1. Chang, H.; Pallathadka, A.; Sauer, J.; Grimm, N.B.; Zimmerman, R.; Cheng, C.; Iwaniec, D.M.; Kim, Y.; Lloyd, R.; McPhearson, T.; et al. Assessment of Urban Flood Vulnerability Using the Social-Ecological-Technological Systems Framework in Six US Cities. Sustain. Cities Soc. 2021, 68, 102786. [Google Scholar] [CrossRef]
  2. Yang, G.; Zhang, P.; Yu, F.; Zhu, X. A Review on Resilient Cities Research from the Perspective of Territorial Spatial Planning: A Bibliometric Analysis. Front. Ecol. Evol. 2023, 11, 1300764. [Google Scholar] [CrossRef]
  3. Folke, C.; Carpenter, S.; Elmqvist, T.; Gunderson, L.; Walker, B. Resilience: Now More than Ever: This Article Belongs to Ambio’s 50th Anniversary Collection. Theme: Anthropocene. Ambio 2021, 50, 1774–1777. [Google Scholar] [CrossRef] [PubMed]
  4. Mofrad, F.; Ignatieva, M.; Vernon, C. The Discourses, Opportunities, and Constraints in Canberra’s Green Infrastructure Planning. Urban For. Urban Green. 2022, 74, 127628. [Google Scholar] [CrossRef]
  5. Carpenter, S.; Grünewald, F. Disaster Preparedness in a Complex Urban System: The Case of Kathmandu Valley, Nepal. Disasters 2016, 40, 411–431. [Google Scholar] [CrossRef]
  6. Gumma, M.; Mohammad, I.; Nedumaran, S.; Whitbread, A.; Lagerkvist, C. Urban Sprawl and Adverse Impacts on Agricultural Land: A Case Study on Hyderabad, India. Remote Sens. 2017, 9, 1136. [Google Scholar] [CrossRef]
  7. Wu, D.; Zheng, L.; Wang, Y.; Gong, J.; Li, J.; Chen, Q. Characteristics of Urban Expansion in Megacities and Its Impact on Water-Related Ecosystem Services: A Comparative Study of Chengdu and Wuhan, China. Ecol. Indic. 2024, 158, 111322. [Google Scholar] [CrossRef]
  8. Baklanov, A.; Molina, L.T.; Gauss, M. Megacities, Air Quality and Climate. Atmos. Environ. 2016, 126, 235–249. [Google Scholar] [CrossRef]
  9. Huang, L.; Shahtahmassebi, A.; Gan, M.; Deng, J.; Wang, J.; Wang, K. Characterizing Spatial Patterns and Driving Forces of Expansion and Regeneration of Industrial Regions in the Hangzhou Megacity, China. J. Clean. Prod. 2020, 253, 119959. [Google Scholar] [CrossRef]
  10. Carlucci, M.; Salvati, L. Assessing Path-Dependent Urban Growth with Geographically Weighted Regressions. Environ. Impact Assess. Rev. 2023, 98, 106920. [Google Scholar] [CrossRef]
  11. Chen, W.; Wang, G.; Zeng, J. Impact of Urbanization on Ecosystem Health in Chinese Urban Agglomerations. Environ. Impact Assess. Rev. 2023, 98, 106964. [Google Scholar] [CrossRef]
  12. Dadashpoor, H.; Azizi, P.; Moghadasi, M. Land Use Change, Urbanization, and Change in Landscape Pattern in a Metropolitan Area. Sci. Total Environ. 2019, 655, 707–719. [Google Scholar] [CrossRef] [PubMed]
  13. Guo, S.; Jiang, L.; Shen, G.Q.P. Embodied Pasture Land Use Change in China 2000-2015: From the Perspective of Globalization. Land Use Policy 2019, 82, 476–485. [Google Scholar] [CrossRef]
  14. Yang, K.; Han, Q.; Vries, B.D. Urbanization Effects on the Food-Water-Energy Nexus within Ecosystem Services: A Case Study of the Beijing-Tianjin-Hebei Urban Agglomeration in China. Ecol. Indic. 2024, 160, 111845. [Google Scholar] [CrossRef]
  15. Shi, G.; Chen, C.; Cao, Q.; Zhang, J.; Xu, J.; Chen, Y.; Wang, Y.; Liu, J. Spatiotemporal Dynamics and Prediction of Habitat Quality Based on Land Use and Cover Change in Jiangsu, China. Remote Sens. 2024, 16, 4158. [Google Scholar] [CrossRef]
  16. Hwang, J.; Choi, Y.; Kim, Y.; No Ol, L.; Yoo, Y.-J.; Cho, H.J.; Sun, Z.; Jeon, S. Analysis of the Effect of Environmental Protected Areas on Land-Use and Carbon Storage in a Megalopolis. Ecol. Indic. 2021, 133, 108352. [Google Scholar] [CrossRef]
  17. Wen, W.; Jiang, K.; Shao, X. The Impact of Big Data Pilot Zones on Urban Ecological Resilience: Evidence from a Machine Learning Approach. Sustainability 2025, 17, 2846. [Google Scholar] [CrossRef]
  18. Zhou, M.; He, Q.; Gu, Y.; Wang, K.; Shen, Z. Urban Flood Resilience Assessment of Prefecture-Level Cities in Yangtze River Delta. ISPRS Int. J. Geo-Inf. 2025, 14, 108. [Google Scholar] [CrossRef]
  19. Costanza, R.; Hannon, B.; Limburg, K.; Naeem, S.; O’Neill, R.V.; Raskin, R.G.; Sutton, P. The Value of the World’s Ecosystem Services and Natural Capital. Nature 1997, 387, 253–260. [Google Scholar] [CrossRef]
  20. Yang, Y.; Yuan, X.; An, J.; Su, Q.; Chen, B. Drivers of Ecosystem Services and Their Trade-Offs and Synergies in Different Land Use Policy Zones of Shaanxi Province, China. J. Clean. Prod. 2024, 452, 142077. [Google Scholar] [CrossRef]
  21. Hu, H.; Yan, K.; Shi, Y.; Lv, T.; Zhang, X.; Wang, X. Decrypting Resilience: The Spatiotemporal Evolution and Driving Factors of Ecological Resilience in the Yangtze River Delta Urban Agglomeration. Environ. Impact Assess. Rev. 2024, 106, 107540. [Google Scholar] [CrossRef]
  22. Wang, S.; Li, Z.; Long, Y.; Yang, L.; Ding, X.; Sun, X.; Chen, T. Impacts of Urbanization on the Spatiotemporal Evolution of Ecological Resilience in the Plateau Lake Area in Central Yunnan, China. Ecol. Indic. 2024, 160, 111836. [Google Scholar] [CrossRef]
  23. Xu, C.; Huo, X.; Hong, Y.; Yu, C.; De Jong, M.; Cheng, B. How Urban Greening Policy Affects Urban Ecological Resilience: Quasi-Natural Experimental Evidence from Three Megacity Clusters in China. J. Clean. Prod. 2024, 452, 142233. [Google Scholar] [CrossRef]
  24. Finisdore, J.; Rhodes, C.; Haines-Young, R.; Maynard, S.; Wielgus, J.; Dvarskas, A.; Houdet, J.; Quétier, F.; Lamothe, K.A.; Ding, H.; et al. The 18 Benefits of Using Ecosystem Services Classification Systems. Ecosyst. Serv. 2020, 45, 101160. [Google Scholar] [CrossRef]
  25. Grima, N.; Jutras-Perreault, M.-C.; Gobakken, T.; Ole Ørka, H.; Vacik, H. Systematic Review for a Set of Indicators Supporting the Common International Classification of Ecosystem Services. Ecol. Indic. 2023, 147, 109978. [Google Scholar] [CrossRef]
  26. Yu, C.; Zhou, J.; Zhang, Z. Exploring the Classification of China’s Ecosystem Service Networks and Their Driving Factors Based on Current Status and Evolutionary Trends. Appl. Geogr. 2024, 168, 103321. [Google Scholar] [CrossRef]
  27. Luo, Z.; Yang, X. Interrelationships between Urbanization and Ecosystem Services in the Urban Agglomeration around Poyang Lake and Its Zoning Management at an Integrated Multi-Scale. Sustainability 2024, 16, 5128. [Google Scholar] [CrossRef]
  28. Xue, Z.; Meng, X.; Liu, B. Spatiotemporal Evolution and Driving Factors of Ecosystem Services in the Upper Fenhe Watershed, China. Ecol. Indic. 2024, 160, 111803. [Google Scholar] [CrossRef]
  29. Yang, B.; Xue, D.; Miao, P. Spatiotemporal Evolution and Driving Factors of Ecosystem Supply and Demand Bundles: A Case Study in the Sichuan-Yunnan Ecological Buffer Area, China. Sustainability 2024, 16, 4977. [Google Scholar] [CrossRef]
  30. Zhang, X.; Zheng, Z.; Sun, S.; Wen, Y.; Chen, H. Study on the Driving Factors of Ecosystem Service Value under the Dual Influence of Natural Environment and Human Activities. J. Clean. Prod. 2023, 420, 138408. [Google Scholar] [CrossRef]
  31. Liu, Q.; Qiao, J.; Li, M.; Huang, M. Spatiotemporal Heterogeneity of Ecosystem Service Interactions and Their Drivers at Different Spatial Scales in the Yellow River Basin. Sci. Total Environ. 2024, 908, 168486. [Google Scholar] [CrossRef] [PubMed]
  32. Liu, J.; Zhou, Y.; Wang, L.; Zuo, Q.; Li, Q.; He, N. Spatiotemporal Analysis and Multi-Scenario Prediction of Ecosystem Services Based on Land Use/Cover Change in a Mountain-Watershed Region, China. Remote Sens. 2023, 15, 2759. [Google Scholar] [CrossRef]
  33. Aniah, P. Determinants of Adaptation Strategies to Offset Decreasing Provisioning Ecosystem Services in the Savannah Ecological Zone of Ghana. Environ. Chall. 2024, 14, 100856. [Google Scholar] [CrossRef]
  34. Ren, Q.; Liu, D.; Liu, Y. Spatio-Temporal Variation of Ecosystem Services and the Response to Urbanization: Evidence Based on Shandong Province of China. Ecol. Indic. 2023, 151, 110333. [Google Scholar] [CrossRef]
  35. Wen, L.; Li, B.; Peng, Y.; Zhou, Y.; Weng, A.; Jin, Y.; Cai, G.; Lin, Y.; Chen, B. Exploring the Evolution of Coupled Natural-Cultural Ecosystem Services and Their Geographically Scaled Driven Modeling in a Coastal City of Southeast China. J. Environ. Manag. 2024, 361, 121265. [Google Scholar] [CrossRef]
  36. Yu, P.; Zhang, S.; Yung, E.H.K.; Chan, E.H.W.; Luan, B.; Chen, Y. On the Urban Compactness to Ecosystem Services in a Rapidly Urbanising Metropolitan Area: Highlighting Scale Effects and Spatial Non–Stationary. Environ. Impact Assess. Rev. 2023, 98, 106975. [Google Scholar] [CrossRef]
  37. An, Q.; Yuan, X.; Zhang, X.; Yang, Y.; Chen, J.; An, J. Spatio-Temporal Interaction and Constraint Effects between Ecosystem Services and Human Activity Intensity in Shaanxi Province, China. Ecol. Indic. 2024, 160, 111937. [Google Scholar] [CrossRef]
  38. Li, B.; Wang, W.; Wang, Y. Identifying the Relationships among Multiple Ecosystem Services. J. Arid Environ. 2020, 183, 104265. [Google Scholar] [CrossRef]
  39. Shi, T.; Xu, H. Study on Ecosystem Service Values of Urban Green Space Systems in Suzhou City Based on the Extreme Gradient Boosting Geographically Weighted Regression Method: Spatiotemporal Changes, Driving Factors, and Influencing Mechanisms. Land 2025, 14, 564. [Google Scholar] [CrossRef]
  40. Lu, Y.; Liu, Y.; He, H.; Chen, F.; Wang, L.; Liu, Y. Diagnosing Degradation Risks of Ecosystem Services in Wuhan, China from the Perspective of Land Development: Identification, Measurement and Regulation. Ecol. Indic. 2022, 136, 108580. [Google Scholar] [CrossRef]
  41. Fu, Y.; Lu, X.; Zhao, Y.; Zeng, X.; Xia, L. Assessment Impacts of Weather and Land Use/Land Cover (LULC) Change on Urban Vegetation Net Primary Productivity (NPP): A Case Study in Guangzhou, China. Remote Sens. 2013, 5, 4125–4144. [Google Scholar] [CrossRef]
  42. Xie, W.; Huang, Q.; He, C.; Zhao, X. Projecting the Impacts of Urban Expansion on Simultaneous Losses of Ecosystem Services: A Case Study in Beijing, China. Ecol. Indic. 2018, 84, 183–193. [Google Scholar] [CrossRef]
  43. Alamgir Hossen Bhuiyan, M.; Inostroza, L.; Nihei, T.; Sultana, M.; Louw, A.S.; Supe, H.; Chen, X.; Alsulamy, S.; Avtar, R. The Differential Impacts of the Spatiotemporal Vertical and Horizontal Expansion of Megacity Dhaka on Ecosystem Services. Curr. Res. Environ. Sustain. 2024, 7, 100252. [Google Scholar] [CrossRef]
  44. Tang, J.; Li, Y.; Cui, S.; Xu, L.; Ding, S.; Nie, W. Linking Land-Use Change, Landscape Patterns, and Ecosystem Services in a Coastal Watershed of Southeastern China. Glob. Ecol. Conserv. 2020, 23, e01177. [Google Scholar] [CrossRef]
  45. Pal, S.; Singha, P.; Lepcha, K.; Debanshi, S.; Talukdar, S.; Saha, T.K. Proposing Multicriteria Decision Based Valuation of Ecosystem Services for Fragmented Landscape in Mountainous Environment. Remote Sens. Appl. Soc. Environ. 2021, 21, 100454. [Google Scholar] [CrossRef]
  46. Wang, P.; Li, R.; Liu, D.; Wu, Y. Dynamic Characteristics and Responses of Ecosystem Services under Land Use/Land Cover Change Scenarios in the Huangshui River Basin, China. Ecol. Indic. 2022, 144, 109539. [Google Scholar] [CrossRef]
  47. Zhang, P.; Liu, L.; Yang, L.; Zhao, J.; Li, Y.; Qi, Y.; Ma, X.; Cao, L. Exploring the Response of Ecosystem Service Value to Land Use Changes under Multiple Scenarios Coupling a Mixed-Cell Cellular Automata Model and System Dynamics Model in Xi’an, China. Ecol. Indic. 2023, 147, 110009. [Google Scholar] [CrossRef]
  48. Liu, P.; Hu, Y.; Jia, W. Land Use Optimization Research Based on FLUS Model and Ecosystem Services–Setting Jinan City as an Example. Urban Clim. 2021, 40, 100984. [Google Scholar] [CrossRef]
  49. Wang, J.; Wang, W.; Zhang, S.; Wang, Y.; Sun, Z.; Wu, B. Spatial and Temporal Changes and Development Predictions of Urban Green Spaces in Jinan City, Shandong, China. Ecol. Indic. 2023, 152, 110373. [Google Scholar] [CrossRef]
  50. Kirby, M.G.; Zawadzka, J.; Scott, A.J. Ecosystem Service Multifunctionality and Trade-Offs in English Green Belt Peri-Urban Planning. Ecosyst. Serv. 2024, 67, 101620. [Google Scholar] [CrossRef]
  51. Du, J.; Gong, Y.; Xi, X.; Liu, C.; Qian, C.; Ye, B. The Study on the Spatiotemporal Changes in Tradeoffs and Synergies of Ecosystem Services and Response to Land Use/Land Cover Changes in the Region around Taihu Lake. Heliyon 2024, 10, e33375. [Google Scholar] [CrossRef] [PubMed]
  52. Chang, B.; Chen, B.; Chen, W.; Xu, S.; He, X.; Yao, J.; Huang, Y. Analysis of Trade-off and Synergy of Ecosystem Services and Driving Forces in Urban Agglomerations in Northern China. Ecol. Indic. 2024, 165, 112210. [Google Scholar] [CrossRef]
  53. Li, K.; Hou, Y.; Andersen, P.S.; Xin, R.; Rong, Y.; Skov-Petersen, H. An Ecological Perspective for Understanding Regional Integration Based on Ecosystem Service Budgets, Bundles, and Flows: A Case Study of the Jinan Metropolitan Area in China. J. Environ. Manag. 2022, 305, 114371. [Google Scholar] [CrossRef] [PubMed]
  54. Xu, J.; Ling, Y.; Sun, Y.; Jiang, Y.; Shen, R.; Wang, Y. How Do Different Processes of Habitat Fragmentation Affect Habitat Quality?—Evidence from China. Ecol. Indic. 2024, 160, 111880. [Google Scholar] [CrossRef]
  55. Peng, J.; Hu, X.; Qiu, S.; Hu, Y.; Meersmans, J.; Liu, Y. Multifunctional Landscapes Identification and Associated Development Zoning in Mountainous Area. Sci. Total Environ. 2019, 660, 765–775. [Google Scholar] [CrossRef]
  56. Benavidez, R.; Jackson, B.; Maxwell, D.; Norton, K. A Review of the (Revised) Universal Soil Loss Equation ((R)USLE): With a View to Increasing Its Global Applicability and Improving Soil Loss Estimates. Hydrol. Earth Syst. Sci. 2018, 22, 6059–6086. [Google Scholar] [CrossRef]
  57. Chen, S.; Liu, X. Spatio-Temporal Variations of Habitat Quality and Its Driving Factors in the Yangtze River Delta Region of China. Glob. Ecol. Conserv. 2024, 52, e02978. [Google Scholar] [CrossRef]
  58. Song, C.; Yang, J.; Wu, F.; Xiao, X.; Xia, J.; Li, X. Response Characteristics and Influencing Factors of Carbon Emissions and Land Surface Temperature in Guangdong Province, China. Urban Clim. 2022, 46, 101330. [Google Scholar] [CrossRef]
  59. Xu, L.; Yu, G.; He, N.; Wang, Q.; Gao, Y.; Wen, D.; Li, S.; Niu, S.; Ge, J. Carbon Storage in China’s Terrestrial Ecosystems: A Synthesis. Sci. Rep. 2018, 8, 2806. [Google Scholar] [CrossRef]
  60. Liu, C.; Wang, C.; Li, Y.; Wang, Y. Spatiotemporal Differentiation and Geographic Detection Mechanism of Ecological Security in Chongqing, China. Glob. Ecol. Conserv. 2022, 35, e02072. [Google Scholar] [CrossRef]
  61. Biswas, G.; Sengupta, A.; Alfaisal, F.M.; Alam, S.; Alharbi, R.S.; Jeon, B.-H. Evaluating the Effects of Landscape Fragmentation on Ecosystem Services: A Three-Decade Perspective. Ecol. Inform. 2023, 77, 102283. [Google Scholar] [CrossRef]
  62. Duan, X.; Chen, Y.; Wang, L.; Zheng, G.; Liang, T. The Impact of Land Use and Land Cover Changes on the Landscape Pattern and Ecosystem Service Value in Sanjiangyuan Region of the Qinghai-Tibet Plateau. J. Environ. Manag. 2023, 325, 116539. [Google Scholar] [CrossRef]
  63. Yang, Z.; Gu, T.; Zeng, Y.; Chen, W.; Zhang, X.; Pan, S. Spatially Non-Stationary Relationships between Landscape Fragmentation and Soil Conservation Services in China, 2000–2018. Ecol. Indic. 2024, 160, 111913. [Google Scholar] [CrossRef]
  64. Hsu, W.-L.; Zhuang, Z.; Li, C.; Zhao, J. Optimization of Land Use Patterns in a Typical Coal Resource-Based City Based on the Ecosystem Service Relationships of ‘Food–Carbon–Recreation’. Land 2025, 14, 661. [Google Scholar] [CrossRef]
  65. Wang, Y.; Ang, Y.; Zhang, Y.; Ruan, Y.; Wang, B. Identification of Ecological Functional Areas and Scenario Simulation Analysis of the Wanjiang Urban Belt from a Trade-Off/Synergy Perspective. Land 2025, 14, 444. [Google Scholar] [CrossRef]
  66. Qing, L.; Fan, H.; Zhang, F.; Chen, W.; Xia, Y.; Yan, B. The Dominant Role of Human Activity Intensity in Spatial Pattern of Ecosystem Health in the Poyang Lake Ecological Economic Zone. Ecol. Indic. 2024, 166, 112347. [Google Scholar] [CrossRef]
  67. Song, X.; Chen, F.; Sun, Y.; Ma, J.; Yang, Y.; Shi, G. Effects of Land Utilization Transformation on Ecosystem Services in Urban Agglomeration on the Northern Slope of the Tianshan Mountains, China. Ecol. Indic. 2024, 162, 112046. [Google Scholar] [CrossRef]
  68. Zhang, S.; Huang, C.; Li, X.; Song, M. The Spatial–Temporal Evolution and Influencing Factors of the Coupling Coordination of New-Type Urbanization and Ecosystem Services Value in the Yellow River Basin. Ecol. Indic. 2024, 166, 112300. [Google Scholar] [CrossRef]
  69. Chen, W.; Wang, G.; Gu, T.; Fang, C.; Pan, S.; Zeng, J.; Wu, J. Simulating the Impact of Urban Expansion on Ecosystem Services in Chinese Urban Agglomerations: A Multi-Scenario Perspective. Environ. Impact Assess. Rev. 2023, 103, 107275. [Google Scholar] [CrossRef]
  70. Zhang, X.; Wang, G.; Xue, B.; A, Y. Changes in Vegetation Cover and Its Influencing Factors in the Inner Mongolia Reach of the Yellow River Basin from 2001 to 2018. Environ. Res. 2022, 215, 114253. [Google Scholar] [CrossRef]
Figure 1. Location of the study area: (a) Xi’an and (b) Jinan.
Sustainability 17 03371 g001
Figure 2. Spatial and temporal distribution of ES functions in Xi’an from 2000 to 2020.
Sustainability 17 03371 g002
Figure 3. Spatial and temporal distribution of ecosystem service functions in Jinan from 2000 to 2020.
Sustainability 17 03371 g003
Figure 4. Changes in CS, HQ, FP, and SC in Xi’an and Jinan from 2000 to 2020.
Sustainability 17 03371 g004
Figure 5. Bivariate local spatial autocorrelation of CS-SC, CS-HQ, CS-FP, HQ-SC, HQ-FP, and FP-SC in Xi’an from 2000 to 2020.
Sustainability 17 03371 g005
Figure 6. Bivariate local spatial autocorrelation of CS-SC, CS-HQ, CS-FP, HQ-SC, HQ-FP, and FP-SC in Jinan from 2000 to 2020.
Sustainability 17 03371 g006
Figure 7. Trade-offs and synergies of ESs in Xi’an and Jinan from 2000 to 2020 based on Spearman correlation coefficient.
Sustainability 17 03371 g007
Figure 8. Single-factor driving capacity in Xi’an from 2000 to 2020. The variables are defined as follows: X1 represents DEM, X2 represents NDVI, X3 represents precipitation, X4 represents slope, X5 represents temperature, X6 represents population, X7 represents edge density, and X8 represents patch density.
Sustainability 17 03371 g008
Figure 9. Single-factor driving capacity histogram of Jinan from 2000 to 2020.
Sustainability 17 03371 g009
Figure 10. Interaction between driving capacity factors in Xi’an from 2000 to 2020.
Sustainability 17 03371 g010
Figure 11. Interaction between driving capacity factors in Jinan from 2000 to 2020.
Sustainability 17 03371 g011
Table 1. Carbon density of Xi’an.
Land Use TypeCarbon Density (t/hm2)
Aboveground Biomass Carbon DensitySubsurface Biomass Carbon DensitySoil Carbon DensityCarbon Density of Dead Organic Matter
Cropland4.9442.8377.263.34
Forest39.9558.89103.3818.68
Grassland3.9740.5883.2812.56
Water0.73000
Construction0.09058.670
Unused0.38031.923.42
Table 2. Carbon density of Jinan.
Land Use TypeCarbon Density (t/hm2)
Aboveground Biomass Carbon DensitySubsurface Biomass Carbon DensitySoil Carbon DensityCarbon Density of Dead Organic Matter
Cropland17.1480.72108.439.82
Forest42.4115.98158.8314.11
Grassland35.386.5499.947.28
Water0.31000
Construction2.5327.6700
Unused1.32021.650
Table 3. Sensitivity of different land use types to habitat threats.
Xi’anJinan
Land Use TypeHabitat SuitabilityThreatsHabitat SuitabilityThreats
CroplandConstructionUnusedCroplandConstructionUnused
Cropland0.300.60.70.400.80.5
Forest10.60.50.710.60.80.5
Grassland0.80.50.70.60.70.50.80.8
Water0.90.60.40.80.60.60.60.4
Construction00000000
Unused00.20.2000.20.20
Table 4. Threat factor parameter.
Xi’anJinan
Threat FactorsInfluence Distance (km)WeightSpatial Decay TypeInfluence Distance (km)WeightSpatial Decay Type
Cropland40.6linear80.6linear
Construction80.8linear121linear
Unused40.5linear50.4linear
Disclaimer/Publisher’s Note: The statements, opinions and data contained in all publications are solely those of the individual author(s) and contributor(s) and not of MDPI and/or the editor(s). MDPI and/or the editor(s) disclaim responsibility for any injury to people or property resulting from any ideas, methods, instructions or products referred to in the content.

