Abstract
Enhancing the green production efficiency of cotton contributes significantly to achieving carbon neutrality and agricultural sustainability. Based on county-level panel data from 2002 to 2020 and daily average temperature and precipitation data from 53 meteorological stations in Xinjiang, this study employs a non-desirable output super-efficiency slack-based measure model, the Malmquist index, and Moran’s index to analyze the temporal and spatial changes in the green production efficiency of cotton across counties in Xinjiang. From a dynamic evolution perspective, without considering non-desirable outputs, the overall cotton production efficiency at the county level exhibits an upward trend; however, when non-desirable outputs are taken into account, the green production efficiency of cotton shows a declining trend, with a general convergence trend among counties (cities). From 2002 to 2020, the overall green production efficiency of cotton in Xinjiang counties decreased from 0.531 to 0.442, with an annual average decline rate of −0.882%. Spatially, as temperatures rise in northern Xinjiang and rainfall increases in the west, high-value areas for cotton green production efficiency have shifted northward and westward, transforming the spatial distribution pattern from “high in the south and low in the north” to “high in the north and low in the south”. The spatial clustering effect among counties is significant, exhibiting a “clustered distribution” pattern. To improve the green production efficiency of cotton, it is recommended to promote ecological protection efforts, disseminate advanced agricultural technologies, implement differentiated strategies, leverage spatial clustering effects, and strengthen theoretical and technological research.
1. Introduction
The 20th National Congress of the Communist Party of China (CPC) proposed to actively address climate change and advance carbon peaking, pollution reduction, afforestation, and economic growth in a coordinated manner, pursuing development that is resource-saving, intensive, green, and low carbon. This aims to foster harmonious coexistence between humanity and nature and achieve sustainable agricultural development. However, in recent years, the intensification of climate change has introduced many uncertainties into the cotton production process, significantly impacting the sustainable production of cotton [1,2,3]. As the world’s largest consumer and importer of cotton and the second-largest producer, China’s cotton industry plays crucial roles in both national economic development and the global cotton market [4]. Therefore, studying the green production efficiency of cotton under the backdrop of climate change holds significant importance.
Existing studies have demonstrated that cotton production is highly dependent on climatic conditions, and the impacts of climate change on cotton production are primarily reflected in three aspects. Firstly, climate change has led to a northward shift and expansion of areas suitable for cotton cultivation. Research indicates that under the influence of climate change, cotton planting regions initially showed a trend of migrating toward the northern Yellow River basin, subsequently expanding further into the northwest region and eventually establishing Xinjiang’s dominant position in cotton production [5,6,7,8]. Secondly, climate change significantly affects the growth and development cycles of cotton. Under the backdrop of climate change, the growing season for cotton has shown a clear trend of extension. Specifically, there is a tendency for its sowing date, emergence date, squaring date, flowering date, and boll opening date to advance, while the harvest date tends to be delayed [9,10,11,12]. Thirdly, climate change will have impacts on water, heat, and other conditions during the growth period of cotton. During its growth and development phases, essential conditions for cotton, such as temperature, humidity, light, and the CO2 concentration, are altered due to climate change, thereby affecting its growth [13,14,15,16]. Due to differences in study regions, study periods, and other factors, the academic community has not yet reached a consensus on the direction of the impact of climate change on cotton production, but almost all studies agree that climate change has a significant impact on cotton production.
In the context of the above realities and academic backgrounds, regardless of whether cotton production benefits from or is harmed by climate change, ignoring its impact will lead to biases in the assessment of cotton’s green production efficiency. Therefore, when constructing an evaluation index system for cotton’s green production efficiency, it is essential to incorporate climate factors—a consideration often overlooked in previous studies. Based on this, this paper integrates daily temperature and precipitation records from meteorological stations with socio-economic datasets to examine the spatiotemporal variations in the green production efficiency of cotton, taking into account the influence of climatic factors. Additionally, given that China joined the World Trade Organization (WTO) in 2001, this study analyzes changes in cotton production from 2002 to 2020, focusing on trends and characteristics following China’s accession to the WTO.
2. Materials and Methods
2.1. Study Area
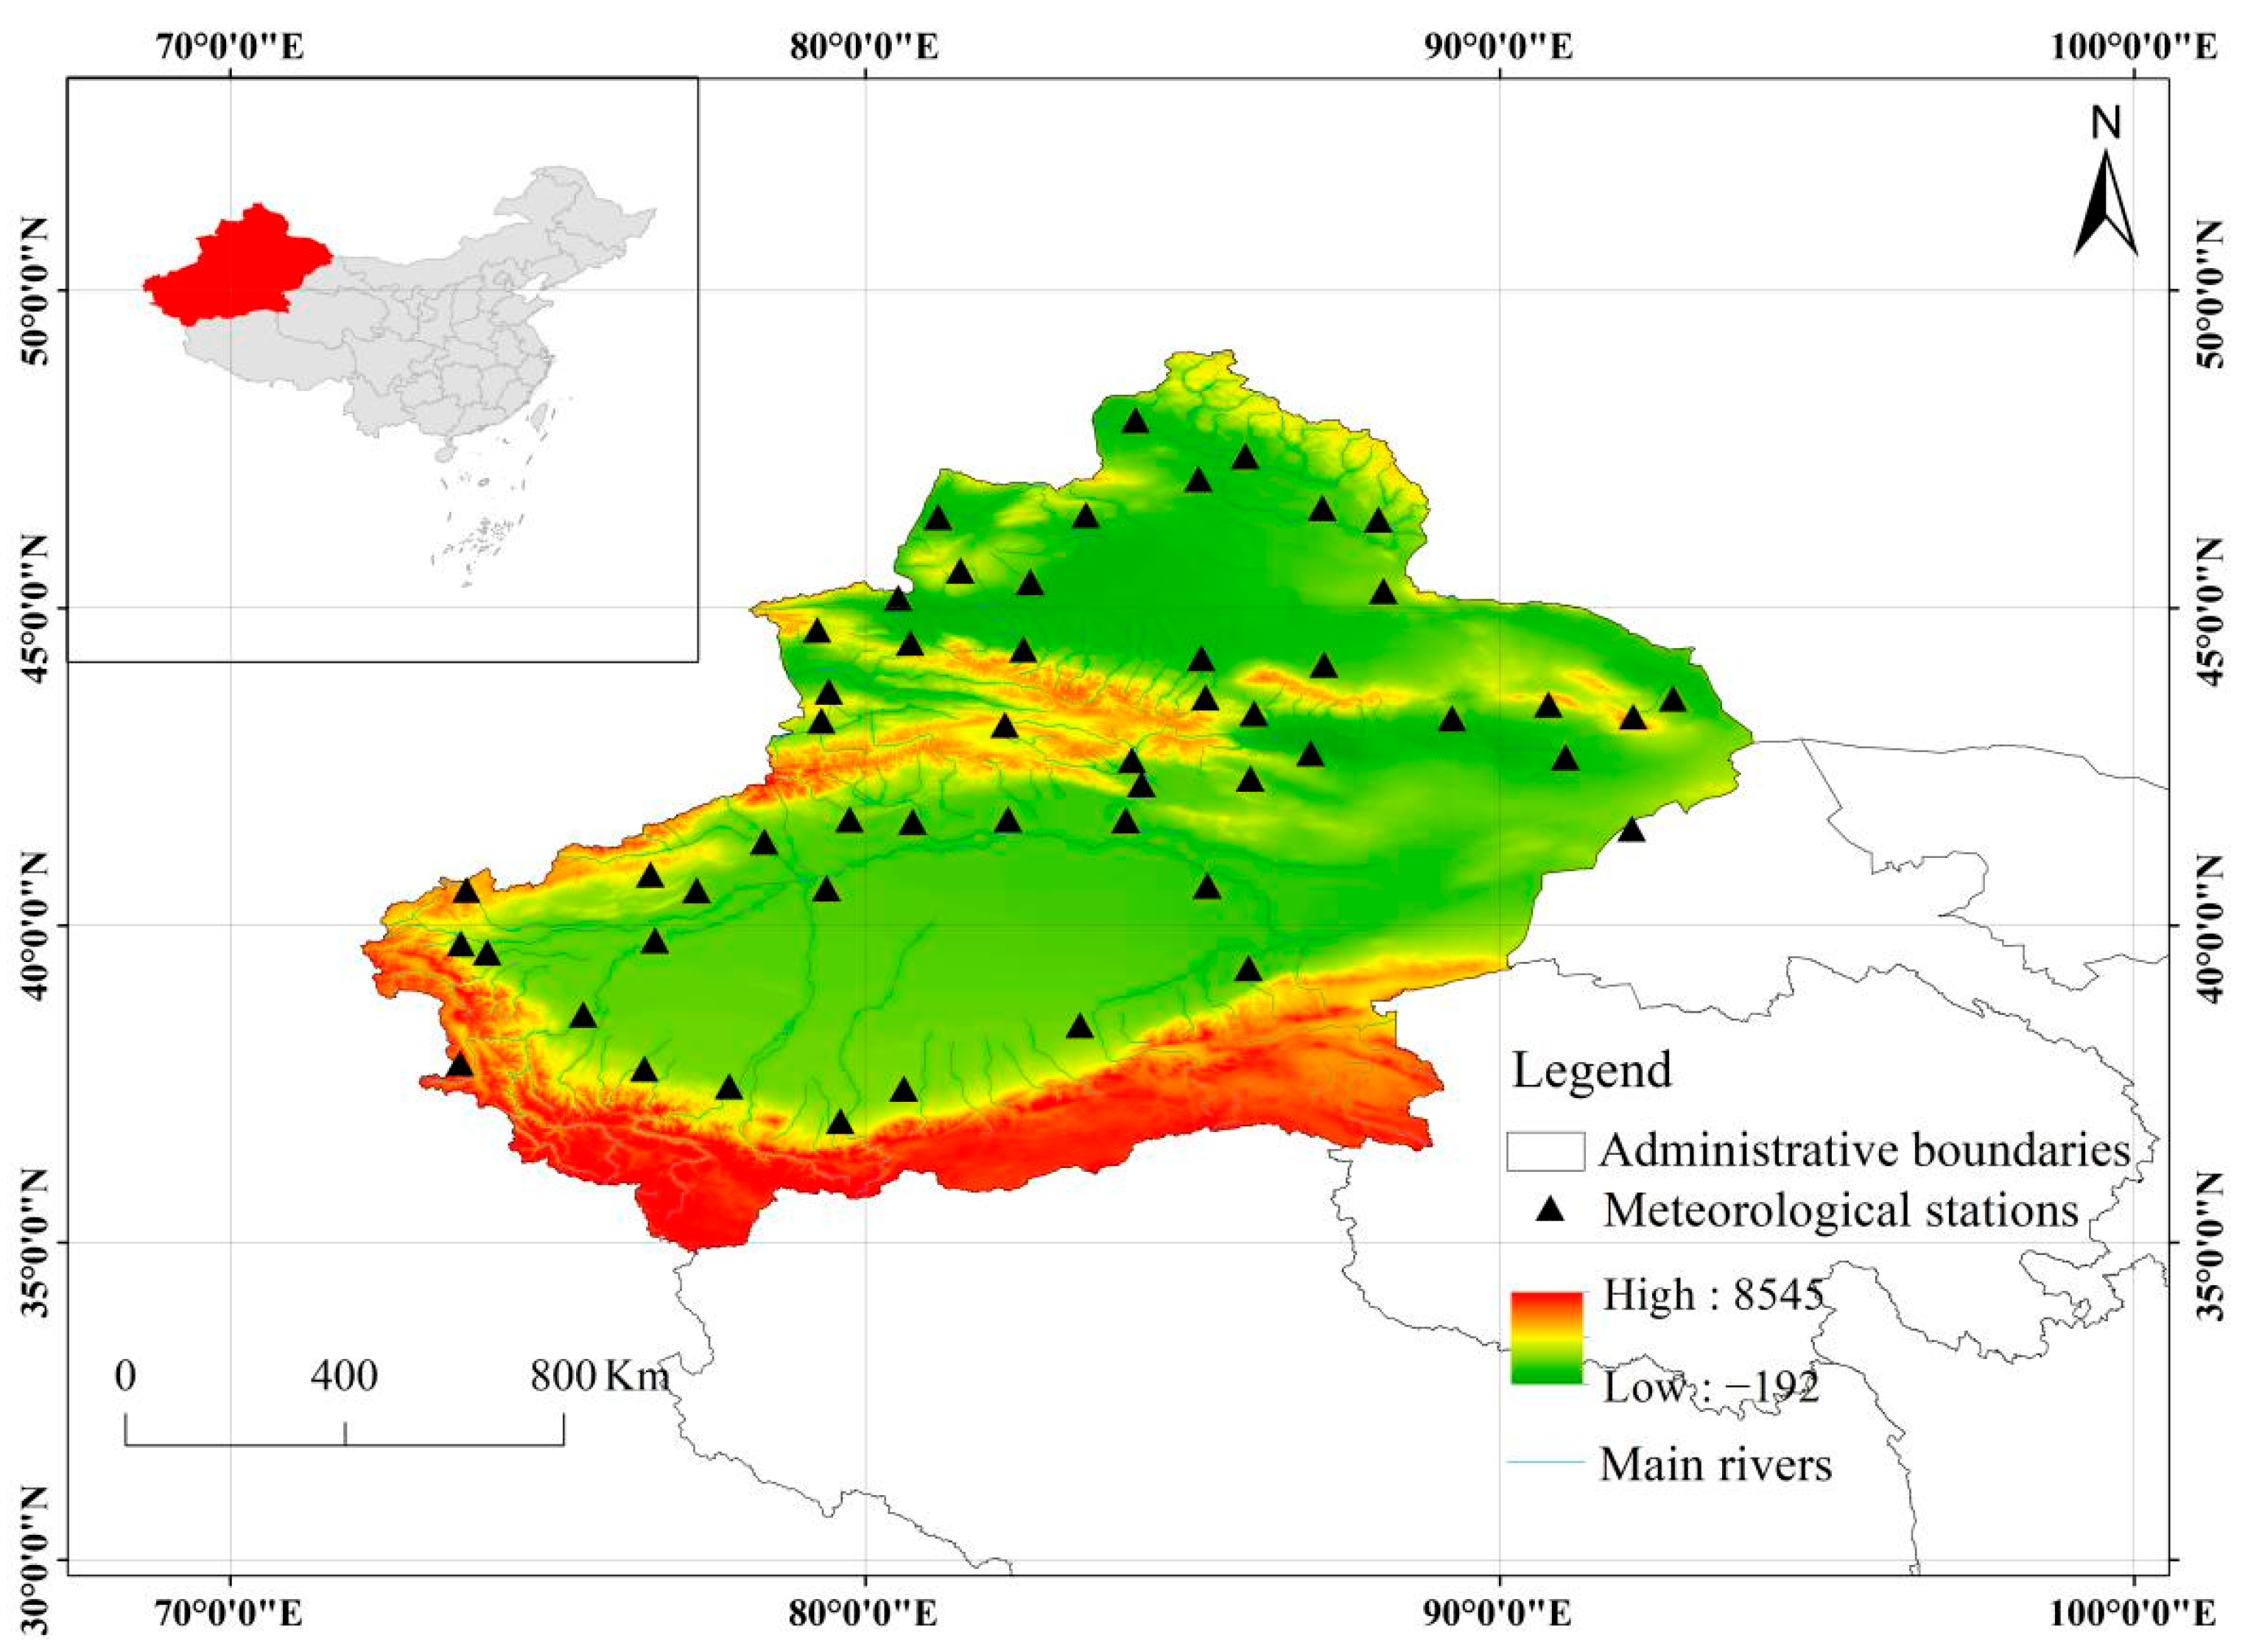
Xinjiang, located in the northwest border region of China and the heart of the Eurasian continent (73°20′ E to 96°25′ E, 34°15′ N to 49°10′ N), covers one-sixth of China’s total land area, making it the largest of China’s provincial-level administrative regions [17] (Figure 1). The region features a complex topography that includes high mountains, basins, rivers, lakes, deserts, Gobi plains, and oases [18]. Xinjiang has a temperate continental arid climate, with an annual average temperature ranging from 6.2 °C to 9.0 °C and annual precipitation between 93.2 mm and 205.8 mm [19]. It benefits from abundant light and heat resources but suffers from low rainfall and high evaporation rates, making it one of China’s most climate-sensitive and ecologically vulnerable areas [20]. Thanks to its unique geographical and climatic conditions, advancements in science and technology, and strong national policy support, Xinjiang achieved remarkable success in cotton production [18,21]. In 2022, Xinjiang planted cotton on 2.5 million hectares, accounting for 83.2% of the national planting area, with a total output of 5.394 million tons, representing 90.2% of the national total. The yield reached 2016.0 kg per hectare, the highest in the country [21]. In 2023, the total cotton production was 5.112 million tons, exceeding 90.0% of the national total, establishing Xinjiang’s position as China’s most important cotton-producing region [22].

Figure 1.
Research area.
2.2. Methods
This study employs the undesirable output super-efficient SBM (slack-based measure) model to calculate the green production efficiency of cotton. This model is capable of simultaneously addressing efficiency evaluation issues involving both desirable and undesirable outputs, and it overcomes the limitation of the traditional efficiency value being capped at 1, thereby enabling more precise differentiation and ranking. To further analyze the underlying mechanisms of efficiency evolution, this study also utilizes the Malmquist index to examine the dynamic temporal changes in cotton green production efficiency. Additionally, Moran’s I index is applied to analyze the spatial agglomeration characteristics of cotton green production efficiency, thereby constructing a three-dimensional analytical framework encompassing “static efficiency, dynamic evolution, and spatial association”.
2.2.1. Undesirable Output Super-Efficiency Slack-Based Measure Model
The undesirable output super-efficiency slack-based measure model is an advanced data envelopment analysis method used to evaluate the efficiency of multiple decision-making units. Taking into account undesirable outputs, it provides a refined measurement of production efficiency by considering the excess or shortage of inputs and outputs [23]. By introducing the undesirable output super-efficiency slack-based measure model, the purpose is to measure the green production efficiency of cotton in various counties and cities in Xinjiang. The formulas are as follows [24]:
In the formula, λj ≥ 0, where i = 1, 2, …, m; j = 1, 2, …, n; s = 1, 2, …, r1; and q = 1, 2, …, r2. Here, ρ represents the green production efficiency of cotton; n stands for the number of decision-making units; m represents the inputs; r1 represents the desirable outputs; r2 represents the undesirable outputs; x represents the elements in the input matrix; yd represents the elements in the desirable output matrix; and yu represents the elements in the undesirable output matrix.
2.2.2. Malmquist Index
The Malmquist index is a commonly used indicator in economics to measure the dynamic changes in production efficiency, allowing for the calculation of the degree of change in efficiency from period t to period t + 1. By introducing the Malmquist index, the objective is to assess the temporal variations in the green production efficiency of cotton [25]. The formulas are as follows:
In the formulas, (xt, yt) represents the input–output vector of cotton green production at period t; (xt + 1, yt + 1) represents the input–output vector of cotton green production at period t + 1; denotes the distance function at period t; and denotes the distance function at period t + 1.
MI (Malmquist index) stands for the Malmquist productivity index from period t to period t + 1. A value greater than 1 indicates an increase in productivity; a value equal to 1 indicates no change in productivity; and a value less than 1 indicates a decrease in productivity [26].
TC (Technical Change) represents technological progress or regression; EC (Efficiency Change) reflects changes in overall technical efficiency; PEC (Pure Efficiency Change) represents changes in pure technical efficiency; and SEC (Scale Efficiency Change) reflects changes in the degree of scale. Values greater than 1 indicate an improvement in the indicator compared to the previous stage; values equal to 1 indicate that the indicator remains consistent with the previous stage; and values less than 1 indicate a decrease in the indicator compared to the previous stage [27].
2.2.3. Moran’s I
- (1)
- Global Moran’s I
The Global Moran’s I is a statistical indicator that measures the global spatial autocorrelation of geospatial data. It is used to analyze whether the spatial distribution of cotton green production efficiency across counties (cities) in Xinjiang exhibits clustering, randomness, or uniformity [28]. The formula for calculating the Global Moran’s I is as follows:
N represents the number of counties (cities) in Xinjiang; xi and xj represent the observed values of the geographical attribute for the ith and jth counties (cities), respectively; is the average value of the geographical attribute for all counties (cities) in Xinjiang; wij is an element in the spatial weight matrix reflecting the spatial relationship or proximity between spatial units i and j; W is the sum of all spatial weights; and I is the value of the Global Moran’s I.
If I > 0, it indicates a positive spatial correlation, meaning that similar values tend to cluster together; if I < 0, it indicates a negative spatial correlation, meaning that different values tend to be adjacent; and if I = 0, it indicates that the attribute data are randomly distributed spatially [28].
- (2)
- Local Moran’s I
The Local Moran’s I serves as a supplement to the Global Moran’s I and is used to identify the spatial autocorrelation characteristics of cotton green production efficiency across counties (cities) in Xinjiang. Specifically, it can pinpoint which specific areas in the data exhibit significant spatial clustering or dispersion patterns. In this paper, the Local Moran’s I is employed to identify regions with high values clustering with high values (high–high clusters) and low values clustering with low values (low–low clusters) in terms of cotton green production efficiency [29]. The formulas are as follows:
Ii represents the Local Moran’s I for the ith spatial unit; S2 denotes the sample variance; and the meanings of the other symbols are the same as those in the Global Moran’s I.
2.3. Indices and Data
2.3.1. Study Period
Since China joined the World Trade Organization (WTO) in 2001, cotton production has undergone a series of adjustments and gradually exhibited more stable patterns of change [30]. Therefore, this study selects 2002 as the starting year for the analysis to more accurately observe and evaluate the trends and characteristics of cotton production following China’s accession to the WTO. Given that the latest available data are from 2020, this study concludes with data up to 2020.
2.3.2. Input Indices
Multiple studies have demonstrated that temperature and precipitation significantly influence cotton production [5,6,7,8,9,10,11,12,13,14,15,16]. This study adopts the method used by Gao, M. to handle climatic variables, selecting temperature and precipitation as the two indicators affecting the green production efficiency of cotton in Xinjiang [31]. Meteorological data are sourced from the China Meteorological Administration (Accessed on 6 June 2024). The meteorological database includes daily meteorological data recorded by 53 observation stations covering Xinjiang, specifically daily average temperatures and daily precipitation amounts. Following the matching method proposed by Shuai, C. [32], this study connects county-level databases with meteorological databases based on the shortest spatial distance between the county center coordinates and meteorological station coordinates.
General input indicators typically refer to various input factors related to cotton production or processing, excluding climatic factors. In this study, land, labor, machinery, electricity, and fertilizer are selected as general input variables [31,33,34,35,36,37,38,39,40,41]. Fertilizer is included while pesticides are excluded from the general input indicators for two main reasons: ① Pesticides and fertilizers play distinct roles in cotton production. Fertilizers primarily provide essential nutrients to plants, directly promoting crop growth and development, whereas pesticides are mainly used to control pests and diseases, protecting crops from damage. ② Pesticide usage data in Xinjiang’s statistical yearbooks are not continuous, and their availability and stability are relatively poor. Including pesticides in the input indicator system might negatively impact the overall data quality due to discontinuity and volatility. Electricity is included in the general input indicators primarily because of the specific agricultural context in Xinjiang. As a large agricultural region with relatively scarce labor resources, electricity has become an indispensable substitute and supplement in cotton cultivation.
2.3.3. Output Indices
Cotton yield is used as the desirable output. Missing values were filled using a combination of linear interpolation and trend fitting methods. For data with fewer missing values and stable variation trends, linear interpolation was used to fill in the gaps. In cases where data were missing for an extended period or where two or more consecutive data points were missing, trend fitting was applied to estimate the missing values. To ensure the reasonableness of the interpolation methods, the mean values of the data before and after interpolation were compared. If the difference between the means was less than 5%, it was considered that the interpolation method did not significantly alter the overall distribution characteristics of the data. Additionally, to improve data quality, county-level samples with more than 10% missing values were excluded, further ensuring the reliability of the data and the robustness of the analysis results.
In agricultural production processes, the primary factors contributing to carbon emissions primarily include the use of agricultural chemicals and farmland management activities [42]. According to the climate input indicators employed in this study, the main sources of carbon emissions are fertilizer input and land use. Given the limitations of data availability and continuity, this study selects the fertilizer application rate as a indicator of carbon emissions from agricultural chemical use and the irrigation area as a proxy indicator for a key aspect of farmland management activities. With reference to the research conducted by Hui, Y. and Fawen, Y. [42], the carbon emission coefficients for fertilizer application and irrigation area are 0.8956 (kg/kg) and 312.6 (kg/km2), respectively. The specific indicators selected are shown in Table 1.

Table 1.
Input and output Indicators.
3. Results
3.1. Analysis of Temporal Changes in Cotton Green Production Efficiency
3.1.1. Characteristics of the Temporal Variation in the Green Production Efficiency of Cotton
- (1)
- Despite an Upward Trend in Cotton Production Efficiency, Green Production Efficiency Exhibited a Downward Trajectory.
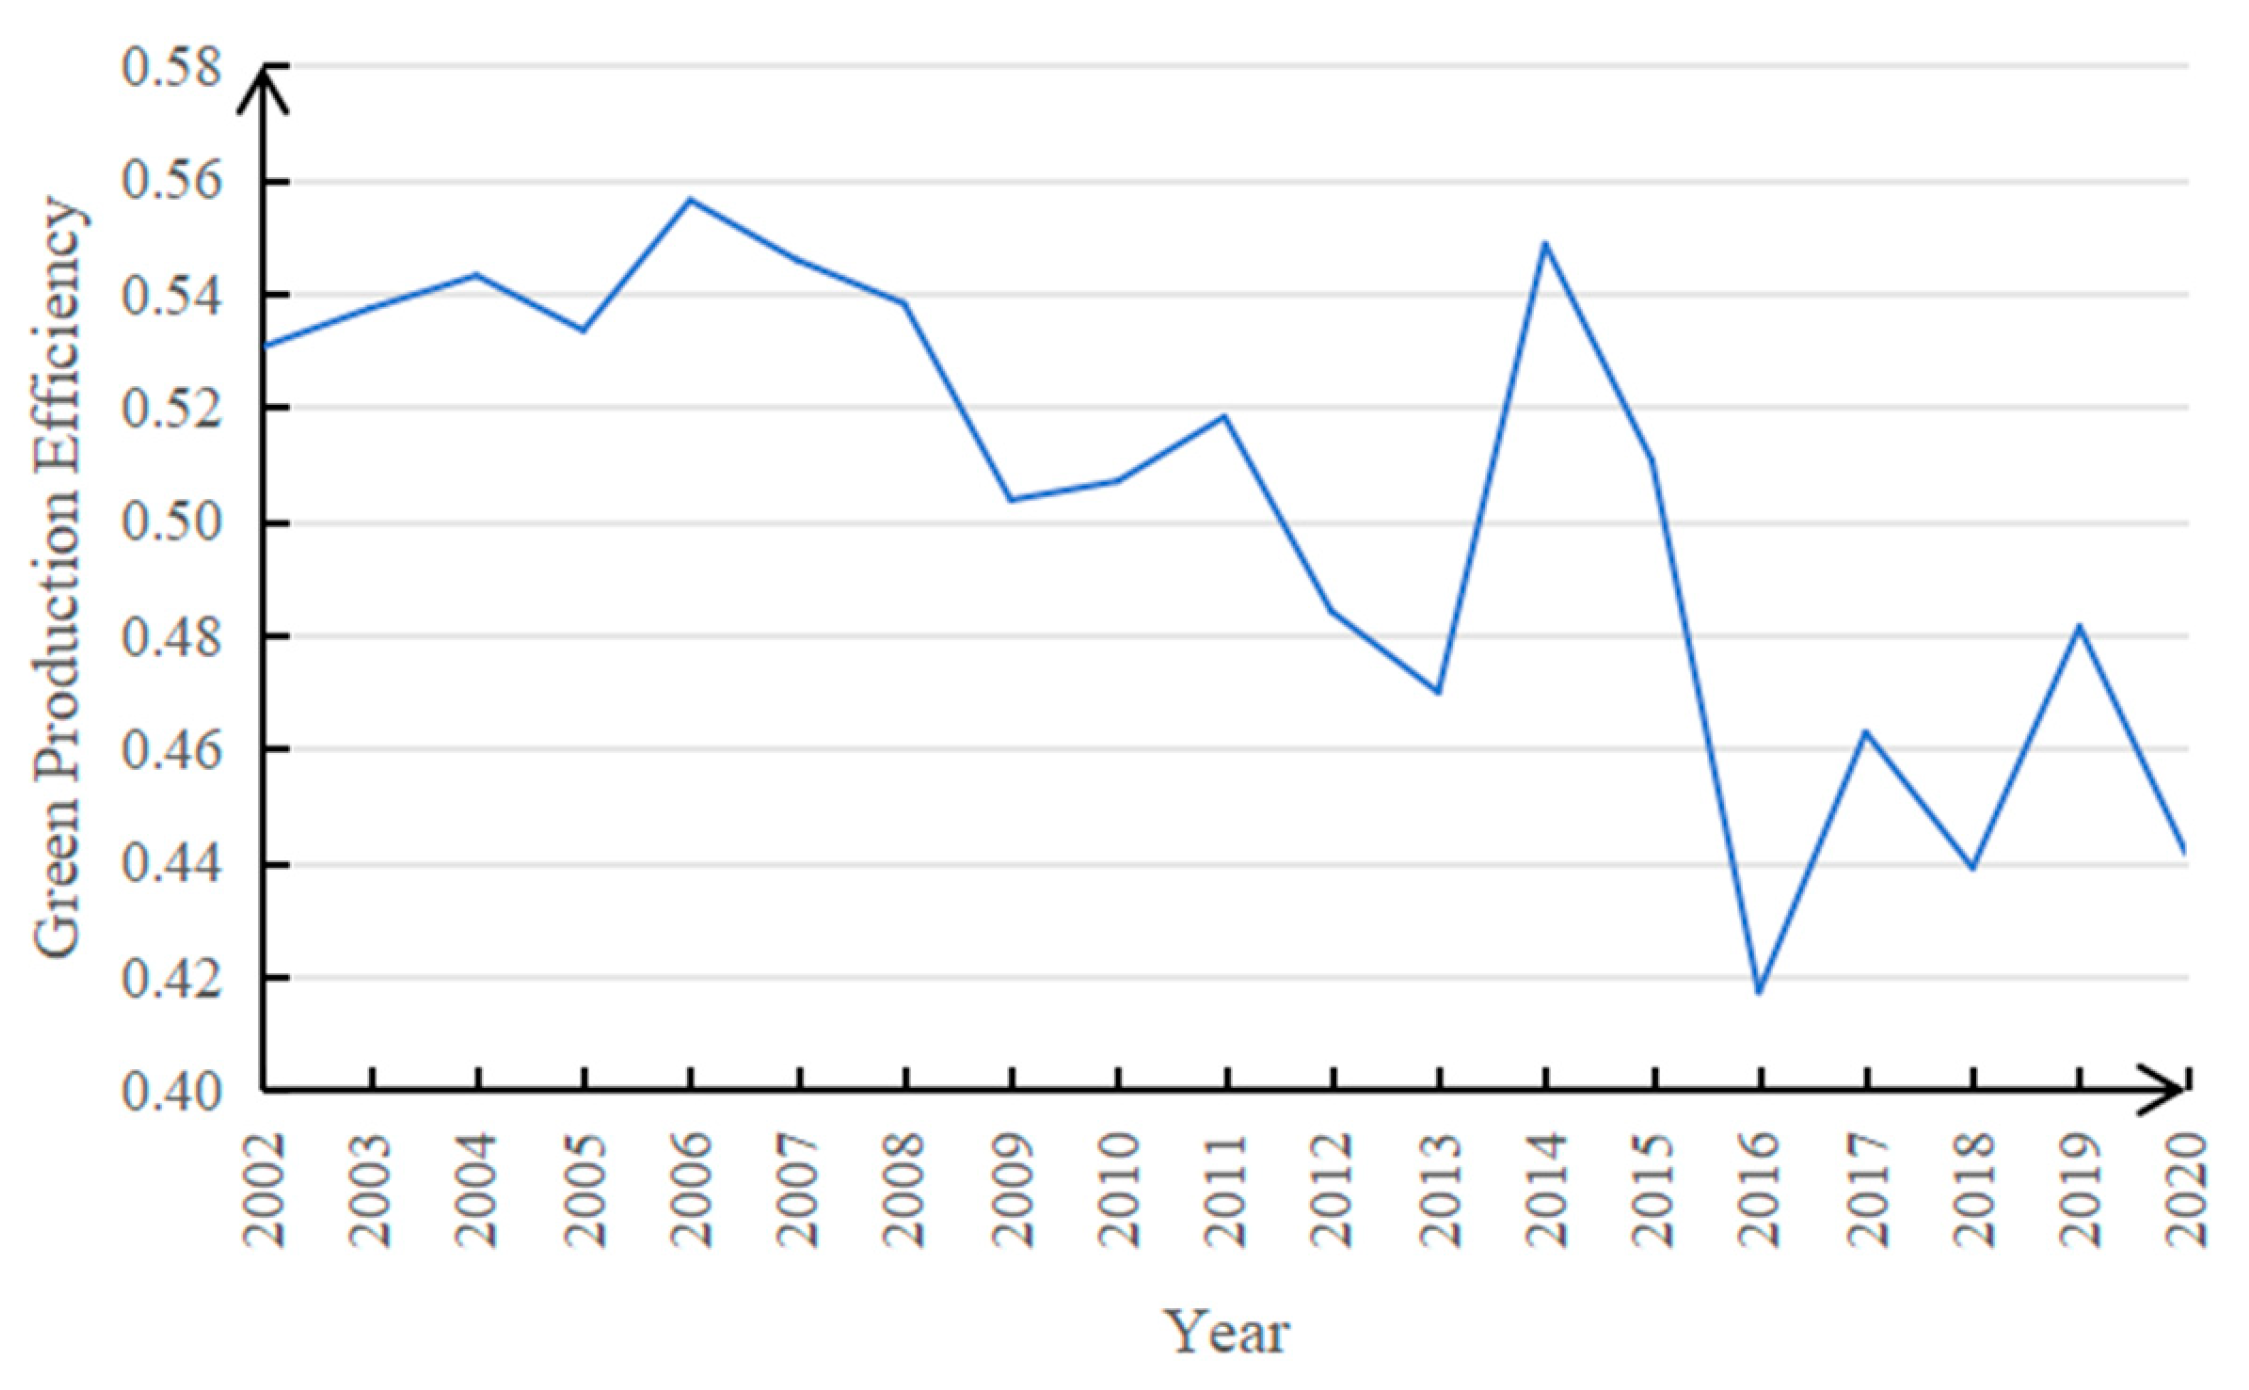
As shown in Figure 2, despite a sharp increase in Xinjiang’s green cotton production efficiency to 0.549 in 2014, which remained relatively stable between 2016 and 2020, the overall trend of green production efficiency from 2002 to 2020 exhibited a downward trajectory. This notable surge in 2014 coincided with the implementation of the “Cotton Target Price Reform Pilot” policy in Xinjiang. Although primarily aimed at adjusting price mechanisms and securing farmers’ incomes, this policy indirectly enhanced green production efficiency by motivating improvements in production efficiency, facilitating adjustments in planting structures, and guiding market orientation. Between 2016 and 2020, the Chinese government actively promoted green agricultural development through various measures, including reducing fertilizer usage, enhancing efficiency, and advancing ecological agriculture, all of which were aimed at fostering sustainable development within the cotton industry. These initiatives indirectly or directly contributed to stabilizing and improving green production efficiency. However, the average green production efficiency for cotton in Xinjiang declined from 0.531 in 2002 to 0.442 in 2020, with an annual average decline rate of −0.882%. The decline could be attributed to farmers’ intensive use of chemical fertilizers and other agricultural chemicals in pursuit of higher yields and production efficiency. This practice resulted in soil degradation and environmental pollution, both of which are detrimental to green cotton production.
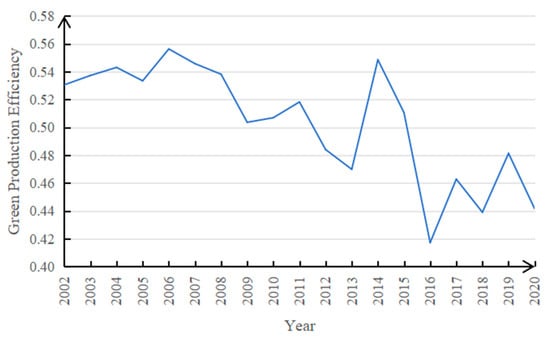
Figure 2.
Characteristics of changes in the green production efficiency of cotton in Xinjiang.
- (2)
- Decreasing Disparities in Green Production Efficiency Among Counties (Cities).
Appendix A summarizes the green cotton production efficiency values of 52 counties in Xinjiang. As shown in Appendix A, from 2002 to 2020, the changes in green cotton production efficiency across Xinjiang’s counties (cities) exhibited both significant regional differences and certain unified trends. The green cotton production efficiency values of Wusu City, Jinghe County, Yuli County, and Shaya County were all above one, indicating that these regions were able to maintain high cotton yields while effectively controlling or reducing adverse environmental impacts. The efficiency values of 20 counties (cities), including Balikun Kazak Autonomous County, showed a significant increase, reflecting a marked improvement in their green production levels. Among them, five key areas—Hutubi County, Shawan City, Korla City, Luntai County, and Keping County—broke through the critical threshold, raising their efficiency values from below one to above one. In contrast, the green cotton production efficiency values of 28 counties, including Shanshan County, showed a declining trend, indicating that these regions faced significant challenges in transitioning to green production.
3.1.2. Dynamic Analysis of Green Efficiency Changes in Cotton Production in Xinjiang
- (1)
- Instability in the Change in the Green Production Efficiency of Cotton.
According to Table 2, from 2002 to 2020, the MI, EC, and TC in Xinjiang were 0.948, 0.969, and 0.994, respectively, all of which were less than one. This indicated that although the overall performance of cotton production in Xinjiang was close to the optimal state, there was still room for improvement. The value of MI (0.948) indicated that there was still some room for improvement in the average efficiency of cotton production in Xinjiang from 2002 to 2020, that is, it had not reached the optimal state. EC (0.969) indicated that although cotton production in Xinjiang had relatively high technological application, it had not yet reached a fully effective state, reflecting certain resource waste or unrealized technological potential. TC (0.994) was very close to one, which showed that Xinjiang’s cotton production had achieved considerable technological progress, but there was still room for improvement. PEC (1.003) was greater than one and greater than SEC (0.969), indicating that during the inspection period, the production unit’s performance in improving technology utilization and management efficiency surpassed its ability to adjust the production scale for a more optimal scale. The production unit achieved greater efficiency gains through improvements in internal technology and management efficiency. All of the MI, EC, and TC values showed a fluctuating downward trend, indicating that the development speed of green production efficiency in cotton was slowing down. This slowdown is related to the fragile ecological environment in Xinjiang, and a suitable green development path should be established to alleviate the contradiction between economic development and environmental protection, thus enabling the steady and continuous improvement of green cotton production efficiency.
Table 2.
The county-level Malmquist indices and their decompositions for each year in Xinjiang.
- (2)
- Divergence in the Green Production Efficiency of Cotton Across Various Counties (Cities).
Appendix B summarizes the Malmquist indices and their decompositions for cotton of 52 counties in Xinjian. As shown in Appendix B, from the perspective of MI, from 2002 to 2020, 19 counties (cities), including Bohu County, had MI values greater than one, indicating that these regions have generally achieved positive growth in production efficiency and achieved positive results in agricultural economic development. From the perspective of TC, 26 cities, including Awati County, had TC values greater than one, reflecting their significant progress and positive achievements in technological innovation. From the perspective of EC, the EC values of 22 counties (cities), including Bohu County, were greater than one. Breaking down the EC, the PEC was generally better than the SEC, indicating that compared to the problem of economies of scale, each county (city) in Xinjiang has more effectively utilized existing resources at the current level of technology.
3.2. Analysis of the Spatial Pattern of Cotton Green Production Efficiency
3.2.1. Overall Spatial Characteristics of Cotton Green Production Efficiency
As shown in Figure 3, ARCGIS 10.7 software was used to generate spatial distribution maps of cotton green production efficiency. The natural breaks classification method was applied to categorize the efficiency levels into five classes: low efficiency, sub-low efficiency, medium efficiency, sub-high efficiency, and high efficiency. Spatial distribution maps for cotton green production efficiency in Xinjiang counties (cities) were created for six selected time points: 2002, 2006, 2010, 2014, 2018, and 2020.
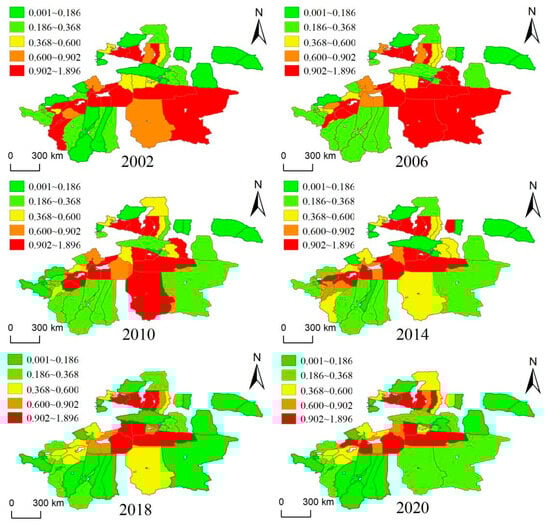
Figure 3.
Map of the distribution of the green production efficiency of cotton in the counties (cities) of Xinjiang.
- (1)
- The distribution characteristics of high-value counties (cities) and low-value counties (cities) are apparent.
Counties (cities) with a high cotton green production efficiency are mainly concentrated in the southern part of northern Xinjiang and in southern Xinjiang. The southern region of northern Xinjiang boasts richer thermal resources necessary for cotton growth compared to its northern counterpart. Southern Xinjiang, characterized by its vast territory and sparse population, boasts large planting areas and a relatively flat and open terrain, which facilitates the operation, circulation, and large-scale management of agricultural machinery, thus contributing to a higher cotton green production efficiency. However, southern Xinjiang is inherently water-scarce. The long-term continuous planting of cotton and excessive use of chemical fertilizers have led to soil salinization, impacting soil health and cotton quality, and consequently reducing green production efficiency.
Low-value counties (cities) are primarily clustered in the northern part of northern Xinjiang, the southern part of southern Xinjiang, and eastern Xinjiang. In the northern part of northern Xinjiang, the winters are colder, the spring warming is delayed, and there is a high risk of frost, which not only affects the sowing and growth cycle of cotton but may also shorten the growing season, impacting both yield and quality. Although southern Xinjiang enjoys abundant sunshine overall, some southern regions face more extreme drought and high temperatures, with extremely scarce water resources and a high degree of dependence on groundwater. The long-term continuous cropping of cotton has caused soil salinization and ecological degradation, affecting green production. In eastern Xinjiang, spring winds and sandstorms are frequent, which are detrimental to seedling preservation. Additionally, the region experiences numerous hot summer days and frequent dry and hot winds, resulting in severe cotton boll shedding. Furthermore, the soil and moisture conditions are less ideal compared to other cotton-growing regions, hindering the efficient use of resources (Page 192 of Volume 30 in General Chronicles of Xinjiang: Agricultural Chronicles).
- (2)
- The green production efficiency is gradually transitioning from a pattern of “high in the south and low in the north” to “high in the north and low in the south”.
Between 2002 and 2020, Shawan City in northern Xinjiang improved from sub-high efficiency to high efficiency, while Hutubi County also rose from medium efficiency to high efficiency. Hoboksar Mongol Autonomous County, Changji City, and Fukang City saw improvements from low efficiency and sub-low efficiency, respectively, to medium efficiency, demonstrating a trend of high-efficiency cities radiating and driving their surrounding counties (cities) to gradually enhance cotton green production efficiency. In southern Xinjiang, Aksu City fell from high efficiency to sub-high efficiency; Bachu County, Jiashi County, and Xinhe County declined from high efficiency to medium efficiency; while Yecheng County, Zepu County, Shache County, and Ruoqiang County dropped from high efficiency to sub-low efficiency. Meanwhile, Keping County and Luntai County in southern Xinjiang rose from medium efficiency to high efficiency; Kuche City improved from medium efficiency to sub-high efficiency; and Hejing County and Bohu County increased from low efficiency to sub-low efficiency. This indicates that while the high-efficiency areas for green production in southern Xinjiang are contracting toward the north and west, the high-efficiency cities in the northern counties (cities) of southern Xinjiang are radiating and driving the development of surrounding counties (cities). The dynamic changes in various counties (cities) suggest that as temperatures rise in northern Xinjiang and rainfall increases in the west, the high-efficiency areas for green production in Xinjiang are also showing a characteristic of shifting northward and westward.
3.2.2. Spatial Correlation of Cotton Green Production Efficiency
- (1)
- Global Spatial Autocorrelation Analysis
According to Table 3, the global Moran’s I values for cotton green production efficiency in Xinjiang from 2002 to 2020 were all positive, ranging between 0.095 and 0.284, with Z-values greater than 1.055. Except for the years 2012, 2014, and 2015, all other years had passed the significance test. This indicates that the cotton green production efficiency of various counties (cities) in Xinjiang exhibits positive spatial autocorrelation in spatial distribution, meaning that high-value counties (cities) and low-value counties (cities) are geographically adjacent to each other.
Table 3.
Moran’s I values for the green production efficiency of cotton in the counties (cities) of Xinjiang.
Further analysis revealed that the global Moran’s I values for cotton green production efficiency across counties and cities in Xinjiang exhibited a characteristic of initially rising, then declining, and subsequently rising again, indicating that the degree of spatial correlation was unstable. From 2002 to 2010, the global Moran’s I increased and reached its maximum value. During this period, modern agricultural technologies and green production practices (such as drip irrigation technology and biological control) were widely adopted across counties and cities in Xinjiang, leading to synergistic effects among neighboring counties and cities in adopting similar strategies and technologies, and the degree of agglomeration continued to strengthen. From 2010 to 2014, the global Moran’s I showed a downward trend and reached its minimum value. Over time, continuous high-intensity production increased ecological and environmental pressures, exacerbated pests and diseases, and led to a continued increase in the use of agricultural chemicals such as fertilizers. This resulted in diminishing marginal benefits of cotton production and increased spatial variability. From 2014 to 2020, Moran’s I once again showed an upward trend. During this period, the government vigorously promoted and implemented integrated water and fertilizer management, the substitution of organic fertilizers for chemical fertilizers, and green pest control technologies, which mitigated the contradiction between cotton production and resource exploitation, indirectly or directly promoted sustainable cotton production, increased the positive externalities of cotton green production efficiency, and narrowed the differences in green production efficiency among neighboring counties and cities.
- (2)
- Local Spatial Autocorrelation Analysis
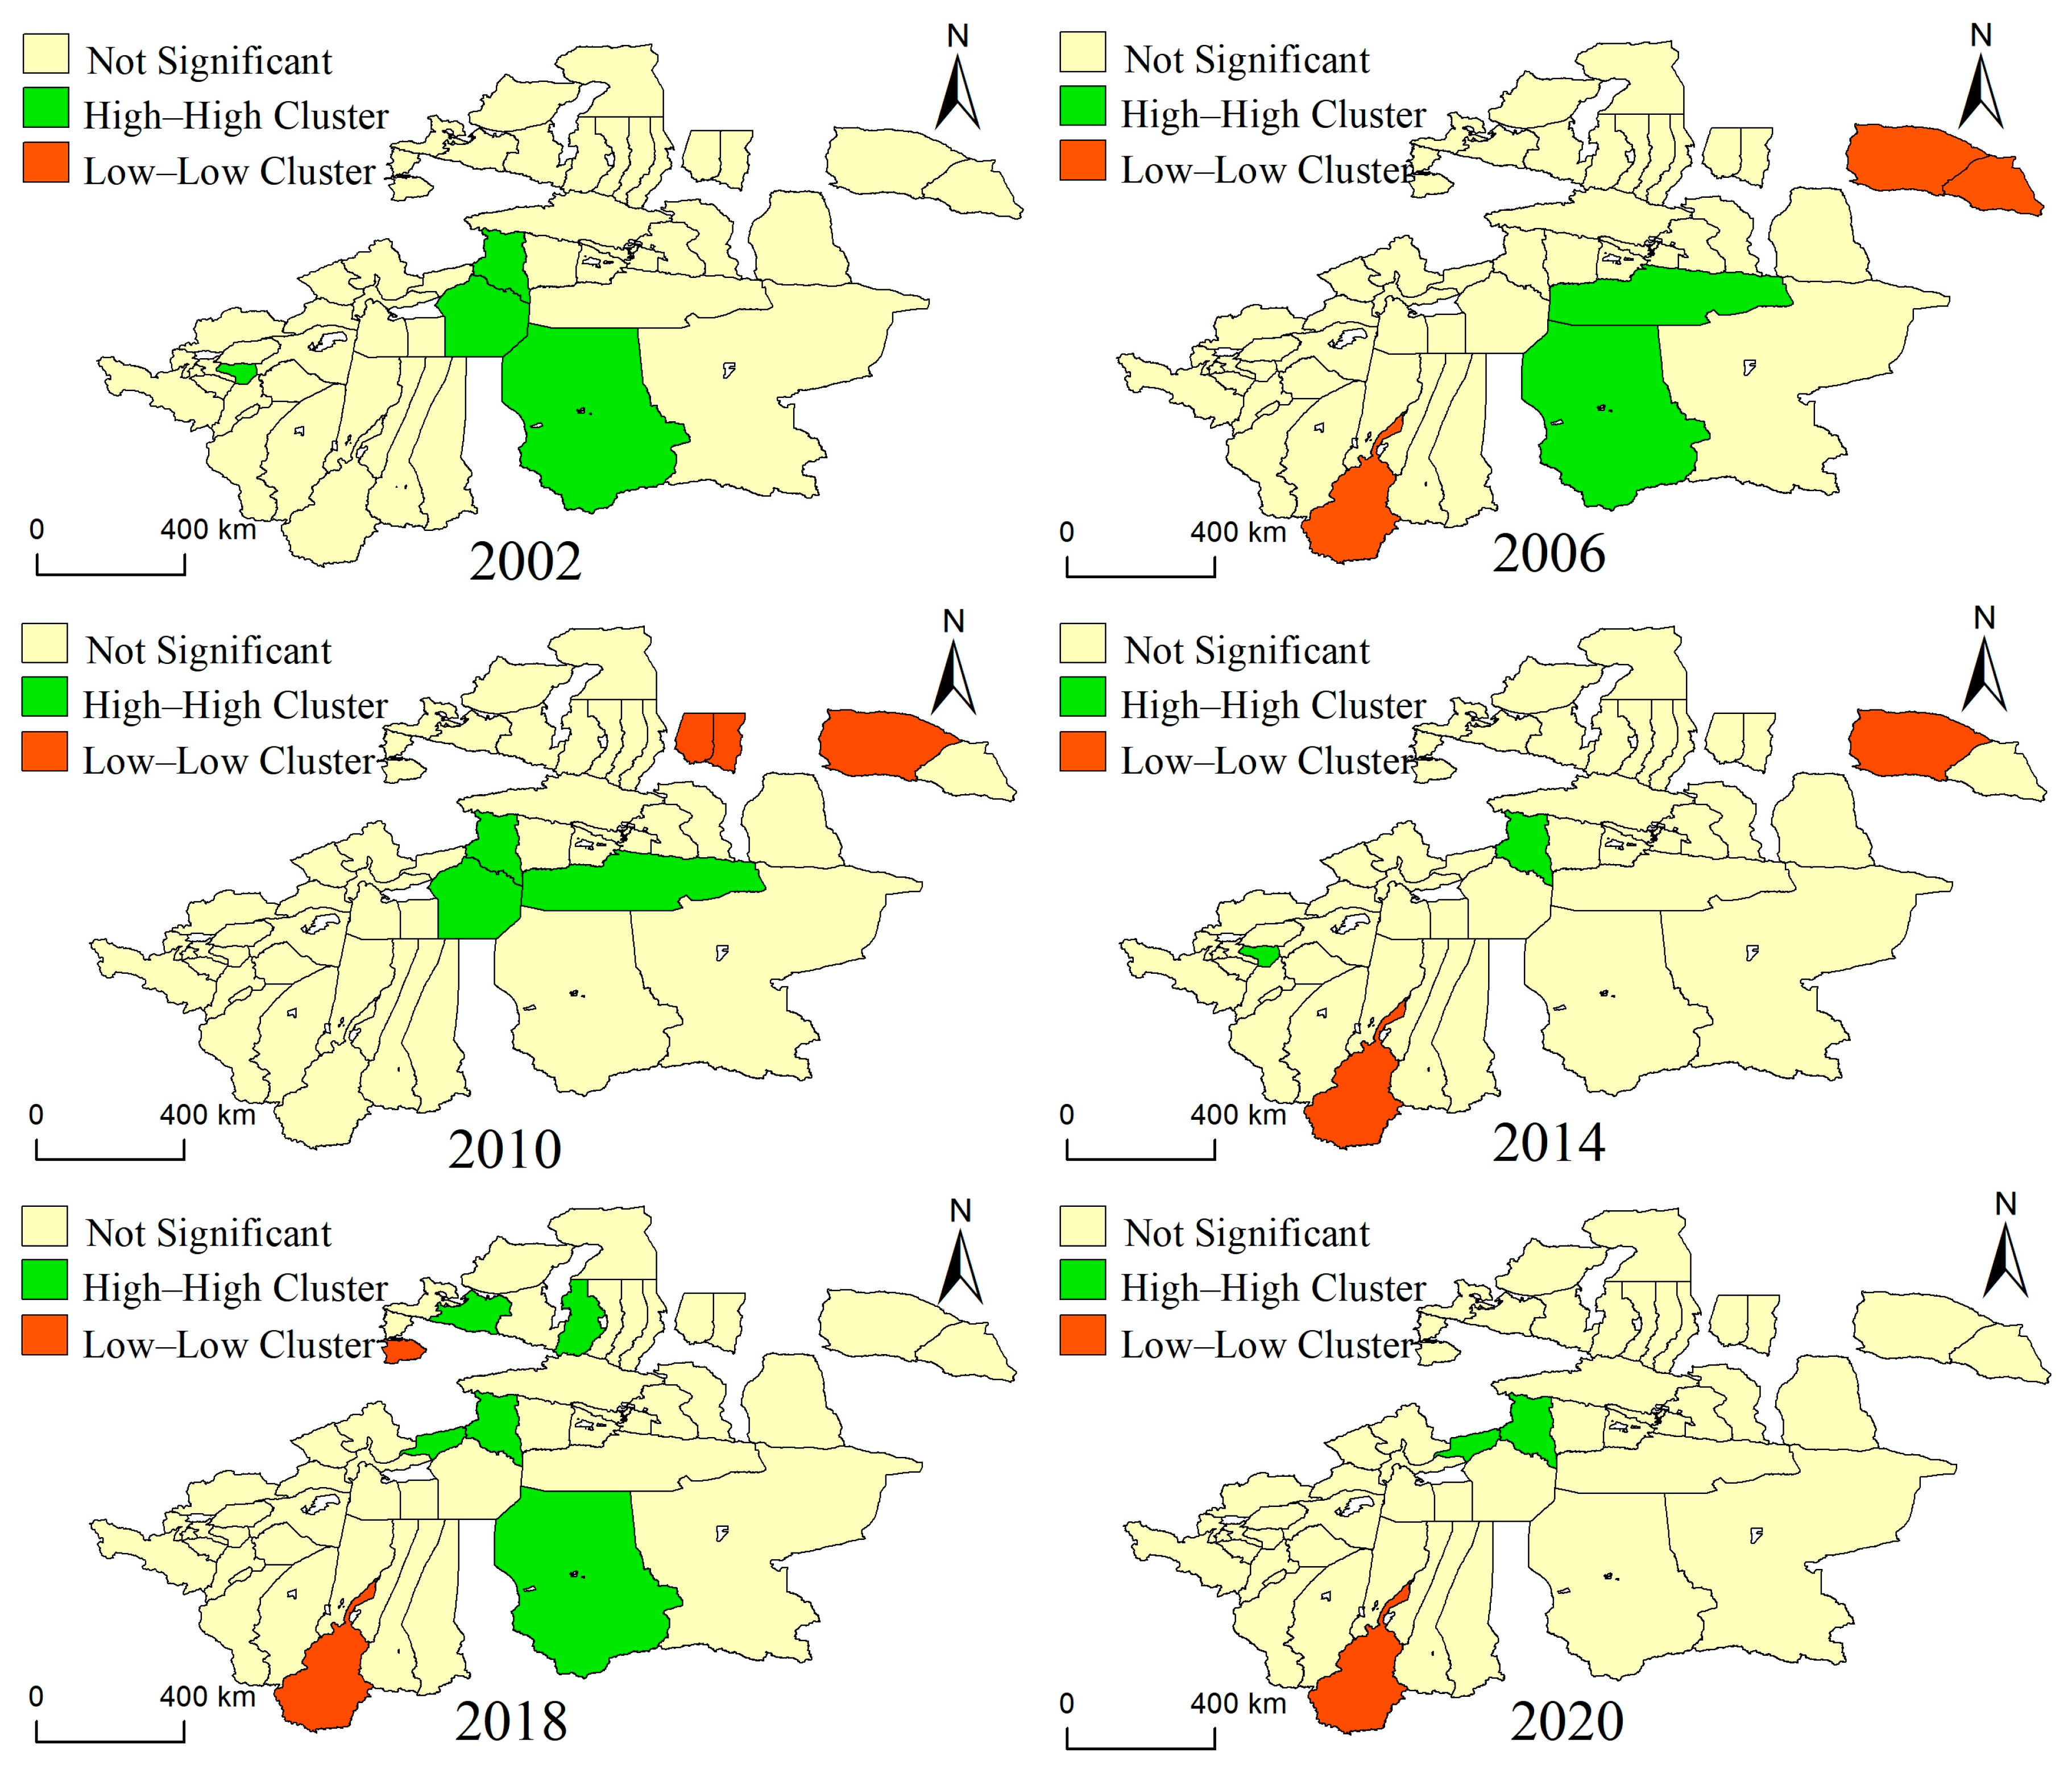
Figure 4 illustrates the LISA cluster distribution of cotton green production efficiency in Xinjiang counties (cities). As shown in Figure 4, the “high–high” type areas of green cotton production efficiency in Xinjiang exhibited a spatial distribution characteristic of migrating from south to northwest, while the “low–low” type areas showed a spatial distribution trend of migrating from north to south.
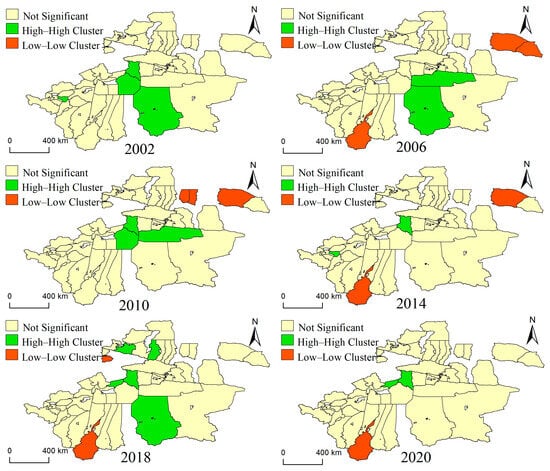
Figure 4.
LISA cluster map of the green production efficiency of cotton in the counties (cities) of Xinjiang.
The “high–high” type areas exhibited a cluster of high cotton green production efficiency characterized by “high in the center and high around”. In 2002, these regions were mainly distributed in the eastern and central parts of southern Xinjiang. By 2006, the high–high type areas had shifted northward, concentrating in the northern–central areas. By 2010, the high–high type areas further expanded northwestward, covering parts of the central and northwestern regions. By 2014, the high–high type areas were primarily concentrated in the central and western parts of southern Xinjiang. By 2018, the high–high type areas appeared for the first time in parts of northern Xinjiang, while also remaining present in southern Xinjiang. By 2020, the high–high type areas were mainly concentrated in the northwestern part of southern Xinjiang. The green production efficiency of cotton has significantly improved due to the combined effects of natural conditions, technological advancements, management levels, and policy support, and the cotton green production efficiency has developed to a high level. Specifically, large diurnal temperature variations and stable irrigation water sources have contributed to higher cotton fiber quality and yields; the application of smart irrigation systems, precision fertilization technologies, and biological pest control has enhanced resource use efficiency while reducing environmental impacts; optimizing planting structures and scales, as well as promoting cooperatives and family farms, have facilitated resource sharing and technical exchanges, lowering costs; and government-implemented ecological compensation mechanisms, clean energy subsidies, and green agricultural product certification systems have encouraged farmers to participate in ecological protection projects while increasing market recognition and added value for green cotton products.
The “low–low” type areas exhibited a cluster of low cotton green production efficiency characterized by “low in the center and low around”. In 2002, there were no low–low type areas for cotton green production efficiency in Xinjiang. By 2006, the low–low type areas were mainly distributed in the southwestern part of southern Xinjiang and the northeastern part of northern Xinjiang. By 2010, the low–low type areas became more concentrated in the central and northeastern parts of northern Xinjiang. By 2014, the low–low type areas re-emerged in the southwestern part of southern Xinjiang and the northeastern part of northern Xinjiang. By 2018, the low–low type areas were mainly distributed in the southwestern part of southern Xinjiang and the northwestern part of northern Xinjiang. By 2020, the low–low type areas were concentrated in the southwestern part of southern Xinjiang.
4. Discussion
Climate change has a significant impact on cotton production [5,6]. This study reassessed the green production efficiency of cotton by integrating meteorological station data with statistical yearbook data. The findings reveal an overall declining trend in the green production efficiency of cotton in Xinjiang, which aligns with the research results of Li Qianna and Yue Hui [42,43]. Compared to previous studies, this research employs a longer time series for the analysis. The results indicate that although the green production efficiency of cotton has generally declined, it has stabilized in recent years and even begun to show a gradual upward trend. However, it is worth noting that despite short-term improvements, the rate of efficiency enhancement is slowing, suggesting greater challenges in further improving green production efficiency.
Cotton production is closely related to meteorological factors such as temperature and precipitation. Global warming has altered the water and heat cycles in Xinjiang, significantly affecting the normal operation of cotton production systems [5,6,9]. Studies show that high-value areas of cotton green production efficiency in Xinjiang are migrating northward and westward, while low-value areas are moving southward. The main reason is the significant increase in temperature across Xinjiang, with high precipitation concentrated in the western mountainous regions [44]. Rising temperatures have changed the heat supply patterns during the cotton growing period: increased temperatures in the north have extended the growing season and increased the heat supply, promoting the improvement of green production efficiency in this region. In contrast, further temperature increases in the south may lead to reduced yields and fiber quality, causing the low-value areas of cotton green production efficiency to expand southward. Additionally, the increase in rainfall in the west has provided more water resources for the arid and semi-arid regions of Xinjiang, directly impacting the water supply during the cotton growing period and thereby driving the migration of high-value areas of cotton green production efficiency westward. Over time, technological advancements and climate adaptation strategies have gradually narrowed the differences in cotton green production efficiency among counties (cities). At the same time, high-value counties (cities) have promoted production efficiency in neighboring areas through the dissemination of technology and experience, leading to an adjacent distribution trend between low-value and high-value counties (cities). This phenomenon reflects the radiation effect of high-value counties (cities) on neighboring regions.
This paper analyzes the changing characteristics of cotton green production efficiency at the county level in Xinjiang, providing a new perspective for understanding the impact of climate change on cotton production. This study comprehensively reviewed various data sources, selecting indicators that comprehensively reflect the changing characteristics of cotton green production efficiency. However, due to the difficulty in obtaining data in Xinjiang, the availability and stability of some data posed unique challenges to this research. Future studies will attempt to use field survey data and incorporate factors such as market fluctuations that may interact with climate change, further enhancing the comprehensiveness and scientific rigor of cotton production research in Xinjiang, China.
5. Conclusions and Suggestions
5.1. Conclusions
This study employs a non-desirable output super-efficiency slack-based measure model to measure the green production efficiency of cotton at the county level in Xinjiang, incorporating climate factors. The research results indicate that the overall green production efficiency of cotton in Xinjiang shows a declining trend, but the differences in green production efficiency among counties (cities) are gradually narrowing. Additionally, this study found that high-efficiency and low-efficiency counties (cities) exhibit clustering characteristics, and these clustering patterns have migrated in response to climate change in the Xinjiang region. This study provides a theoretical basis for the Xinjiang government to conduct climate zoning for cotton production and is of great significance for promoting the sustainable production of cotton in China.
From a temporal perspective, despite a sharp increase in Xinjiang’s green cotton production efficiency to 0.549 in 2014, which remained relatively stable between 2016 and 2020, the overall trend of green production efficiency from 2002 to 2020 exhibited a downward trajectory. The MI (Malmquist index), EC (Efficiency Change), and TC (Technical Change) in Xinjiang were 0.948, 0.969, and 0.994, respectively, all of which were trending downward. When decomposing the EC (Efficiency Change), it was found that the PEC (Pure Efficiency Change) generally outperformed the SEC (Scale Efficiency Change). Many counties (cities) in Xinjiang have effectively utilized existing resources under current technology levels, but attention must be paid to addressing issues related to economies of scale to achieve greater improvements in green production efficiency. An overly large scale can lead to management inefficiencies and resource waste, while an overly small scale may limit the full utilization of technological benefits.
From a spatial perspective, the green production efficiency of cotton in Xinjiang counties (cities) is primarily concentrated in southern North Xinjiang and the South Xinjiang region. With rising temperatures in northern Xinjiang and increased rainfall in the west, high-efficiency areas for green production efficiency have shown a trend of shifting northward and westward, transforming the spatial distribution from “high in the south and low in the north” to “high in the north and low in the south”. From a holistic perspective, both high-efficiency and low-efficiency counties (cities) exhibit adjacent spatial distributions, but the degree of spatial correlation is unstable, showing a pattern of first increasing, then decreasing, and increasing again. Locally, high-efficiency clusters tend to migrate northward and westward, while low-efficiency clusters mainly concentrate around Hotan County in South Xinjiang and Balikun Kazak Autonomous County in East Xinjiang. Overall, the green production efficiency of cotton shows a “clustered distribution” pattern.
5.2. Suggestions
To promote the sustainable development of green cotton production in Xinjiang, practitioners should actively respond to policies by promoting ecological protection, adopting advanced technologies, optimizing planting structures, implementing differentiated strategies, and leveraging spatial agglomeration effects to foster coordinated development. Meanwhile, the scientific community should strengthen theoretical and technological research to provide scientific evidence and theoretical support for policymaking and practical implementation.
- (1)
- Promoting Ecological Protection for Green and High-Quality Development.
First, ecological compensation and restoration projects should be implemented, encouraging farmers to participate in ecological protection efforts to address issues such as land degradation and water scarcity while intensifying efforts to restore damaged ecosystems. Second, active adoption of clean energy is needed to reduce diesel use by investing in the development of electric agricultural machinery, utilizing clean energy subsidy policies, and optimizing agricultural mechanization operations to decrease the reliance on diesel fuel and improve green production efficiency. Third, full utilization of policy support and incentive mechanisms by actively applying for technology upgrade subsidies, investing in green production technologies and equipment, and participating in green agricultural product certification is needed to enhance the market recognition and added value of cotton products.
- (2)
- Promoting Advanced Agricultural Technologies and Optimizing Planting Structure and Scale.
First, the active application of modern technologies such as smart irrigation systems, precision fertilization, and biological pest control is needed to improve the resource utilization efficiency and reduce the use of chemical fertilizers and pesticides. Second, scientific planning of planting structures and scales are needed by making reasonable adjustments based on regional conditions to balance economies of scale with environmental protection while leveraging the advantages of new agricultural operating entities such as cooperatives and family farms.
- (3)
- Implementing Differentiated Strategies for Precise Governance.
First, region-specific green development strategies based on local natural conditions, technical foundations, and production efficiency characteristics should be formulated. Second, fine-grained management should be advanced using big data and cloud computing technologies to analyze soil, climate, and water resources in detail and develop targeted planting plans and management measures.
- (4)
- Leveraging Spatial Agglomeration Effects to Promote Regional Coordinated Development.
First, industrial layouts should be optimized by scientifically planning cotton-growing areas based on regional natural conditions and resource advantages to create distinctive and complementary industrial patterns. Second, green production demonstration zones should be established to showcase advanced green production models and successful cases, providing replicable and scalable experiences for surrounding areas. Third, regional cooperation platforms should be built by actively participating in cross-county (city) green cotton production cooperation alliances to share resources, technologies, information, and markets.
- (5)
- Strengthening Theoretical and Technological Research to Build a Sustainable Development Support System.
First, research on ecological compensation mechanisms, clean energy technologies, and green production technologies should be strengthened to provide scientific evidence and data support for policymaking and practical implementation. Second, in-depth research on green agricultural product certification systems, the effects of the application of modern agricultural technologies, optimization of planting structures and scales, region-specific green development strategies, fine-grained management technologies, industrial layout optimization, construction models and the effects of green production demonstration zones, and regional cooperation mechanisms should be conducted to provide theoretical support and experiential references for the sustainable development of green cotton production.
Author Contributions
Y.Y. designed the experiments and analyzed the results. W.C. assisted in the paper design and review. K.K.J. translated this paper from Chinese to English. All authors have read and agreed to the published version of the manuscript.
Funding
This research was supported by the National Social Science Fund of China (12CJY052) and High-level Talent Program of Shihezi University (KX019102). Both grants were provided by the second author of this paper.
Institutional Review Board Statement
Not Applicable.
Informed Consent Statement
Not Applicable.
Data Availability Statement
The original data presented in this study are available in the Xinjiang Statistical Yearbook, published by the Xinjiang Bureau of Statistics. The yearbook can be accessed at [http://tjj.xinjiang.gov.cn/] (accessed on 2 March 2025).
Conflicts of Interest
The authors declare no conflicts of interest.
Appendix A. County-Level Green Production Efficiency of Cotton from 2002 to 2020
| 2002 | 2004 | 2006 | 2008 | 2010 | 2012 | 2014 | 2016 | 2018 | 2020 | |
| Shanshan County | 0.134 | 0.260 | 0.255 | 0.270 | 0.197 | 0.194 | 0.204 | 0.025 | 0.124 | 0.105 |
| Toksun County | 0.242 | 1.019 | 1.005 | 1.076 | 1.020 | 0.329 | 0.433 | 0.133 | 0.209 | 0.226 |
| Balikun Kazak Autonomous County | 0.126 | 0.071 | 0.058 | 0.112 | 0.123 | 0.121 | 0.109 | 0.006 | 0.134 | 0.132 |
| Yiwu County | 0.107 | 0.112 | 0.085 | 0.076 | 0.062 | 0.088 | 0.068 | 0.002 | 0.097 | 0.133 |
| Changji City | 0.233 | 0.348 | 0.401 | 0.402 | 0.368 | 0.495 | 0.401 | 0.141 | 0.420 | 0.408 |
| Fukang City | 0.129 | 0.152 | 0.189 | 0.079 | 0.081 | 1.089 | 1.126 | 0.007 | 0.271 | 0.379 |
| Hutubi County | 0.398 | 0.633 | 0.537 | 0.609 | 0.417 | 0.478 | 0.538 | 0.206 | 0.684 | 1.006 |
| Manas County | 1.098 | 1.061 | 1.009 | 1.047 | 1.018 | 0.773 | 1.003 | 0.403 | 1.002 | 0.794 |
| Jimusar County | 0.093 | 0.127 | 0.126 | 0.069 | 0.001 | 0.081 | 0.058 | 0.011 | 0.134 | 0.111 |
| Chabuchar Xibo Autonomous County | 0.135 | 0.155 | 0.211 | 0.341 | 0.200 | 0.188 | 0.108 | 0.004 | 0.101 | 0.107 |
| Huocheng County | 0.131 | 0.142 | 0.149 | 0.116 | 0.083 | 0.109 | 0.104 | 0.008 | 0.087 | 0.109 |
| Wusu City | 1.047 | 1.045 | 1.130 | 1.207 | 1.039 | 1.020 | 1.419 | 1.353 | 1.863 | 1.253 |
| Shawan City | 0.713 | 0.654 | 0.717 | 0.662 | 1.006 | 1.051 | 1.025 | 1.068 | 1.020 | 1.015 |
| Toli County | 0.032 | 0.096 | 0.102 | 0.093 | 0.115 | 0.110 | 0.119 | 0.010 | 0.129 | 0.137 |
| Hoboksar Mongol Autonomous County | 0.196 | 0.308 | 0.367 | 0.416 | 0.471 | 0.532 | 0.216 | 0.096 | 0.362 | 0.395 |
| Bole City | 0.588 | 1.001 | 0.628 | 0.565 | 0.492 | 0.653 | 0.445 | 0.455 | 0.477 | 0.505 |
| Jinghe County | 1.201 | 1.095 | 1.081 | 1.326 | 1.012 | 1.159 | 1.097 | 1.125 | 1.049 | 1.003 |
| Korla City | 0.554 | 1.013 | 1.041 | 0.696 | 1.005 | 0.838 | 1.077 | 1.436 | 0.750 | 0.600 |
| Luntai County | 0.525 | 0.595 | 0.522 | 0.655 | 1.019 | 1.064 | 1.047 | 1.001 | 1.175 | 1.008 |
| Yuli County | 1.896 | 1.554 | 1.343 | 1.477 | 1.384 | 1.449 | 1.289 | 1.260 | 1.291 | 1.477 |
| Ruoqiang County | 1.023 | 1.039 | 1.023 | 0.413 | 0.357 | 0.271 | 0.211 | 0.029 | 0.156 | 0.205 |
| Qiemo County | 0.759 | 1.120 | 1.089 | 1.651 | 1.312 | 1.084 | 0.487 | 0.228 | 0.443 | 0.331 |
| Yanqi Hui Autonomous County | 0.069 | 0.084 | 0.109 | 0.096 | 0.091 | 0.142 | 0.117 | 0.001 | 0.090 | 0.095 |
| Hejing County | 0.114 | 0.170 | 0.254 | 0.228 | 0.302 | 0.280 | 0.158 | 0.000 | 0.099 | 0.224 |
| Heshuo County | 0.274 | 0.443 | 1.013 | 0.627 | 0.451 | 0.468 | 0.403 | 0.047 | 0.248 | 0.139 |
| Bohu County | 0.103 | 0.168 | 0.326 | 0.326 | 0.248 | 0.239 | 0.185 | 0.035 | 0.192 | 0.224 |
| Aksu City | 1.028 | 1.016 | 0.718 | 0.815 | 1.117 | 1.038 | 0.706 | 1.471 | 0.631 | 0.702 |
| Wensu County | 0.785 | 0.601 | 0.644 | 0.655 | 0.735 | 0.690 | 0.499 | 1.166 | 0.415 | 0.374 |
| Kuche City | 0.593 | 0.662 | 0.585 | 0.496 | 0.516 | 0.593 | 0.902 | 1.192 | 1.233 | 0.757 |
| Shaya County | 1.030 | 0.818 | 1.001 | 0.752 | 0.777 | 0.789 | 1.057 | 1.635 | 1.158 | 1.457 |
| Xinhe County | 1.176 | 1.034 | 0.940 | 1.050 | 1.379 | 0.580 | 1.017 | 1.112 | 0.671 | 0.598 |
| Wushi County | 0.177 | 0.143 | 0.193 | 0.279 | 0.190 | 0.173 | 0.092 | 0.002 | 0.089 | 0.140 |
| Awati County | 1.009 | 1.005 | 0.836 | 0.709 | 1.013 | 1.365 | 1.386 | 0.441 | 0.781 | 1.045 |
| Keping County | 0.213 | 0.408 | 0.507 | 0.481 | 0.410 | 0.445 | 0.559 | 0.312 | 0.441 | 1.010 |
| Atushi City | 0.147 | 0.162 | 0.186 | 0.162 | 0.152 | 0.145 | 0.213 | 0.172 | 0.195 | 0.242 |
| Aketao County | 0.282 | 0.308 | 0.278 | 0.239 | 0.180 | 0.188 | 0.210 | 0.057 | 0.163 | 0.169 |
| Shufu County | 0.289 | 0.243 | 0.254 | 0.230 | 0.157 | 0.160 | 0.273 | 0.015 | 0.138 | 0.163 |
| Shule County | 1.018 | 1.006 | 0.552 | 0.395 | 0.317 | 0.422 | 1.308 | 1.235 | 0.410 | 0.475 |
| Yingjisha County | 0.204 | 0.316 | 0.334 | 0.298 | 0.271 | 0.195 | 0.331 | 0.183 | 0.229 | 0.279 |
| Zepu County | 1.015 | 0.620 | 0.538 | 0.446 | 0.200 | 0.202 | 0.293 | 0.067 | 0.161 | 0.177 |
| Shache County | 1.029 | 0.686 | 1.285 | 1.357 | 0.527 | 0.462 | 0.798 | 0.366 | 0.293 | 0.333 |
| Yecheng County | 1.045 | 0.358 | 0.360 | 0.389 | 0.224 | 0.233 | 0.414 | 0.202 | 0.254 | 0.290 |
| Makit County | 0.847 | 0.768 | 1.107 | 1.022 | 1.241 | 0.689 | 0.857 | 1.277 | 0.529 | 0.448 |
| Yuepuhu County | 0.550 | 0.355 | 0.497 | 0.326 | 0.339 | 0.335 | 0.711 | 0.546 | 0.547 | 0.566 |
| Jiashi County | 1.025 | 0.456 | 0.665 | 0.564 | 0.331 | 0.346 | 1.038 | 0.414 | 0.565 | 0.502 |
| Bachu County | 1.095 | 1.267 | 1.080 | 1.102 | 1.003 | 0.662 | 1.042 | 0.362 | 0.555 | 0.474 |
| Hotan County | 0.156 | 0.236 | 0.234 | 0.207 | 0.191 | 0.188 | 0.254 | 0.089 | 0.214 | 0.069 |
| Moyu County | 0.148 | 0.249 | 0.232 | 0.216 | 0.199 | 0.179 | 0.211 | 0.081 | 0.115 | 0.093 |
| Pishan County | 0.209 | 0.306 | 0.297 | 0.269 | 0.258 | 0.206 | 0.246 | 0.104 | 0.115 | 0.131 |
| Luopu County | 0.260 | 0.298 | 0.284 | 0.263 | 0.213 | 0.165 | 0.174 | 0.009 | 0.079 | 0.046 |
| Cele County | 0.146 | 0.236 | 0.300 | 0.291 | 0.263 | 0.209 | 0.226 | 0.036 | 0.113 | 0.138 |
| Yutian County | 0.194 | 0.215 | 0.251 | 0.339 | 0.285 | 0.208 | 0.264 | 0.057 | 0.129 | 0.160 |
| The average green production efficiency | 0.531 | 0.543 | 0.556 | 0.538 | 0.507 | 0.484 | 0.549 | 0.417 | 0.439 | 0.442 |
| The average production efficiency | 0.249 | 0.287 | 0.331 | 0.331 | 0.257 | 0.282 | 0.383 | 0.334 | 0.295 | 0.298 |
Appendix B. Malmquist Indices and Their Decompositions for Cotton in Each County (City) of Xinjiang
| MI | TC | EC | PEC | SEC | |
| Shanshan County | 0.945 | 0.905 | 0.951 | 1.136 | 1.086 |
| Toksun County | 1.011 | 1.109 | 1.065 | 1.019 | 0.868 |
| Balikun Kazak Autonomous County | 1.127 | 1.022 | 0.971 | 1.000 | 0.995 |
| Yiwu County | 1.070 | 0.941 | 0.994 | 0.858 | 0.929 |
| Changji City | 1.090 | 1.054 | 1.086 | 1.041 | 1.014 |
| Fukang City | 1.153 | 0.937 | 0.981 | 1.102 | 0.932 |
| Hutubi County | 1.127 | 1.039 | 1.120 | 1.049 | 1.039 |
| Manas County | 1.054 | 1.072 | 1.033 | 1.013 | 0.998 |
| Jimusar County | 0.948 | 0.864 | 0.939 | 1.046 | 0.813 |
| Chabuchar Xibo Autonomous County | 0.977 | 0.828 | 0.969 | 1.003 | 0.973 |
| Huocheng County | 0.993 | 0.950 | 0.949 | 1.056 | 1.026 |
| Wusu City | 1.092 | 1.036 | 1.073 | 1.050 | 1.014 |
| Shawan City | 1.082 | 1.090 | 1.021 | 1.012 | 1.003 |
| Toli County | 1.123 | 0.989 | 0.923 | 0.951 | 0.878 |
| Hoboksar Mongol Autonomous County | 1.139 | 1.071 | 0.994 | 1.006 | 0.988 |
| Bole City | 1.035 | 1.036 | 1.010 | 0.985 | 1.019 |
| Jinghe County | 1.044 | 1.134 | 0.948 | 1.001 | 0.947 |
| Korla City | 1.055 | 1.039 | 1.051 | 1.062 | 1.020 |
| Luntai County | 1.076 | 1.025 | 1.058 | 1.038 | 1.023 |
| Yuli County | 1.008 | 1.042 | 0.995 | 1.012 | 1.001 |
| Ruoqiang County | 0.966 | 0.988 | 0.890 | 1.007 | 1.018 |
| Qiemo County | 0.990 | 1.038 | 0.982 | 1.093 | 1.028 |
| Yanqi Hui Autonomous County | 1.032 | 0.935 | 0.892 | 1.238 | 1.116 |
| Hejing County | 0.991 | 0.942 | 1.000 | 1.072 | 0.999 |
| Heshuo County | 1.038 | 1.002 | 0.964 | 1.020 | 1.057 |
| Bohu County | 1.158 | 1.017 | 1.015 | 1.092 | 1.031 |
| Aksu City | 1.047 | 1.034 | 1.012 | 1.021 | 0.989 |
| Wensu County | 1.012 | 1.011 | 0.995 | 1.004 | 0.992 |
| Kuche City | 1.090 | 0.988 | 1.040 | 1.041 | 1.001 |
| Shaya County | 1.057 | 1.023 | 1.033 | 0.965 | 1.077 |
| Xinhe County | 1.065 | 1.018 | 1.042 | 0.998 | 1.026 |
| Wushi County | 0.854 | 0.753 | 0.851 | 1.122 | 0.848 |
| Awati County | 1.067 | 1.045 | 1.069 | 1.050 | 1.021 |
| Keping County | 1.067 | 0.990 | 1.112 | 1.047 | 1.226 |
| Atushi City | 1.098 | 1.065 | 1.032 | 1.014 | 1.024 |
| Aketao County | 0.941 | 1.010 | 1.047 | 1.045 | 1.027 |
| Shufu County | 0.847 | 1.030 | 0.941 | 1.032 | 0.931 |
| Shule County | 1.001 | 1.048 | 0.967 | 1.044 | 1.053 |
| Yingjisha County | 0.941 | 1.071 | 0.995 | 1.057 | 1.032 |
| Zepu County | 0.931 | 1.017 | 1.009 | 0.993 | 1.030 |
| Shache County | 0.968 | 1.066 | 0.961 | 1.086 | 0.986 |
| Yecheng County | 0.896 | 1.056 | 0.983 | 1.047 | 1.023 |
| Makit County | 0.862 | 0.966 | 0.896 | 0.966 | 0.912 |
| Yuepuhu County | 0.955 | 1.048 | 1.046 | 1.038 | 1.023 |
| Jiashi County | 0.862 | 1.033 | 0.905 | 0.987 | 1.014 |
| Bachu County | 1.010 | 1.035 | 1.046 | 1.032 | 0.997 |
| Hotan County | 0.995 | 0.998 | 0.993 | 1.056 | 0.950 |
| Moyu County | 0.931 | 0.980 | 1.002 | 1.049 | 0.955 |
| Pishan County | 0.978 | 0.999 | 1.004 | 1.084 | 1.062 |
| Luopu County | 0.743 | 0.757 | 0.870 | 1.124 | 0.911 |
| Cele County | 0.971 | 0.884 | 0.956 | 1.198 | 1.122 |
| Yutian County | 1.029 | 1.054 | 0.954 | 1.167 | 1.073 |
References
- IPCC. Climate Change 2021: The Physical Science Basis. Contribution of the Working Group I to the Sixth Assessment Report of the Intergovernmental Panel on Climate Change; Cambridge University Press: New York, NY, USA, 2021. [Google Scholar]
- Golcher, S.C.; Visseren-Hamakers, J.I. Framing and integration in the global forest, agriculture and climate change nexus. Environ. Plan. C Politics Space 2018, 36, 1415–1436. [Google Scholar] [CrossRef]
- Li, R.; Geng, S. Impacts of Climate Change on Agriculture and Adaptive Strategies in China. J. Integr. Agric. 2013, 12, 1402–1408. [Google Scholar] [CrossRef]
- Wang, X.; Maeda, K.; Hokazono, S.; Suzuki, N.; Kaiser, H.M. Measuring the Effects of a Sliding Scale Duty System on China’s Cotton Market: A Spatial Equilibrium Approach. Agribusiness 2014, 30, 345–365. [Google Scholar] [CrossRef]
- Zhu, Y.Q.; Sun, L.; Luo, Q.Y.; Chen, H.Y.; Yang, Y.D. Spatial optimization of cotton cultivation in Xinjiang: A climate change perspective. Int. J. Appl. Earth Obs. Geoinf. 2023, 124, 103523. [Google Scholar] [CrossRef]
- Zhang, S.; Pu, Z.; Li, J.; Li, X.; Ji, C.; Wa, M.; Li, Y. Changes in cotton planting zoning in southern Xinjiang under the background of climate warming. China Agric. Meteorol. 2015, 36, 594–601. [Google Scholar]
- Tan, X.; Zhang, X.; You, L. The impact of natural factors and policy interventions on the transformation of cotton production layout in China. Agric. Technol. Econ. 2020, 300, 79–93. [Google Scholar]
- Sun, P. Climate Change and Cotton Planting Promotion in the Yellow River Basin during the Yuan Dynasty. J. Henan Univ. Soc. Sci. Ed. 2024, 64, 38–40+153. [Google Scholar]
- Huang, J.; Ji, F. Effects of climate change on phenological trends and seed cotton yields in oasis of arid regions. Int. J. Biometeorol. 2015, 59, 877–888. [Google Scholar] [CrossRef]
- Wang, H.; Gan, Y.; Wang, R.; Niu, J.Y.; Zhao, H.; Yang, Q.G.; Li, G.C. Phenological trends in winter wheat and spring cotton in response to climate changes in northwest China. Agric. For. Meteorol. 2008, 148, 1242–1251. [Google Scholar] [CrossRef]
- Luo, Q.; Bange, M.; Clancy, L. Cotton crop phenology in a new temperature regime. Ecol. Model. 2014, 285, 22–29. [Google Scholar] [CrossRef]
- Han, W.; Liu, S.; Lei, Y.; Zhang, Y.; Han, Y.; Wang, G.; Feng, L.; Li, X.; Li, Y.; Wang, Z. Climate warming accelerates cotton growth while cultivar shifts extend the growth period. Field Crops Res. 2023, 293, 108850. [Google Scholar] [CrossRef]
- Yang, Y.; Yang, Y.; Han, S.; Macadam, I.; Liu, D.L. Prediction of cotton yield and water demand under climate change and future adaptation measures. Agric. Water Manag. 2014, 144, 42–53. [Google Scholar] [CrossRef]
- Gérardeaux, E.; Sultan, B.; Palaï, O.; Guiziou, C.; Oettli, P.; Naudin, K. Positive effect of climate change on cotton in 2050 by CO2 enrichment and conservation agriculture in Cameroon. Agron. Sustain. Dev. 2013, 33, 485–495. [Google Scholar] [CrossRef]
- Naveed, M.; Hongshi, H.E.; Zong, S.; Du, H.; Satti, Z.; Tan, X.; Qazi, M.Y. Spatial Pattern of Cotton Yield Variability and Its Response to Climate Change in Cotton Belt of Pakistan. Chin. Geogr. Sci. 2023, 33, 351–362. [Google Scholar]
- Li, N.; Li, Y.; Yang, Q.; Biswas, A.; Dong, H. Simulating climate change impacts on cotton using AquaCrop model in China. Agric. Syst. 2024, 216, 103897. [Google Scholar] [CrossRef]
- Abuduwaili, J. The climatic and hydrological changes and environmental responses recorded in lake sediments of Xinjiang, China. J. Arid Land 2011, 3, 1–8. [Google Scholar]
- Wang, Q.; Zhai, P.-M.; Qin, D.-H. New perspectives on ‘warming–wetting’ trend in Xinjiang, China. Adv. Clim. Change Res. 2020, 11, 252–260. [Google Scholar] [CrossRef]
- Cao, K.; Gao, J. Assessment of climatic conditions for tourism in Xinjiang, China. Open Geosci. 2022, 14, 382–392. [Google Scholar] [CrossRef]
- Tang, X.; Lv, X.; He, Y. Features of climate change and their effects on glacier snow melting in Xinjiang, China. Comptes Rendus Geosci. 2013, 345, 93–100. [Google Scholar] [CrossRef]
- China National Bureau of Statistics. China Statistical Yearbook; China Statistical Publishing House: Beijing, China, 2023.
- China National Bureau of Statistics. China Statistical Yearbook; China Statistical Publishing House: Beijing, China, 2024.
- Xue, L.; Qu, A.; Guo, X.; Hao, C. Research on Environmental Performance Measurement and Influencing Factors of Key Cities in China Based on Super-Efficiency SBM-Tobit Model. Sustainability 2024, 16, 4792. [Google Scholar] [CrossRef]
- Yang, T.; Chen, W.; Zhou, K.; Ren, M. Regional energy efficiency evaluation in China: A super efficiency slack-based measure model with undesirable outputs. J. Clean. Prod. 2018, 198, 859–866. [Google Scholar] [CrossRef]
- Wentsao, P.; Zhuang, M.; Zhou, Y.; Yang, J. Research on sustainable development and efficiency of China’s E-Agriculture based on a data envelopment analysis-Malmquist model. Technol. Forecast. Soc. Change 2021, 1621, 20298. [Google Scholar]
- Asmild, M.; Baležentis, T.; Hougaard, L.J. Multi-directional productivity change: MEA-Malmquist. J. Product. Anal. 2016, 46, 109–119. [Google Scholar] [CrossRef]
- Myeki, L.W.; Matthews, N.; Bahta, Y.T. Decomposition of Green Agriculture Productivity for Policy in Africa: An Application of Global Malmquist–Luenberger Index. Sustainability 2023, 15, 1645. [Google Scholar] [CrossRef]
- Perry, M.E.; Dezzani, J.R.; Seavert, F.C.; Pierce, F.J. Spatial variation in tree characteristics and yield in a pear orchard. Precis. Agric. 2010, 11, 42–60. [Google Scholar] [CrossRef]
- Pang, J.; Li, H.; Lu, C.; Lu, C.; Chen, X. Regional Differences and Dynamic Evolution of Carbon Emission Intensity of Agriculture Production in China. Int. J. Environ. Res. Public Health 2020, 17, 7541. [Google Scholar] [CrossRef]
- Wang, X.; Li, D.; Yu, Y. Current Situation and Optimization Countermeasures of Cotton Subsidy in China Based on WTO Rules. Agriculture 2022, 12, 1245. [Google Scholar] [CrossRef]
- Gao, M. Re-estimation of Agricultural Productivity under Climate Change. China Soft Sci. 2018, 9, 26–39. [Google Scholar]
- Chen, S.; Xu, J.; Zhang, H. The Impact of Climate Change on China’s Grain Production: An Empirical Analysis Based on County level Panel Data. China Rural Econ. 2016, 5, 2–15. [Google Scholar]
- Aytop, Y. Determination of Energy Consumption and Technical Efficiency of Cotton Farms in Türkiye. Sustainability 2023, 15, 11194. [Google Scholar] [CrossRef]
- Arif, M.W.; Amin, M. Measuring efficiency of cotton cultivation in Pakistan: A restricted production frontier study. J. Sci. Food Agric. 2014, 94, 3038–3045. [Google Scholar]
- Candemir, S. Efficiency and Functional analysis of cotton production in Turkey: Case of Kahramanmaras Province. Custos Agronegocio Online 2021, 17, 100–122. [Google Scholar]
- Örük, G. Measurement of Input Usage Efficiency in Cotton Production in Diyarbakir Province, Turkey. Custos Agronegocio 2020, 16, 55–71. [Google Scholar]
- Cobanoglu, F. Measuring the technical efficiency of cotton farms in Turkey using stochastic frontier and data envelopment analysis. Outlook Agric. 2013, 42, 125–131. [Google Scholar] [CrossRef]
- Oruk, G.; Baran, M.F. Measurement of technical efficiency in cotton production in Batman Province, Turkey: A comparison of DEA and SFA. Custos Agronegocio Online 2022, 18, 271–284. [Google Scholar]
- Theriault, V.; Serra, R. Institutional Environment and Technical Efficiency: A Stochastic Frontier Analysis of Cotton Producers in West Africa. J. Agric. Econ. 2014, 65, 383–405. [Google Scholar] [CrossRef]
- Shafiq, M.; Rehman, T. The extent of resource use inefficiencies in cotton production in Pakistan’s Punjab: An application of Data Envelopment Analysis. Agric. Econ. 2000, 22, 321–330. [Google Scholar] [CrossRef]
- Theodoridis, A.; Hasanov, S.; Abruev, A. Efficiency and Productivity Change Analysis of Cotton Production in Uzbekistan. Outlook Agric. 2014, 43, 259–263. [Google Scholar] [CrossRef]
- Yue, H.; Yu, F.W. Research on Green Total Factor Productivity of Cotton in China—Based on Malmquist Luenberger Index Analysis. Price Theory Pract. 2019, 10, 43–47+166. [Google Scholar]
- Qianna, L.; Juan, Y.; Hongsong, T.; Changjiang, X. Low carbon productivity, regional differences, and dynamic evolution of cotton in Xinjiang. Resour. Environ. Arid Reg. 2022, 36, 1–8. [Google Scholar]
- Yang, Y.; Chang, W. Analysis of Spatial and Temporal Distribution and Changes in Extreme Climate Events in Northwest China from 1960 to 2021: A Case Study of Xinjiang. Sustainability 2024, 16, 4960. [Google Scholar] [CrossRef]

Disclaimer/Publisher’s Note: The statements, opinions and data contained in all publications are solely those of the individual author(s) and contributor(s) and not of MDPI and/or the editor(s). MDPI and/or the editor(s) disclaim responsibility for any injury to people or property resulting from any ideas, methods, instructions or products referred to in the content. |
© 2025 by the authors. Licensee MDPI, Basel, Switzerland. This article is an open access article distributed under the terms and conditions of the Creative Commons Attribution (CC BY) license (https://creativecommons.org/licenses/by/4.0/).