

Evaluating the Economic Performance of Park City Policy—Based on the Penalized Version of Synthetic Control Method


Abstract
:1. Introduction
2. Mechanism Analysis
3. Materials and Methods
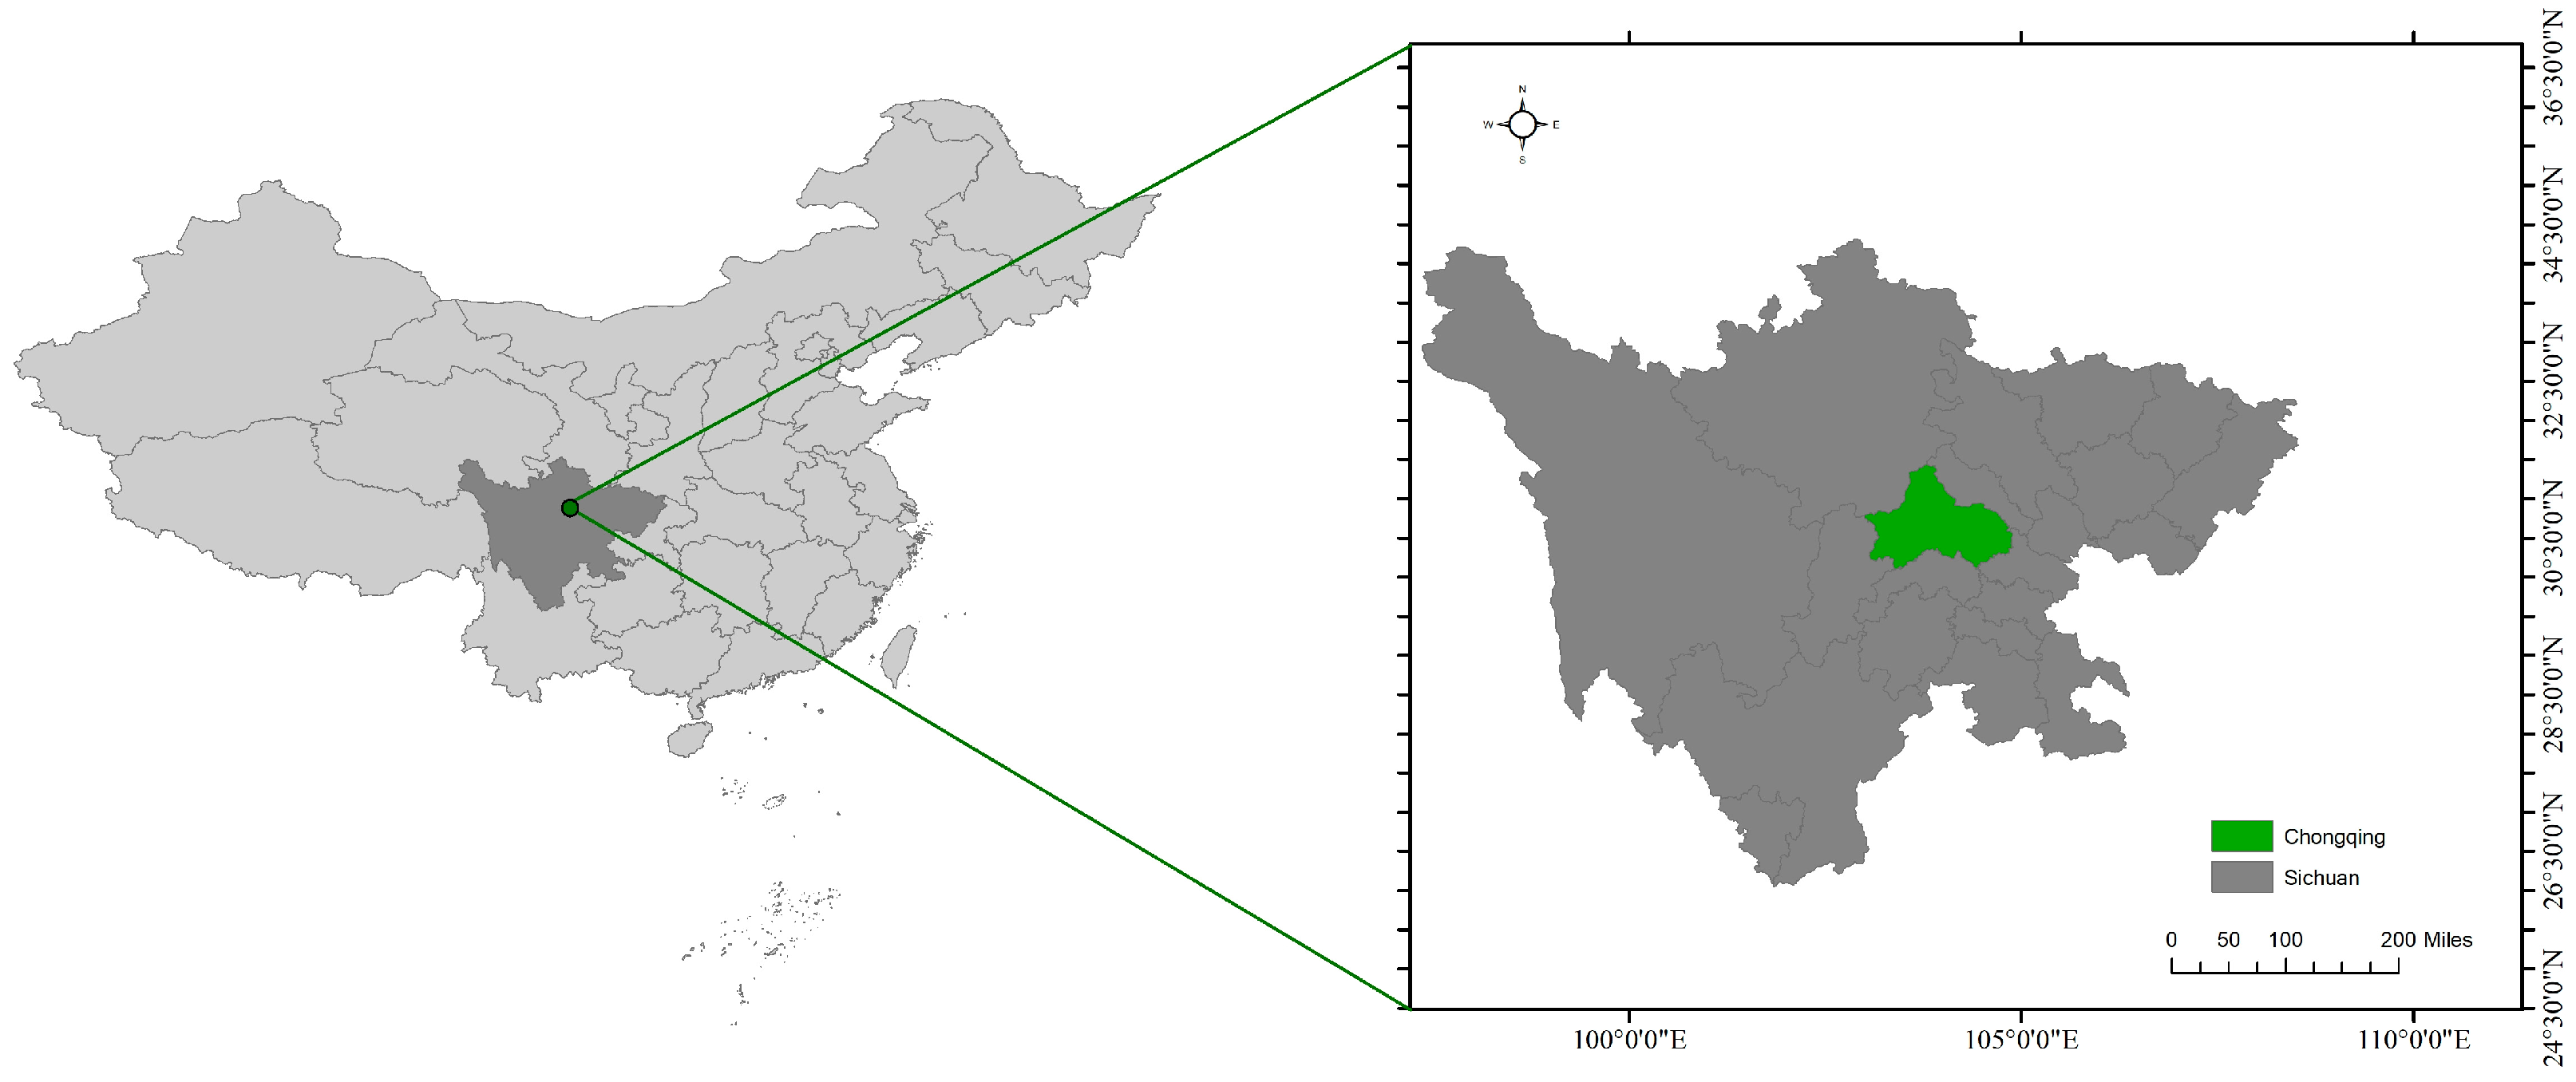
3.1. Study Area
3.2. Penalized Version of Synthetic Control Method
3.3. Date
3.3.1. Control Group Selection and Variable Selection
3.3.2. Data Source and Descriptive Statistics
4. Results
4.1. Optimal Weights and Correction Synthesis Control Results
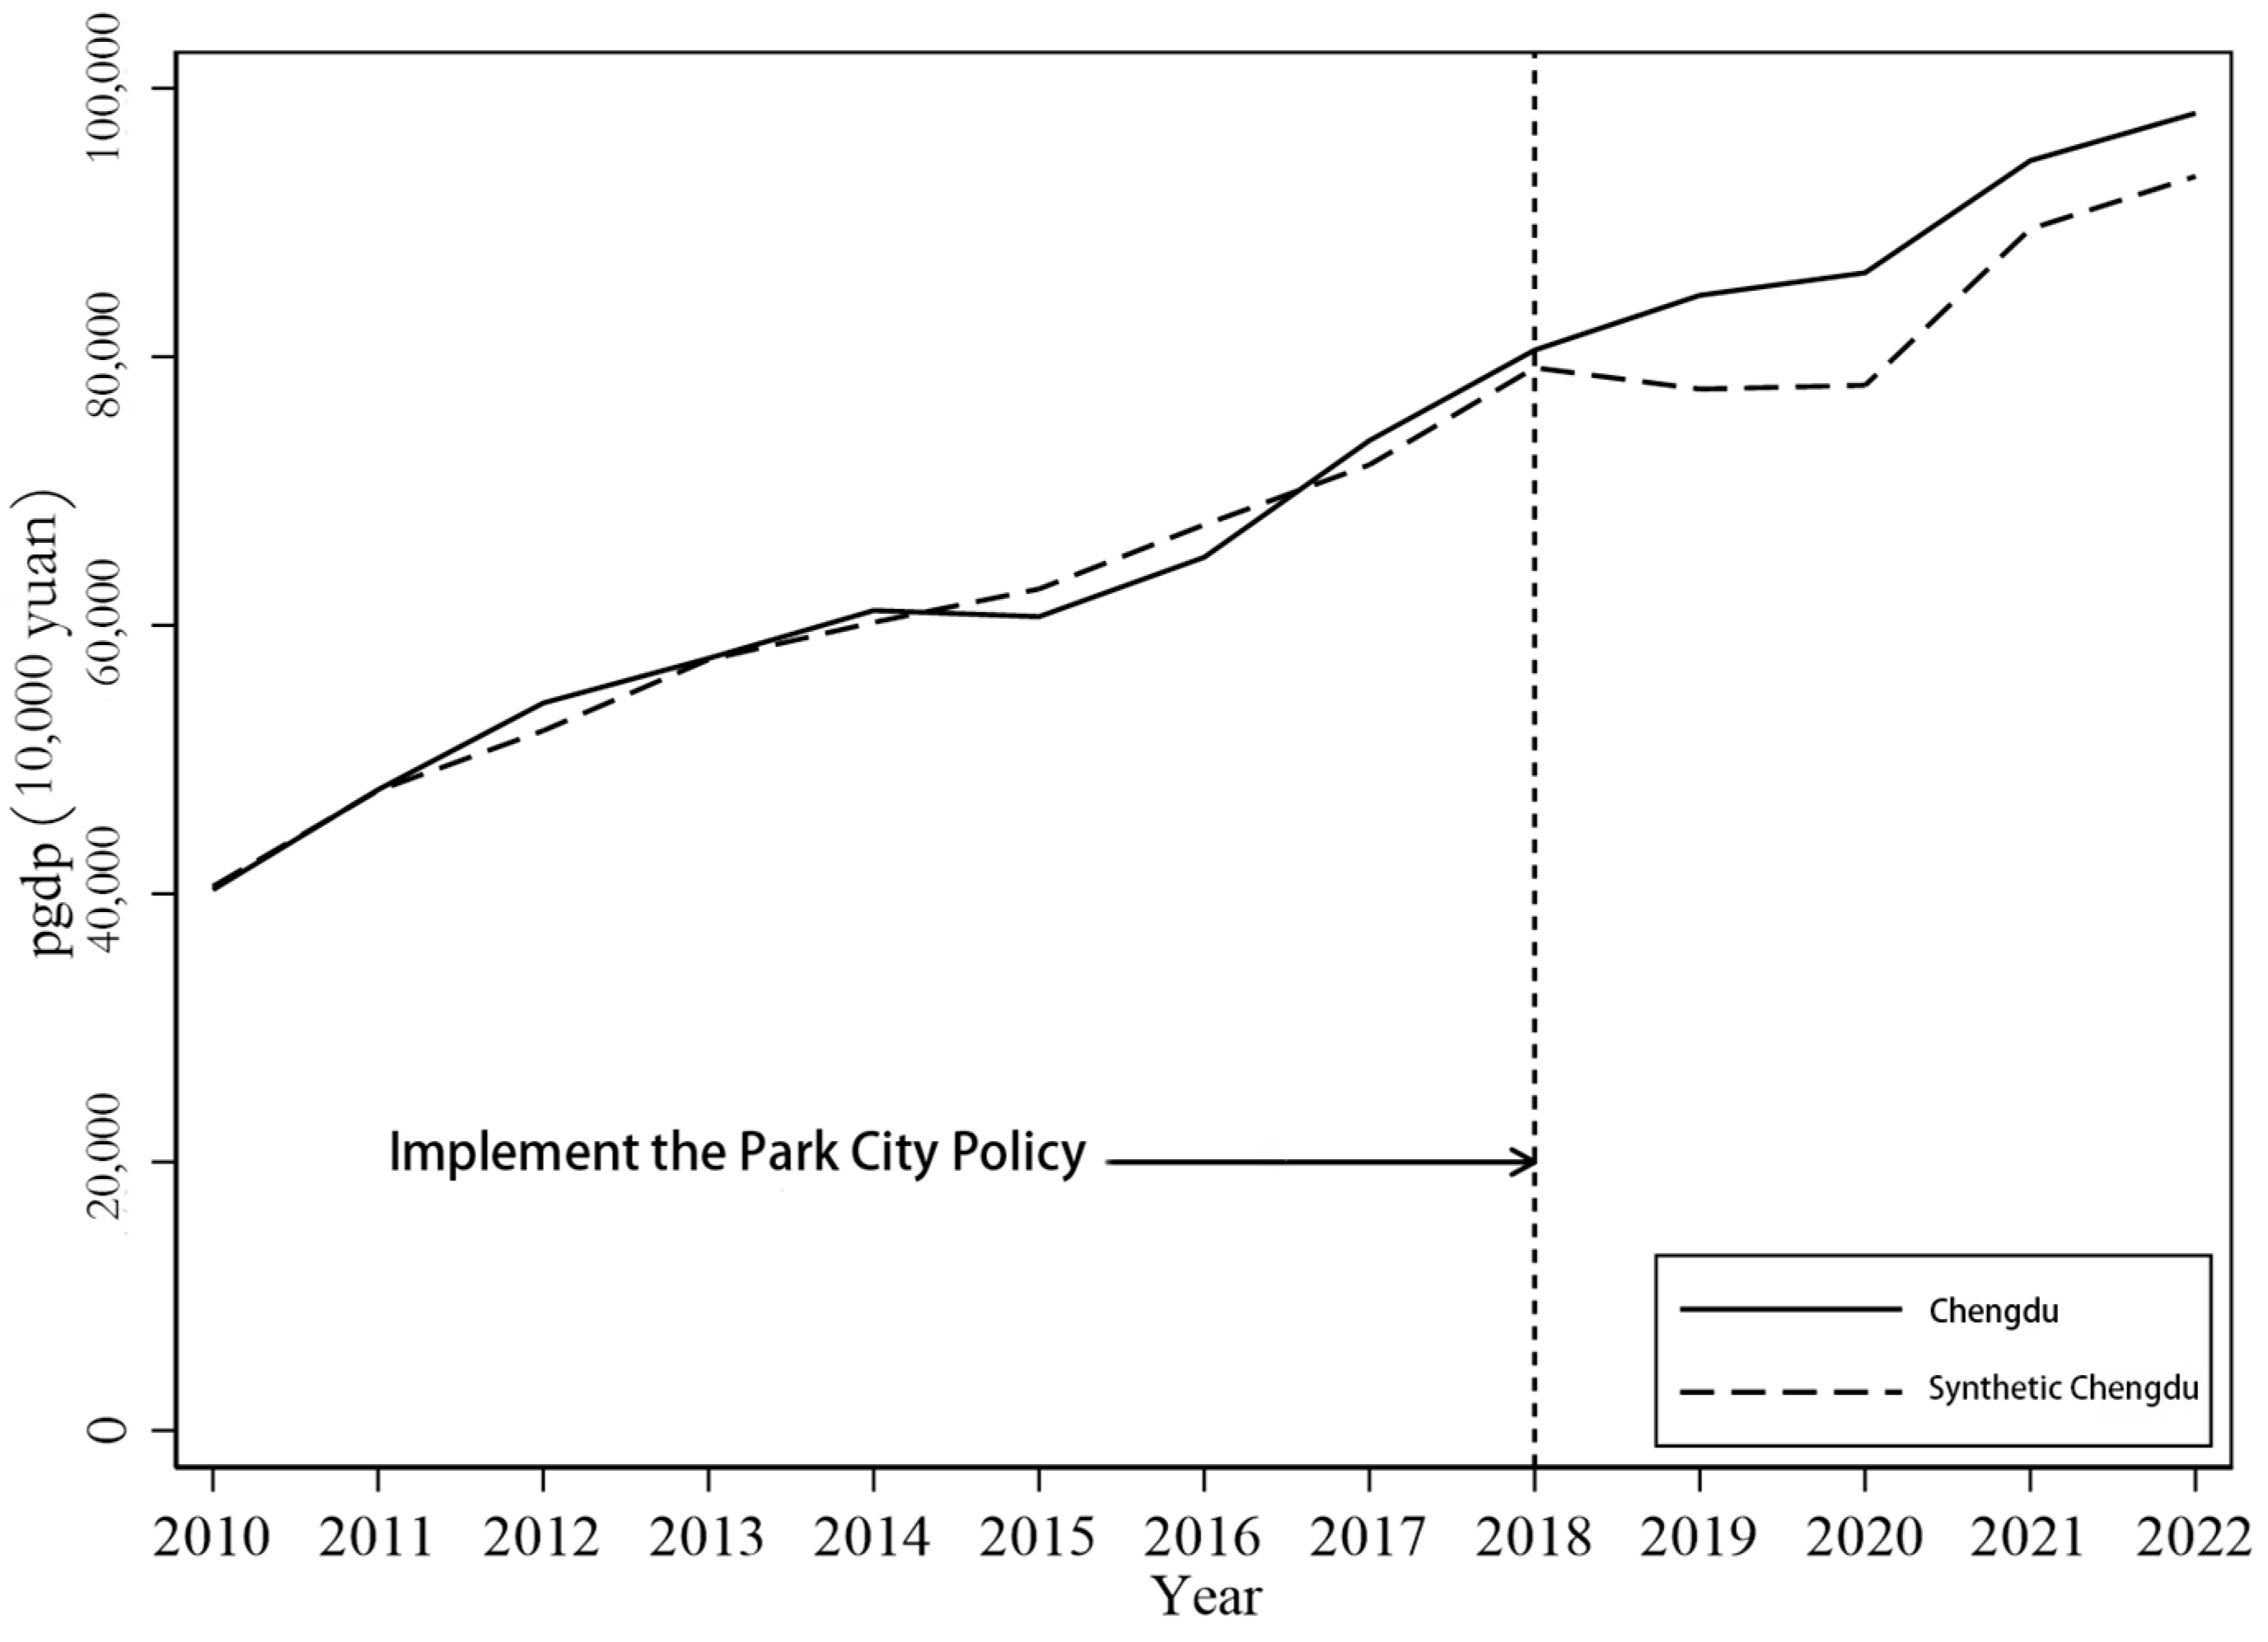
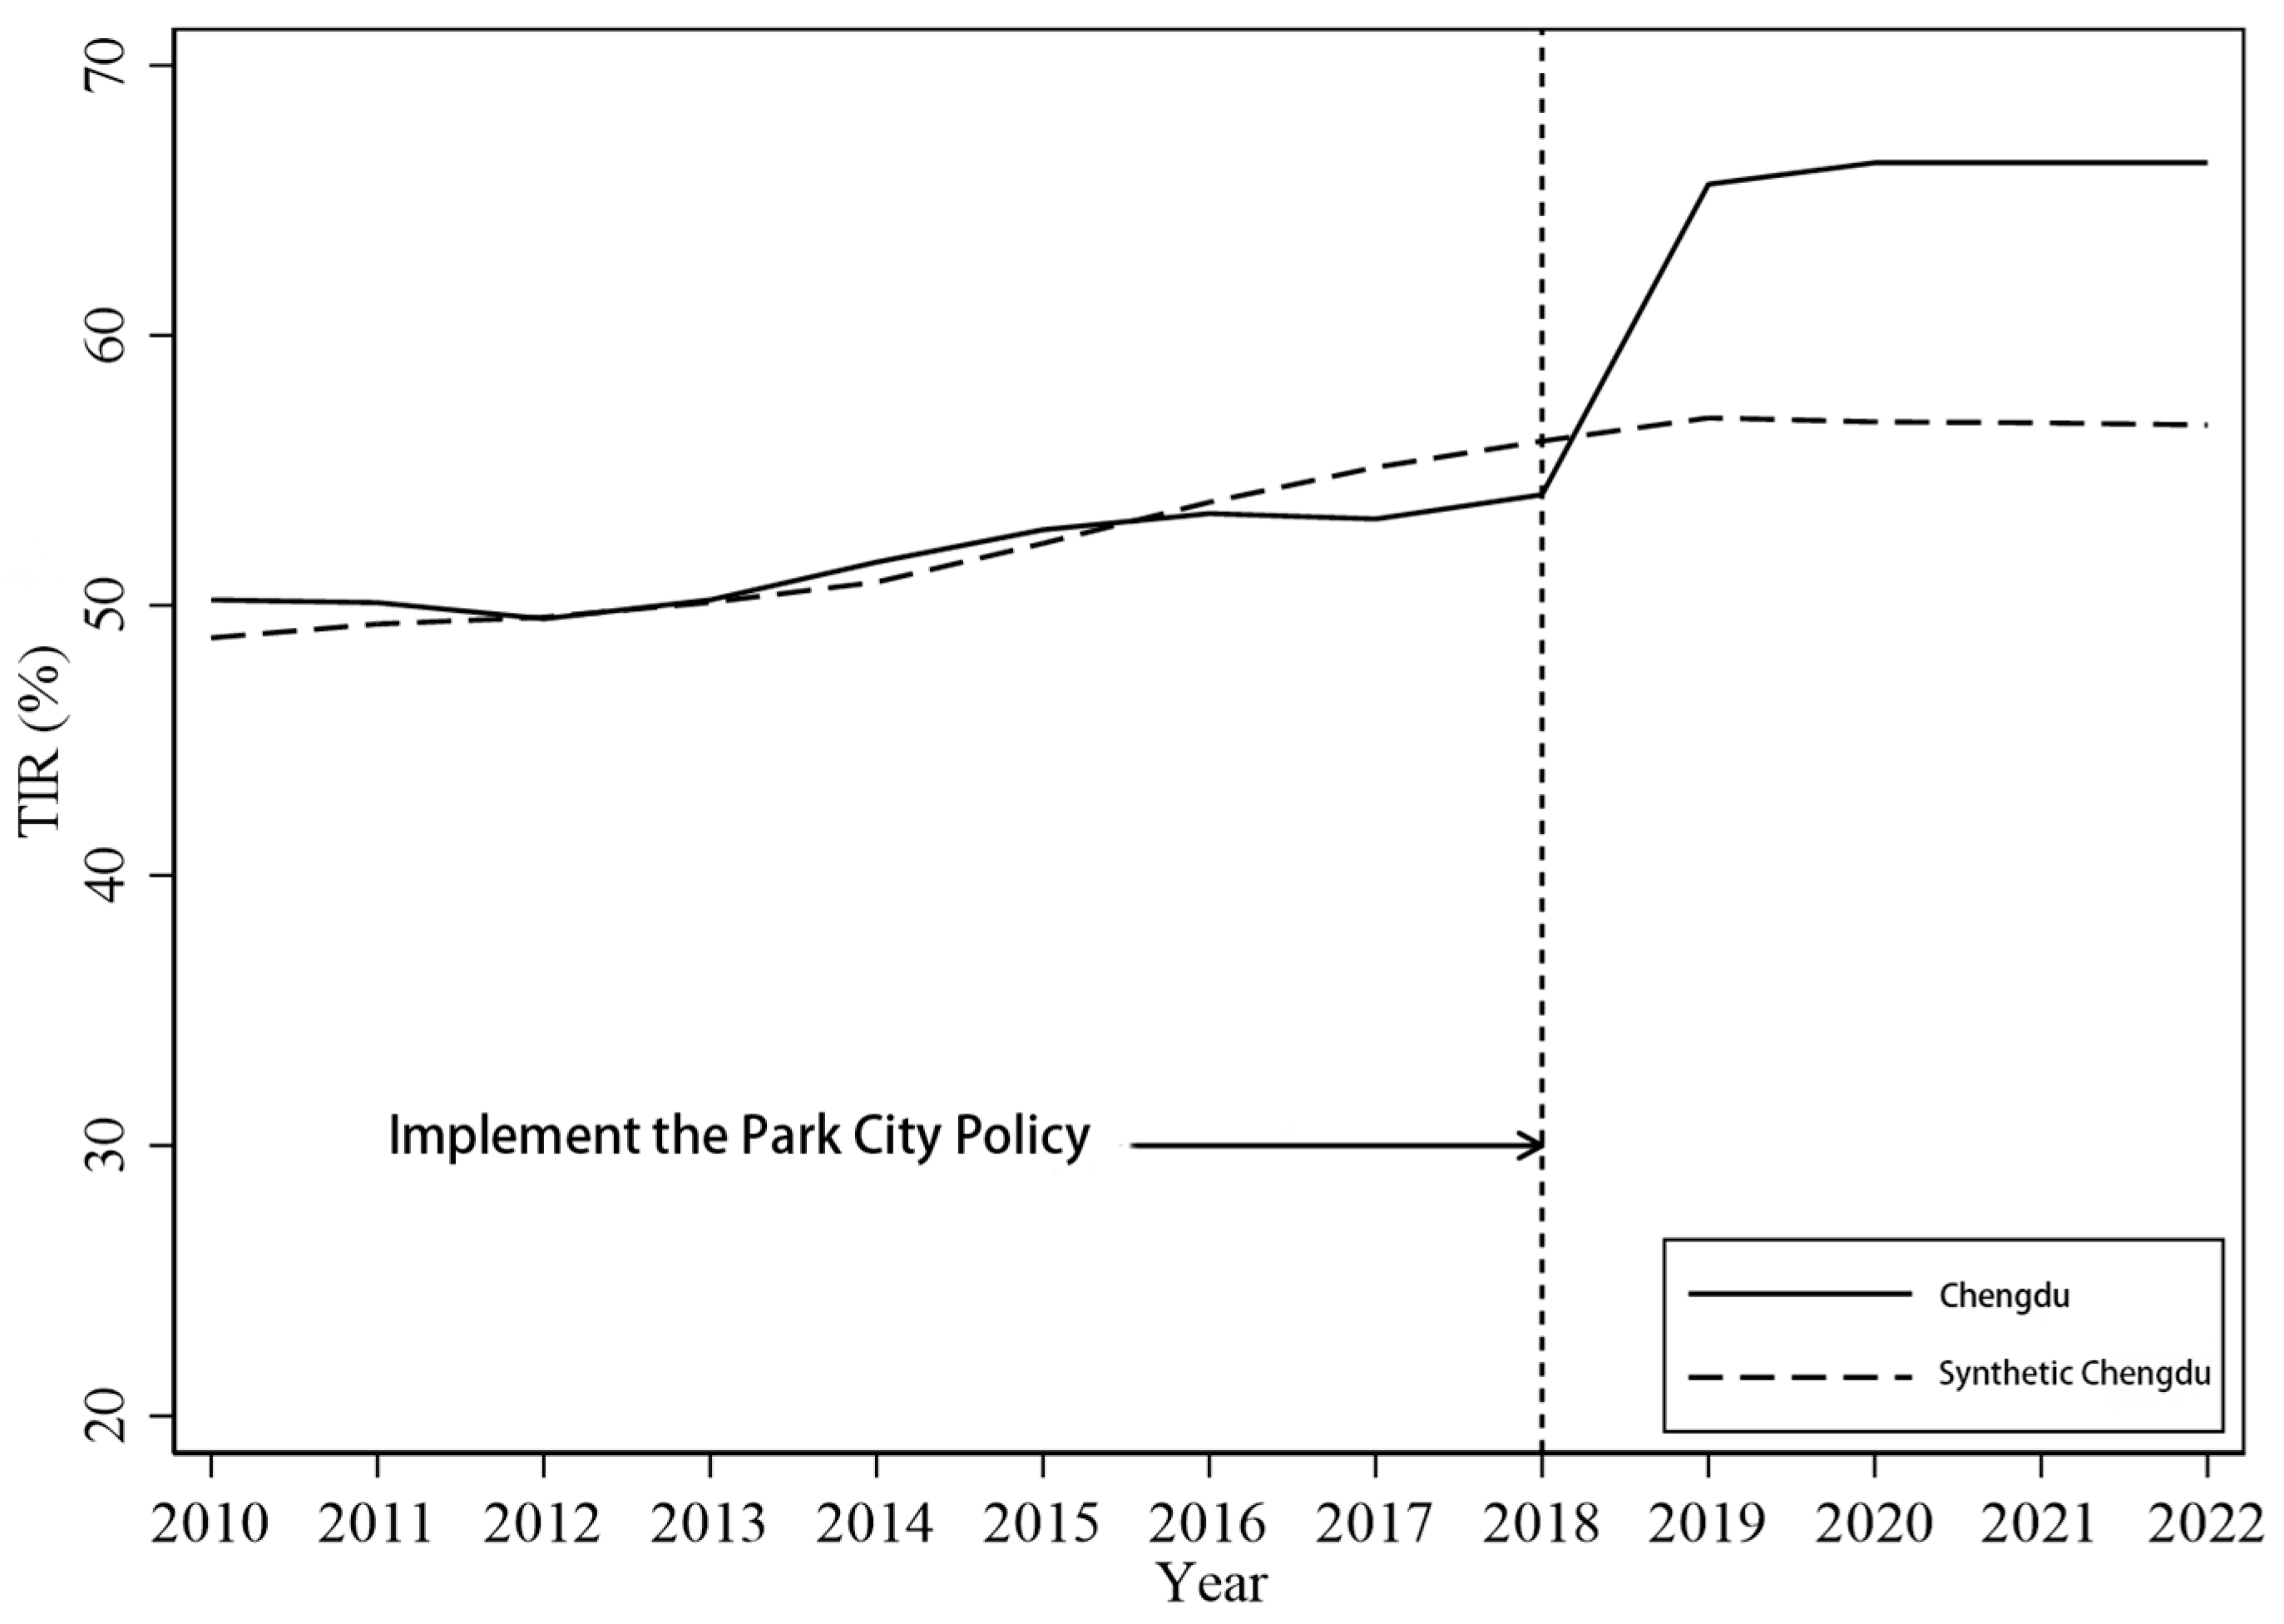
4.2. Analysis of Fitting Results Between Chengdu and Synthetic Chengdu
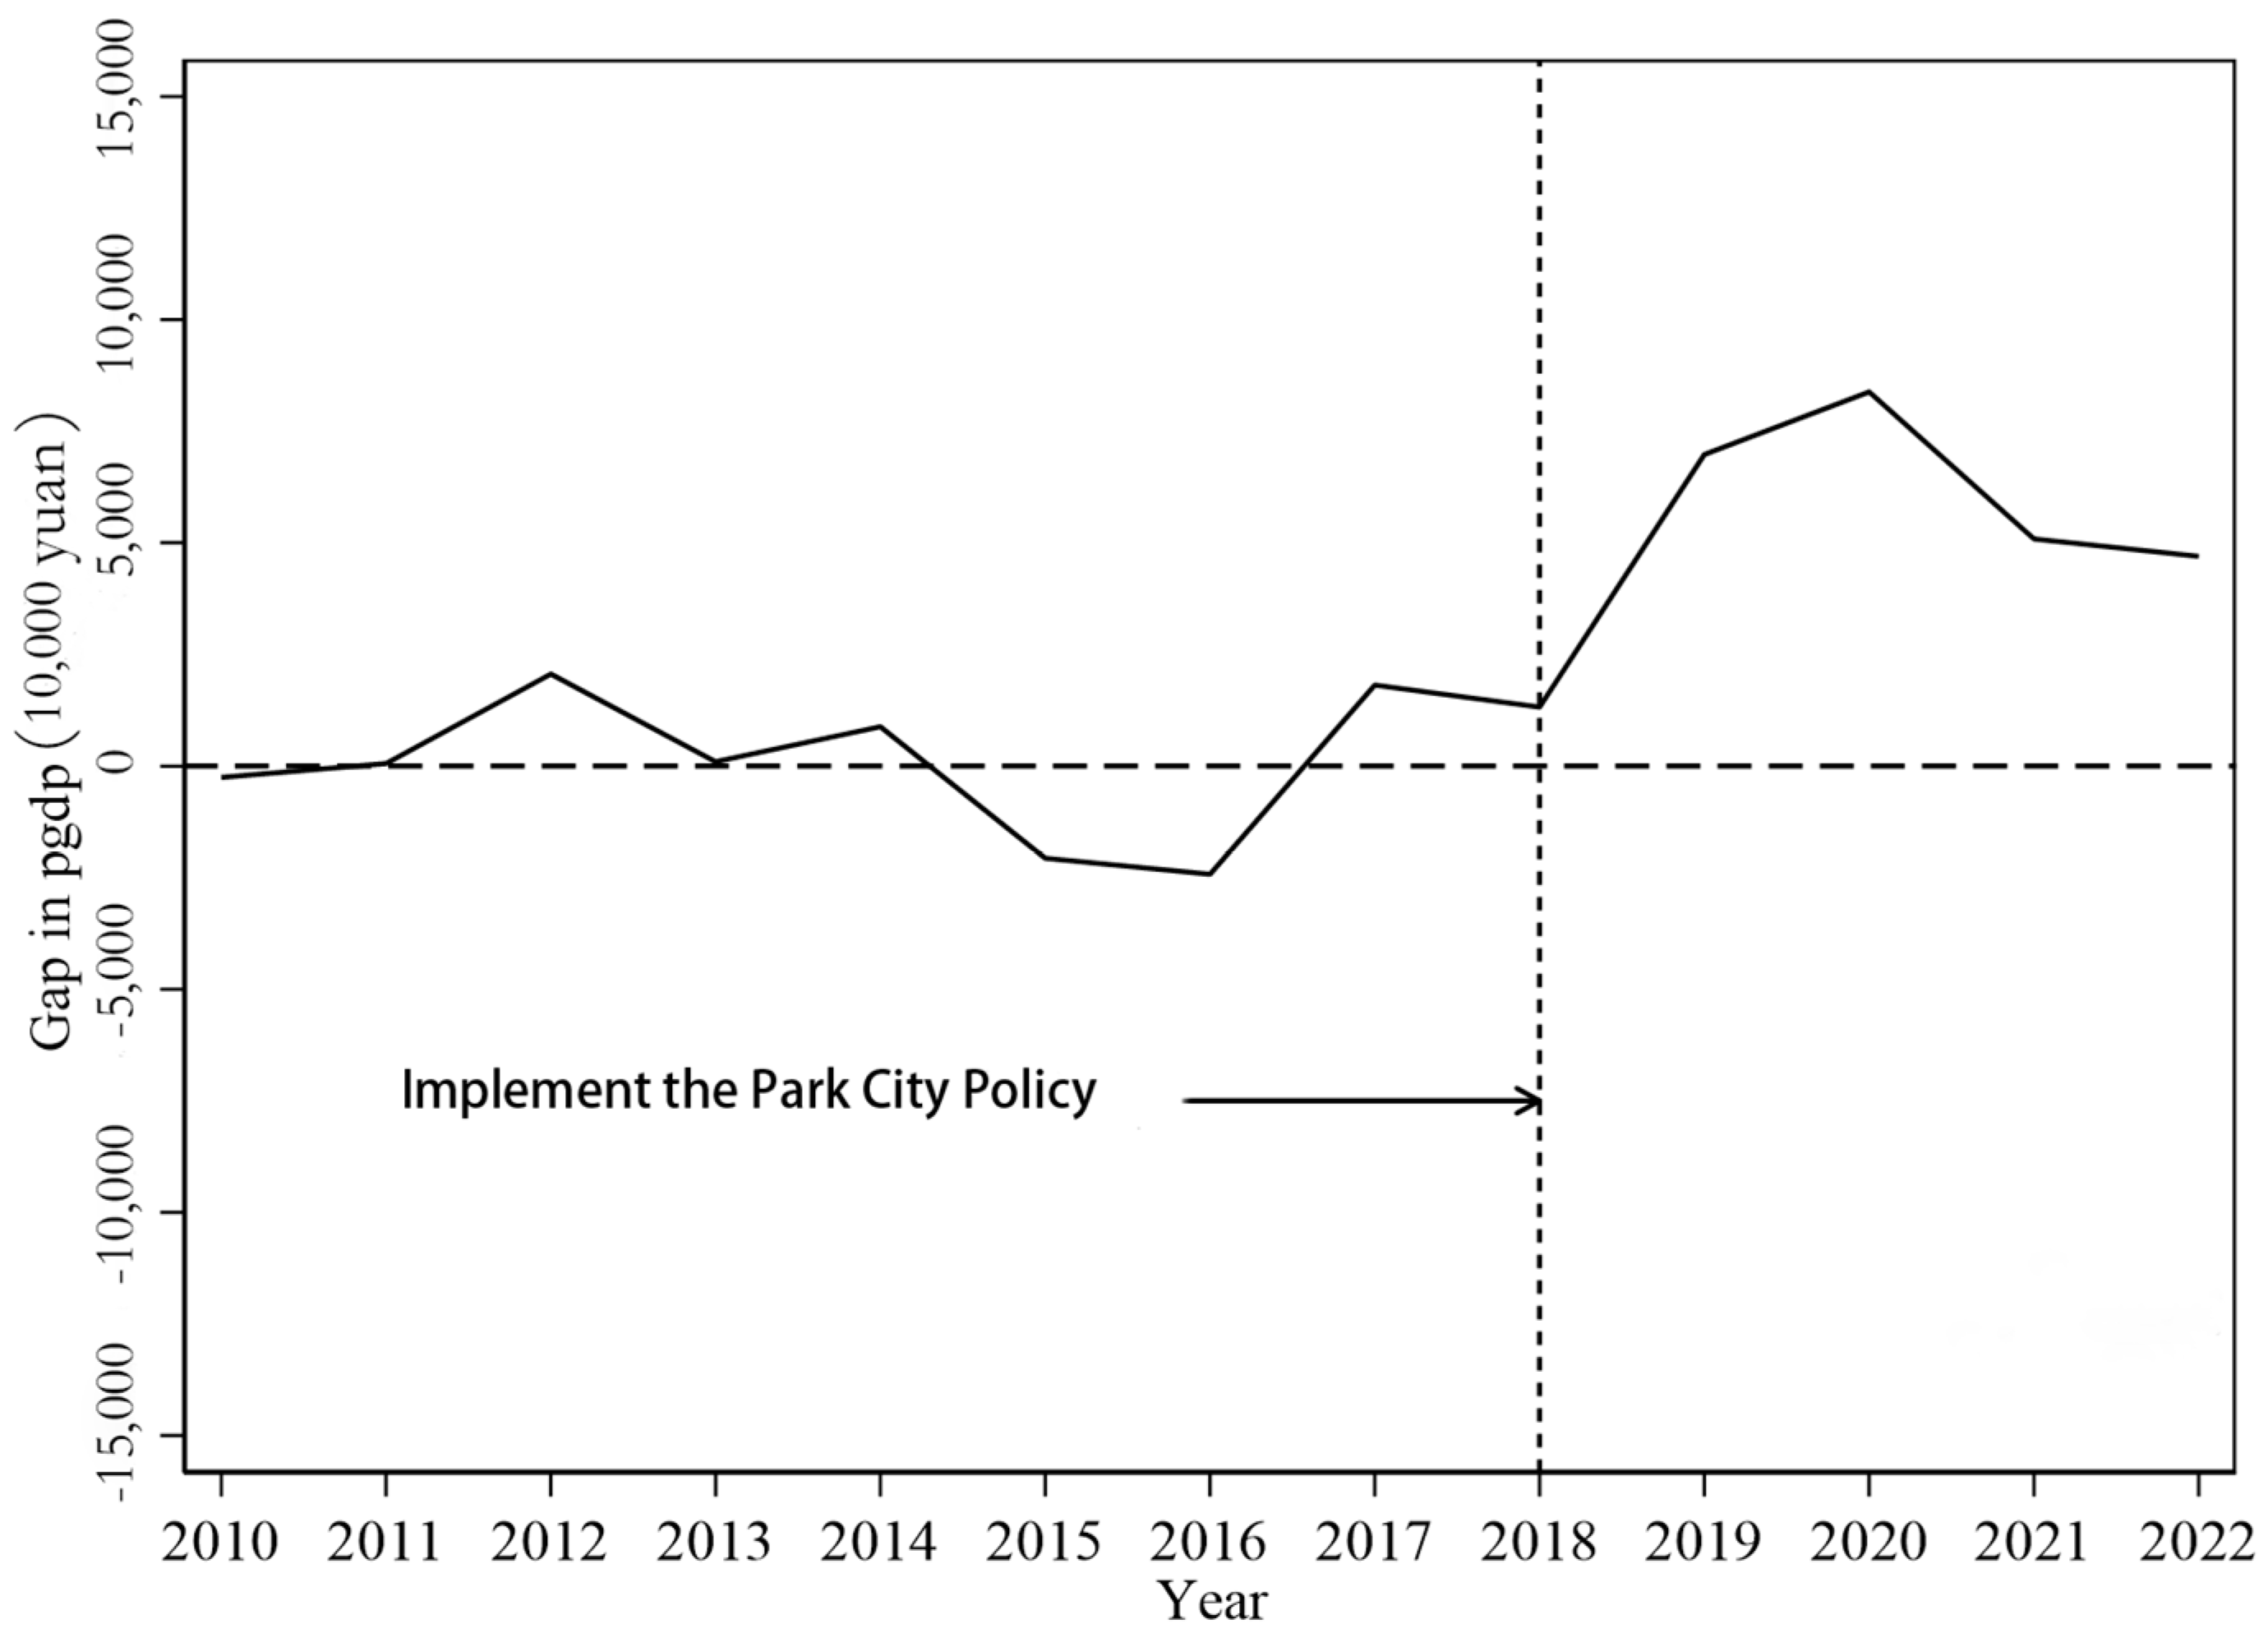
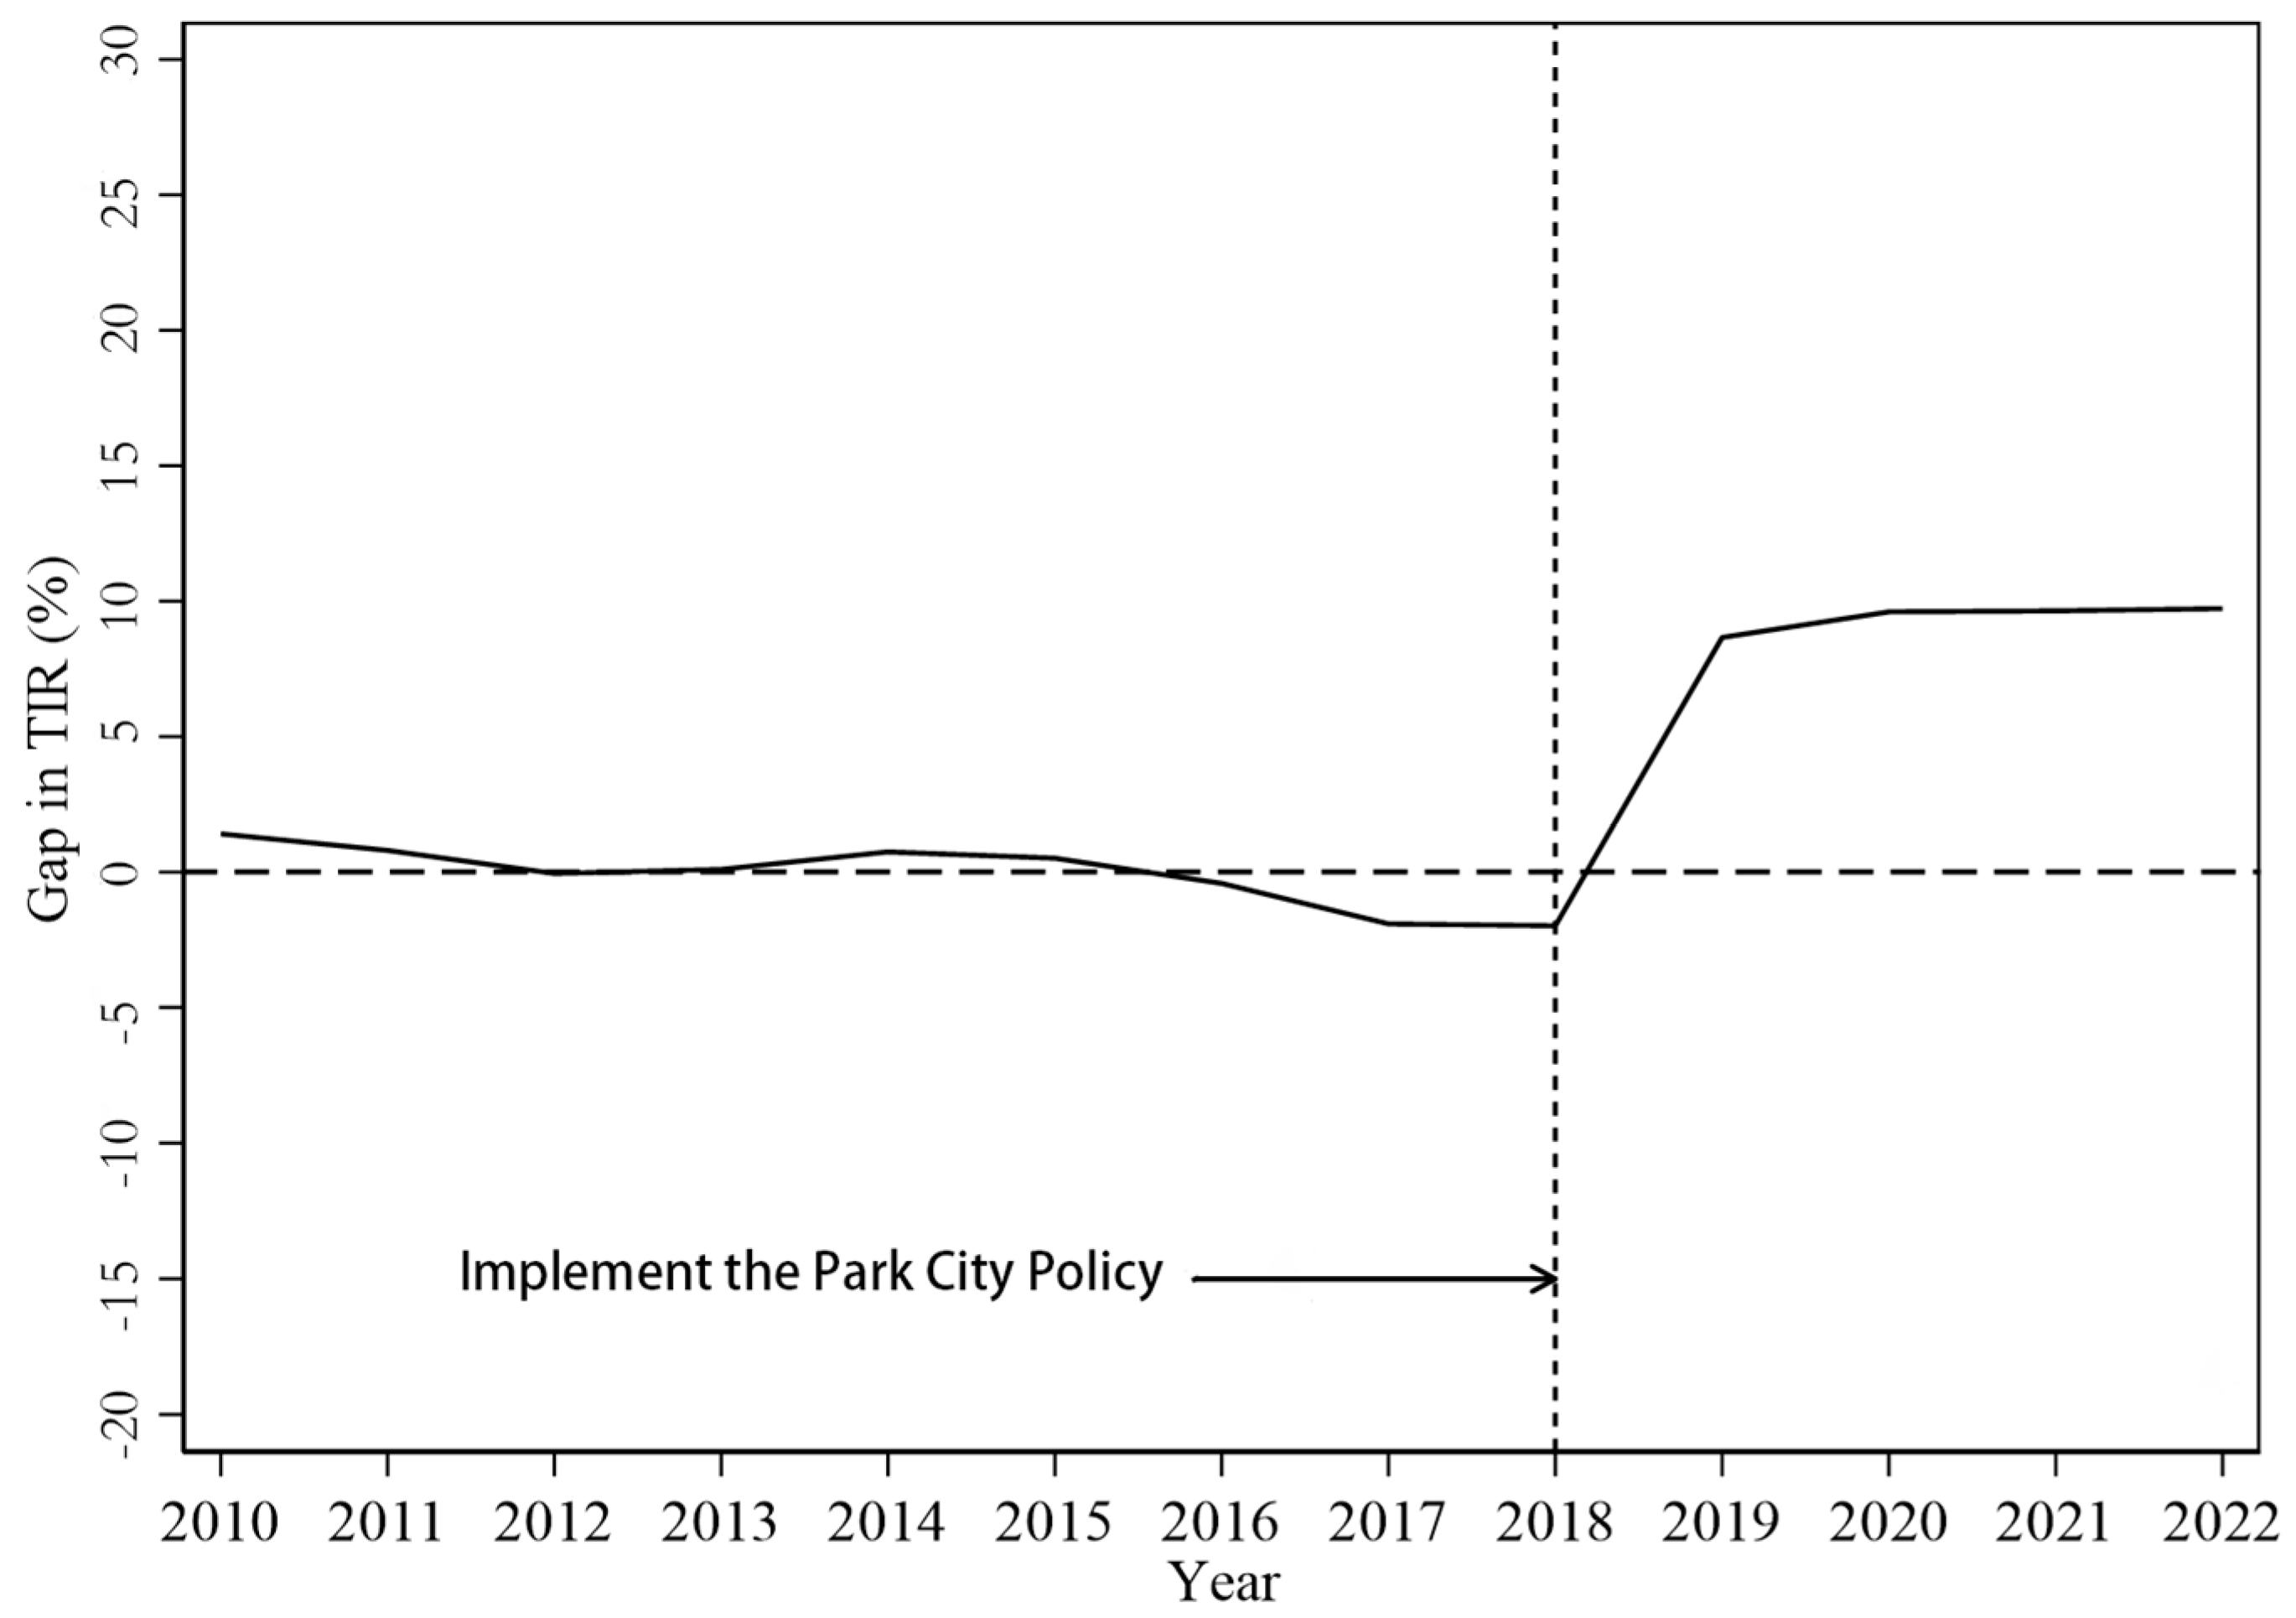
4.3. Analysis of the Effect of Park City Policy
5. Robustness Test
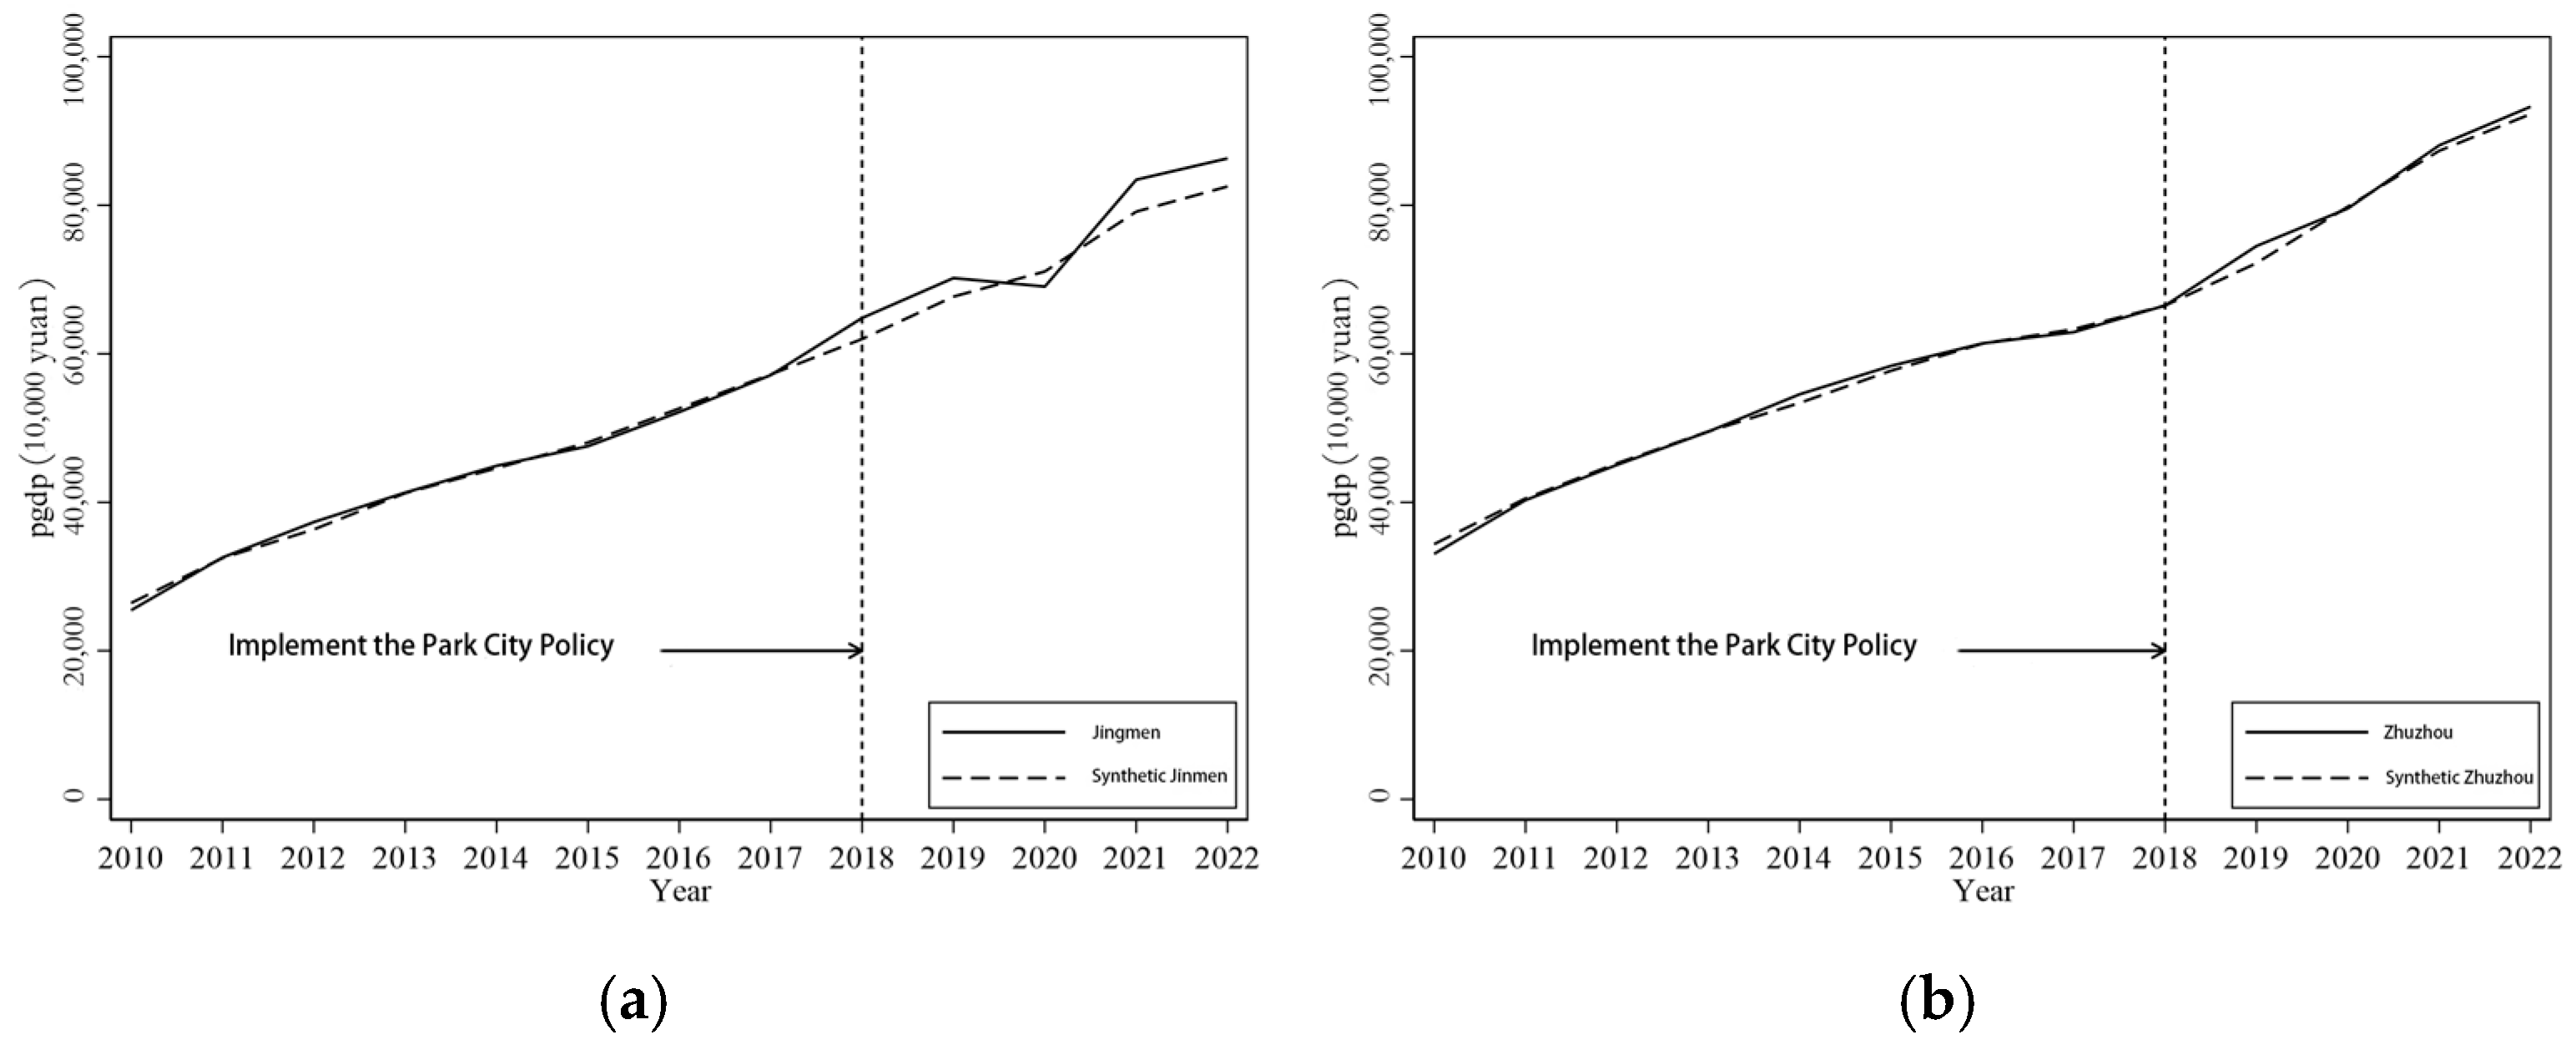
5.1. Placebo Test
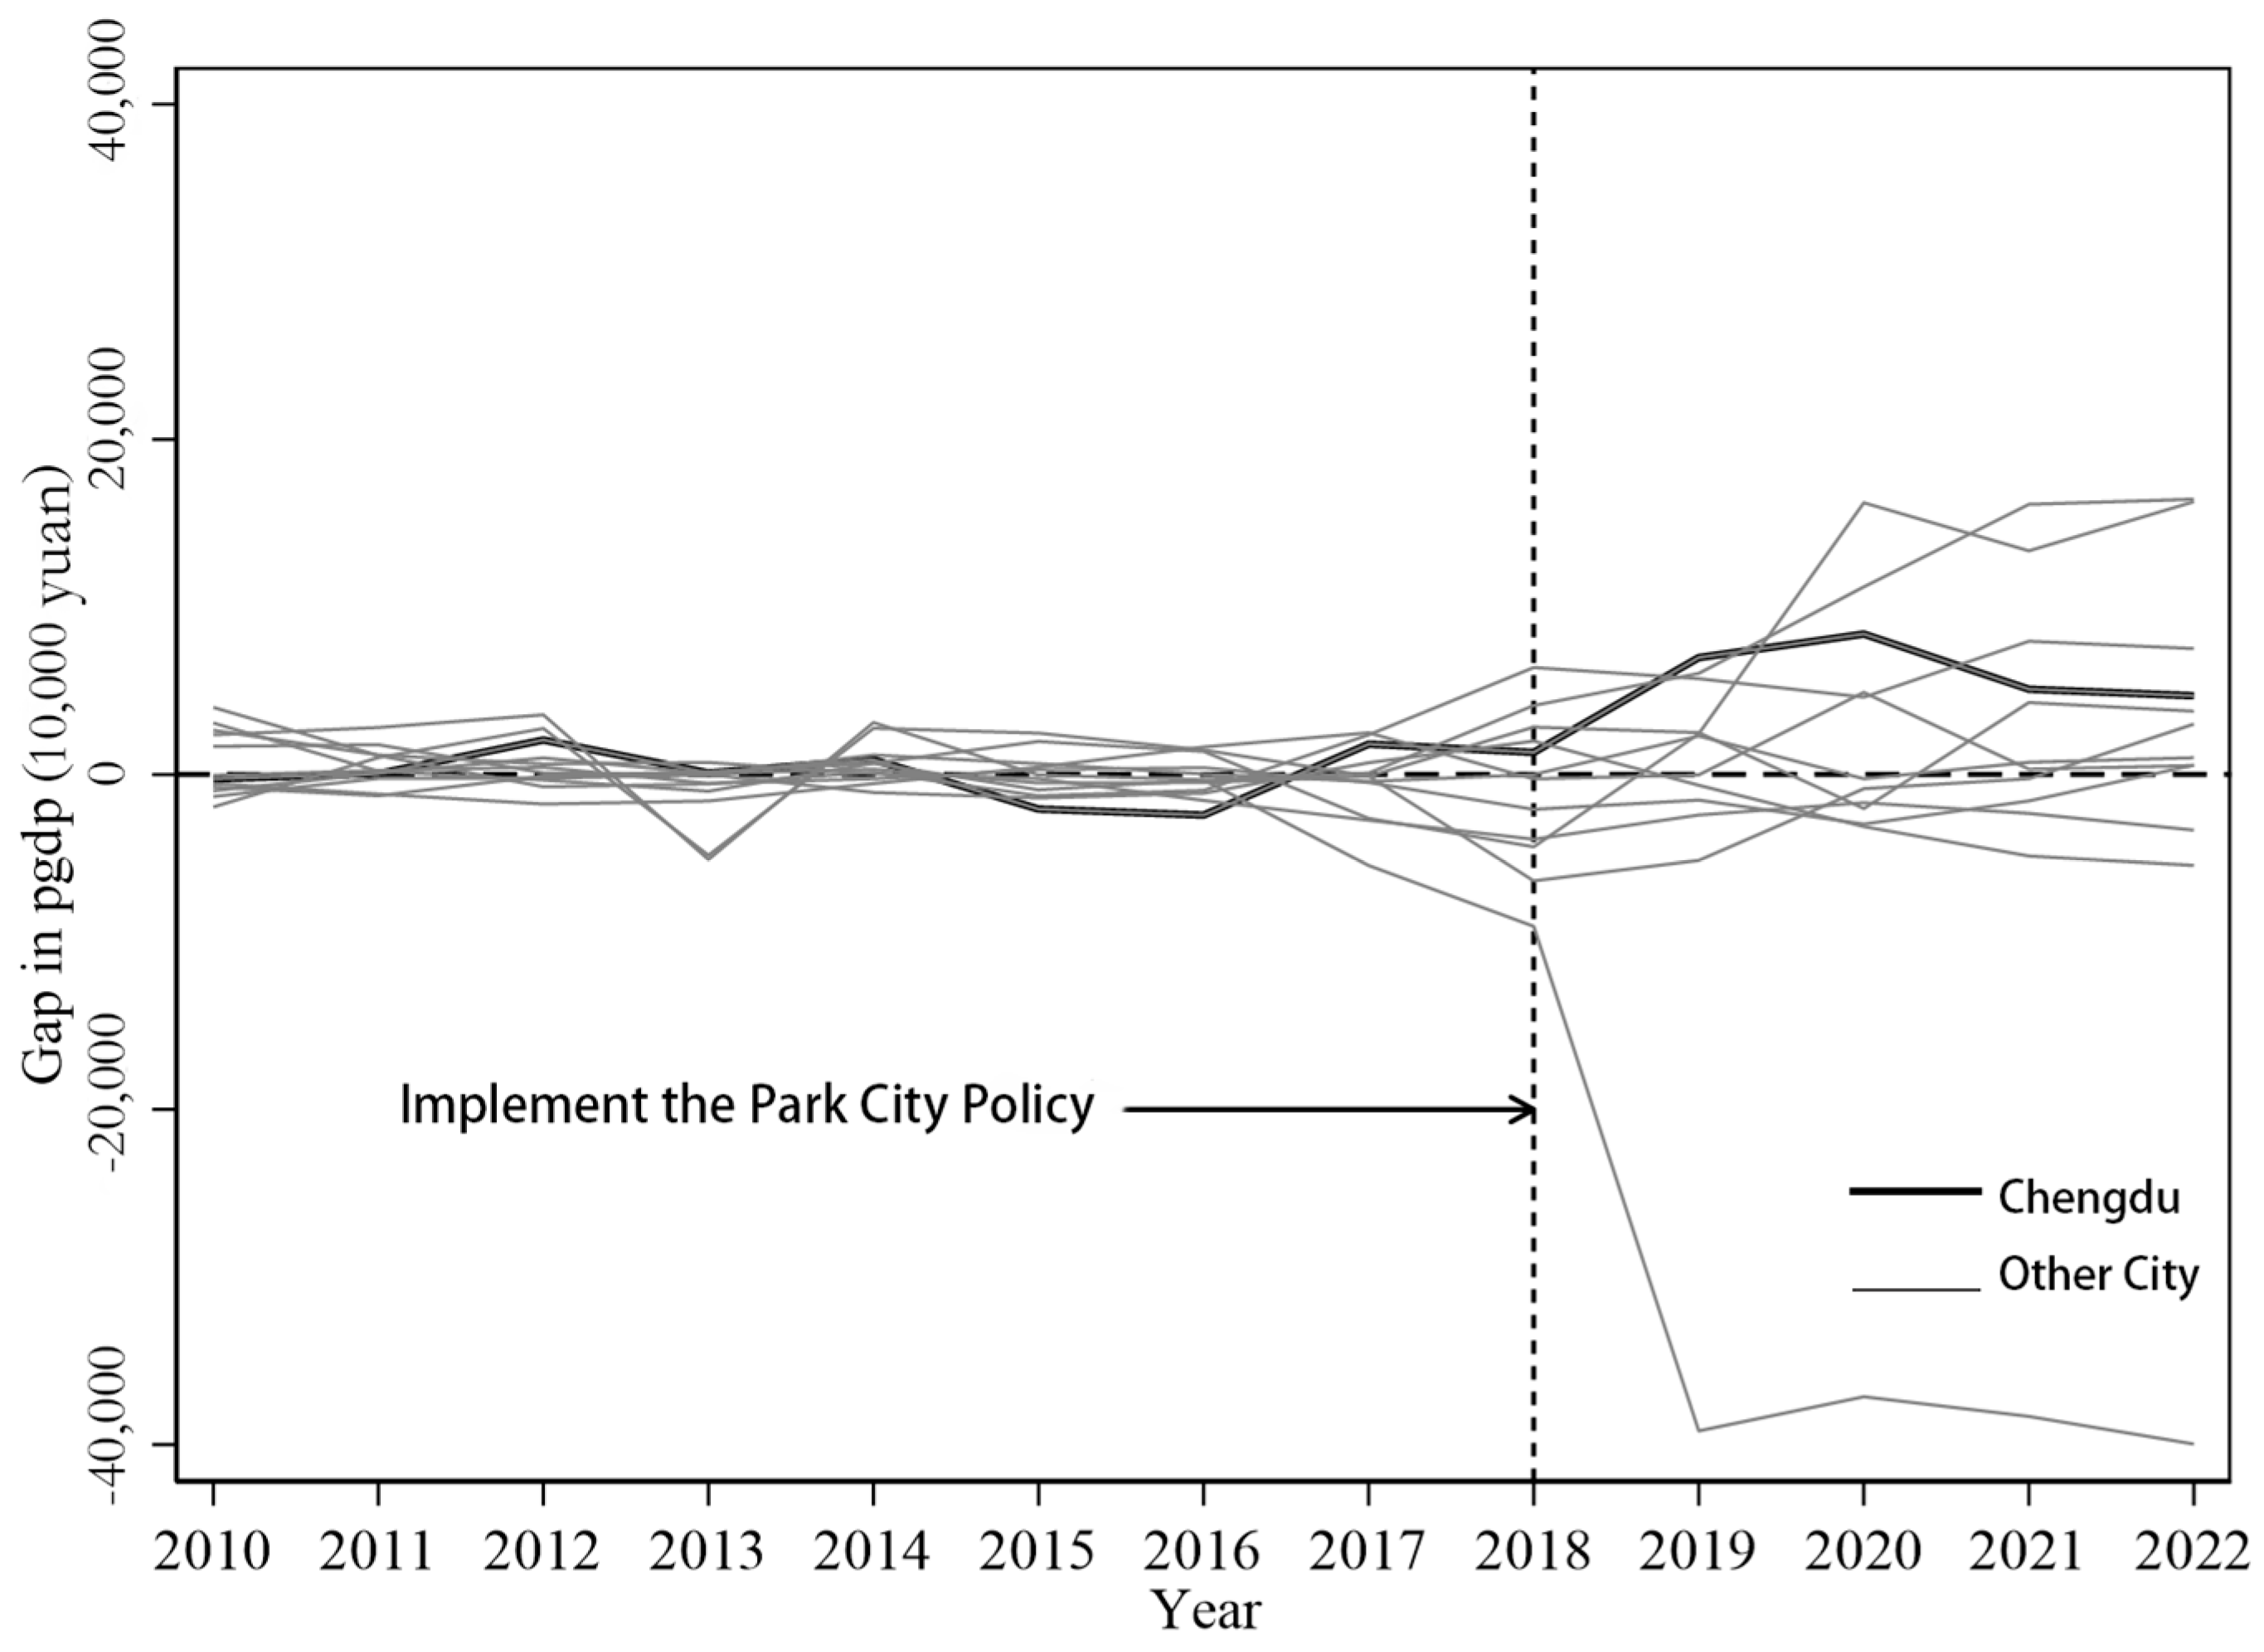
5.2. Ranking Test
6. Discussion and Conclusions
6.1. Discussion
6.2. Conclusions
- (1)
- Urban layout optimization and high-quality development drive. The construction of park cities reconfigures urban layouts via an integrated greenway system, enhancing environmental quality and functional efficiency. This attracts talent aggregation, facilitates industrial upgrading, and amplifies investment multiplier effects, thereby improving economic performance. To promote park city policies effectively, they should be tailored to the developmental stages and characteristics of individual cities. By leveraging the unique environmental features and industrial foundations of each city, refined construction strategies can optimize urban layouts and industrial patterns, fostering local technological innovation and industrial upgrading to achieve high-quality development goals.
- (2)
- Scientific assessment methods and promotion support. The bias-corrected synthetic control method addresses the issue of insufficient sample sizes during the early stages of policy implementation, confirming that the positive impacts on economic scale and industrial structure optimization in Chengdu are non-random. When promoting the park city model, it is essential to adopt scientific evaluation methods (e.g., the synthetic control method) to identify comparable city samples. Establishing a dynamic monitoring mechanism ensures robust data support for verifying policy effectiveness and facilitating national-scale promotion while mitigating endogenous biases.
- (3)
- Multi-dimensional development path exploration. Park city policies leverage green spaces to guide functional zoning and industrial agglomeration, yielding stable positive effects on economic scale and structural optimization. Cities should explore development paths suited to their specific conditions by integrating green space systems with local geographical contexts and strategically planning characteristic industries. Strengthening coordination across the upstream and downstream segments of industrial chains and promoting specialized upgrades in service sectors fosters a new urban development paradigm characterized by “environment-industry-service” synergy.
- (4)
- Effectiveness improvement and experience replication mechanism. The policy’s positive effects are both significant and robust. To expand its influence, case studies should be systematically analyzed and refined. A dual-track approach combining precise policy implementation with replicable model dissemination is recommended. On one hand, realistic and context-specific construction plans should be formulated; on the other hand, cross-regional demonstration projects can broaden the coverage of green benefits, accelerating the nationwide transition toward green and sustainable development.
Author Contributions
Funding
Data Availability Statement
Conflicts of Interest
References
- Kolimenakis, A.; Solomou, A.D.; Proutsos, N.; Avramidou, E.V.; Korakaki, E.; Karetsos, G.; Maroulis, G.; Papagiannis, E.; Tsagkari, K. The Socioeconomic Welfare of Urban Green Areas and Parks; A Literature Review of Available Evidence. Sustainability 2021, 13, 7863. [Google Scholar] [CrossRef]
- Bai, X.; Sehrish, S. Park City Leads the Way of Urban Development and Innovation in China. J. Environ. Eng. Landsc. Manag. 2023, 31, 240–247. [Google Scholar] [CrossRef]
- Dade, M.C.; Mitchell, M.G.; Brown, G.; Rhodes, J.R. The effects of urban greenspace characteristics and socio-demographics vary among cultural ecosystem services. Urban For. Urban Green. 2020, 49, 126641. [Google Scholar] [CrossRef]
- Feng, Q. Reviewed Interpretations and Inspirations on the Development and Strategies of Garden City Theory in Singapore. J. Archit. Res. Dev. 2021, 5, 7–13. [Google Scholar] [CrossRef]
- Hu, M.-C.; Wadin, J.L.; Lo, H.-C.; Huang, J.-Y. Transformation toward an eco-city: Lessons from three Asian cities. J. Clean. Prod. 2016, 123, 77–87. [Google Scholar] [CrossRef]
- Li, X.; Zhuang, X. Eco-city problems: Industry–city–ecology, urbanization development assessment in resource-exhausted cities. Sustainability 2022, 15, 166. [Google Scholar] [CrossRef]
- Zhang, J.G.; Yu, Z.W.; Zhao, B. Impact Mechanism of Urban Green Spaces in Promoting Public Health: Theoretical Framework and Inspiration for Practical Experiences. Landsc. Archit. Front. 2020, 8, 104–113. [Google Scholar] [CrossRef]
- Halecki, W.; Stachura, T.; Fudała, W.; Stec, A.; Kuboń, S. Assessment and planning of green spaces in urban parks: A review. Sustain. Cities Soc. 2023, 88, 104280. [Google Scholar] [CrossRef]
- Tan, R.; Wang, R.; Wang, Y.; Yi, D.; Chen, Y.; Cai, W.; Wang, X. The Park city perspective study: Revealing the park accessibility influenced by experiences of visitors under different travel modes. Front. Environ. Sci. 2022, 10, 924996. [Google Scholar] [CrossRef]
- Aslanoğlu, R.; Kazak, J.K.; Szewrański, S.; Świąder, M.; Arciniegas, G.; Chrobak, G.; Jakóbiak, A.; Turhan, E. Ten questions concerning the role of urban greenery in shaping the future of urban areas. Build. Environ. 2025, 267, 112154. [Google Scholar] [CrossRef]
- Aleha, A.; Zahra, S.M.; Qureshi, S.; Shah, S.; Marri, S.A.; Khan, M. Urban forests and their contribution to sustainable urban development in a global context: A case study of Multan, Pakistan. Front. Clim. 2024, 6, 1275102. [Google Scholar] [CrossRef]
- Liu, Y.L.; Zhang, Q.P.; Zheng, S.J.; Li, X.C. Research and Prospect of Park City in China Based on Bibliometric Analysis. Landscape 2021, 38, 70–76. [Google Scholar] [CrossRef]
- Zhao, Y.; Gong, P. Optimal Site Selection Strategies for Urban Parks Green Spaces Under the Joint Perspective of Spatial Equity and Social Equity. Front. Public Health 2024, 12, 1310340. [Google Scholar] [CrossRef]
- Zhao, X.; Ju, C. Coupling Coordination Relationship between Park Green Spaces and Urban Functional Spaces and Its Influencing Factors: A Case of Urumqi City. Arid. Land Geogr. 2024, 47, 898–908. [Google Scholar] [CrossRef]
- Zhong, Y.; Zhong, Y.; Zhang, L.; Tang, Z. The Path to Urban Sustainability: Urban Intelligent Transformation and Green Development—Evidence from 286 Cities in China. Sustainability 2024, 16, 10394. [Google Scholar] [CrossRef]
- Sun, Y.; Gao, J.; Chen, C. Research on Digital Greening Management of Smart Gardens in Chenggong District, Kunming City. Int. J. Manag. Sci. Res. 2024, 7, 19–25. [Google Scholar] [CrossRef]
- Hügel, S. From the garden city to the smart city. Urban Plan. 2017, 2, 1–4. [Google Scholar] [CrossRef]
- Nadiri, M.I.; Mamuneas, T.P. The effects of public infrastructure and R&D capital on the cost structure and performance of US manufacturing industries. Nat. Bur. Econ. Res. 1991. [Google Scholar] [CrossRef]
- Xiong, X.; Wang, Y.; Liu, B.; He, W.; Yu, X. The Impact of Green Finance on the Optimization of Industrial Structure: Evidence from China. PLoS ONE 2023, 18, e0289844. [Google Scholar] [CrossRef]
- Wu, W.; Zheng, J.; Han, L. The impact of new infrastructure construction on optimization and upgrading of industrial structure. Buildings 2023, 13, 2580. [Google Scholar] [CrossRef]
- Wang, L.; Zhou, J.; Wang, P.; Pan, C.; Li, H. Green Gentrification and Urban Parks: Exploring the Complex Dynamics of Commercial Transformation. J. Knowl. Econ. 2024, 1–33. [Google Scholar] [CrossRef]
- Zhang, Y.; Zeng, L.; Gao, J. Research on the Transformation of Ecological Value of Park City: Taking the Construction Practice of Chengdu as an Example. J. Sociol. Ethnol. 2022, 4, 91–98. [Google Scholar] [CrossRef]
- Ma, B.; Zhou, T.; Lei, S.; Wen, Y.; Htun, T.T. Effects of urban green spaces on residents’ well-being. Environ. Dev. Sustain. 2019, 21, 2793–2809. [Google Scholar] [CrossRef]
- Kim, K.; Jaehyun, K.; Frias, F.J.L.; Dattilo, J. Urban parks as spaces to pursue virtuous character, friendship, and contemplation: An Aristotelian perspective. J. Leisure Res. 2020, 51, 107–123. [Google Scholar] [CrossRef]
- Nath, T.K.; Sim Zhe Han, S.; Lechner, A.M. Urban green space and well-being in Kuala Lumpur, Malaysia. Urban For. Urban Green 2018, 36, 34–41. [Google Scholar] [CrossRef]
- Hu, Q.; Zheng, Y. Smart city initiatives: A comparative study of American and Chinese cities. J. Urban. Aff. 2021, 43, 504–525. [Google Scholar] [CrossRef]
- Foguesatto, C.R.; Volkmer Martins, B.; Tavares da Silveira, F.; Faccin, K.; Balestrin, A. The quality of life in an urban innovation ecosystem: Analyzing talents’ perception in Southern Brazil. Int. J. Innov. Sci. 2023, 15, 693–707. [Google Scholar] [CrossRef]
- Pan, J. The development paradigm of ecological civilization. In China’s Environmental Governing and Ecological Civilization; Springer: Berlin/Heidelberg, Germany, 2016; pp. 29–49. [Google Scholar] [CrossRef]
- Zeng, Z.; Cheng, L.; Shi, L. China’s green transformation through eco-industrial parks. World Dev. 2021, 140, 105249. [Google Scholar] [CrossRef]
- Wang, C. Green technology innovation, energy consumption structure and sustainable improvement of enterprise performance. Sustainability 2022, 14, 10168. [Google Scholar] [CrossRef]
- Xu, S.; Dong, H. Green Finance, Industrial Structure Upgrading, and High-Quality Economic Development–Intermediation Model Based on the Regulatory Role of Environmental Regulation. Int. J. Environ. Res. Public Health 2023, 20, 1420. [Google Scholar] [CrossRef]
- Qin, D.; Cagas, M.A.; Quising, P.; He, X.H. How much does investment drive economic growth in China? J. Policy Model. 2006, 28, 751–774. [Google Scholar] [CrossRef]
- Zhou, J.; Raza, A.; Sui, H. Infrastructure investment and economic growth quality: Empirical analysis of China’s regional development. Appl. Econ. 2021, 53, 2615–2630. [Google Scholar] [CrossRef]
- O’Callaghan, B.; Yau, N.; Hepburn, C. How stimulating is a green stimulus? The economic attributes of green fiscal spending. Annu. Rev. Environ. Resour. 2022, 47, 697–723. [Google Scholar] [CrossRef]
- Qu, Y.; Ni, H.; Zhao, J.; Chen, G.; Liu, C. Quantitative Analysis of the Impact of Ecological Industry and Ecological Investment on the Economy: A Case Study of Beijing, China. Sustainability 2022, 14, 9889. [Google Scholar] [CrossRef]
- Feng, S.; Shafiei, M.W.M.; Ng, T.F.; Ren, J.; Jiang, Y. The Intersection of Economic Growth and Environmental Sustainability in China: Pathways to Achieving SDG. Energy Strategy Rev. 2024, 55, 101530. [Google Scholar] [CrossRef]
- Agrawal, R.; Agrawal, S.; Samadhiya, A.; Kumar, A.; Luthra, S.; Jain, V. Adoption of green finance and green innovation for achieving circularity: An exploratory review and future directions. Geosci. Front. 2024, 15, 10166. [Google Scholar] [CrossRef]
- Abadie, A.; Diamond, A.; Hainmueller, J. Synthetic Control Methods for Comparative Case Studies: Estimating the Effect of California’s Tobacco Control Program. J. Am. Stat. Assoc. 2010, 105, 490, 493–505. [Google Scholar] [CrossRef]
- Abadie, A. Using Synthetic Controls: Feasibility, Data Requirements, and Methodological Aspects. J. Econ. Lit. 2021, 59, 391–425. [Google Scholar] [CrossRef]
- Fredriksson, A.; de Oliveira, G.M. Impact evaluation using Difference-in-Differences. RAUSP Manag. J. 2019, 54, 519–532. [Google Scholar] [CrossRef]
- St. Clair, T.; Cook, T.D. Difference-in-differences methods in public finance. Natl. Tax J. 2015, 68, 319–338. [Google Scholar] [CrossRef]
- Abadie, A.; Gardeazabal, J. The economic costs of conflict: A case study of the Basque Country. Am. Econ. Rev. 2003, 93, 113–132. [Google Scholar] [CrossRef]
- Wang, L.-H.; Liu, Z.-H. The Impact of the Shanghai Free Trade Zone on Regional Economy: A Counterfactual Perspective. Int. Trade Issues 2017, 2, 3–15. [Google Scholar] [CrossRef]
- Abadie, A.; L’Hour, J. A Penalized Synthetic Control Estimator for Disaggregated Data. J. Am. Stat. Assoc. 2021, 116, 1817–1834. [Google Scholar] [CrossRef]
- Ben-Michael, E.; Feller, A.; Rothstein, J. The augmented synthetic control method. J. Am. Stat. Assoc. 2021, 116, 1789–1803. [Google Scholar] [CrossRef]
- Ren, B.; Fan, Q. Heterogeneous Technological Progress, Trade and Circulation Efficiency Improvement, and Economic Development: From the Perspective of Spatial Spillover Effects. J. Commercial Econ. 2022, 20, 18–21. [Google Scholar] [CrossRef]
- Li, G.; Chen, F. The Impact of China’s Digital Economy on High-Quality Economic Development. Contemp. Econ. Res. 2023, 8, 102–116. [Google Scholar] [CrossRef]
- Jin, H.; Li, P. The Impact of Property Taxes on Basic Public Services: Empirical Evidence from Shanghai and Chongqing. J. Financ. Econ. 2023, 49, 64–78. [Google Scholar]
- Fedulova, I.; Voronkova, O.Y.; Zhuravlev, P.; Gerasimova, E.; Glyzina, M.; Alekhina, N.A. Labor productivity and its role in the sustainable development of economy: On the example of a region. Entrep. Sustain. Issues 2019, 7, 1059. [Google Scholar] [CrossRef]
- Heshmati, A.; Su, B. Development and Sources of Labor Productivity in Chinese Provinces. China Econ. Policy Rev. 2013, 2, 1350005. [Google Scholar] [CrossRef]
- Cao, R.Z.; Dai, C.J.; He, T.T. Labor productivity and economic growth. Sci. Econ. Soc. 2008, 1, 61–63+68. [Google Scholar]
- Xu, J. Relative Difference Analysis of the Relationship between Regional Population and Economic Growth. J. Econ. Issues Explor. 2021, 42, 81–90. [Google Scholar]
- Wang, C.; Zhang, M. The Impact of Local Government Debt on Economic Growth: A Perspective Based on the Debt Inflection Point. Contemp. Econ. Res. 2023, 8, 117–128. [Google Scholar]
- Li, Y.; Wu, M. Green Technological Innovation, Carbon Emission Reduction, and the Spatiotemporal Coupling and Influencing Factors of High-Quality Economic Development. Stat. Decis. 2023, 39, 77–81. [Google Scholar]
- Sun, Q.; Feng, Y.; Tang, Y.; Yin, G.; Ren, G.P.; Kuang, W. The Impact of Land Finance on Economic Growth in China’s Resource-Based Cities—The Mediating Role of Housing Prices. J. Nat. Resour. 2023, 38, 126–139. [Google Scholar]
- Hosan, S.; Karmaker, S.C.; Rahman, M.M.; Chapman, A.J.; Saha, B.B. Dynamic links among the demographic dividend, digitalization, energy intensity and sustainable economic growth: Empirical evidence from emerging economies. J. Clean. Prod. 2022, 330, 129858. [Google Scholar] [CrossRef]
- Su, Y.; Xu, H.; Zhang, X. How Can Public Spaces Contribute to Increased Incomes for Urban Residents—A Social Capital Perspective. Land 2024, 13, 945. [Google Scholar] [CrossRef]
- Duval, R.; Vogel, L. Economic resilience to shocks: The role of structural policies. OECD J. Econ. Stud. 2008, 2008, 1–38. [Google Scholar] [CrossRef]
- Wei, Z.; Hao, R. Demographic structure and economic growth: Evidence from China. J. Comp. Econ. 2010, 38, 472–491. [Google Scholar] [CrossRef]
- Wang, X.; Sun, W. Discrepancy between registered and actual unemployment rates in China: An investigation in provincial capital cities. China World Econ. 2014, 22, 40–59. [Google Scholar] [CrossRef]
- Yue, L.; Ren, W.; Cao, Y. The Impact of Heterogeneous Environmental Regulation on the Green Economy—An Analysis of the Mediating Effect of Green Innovation. Soft Sci. 2022, 36, 57–64. [Google Scholar]
- Xiao, Z.Y.; Zhang, Y.F.; Li, H.H. Research on the High-Quality Development and Influencing Factors of China’s Three Major Urban Agglomerations—A Perspective Based on the Coupling Coordination of Population, Economy, and Environment. Econ. Issues Explor. 2023, 9, 94–109. [Google Scholar]
- Agrawal, A.; Brandhorst, S.; Jain, M.; Liao, C.; Pradhan, N.; Solomon, D. From environmental governance to governance for sustainability. One Earth 2022, 5, 615–621. [Google Scholar] [CrossRef]
- Badiu, D.L.; Iojă, C.I.; Pătroescu, M.; Breuste, J.; Artmann, M.; Niță, M.R.; Grădinaru, S.R.; Hossu, C.A.; Onose, D.A. Is urban green space per capita a valuable target to achieve cities’ sustainability goals? Romania as a case study. Ecol. Indic. 2016, 70, 53–66. [Google Scholar] [CrossRef]
- Gupta, K.; Kumar, P.; Pathan, S.K.; Sharma, K.P. Urban Neighborhood Green Index–A measure of green spaces in urban areas. Landsc. Urban Plan 2012, 105, 325–335. [Google Scholar] [CrossRef]
- Eggers, A.C.; Tuñón, G.; Dafoe, A. Placebo tests for causal inference. Am. J. Political Sci. 2024, 68, 1106–1121. [Google Scholar] [CrossRef]
- Chen, Q.; Yan, G. A mixed placebo test for synthetic control method. Econ. Lett. 2023, 224, 111004. [Google Scholar] [CrossRef]
- Sueyoshi, T.; Aoki, S. A use of a nonparametric statistic for DEA frontier shift: The Kruskal and Wallis rank test. Omega 2001, 29, 1–18. [Google Scholar] [CrossRef]
- Rana, H.M.U.; O’Connor, F. Domestic macroeconomic determinants of precious metals prices in developed and emerging economies: An international analysis of the long and short run. Int. Rev. Financ. Anal. 2023, 89, 102813. [Google Scholar] [CrossRef]


| Variable | Standard Tier | Feature Layers | Indicator Layer | Variable Symbol | Unit |
|---|---|---|---|---|---|
| Policy Effect variables | Park City Construction Performance | The size of the city’s economy | GDP per capita | PGDP | Yuan |
| The economic structure of the city | Proportion of tertiary industry structure | TIR | % | ||
| predictor variables | Economic subsystem | Economic potential | Labor productivity of the whole society | LP | Yuan/person |
| Social subsystem | Demographic structure | Natural population growth rate | NPGR | % | |
| Population growth rate | PGR | % | |||
| Public services | Number of hospital beds per 1000 people | HBC | bed/thousand persons | ||
| Labor and employment | Registered unemployment rate | RUR | % | ||
| Ecological subsystem | Environmental Fundamentals | The per capita area of park green space in the city | PGSA | m2/person | |
| Green coverage of built-up areas | GCR | % | |||
| Environmental Fundamentals | Municipal sewage treatment rate | STR | % |
| Variable | Sample Size | Mean | Standard Deviation | Minimum | Maximum |
|---|---|---|---|---|---|
| PGDP | 221 | 79,339.500 | 41,870.080 | 12,839.220 | 199,017.000 |
| TIR | 221 | 47.143 | 7.837 | 30.100 | 66.400 |
| LP | 221 | 213,831.900 | 194,980.200 | 4746.927 | 1,098,564.000 |
| NPGR | 221 | 3.725 | 3.400 | −3.800 | 22.400 |
| PGR | 221 | 0.020 | 0.181 | −0.685 | 1.683 |
| HBC | 221 | 5.940 | 1.738 | 2.190 | 11.470 |
| RUR | 221 | 2.740 | 0.777 | 1.080 | 4.800 |
| PGSA | 221 | 13.859 | 2.901 | 7.580 | 21.600 |
| GCR | 221 | 42.104 | 2.765 | 33.430 | 49.870 |
| STR | 221 | 92.671 | 8.092 | 45.680 | 99.520 |
| Policy Effect Variables | City | Weight |
|---|---|---|
| PGDP | Jingmen | 0.360 |
| Zibo | 0.221 | |
| Taizhou | 0.192 | |
| Chongqing | 0.108 | |
| Shaoxing | 0.054 | |
| Linyi | 0.037 | |
| Wuxi | 0.021 | |
| Jiaxing | 0.007 | |
| Jinan | 0.001 | |
| TIR | Chongqing | 0.559 |
| Nanjing | 0.258 | |
| Jinan | 0.151 | |
| Taizhou | 0.033 |
| Variable | PGDP (yuan) | TIR (%) | ||
|---|---|---|---|---|
| True Value | Composite Value | True Value | Composite Value | |
| LP | 116,397.000 | 170,019.000 | 116,397.000 | 120,749.000 |
| NPGR | 2.875 | 3.898 | 2.875 | 2.894 |
| PGR | 0.052 | 0.011 | 0.052 | 0.014 |
| HBC | 7.384 | 4.892 | 7.384 | 5.056 |
| RUR | 2.966 | 3.057 | 2.966 | 3.066 |
| PGSA | 13.750 | 13.760 | 13.750 | 14.950 |
| GCR | 39.610 | 40.110 | 39.610 | 41.490 |
| STR | 92.630 | 90.910 | 92.630 | 92.200 |
| PGDP (2012) | 54,211.000 | 52,148.000 | ||
| PGDP (2015) | 60,643.000 | 62,706.000 | ||
| TIR (2011) | 50.100 | 49.310 | ||
| TIR (2012) | 49.500 | 49.560 | ||
| TIR (2016) | 53.400 | 53.820 | ||
Disclaimer/Publisher’s Note: The statements, opinions and data contained in all publications are solely those of the individual author(s) and contributor(s) and not of MDPI and/or the editor(s). MDPI and/or the editor(s) disclaim responsibility for any injury to people or property resulting from any ideas, methods, instructions or products referred to in the content. |
© 2025 by the authors. Licensee MDPI, Basel, Switzerland. This article is an open access article distributed under the terms and conditions of the Creative Commons Attribution (CC BY) license (https://creativecommons.org/licenses/by/4.0/).
Share and Cite
Huang, L.; Zhang, J.; Wang, X.; Chen, Z. Evaluating the Economic Performance of Park City Policy—Based on the Penalized Version of Synthetic Control Method. Sustainability 2025, 17, 3474. https://doi.org/10.3390/su17083474
Huang L, Zhang J, Wang X, Chen Z. Evaluating the Economic Performance of Park City Policy—Based on the Penalized Version of Synthetic Control Method. Sustainability. 2025; 17(8):3474. https://doi.org/10.3390/su17083474
Chicago/Turabian StyleHuang, Lingxiang, Jianyuan Zhang, Xiang Wang, and Zhu Chen. 2025. "Evaluating the Economic Performance of Park City Policy—Based on the Penalized Version of Synthetic Control Method" Sustainability 17, no. 8: 3474. https://doi.org/10.3390/su17083474
APA StyleHuang, L., Zhang, J., Wang, X., & Chen, Z. (2025). Evaluating the Economic Performance of Park City Policy—Based on the Penalized Version of Synthetic Control Method. Sustainability, 17(8), 3474. https://doi.org/10.3390/su17083474