
The Effect of Digital Quality on Customer Satisfaction and Brand Loyalty Under Environmental Uncertainty: Evidence from the Banking Industry

Abstract
1. Introduction
2. Theoretical Background and Hypothesis Generation
2.1. Theoretical Background
2.1.1. Brand Equity
2.1.2. Service Quality
2.1.3. Digital Transformation
2.1.4. Uncertainty
2.2. Literature Review and Hypotheses
2.2.1. Perceived Quality and Customer Satisfaction
2.2.2. Brand Availability
2.2.3. Customer Orientation
2.2.4. Physical Environment Quality
2.2.5. Digital Quality
2.2.6. Customer Satisfaction and Brand Loyalty
2.2.7. Environmental Dynamism (Uncertainty)
3. Research Methodology
3.1. The Unit of Analysis and Measurements of Variables
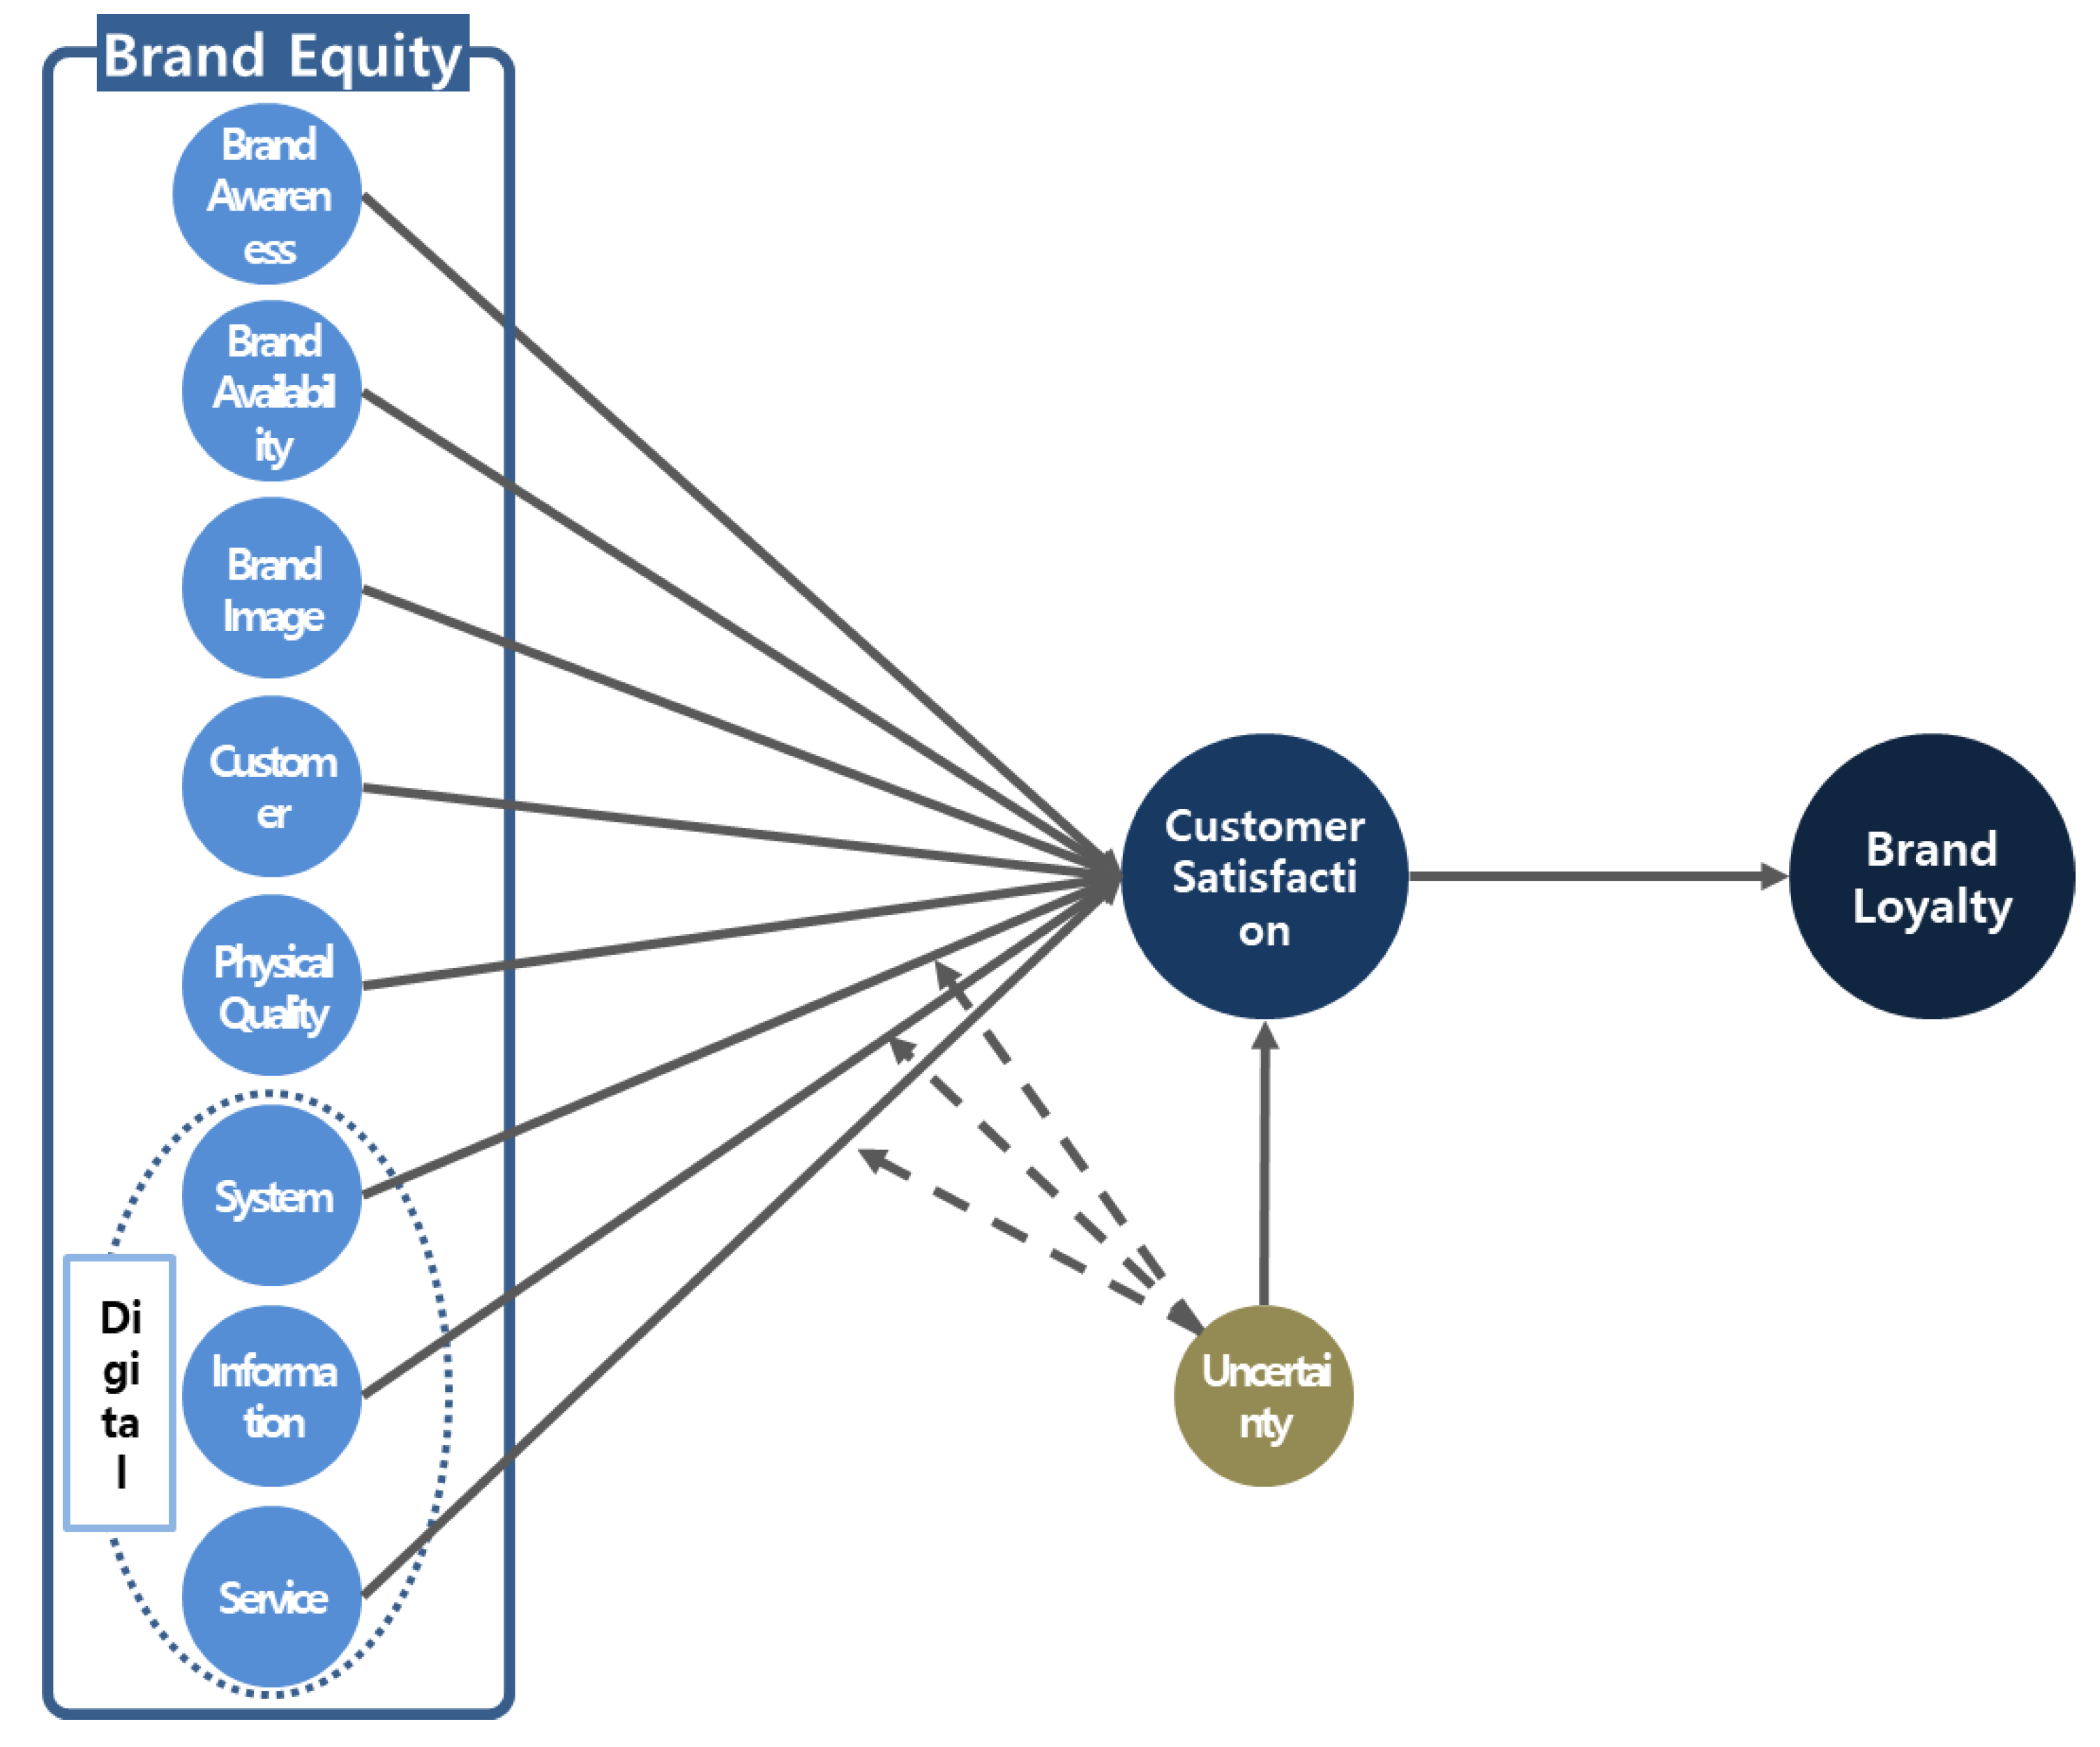
3.2. Research Model
3.3. Operational Definition of Variables and Measures
3.3.1. Brand Awareness
3.3.2. Brand Availability
3.3.3. Brand Image
3.3.4. Customer Orientation
3.3.5. Physical Environment Quality
3.3.6. Digital Quality
3.3.7. Customer Satisfaction
3.3.8. Brand Loyalty
3.3.9. Uncertainty
3.4. Research Tool
3.5. Sample Design and Data Collection
4. Results
4.1. Model Evaluation and Verification
4.1.1. Multicollinearity: Pearson Correlation and Variance Inflation Factor (VIF)
4.1.2. Reliability and Convergent Validity: Cronbach’s Alpha, Synthetic Reliability, Average Variance Extracted (AVE)
4.1.3. Discriminant Validity: Fornell–Larcker [130] Criteria
4.2. Robustness Test
4.2.1. Non-Response Bias: Armstrong and Overton [146] t-Test
4.2.2. Common Method Bias: Check for Over/Under Estimation Errors
4.2.3. Bootstrapping
4.2.4. Verification of Mediation Effect (Sobel Test)
4.2.5. Effect Size: f2 Test
4.3. Results
4.3.1. Empirical Results
4.3.2. Summary of Hypothesis Testing
4.4. Analysis of Partial and Full Mediation
5. Discussion
5.1. Theoretical Implications
5.2. Managerial Implications
6. Conclusions
Author Contributions
Funding
Institutional Review Board Statement
Informed Consent Statement
Data Availability Statement
Acknowledgments
Conflicts of Interest
Appendix A. Survey Questionnaire

| Question | Not at All | Neutral | Very Much So | ||||
|---|---|---|---|---|---|---|---|
| I can often come across advertisements and promotions of my main bank. | ① | ② | ③ | ④ | ⑤ | ⑥ | ⑦ |
| My main bank’s brand is easy to remember. | ① | ② | ③ | ④ | ⑤ | ⑥ | ⑦ |
| My main bank’s logo is easily distinguishable. | ① | ② | ③ | ④ | ⑤ | ⑥ | ⑦ |
| My main bank is a representative brand in the banking industry. | ① | ② | ③ | ④ | ⑤ | ⑥ | ⑦ |
| I am well informed of the characteristics of my main bank. | ① | ② | ③ | ④ | ⑤ | ⑥ | ⑦ |
| My main bank has more branches compared to competing brands. | ① | ② | ③ | ④ | ⑤ | ⑥ | ⑦ |
| My main bank offers more diverse financial products than other banks. | ① | ② | ③ | ④ | ⑤ | ⑥ | ⑦ |
| My main bank provides more advantageous (profitable) financial products than other banks. | ① | ② | ③ | ④ | ⑤ | ⑥ | ⑦ |
| My main bank’s products are less risky than other banks. | ① | ② | ③ | ④ | ⑤ | ⑥ | ⑦ |
| My main bank has a sophisticated image. | ① | ② | ③ | ④ | ⑤ | ⑥ | ⑦ |
| My main bank gives me a sense of familiarity. | ① | ② | ③ | ④ | ⑤ | ⑥ | ⑦ |
| My main bank has a trustworthy image. | ① | ② | ③ | ④ | ⑤ | ⑥ | ⑦ |
| My main bank gives an image of leading the times. | ① | ② | ③ | ④ | ⑤ | ⑥ | ⑦ |
| My main bank is reputable. | ① | ② | ③ | ④ | ⑤ | ⑥ | ⑦ |
| The staff at my main bank’s branches is friendly. | ① | ② | ③ | ④ | ⑤ | ⑥ | ⑦ |
| The staff at my main bank’s branches is very responsive to questions. | ① | ② | ③ | ④ | ⑤ | ⑥ | ⑦ |
| The staff at my main bank’s branches wants to know what customers want. | ① | ② | ③ | ④ | ⑤ | ⑥ | ⑦ |
| The staff at my main bank’s branches offers good solutions to customers. | ① | ② | ③ | ④ | ⑤ | ⑥ | ⑦ |
| The staff at my main bank’s branches takes care of my problems quickly. | ① | ② | ③ | ④ | ⑤ | ⑥ | ⑦ |
| The facilities of my main bank’s branches are clean. | ① | ② | ③ | ④ | ⑤ | ⑥ | ⑦ |
| My main bank’s branches are a space where I want to stay for a long time. | ① | ② | ③ | ④ | ⑤ | ⑥ | ⑦ |
| My main bank’s branches are generally convenient to use. | ① | ② | ③ | ④ | ⑤ | ⑥ | ⑦ |
| My main bank’s branches are generally aesthetically pleasing. | ① | ② | ③ | ④ | ⑤ | ⑥ | ⑦ |
| Question | Not at All | Neutral | Very Much So | ||||
|---|---|---|---|---|---|---|---|
| The main bank’s digital services (internet, mobile, platform) have fast access. | ① | ② | ③ | ④ | ⑤ | ⑥ | ⑦ |
| The main bank’s digital services (Internet, mobile, platform) are always available. | ① | ② | ③ | ④ | ⑤ | ⑥ | ⑦ |
| The main bank’s digital services (Internet, mobile, platform) are easy to obtain information. | ① | ② | ③ | ④ | ⑤ | ⑥ | ⑦ |
| The main bank’s digital services (Internet, mobile, platform) are safe from hacking. | ① | ② | ③ | ④ | ⑤ | ⑥ | ⑦ |
| The main bank’s payment and payment methods are highly secure. | ① | ② | ③ | ④ | ⑤ | ⑥ | ⑦ |
| The main bank’s security system is superior to that of other banks. | ① | ② | ③ | ④ | ⑤ | ⑥ | ⑦ |
| The main bank’s digital services (Internet, mobile, platform) are easy to use. | ① | ② | ③ | ④ | ⑤ | ⑥ | ⑦ |
| The main bank’s digital services (Internet, mobile, platform) are simple to use. | ① | ② | ③ | ④ | ⑤ | ⑥ | ⑦ |
| The main bank’s digital services (Internet, mobile, platform) provide a user-friendly interface (system, design). | ① | ② | ③ | ④ | ⑤ | ⑥ | ⑦ |
| The main bank’s digital services (internet, mobile, platform) provide sufficient information about products (e.g., savings accounts, loans). | ① | ② | ③ | ④ | ⑤ | ⑥ | ⑦ |
| The main bank’s digital services (Internet, mobile, platform) provide a variety of information about products (e.g., savings, loans). | ① | ② | ③ | ④ | ⑤ | ⑥ | ⑦ |
| The main bank’s digital services (internet, mobile, platform) provide up-to-date information on products (e.g., savings accounts, loans). | ① | ② | ③ | ④ | ⑤ | ⑥ | ⑦ |
| The main bank’s digital services (Internet, mobile, platform) provide accurate information about products (deposits, savings, loans). | ① | ② | ③ | ④ | ⑤ | ⑥ | ⑦ |
| The main bank’s digital services (Internet, mobile, platform) provide useful information about products (deposits, savings, loans). | ① | ② | ③ | ④ | ⑤ | ⑥ | ⑦ |
| The main bank’s digital solutions (chatbots, robo-advisors) respond quickly to my requests. | ① | ② | ③ | ④ | ⑤ | ⑥ | ⑦ |
| The main bank’s digital solutions (chatbot, robo-advisor) respond to my request with accurate content. | ① | ② | ③ | ④ | ⑤ | ⑥ | ⑦ |
| The main bank’s digital solutions (chatbots, robo-advisors) faithfully answer my requests. | ① | ② | ③ | ④ | ⑤ | ⑥ | ⑦ |
| The main bank’s digital solutions (chatbot, robo-advisor) provide customized services tailored to my interests. | ① | ② | ③ | ④ | ⑤ | ⑥ | ⑦ |
| The main bank’s digital solutions (chatbot, robo-advisor) provide differentiated services according to my conditions and circumstances. | ① | ② | ③ | ④ | ⑤ | ⑥ | ⑦ |
| The main bank’s digital solutions (chatbot, robo-advisor) provide customized services according to my knowledge (skill) level. | ① | ② | ③ | ④ | ⑤ | ⑥ | ⑦ |
| The main bank’s digital solutions (chatbot, robo-advisor) solve my problem. | ① | ② | ③ | ④ | ⑤ | ⑥ | ⑦ |
| The main bank’s digital solutions (chatbot, robo-advisor) execute within the promised time. | ① | ② | ③ | ④ | ⑤ | ⑥ | ⑦ |
| The main bank’s digital solutions (chatbot, robo-advisor) provide the promised service. | ① | ② | ③ | ④ | ⑤ | ⑥ | ⑦ |
| Question | Not at All | Neutral | Very Much So | ||||
|---|---|---|---|---|---|---|---|
| Using the main bank usually meets my expectations. | ① | ② | ③ | ④ | ⑤ | ⑥ | ⑦ |
| My main bank’s service is more satisfactory than other bank services. | ① | ② | ③ | ④ | ⑤ | ⑥ | ⑦ |
| My overall level of satisfaction with my main bank’s service is high. | ① | ② | ③ | ④ | ⑤ | ⑥ | ⑦ |
| Transactions with my main bank are fun and enjoyable and reflect both my expectations and needs. | ① | ② | ③ | ④ | ⑤ | ⑥ | ⑦ |
| I have a very favorable (good) attitude towards my main bank. | ① | ② | ③ | ④ | ⑤ | ⑥ | ⑦ |
| I once told others that my main bank is a good bank. | ① | ② | ③ | ④ | ⑤ | ⑥ | ⑦ |
| I have many other banks to choose from, but I tend to use my main bank. | ① | ② | ③ | ④ | ⑤ | ⑥ | ⑦ |
| I will continue to use my main bank. | ① | ② | ③ | ④ | ⑤ | ⑥ | ⑦ |
| Question | Not at All | Neutral | Very Much So | ||||
|---|---|---|---|---|---|---|---|
| It is very difficult to predict technological changes applied to the banking industry. | ① | ② | ③ | ④ | ⑤ | ⑥ | ⑦ |
| Technologies in the banking industry are changing rapidly. | ① | ② | ③ | ④ | ⑤ | ⑥ | ⑦ |
| It is very difficult to predict the changing needs of customers in the banking industry. | ① | ② | ③ | ④ | ⑤ | ⑥ | ⑦ |
| The needs of customers in the banking industry are changing rapidly. | ① | ② | ③ | ④ | ⑤ | ⑥ | ⑦ |
Appendix B
| Items | Brand | Availability | Customer | p.Quality | Physical | System | Information | Service | Satisfaction | Loyal |
|---|---|---|---|---|---|---|---|---|---|---|
| Brand1 | 0.723 | 0.365 | 0.273 | 0.346 | 0.289 | 0.296 | 0.277 | 0.278 | 0.289 | 0.319 |
| Brand2 | 0.724 | 0.269 | 0.249 | 0.342 | 0.259 | 0.264 | 0.261 | 0.232 | 0.283 | 0.327 |
| Brand3 | 0.745 | 0.323 | 0.273 | 0.296 | 0.270 | 0.246 | 0.234 | 0.274 | 0.307 | 0.325 |
| Brand4 | 0.742 | 0.420 | 0.370 | 0.402 | 0.349 | 0.301 | 0.249 | 0.256 | 0.299 | 0.276 |
| Brand5 | 0.769 | 0.470 | 0.226 | 0.346 | 0.235 | 0.315 | 0.305 | 0.211 | 0.279 | 0.338 |
| Avail1 | 0.398 | 0.722 | 0.334 | 0.303 | 0.329 | 0.195 | 0.168 | 0.179 | 0.224 | 0.240 |
| Avail2 | 0.445 | 0.847 | 0.447 | 0.505 | 0.495 | 0.460 | 0.428 | 0.401 | 0.464 | 0.420 |
| Avail3 | 0.412 | 0.787 | 0.399 | 0.506 | 0.413 | 0.433 | 0.492 | 0.439 | 0.486 | 0.484 |
| Avail4 | 0.372 | 0.794 | 0.423 | 0.450 | 0.418 | 0.406 | 0.327 | 0.279 | 0.355 | 0.373 |
| Customer1 | 0.361 | 0.477 | 0.863 | 0.562 | 0.651 | 0.546 | 0.493 | 0.463 | 0.560 | 0.544 |
| Customer2 | 0.390 | 0.489 | 0.912 | 0.576 | 0.678 | 0.579 | 0.541 | 0.510 | 0.609 | 0.596 |
| Customer3 | 0.358 | 0.464 | 0.874 | 0.571 | 0.643 | 0.555 | 0.549 | 0.523 | 0.608 | 0.552 |
| Customer4 | 0.354 | 0.501 | 0.896 | 0.615 | 0.666 | 0.580 | 0.576 | 0.554 | 0.658 | 0.585 |
| Customer5 | 0.356 | 0.462 | 0.890 | 0.570 | 0.666 | 0.583 | 0.557 | 0.562 | 0.647 | 0.569 |
| Image1 | 0.379 | 0.430 | 0.386 | 0.723 | 0.515 | 0.514 | 0.395 | 0.405 | 0.515 | 0.430 |
| Image2 | 0.392 | 0.484 | 0.568 | 0.768 | 0.518 | 0.526 | 0.537 | 0.525 | 0.621 | 0.608 |
| Image3 | 0.464 | 0.530 | 0.577 | 0.832 | 0.584 | 0.594 | 0.523 | 0.460 | 0.601 | 0.611 |
| Image4 | 0.372 | 0.477 | 0.474 | 0.813 | 0.583 | 0.662 | 0.591 | 0.549 | 0.638 | 0.591 |
| Image5 | 0.429 | 0.520 | 0.595 | 0.867 | 0.617 | 0.656 | 0.611 | 0.570 | 0.681 | 0.666 |
| Physic1 | 0.350 | 0.383 | 0.695 | 0.500 | 0.746 | 0.514 | 0.413 | 0.402 | 0.494 | 0.463 |
| Physic2 | 0.323 | 0.459 | 0.560 | 0.569 | 0.844 | 0.568 | 0.492 | 0.492 | 0.559 | 0.480 |
| Physic3 | 0.355 | 0.511 | 0.657 | 0.583 | 0.853 | 0.589 | 0.558 | 0.576 | 0.693 | 0.613 |
| Physic4 | 0.316 | 0.462 | 0.527 | 0.632 | 0.808 | 0.574 | 0.513 | 0.528 | 0.607 | 0.526 |
| System1 | 0.342 | 0.393 | 0.494 | 0.563 | 0.574 | 0.800 | 0.574 | 0.509 | 0.620 | 0.554 |
| System2 | 0.339 | 0.337 | 0.495 | 0.477 | 0.489 | 0.723 | 0.498 | 0.472 | 0.564 | 0.464 |
| System3 | 0.348 | 0.455 | 0.569 | 0.626 | 0.621 | 0.877 | 0.679 | 0.636 | 0.712 | 0.617 |
| System4 | 0.315 | 0.462 | 0.539 | 0.631 | 0.545 | 0.793 | 0.597 | 0.544 | 0.558 | 0.491 |
| System5 | 0.390 | 0.480 | 0.604 | 0.638 | 0.599 | 0.790 | 0.627 | 0.577 | 0.616 | 0.560 |
| System6 | 0.344 | 0.485 | 0.546 | 0.652 | 0.587 | 0.749 | 0.589 | 0.560 | 0.594 | 0.547 |
| System7 | 0.354 | 0.399 | 0.498 | 0.594 | 0.543 | 0.884 | 0.648 | 0.611 | 0.658 | 0.583 |
| System8 | 0.309 | 0.412 | 0.463 | 0.578 | 0.515 | 0.846 | 0.636 | 0.581 | 0.657 | 0.579 |
| System9 | 0.298 | 0.423 | 0.482 | 0.635 | 0.568 | 0.820 | 0.658 | 0.588 | 0.647 | 0.591 |
| Infor1 | 0.329 | 0.446 | 0.526 | 0.614 | 0.550 | 0.703 | 0.888 | 0.660 | 0.678 | 0.608 |
| Infor2 | 0.326 | 0.428 | 0.532 | 0.605 | 0.559 | 0.719 | 0.916 | 0.725 | 0.716 | 0.662 |
| Infor3 | 0.384 | 0.476 | 0.529 | 0.600 | 0.525 | 0.681 | 0.920 | 0.714 | 0.698 | 0.630 |
| Infor4 | 0.361 | 0.462 | 0.604 | 0.617 | 0.577 | 0.647 | 0.891 | 0.691 | 0.690 | 0.610 |
| Infor5 | 0.351 | 0.496 | 0.587 | 0.592 | 0.561 | 0.676 | 0.912 | 0.728 | 0.696 | 0.634 |
| Service1 | 0.339 | 0.412 | 0.582 | 0.596 | 0.569 | 0.690 | 0.727 | 0.859 | 0.704 | 0.639 |
| Service2 | 0.322 | 0.426 | 0.546 | 0.568 | 0.550 | 0.663 | 0.700 | 0.878 | 0.696 | 0.587 |
| Service3 | 0.326 | 0.441 | 0.557 | 0.584 | 0.566 | 0.641 | 0.694 | 0.846 | 0.670 | 0.605 |
| Service4 | 0.290 | 0.396 | 0.466 | 0.520 | 0.478 | 0.596 | 0.675 | 0.900 | 0.683 | 0.579 |
| Service5 | 0.298 | 0.385 | 0.452 | 0.504 | 0.543 | 0.585 | 0.645 | 0.871 | 0.679 | 0.584 |
| Service6 | 0.262 | 0.370 | 0.426 | 0.480 | 0.473 | 0.565 | 0.657 | 0.869 | 0.658 | 0.551 |
| Service7 | 0.321 | 0.401 | 0.489 | 0.541 | 0.579 | 0.624 | 0.659 | 0.882 | 0.698 | 0.550 |
| Service8 | 0.352 | 0.369 | 0.527 | 0.552 | 0.521 | 0.522 | 0.628 | 0.839 | 0.660 | 0.587 |
| Service9 | 0.358 | 0.422 | 0.564 | 0.574 | 0.567 | 0.563 | 0.685 | 0.867 | 0.716 | 0.645 |
| Satis1 | 0.375 | 0.480 | 0.630 | 0.686 | 0.649 | 0.704 | 0.720 | 0.732 | 0.900 | 0.714 |
| Satis2 | 0.397 | 0.536 | 0.626 | 0.706 | 0.663 | 0.715 | 0.672 | 0.695 | 0.910 | 0.739 |
| Satis3 | 0.398 | 0.461 | 0.634 | 0.681 | 0.657 | 0.691 | 0.694 | 0.709 | 0.918 | 0.765 |
| Satis4 | 0.376 | 0.478 | 0.630 | 0.697 | 0.674 | 0.688 | 0.694 | 0.720 | 0.887 | 0.753 |
| Loyal1 | 0.400 | 0.477 | 0.605 | 0.702 | 0.626 | 0.660 | 0.682 | 0.674 | 0.826 | 0.871 |
| Loyal2 | 0.284 | 0.411 | 0.437 | 0.533 | 0.469 | 0.493 | 0.513 | 0.499 | 0.573 | 0.741 |
| Loyal3 | 0.370 | 0.420 | 0.466 | 0.539 | 0.467 | 0.539 | 0.489 | 0.496 | 0.586 | 0.790 |
| Loyal4 | 0.448 | 0.414 | 0.557 | 0.577 | 0.514 | 0.517 | 0.546 | 0.521 | 0.644 | 0.846 |
References
- Bank of Korea. Status of Domestic Internet Banking Service Usage in 2018. 2018. Available online: https://www.bok.or.kr/portal/bbs/B0000502/view.do?menuNo=201265&nttId=10050837 (accessed on 2 April 2025).
- Hana Financial Management Research Institute. The Need and Challenges of Digital Transformation in Domestic Banks. 2017. Available online: https://www.hanaif.re.kr/boardDetail.do?hmpeSeqNo=33302 (accessed on 2 April 2025).
- Lee, J.-H. Digital Transformation in the Post-Corona Era and Implications for Korea. Future Horiz. 2020, 1, 20–27. [Google Scholar]
- Farquhar, P.H. Managing brand equity. Mark. Res. 1989, 1, 1–11. [Google Scholar]
- Keller, K.L. Conceptualizing, measuring and managing customer-based brand equity. J. Mark. 1993, 57, 1–22. [Google Scholar] [CrossRef]
- Keller, K.L. Managing brands for the long run: Brand reinforcement and revitalization strategies. Calif. Manag. Rev. 1999, 41, 102–124. [Google Scholar] [CrossRef]
- Feldwick, P. What is brand equity anyway, and how do you measure it? J. Mark. Res. Soc. 1996, 38, 85–104. [Google Scholar] [CrossRef]
- Keller, K.L. Building Customer-Based Brand Equity: A Blueprint for Creating Strong Brands; Marketing Science Institute: Cambridge, MA, USA, 2001; pp. 01–107. [Google Scholar]
- Na, W.B.; Marshall, R.; Keller, K.L. Measuring brand power: Validating a model for optimizing brand equity. J. Prod. Brand Manag. 1999, 8, 170–184. [Google Scholar]
- Grönroos, C. A service quality model and its marketing implications. Eur. J. Mark. 1984, 18, 36–44. [Google Scholar] [CrossRef]
- Yang, O.-S.; Park, S.-W. A study on the moderating effect of information asymmetry between domestic and foreign banks on the structure of bank service quality-customer satisfaction-customer loyalty. J. Korean Med. Assoc. 2015, 28, 2259–2276. [Google Scholar]
- Parasuraman, A.; Zeithaml, V.A.; Berry, L.L. A conceptual model of service quality and its implications for future research. J. Mark. 1985, 49, 41–50. [Google Scholar] [CrossRef]
- Boulding, W.; Kalra, A.; Staelin, R.; Zeithaml, V.A. A dynamic process model of service quality: From expectations to behavioral intentions. J. Mark. Res. 1993, 30, 7–27. [Google Scholar] [CrossRef]
- Llosa, S.; Chandon, J.L.; Orsingher, C. An empirical study of SERVQUAL’s dimensionality. Serv. Ind. J. 1998, 18, 16–44. [Google Scholar] [CrossRef]
- Parasuraman, A.; Berry, L.L.; Zeithaml, V.A. Refinement and reassessment of the SERVQUAL scale. J. Retail. 1991, 67, 420–450. [Google Scholar]
- Parasuraman, A.; Zeithaml, V.A.; Berry, L.L. Reassessment of expectation as a comparison standard in measuring service quality: Implications for further research. J. Mark. 1994, 58, 244–259. [Google Scholar] [CrossRef]
- Cronin, J.J.; Taylor, S.A. Measuring service quality: A reexamination and extension. J. Mark. 1992, 56, 55–68. [Google Scholar] [CrossRef]
- Yi, Y.; La, S. The relative effects of three dimensions of service quality on CS: A comparative study of existing vs. potential customers. Korea Mark. Rev. 2003, 18, 67–97. [Google Scholar]
- Chen, H.G.; Liu, Y.-C.; Sheu, S.; Yang, M.H. The impact of financial services quality and fairness on customer satisfaction. Manag. Serv. Qual. Int. J. 2012, 22, 399–421. [Google Scholar] [CrossRef]
- Shi, X.; Nguyen, D.D.; Wang, M. Earnings expectations and the quality of financial services. J. Account. Public Policy 2003, 42, 107115. [Google Scholar] [CrossRef]
- Lee, G.; Yu, J. Corporate social responsibility and firm performance in the airline industry: The moderating role of corporate governance. J. Air Transp. Manag. 2017, 57, 176–188. [Google Scholar]
- Schwertner, K. Digital transformation of business. Trakia J. Sci. 2017, 15, 388–393. [Google Scholar] [CrossRef]
- Ismail, M.H.; Khater, M.; Zaki, M. Digital Business Transformation and Strategy: What Do We Know So Far? Cambridge Service Alliance: Cambridge, UK, 2017; pp. 1–35. [Google Scholar]
- Park, J.P.; Chun, H.J. The effect of internal marketing factors of food-service franchise company on job satisfaction of supervisor. J. Tour. Leis. Res. 2019, 31, 293–311. [Google Scholar] [CrossRef]
- Nwankpa, J.K.; Roumani, Y. IT capability and digital transformation: A firm performance perspective. In Proceedings of the 22nd Americas Conference on Information Systems (AMCIS), San Diego, CA, USA, 11–14 August 2016. [Google Scholar]
- Lee, S.M.; Yun, J.H.; Pyka, A.; Won, D.; Kodama, F.; Schiuma, G.; Zhao, X. How to respond to the fourth industrial revolution, or the second information technology revolution? Dynamic new combinations between technology, market, and society through open innovation. J. Open Innov. Technol. Mark. Complex. 2018, 4, 21. [Google Scholar] [CrossRef]
- Kim, W.J. Characteristics and implications of digital transformation of major global banks. Wkly. Financ. Brief 2018, 27, 3–7. [Google Scholar]
- Piccinini, E.; Hanelt, A.; Gregory, R.; Kolbe, L. Transforming industrial business: The impact of digital transformation on automotive organizations. unpublished. In Proceedings of the International Conference on Information Systems, Fort Worth, TX, USA, 15–17 December 2025. [Google Scholar]
- Hwang, J.-Y.; Lee, E.-B.; Kim, J.-H. An empirical study on a service quality measurement model for public libraries. J. Korean Soc. Libr. Inf. Sci. 2007, 41, 157–180. [Google Scholar]
- Miller, K.D. Industry and country effects on managers’ perceptions of environmental uncertainties. J. Int. Bus. Stud. 1993, 24, 693–714. [Google Scholar] [CrossRef]
- Werner, S.; Brouthers, L.E.; Brouthers, K.D. International risk and perceived environmental uncertainty: The dimensionality and internal consistency of Miller’s measure. J. Int. Bus. Stud. 1996, 27, 571–587. [Google Scholar] [CrossRef]
- Liesch, P.W.; Welch, L.S.; Buckley, P.J. Risk and uncertainty in internationalisation and international entrepreneurship studies. Manag. Int. Rev. 2011, 51, 851–873. [Google Scholar] [CrossRef]
- Nicolaou, A.I.; McKnight, D.H. Perceived information quality in data exchanges: Effects on risk, trust, and intention to use. Inf. Syst. Res. 2006, 17, 332–351. [Google Scholar] [CrossRef]
- Luo, Y. Market-seeking MNEs in an emerging market: How parent–subsidiary links shape overseas success. J. Int. Bus. Stud. 2003, 34, 290–309. [Google Scholar] [CrossRef]
- Ettlie, J.E.; Reza, E.M. Organizational integration and process innovation. Acad. Manag. J. 1992, 35, 795–827. [Google Scholar] [CrossRef]
- Pfeffer, J.; Salancik, G.R. The External Control of Organizations: A Resource Dependence Perspective; reprint 1992; Harper & Row: New York, NY, USA, 1978. [Google Scholar]
- Rindfleisch, A.; Heide, J.B. Transaction cost analysis: Past, present, and future applications. J. Mark. 1997, 61, 30–54. [Google Scholar] [CrossRef]
- Song, M.; Montoya-Weiss, M.M. The effect of perceived technological uncertainty on Japanese new product development. Acad. Manag. J. 2001, 44, 61–80. [Google Scholar] [CrossRef]
- Fleming, L. Recombinant uncertainty in technological search. Manag. Sci. 2001, 47, 117–132. [Google Scholar] [CrossRef]
- Goerzen, A. Alliance networks and firm performance: The impact of repeated partnerships. Strateg. Manag. J. 2007, 28, 487–509. [Google Scholar] [CrossRef]
- Milliken, F.J. Three types of perceived uncertainty about the environment: State, effect, and response uncertainty. Acad. Manag. Rev. 1987, 12, 133–143. [Google Scholar] [CrossRef]
- Sutcliffe, K.M.; Zaheer, A. Uncertainty in the transaction environment: An empirical test. Strateg. Manag. J. 1998, 19, 1–23. [Google Scholar] [CrossRef]
- Beckman, C.M.; Haunschild, P.R.; Phillips, D.J. Friends or strangers? Firm-specific uncertainty, market uncertainty, and network partner selection. Organ. Sci. 2004, 15, 259–275. [Google Scholar] [CrossRef]
- Williamson, O.E. The Economic Institutions of Capitalism; Simon and Schuster: New York, NY, USA, 1985. [Google Scholar]
- Alvarez, S.A.; Barney, J.B. How do entrepreneurs organize firms under conditions of uncertainty? J. Manag. 2005, 31, 776–793. [Google Scholar] [CrossRef]
- Hartman, R. The effects of price and cost uncertainty on investment. J. Econ. Theory 1972, 5, 258–266. [Google Scholar] [CrossRef]
- Abel, A.B. Optimal investment under uncertainty. Am. Econ. Rev. 1983, 73, 228–233. [Google Scholar]
- Caballero, R.J. On the sign of the investment-uncertainty relationship. Am. Econ. Rev. 1991, 81, 279–288. [Google Scholar]
- Teece, D.J.; Pisano, G.; Shuen, A. Dynamic capabilities and strategic management. Strateg. Manag. J. 1997, 18, 509–533. [Google Scholar] [CrossRef]
- Ko, H.-J.; Jeong, S.-H. A study on the relationship between banking service quality, customer satisfaction, and customer loyalty. Financ. Plan. Rev. 2012, 5, 1–136. [Google Scholar]
- Yi, Y.J. A critical review and future research directions on service quality, customer satisfaction, customer loyalty and loyalty program. Korean Manag. Rev. 2016, 45, 1763–1797. [Google Scholar] [CrossRef]
- Falk, T.; Hammerschmidt, M.; Schepers, J. The service quality–satisfaction link revisited: Exploring asymmetries and dynamics. J. Acad. Mark. Sci. 2010, 38, 288–302. [Google Scholar] [CrossRef]
- Park, M.H.; Cho, H.J. Redefinition of the concept of customer satisfaction. Asia Mark. J. 1999, 1, 6. [Google Scholar]
- Chu, T.-H.; Lee, W.I.; Chao, Y. Service quality, customer satisfaction, customer trust, and loyalty in an e-banking context. Soc. Behav. Personal. Int. J. 2012, 40, 1271–1283. [Google Scholar] [CrossRef]
- Choi, K.W.; Lee, H.S. Analysis of the relationship between courier service quality and customer satisfaction: An agent-based model. In Proceedings of the Korean Management Science Association Conference, Seoul, Republic of Korea, 20–21 August 2007; pp. 376–382. [Google Scholar]
- Dabholkar, P.A.; Shepherd, C.D.; Thorpe, D.I. A comprehensive framework for service quality: An investigation of critical conceptual and measurement issues through a longitudinal study. J. Retail. 2000, 76, 139–173. [Google Scholar] [CrossRef]
- Caruana, A. Service loyalty: The effects of service quality and the mediating role of customer satisfaction. Eur. J. Mark. 2002, 36, 811–828. [Google Scholar] [CrossRef]
- Lee, Y.J.; Lee, J.Y. Reconsideration of the measurement and expected effects of service quality: Development and application of the KS-SQI model. J. Mark. Res. 2001, 16, 1–26. [Google Scholar]
- Karatepe, O.M.; Yavas, U.; Babakus, E. Measuring service quality of banks: Scale development and validation. J. Retail. Consum. Serv. 2005, 12, 373–383. [Google Scholar] [CrossRef]
- Song, K.-S.; Yoo, H.-J. A study on the classification of high-speed rail customers using the Kano model and customer satisfaction and switching barriers by customer group: Comparison with airline and express bus customers. J. Qual. Manag. 2005, 33, 71–90. [Google Scholar]
- Kim, J. Assessing the effects of multi-channel service quality on customer satisfaction and loyalty in retail banking. Korean Manag. Sci. Rev. 2016, 41, 71–85. [Google Scholar] [CrossRef]
- Lassar, W.; Mittal, B.; Sharma, A. Measuring customer based brand equity. J. Consum. Mark. 1995, 12, 11–19. [Google Scholar] [CrossRef]
- Aaker, D. Managing Brand Equity: Capitalizing on the Value of a Brand Name; Free Press: New York, NY, USA, 1991. [Google Scholar]
- Yoo, B.; Donthu, N.; Lee, S. An examination of selected marketing mix elements and brand equity. J. Acad. Mark. Sci. 2000, 28, 195–211. [Google Scholar] [CrossRef]
- Kelley, S.W. Developing customer orientation among service employees. J. Acad. Mark. Sci. 1992, 20, 27–36. [Google Scholar] [CrossRef]
- Saxe, R.; Weitz, B.A. The SOCO scale: A measure of the customer orientation of salespeople. J. Mark. Res. 1982, 19, 343–351. [Google Scholar] [CrossRef]
- Williams, W.D. Salinity as a determinant of the structure of biological communities in salt lakes. Hydrobiologia 1998, 381, 191–201. [Google Scholar] [CrossRef]
- Swan, J.E.; Trawick, I.F.; Silva, D.W. How industrial salespeople gain customer trust. Ind. Mark. Manag. 1985, 14, 203–211. [Google Scholar] [CrossRef]
- Dunlap, B.J.; Dotson, M.J.; Chambers, T.M. Perceptions of real-estate brokers and buyers: A sales orientation, customer orientation approach. J. Bus. Res. 1988, 17, 175–187. [Google Scholar] [CrossRef]
- Ha, H.-Y.; Choi, C.-B. A study on the structure of customer orientation, interest rate sensitivity, and customer loyalty in banking services: The moderating effect of deposit interest rates and loan interest rates. Asia Mark. J. 2010, 12, 43–62. [Google Scholar]
- Bae, B.-R.; Lee, M.-W. The effect of customer orientation of service providers on relationship quality and repurchase intention. Asia Mark. J. 2001, 3, 2. [Google Scholar]
- Daniel, K.; Darby, D.N. A dual perspective of customer orientation: A modification, extension and application of the SOCO scale. Int. J. Serv. Ind. Manag. 1997, 8, 131–147. [Google Scholar] [CrossRef]
- Yoo, P.-H.; Park, D.-H.; Kwak, Y.-S. Development of a customer orientation index for salespeople and analysis of its correlation with salespeople’s performance. J. Consum. Stud. 1996, 7, 59–85. [Google Scholar]
- Narver, J.C.; Slater, S.F. The effect of a market orientation on business profitability. J. Mark. 1990, 54, 20–35. [Google Scholar] [CrossRef]
- Ganesan, S. Determinants of long-term orientation in buyer-seller relationships. J. Mark. 1994, 58, 1–19. [Google Scholar] [CrossRef]
- Dodds, W.B.; Monroe, K.B.; Grewal, D. Effects of price, brand, and store information on buyers’ product evaluations. J. Mark. Res. 1991, 28, 307–319. [Google Scholar]
- Bateson, J.E.G. Managing Services Marketing: Text and Readings, 2nd ed.; Dryden Press: Fort Worth, TX, USA, 1992. [Google Scholar]
- Lovelock, C.H. Services Marketing, 2nd ed.; Prentice Hall: Englewood Cliffs, NJ, USA, 1991. [Google Scholar]
- Yi, Y.J.; Kim, W.C. The influence of physical environment on service quality perception: A comparative study. Korea Mark. Rev. 1998, 13, 61–86. [Google Scholar]
- Baker, J. The role of the environment in marketing services: The consumer perspective. In The Services Challenge: Integrating for Competitive Advantage; Czepiel, J.A., Congram, C.A., Shanahan, J., Eds.; American Marketing Association: Chicago, IL, USA, 1987; pp. 79–84. [Google Scholar]
- Bitner, M.J. Servicescapes: The impact of physical surroundings on customers and employees. J. Mark. 1992, 56, 57–71. [Google Scholar] [CrossRef]
- Joo, Y.J.; Kwon, H.G. The effect of bank’s service quality on customer satisfaction, relationship intention and cross-buying intention. J. Korea Ind. Inf. Syst. Soc. 2017, 22, 95–107. [Google Scholar]
- Lee, J.H. AI-based financial service digital transformation trend. TTA J. 2017, 172, 39–45. [Google Scholar]
- Seck, A.M.; Philippe, J. Service encounter in multi-channel distribution context: Virtual and face-to-face interactions and consumer satisfaction. Serv. Ind. J. 2013, 33, 565–579. [Google Scholar] [CrossRef]
- Kwahk, K.Y.; Lee, Y.J. A study on the factors affecting the usage intention of the mobile banking service in the digital convergence age. Inf. Syst. Rev. 2005, 7, 85–100. [Google Scholar]
- DeLone, W.H.; McLean, E.R. The DeLone and McLean model of information systems success: A ten-year update. J. Manag. Inf. Syst. 2003, 19, 9–30. [Google Scholar]
- Jun, M.; Palacios, S. Examining the key dimensions of mobile banking service quality. Int. J. Bank Mark. 2016, 34, 414–442. [Google Scholar] [CrossRef]
- Zhou, T. An empirical examination of initial trust in mobile banking. Internet Res. 2011, 21, 527–540. [Google Scholar] [CrossRef]
- Wang, R.Y.; Storey, V.C.; Firth, C.P. A framework for analysis of data quality research. IEEE Trans. Knowl. Data Eng. 1995, 7, 623–640. [Google Scholar] [CrossRef]
- Kim, G.; Shin, B.; Lee, H.G. Understanding dynamics between initial trust and usage intentions of mobile banking. Inf. Syst. J. 2009, 19, 283–311. [Google Scholar] [CrossRef]
- Parasuraman, A.; Zeithaml, V.A.; Malhotra, A. ES-QUAL: A multiple-item scale for assessing electronic service quality. J. Serv. Res. 2005, 7, 213–233. [Google Scholar] [CrossRef]
- Blut, M.; Chowdhry, N.; Mittal, V.; Brock, C. E-service quality: A meta-analytic review. J. Retail. 2015, 91, 679–700. [Google Scholar] [CrossRef]
- Chen, S.C.; Liu, M.L.; Lin, C.P. Integrating technology readiness into the expectation–confirmation model: An empirical study of mobile services. Cyberpsychol. Behav. Soc. Netw. 2013, 16, 604–612. [Google Scholar] [CrossRef]
- Lee, G.G.; Lin, H.F. Customer perceptions of e-service quality in online shopping. Int. J. Retail. Distrib. Manag. 2005, 33, 161–176. [Google Scholar] [CrossRef]
- Crosby, L.A.; Evans, K.R.; Cowles, D. Relationship quality in service selling: An interpersonal influence perspective. J. Mark. 1990, 54, 68–81. [Google Scholar] [CrossRef]
- Lilijander, V.; Strandvik, T. The nature of customer relationship in service. Adv. Serv. Mark. Manag. 1995, 4, 141–167. [Google Scholar]
- Rust, R.T.; Zahorik, A.J.; Keiningham, T.L. Return on quality (ROQ): Making service quality financially accountable. J. Mark. 1995, 59, 58–70. [Google Scholar] [CrossRef]
- Ragunathan, A.; Irwin, J.R. Walking the hedonic product treadmill: Default contrast and mood-based assimilation in judgments of predicted happiness with a target product. J. Consum. Res. 2001, 28, 355–368. [Google Scholar] [CrossRef]
- Fornell, C. A national customer satisfaction barometer: The Swedish experience. J. Mark. 1992, 56, 6–21. [Google Scholar] [CrossRef]
- Bowen, J.T.; Chen, S.L. The relationship between customer loyalty and customer satisfaction. Int. J. Contemp. Hosp. Manag. 2001, 13, 213–217. [Google Scholar] [CrossRef]
- Oliver, R.L. Whence consumer loyalty? J. Mark. 1999, 63, 33–44. [Google Scholar] [CrossRef]
- Wong, A.; Sohal, A. Service quality and customer loyalty perspectives on two levels of retail relationships. J. Serv. Mark. 2003, 17, 495–513. [Google Scholar] [CrossRef]
- Harris, L.C.; Goode, M.M. The four levels of loyalty and the pivotal role of trust: A study of online service dynamics. J. Retail. 2004, 80, 139–158. [Google Scholar] [CrossRef]
- Weilbacher, W.M. How advertising affects consumers. J. Advert. Res. 2003, 43, 230–234. [Google Scholar] [CrossRef]
- Girod, S.J.G.; Whittington, R. Reconfiguration, restructuring and firm performance: Dynamic capabilities and environmental dynamism. Strateg. Manag. J. 2017, 38, 1121–1133. [Google Scholar] [CrossRef]
- Zollo, M.; Winter, S.G. Deliberate learning and the evolution of dynamic capabilities. Organ. Sci. 2002, 13, 339–351. [Google Scholar] [CrossRef]
- Schilke, O. On the contingent value of dynamic capabilities for competitive advantage: The nonlinear moderating effect of environmental dynamism. Strateg. Manag. J. 2014, 35, 179–203. [Google Scholar] [CrossRef]
- March, J.G. Exploration and exploitation in organizational learning. Organ. Sci. 1991, 2, 71–87. [Google Scholar] [CrossRef]
- Aaker, D.A. Measuring brand equity across products and markets. Calif. Manag. Rev. 1996, 38, 102–120. [Google Scholar] [CrossRef]
- Lee, M.K. e-SERVQUAL: A scale for measuring consumer evaluations of internet service quality. Korea Mark. Rev. 2002, 17, 73–95. [Google Scholar]
- Hwang, J.Y.; Lee, E.B.; Kim, J.H. Assessing e-service quality of digital libraries. J. Korean Soc. Libr. Inf. Sci. 2007, 41, 55–79. [Google Scholar]
- Moghavvemi, S.; Lee, S.T.; Lee, S.P. Perceived overall service quality and customer satisfaction: A comparative analysis between local and foreign banks in Malaysia. Int. J. Bank Mark. 2018, 36, 908–930. [Google Scholar] [CrossRef]
- von Leipzig, T.; Gamp, M.; Manz, D.; Schöttle, K.; Ohlhausen, P.; Oosthuizen, G.; Palm, D.; von Leipzig, K. Initialising customer-orientated digital transformation in enterprises. Procedia Manuf. 2017, 8, 517–524. [Google Scholar] [CrossRef]
- Preston, C.; Colman, A. Optimal number of response categories in rating scales: Reliability, validity, discriminating power, and respondent preferences. Acta Psychol. 2000, 104, 1–15. [Google Scholar] [CrossRef] [PubMed]
- Aaker, D.A. Strategic Market Management, 5th ed.; John Wiley & Sons: New York, NY, USA, 1998. [Google Scholar]
- Smith, P. The Emotional Labour of Nursing: Its Impact on Interpersonal Relations, Management and Educational Environment; Bloomsbury Publishing: London, UK, 1992. [Google Scholar]
- Cho, K.H.; Lim, C.U. The effects of customer satisfaction and switching barrier on store loyalty. Korea Mark. Rev. 1999, 14, 47–74. [Google Scholar]
- Weitz, B.A. Effectiveness in sales interactions: A contingency framework. J. Mark. 1981, 45, 85–103. [Google Scholar] [CrossRef]
- Williams, M.R. Organizational Culture as a Predictor of the Level of Salespersons’ Customer Oriented Behavior. Ph.D. Thesis, The University of Oklahoma, Norman, OK, USA, 1992. [Google Scholar]
- Baker, J.; Grewal, D.; Parasuraman, A. The influence of store environment on quality inferences and store image. J. Acad. Mark. Sci. 1994, 22, 328–339. [Google Scholar] [CrossRef]
- Oliver, R.L. A cognitive model of the antecedents and consequences of satisfaction decisions in marketing. J. Mark. Res. 1980, 17, 460–469. [Google Scholar] [CrossRef]
- Richins, M.L. Measuring emotions in the consumption experience. J. Consum. Res. 1997, 24, 127–146. [Google Scholar] [CrossRef]
- Anderson, E.W.; Fornell, C.; Lehmann, D.R. Customer satisfaction, market share, and profitability: Findings from Sweden. J. Mark. 1994, 58, 53–66. [Google Scholar] [CrossRef]
- Oliver, R.L. Cognitive, affective, and attribute bases of the satisfaction response. J. Consum. Res. 1993, 20, 418–430. [Google Scholar] [CrossRef]
- Yi, Y.J.; La, S.N. Brand personality–brand identification–brand equity model: An exploratory study on the difference between users vs. non-users. Korea Mark. Rev. 2002, 17, 1–33. [Google Scholar]
- Bass, F.M.; Wilkie, W.L. A comparative analysis of attitudinal predictions of brand preference. J. Mark. Res. 1973, 10, 262–269. [Google Scholar] [CrossRef]
- Ginter, J.L. An empirical investigation of the brand loyalty phenomenon. J. Bus. Res. 1974, 2, 195–211. [Google Scholar]
- Anderson, E.W.; Sullivan, M.W. The antecedents and consequences of customer satisfaction for firms. Mark. Sci. 1993, 12, 125–143. [Google Scholar] [CrossRef]
- Sirgy, M.J.; Samli, A.C. A path analytic model of store loyalty involving self-concept, store image, socioeconomic status, and geographic loyalty. J. Acad. Mark. Sci. 1985, 13, 265–291. [Google Scholar] [CrossRef]
- Lisboa, A.; Skarmeas, D.; Lages, C. Entrepreneurial orientation, exploitative and explorative capabilities, and performance outcomes in export markets: A resource-based approach. Ind. Mark. Manag. 2011, 40, 1274–1284. [Google Scholar] [CrossRef]
- Woo, J.P. Structural Equation Model Concepts and Understanding; Hannarae: Seoul, Republic of Korea, 2012. [Google Scholar]
- Kim, G.S. Easy SEM with Smart PLS.; Cheong-lam: Seoul, Republic of Korea, 2013. [Google Scholar]
- Wold, H. Partial least squares. In Encyclopedia of Statistical Sciences; Kotz, S., Johnson, N.L., Eds.; Wiley: New York, NY, USA, 1985; Volume 6, pp. 581–591. [Google Scholar]
- Hair, J.F., Jr.; Hult, G.T.M.; Ringle, C.; Sarstedt, M. A Primer on Partial Least Squares Structural Equation Modeling (PLS-SEM); Sage Publications: Thousand Oaks, CA, USA, 2013. [Google Scholar]
- Diamantopoulos, A.; Siguaw, J.A. Formative versus reflective indicators in organizational measure development: A comparison and empirical illustration. Br. J. Manag. 2006, 17, 263–282. [Google Scholar] [CrossRef]
- Petter, S.; Straub, D.; Rai, A. Specifying formative constructs in information systems research. MIS Q. 2007, 31, 623–656. [Google Scholar] [CrossRef]
- Barclay, D.; Higgins, C.; Thompson, R. The partial least squares (PLS) approach to causal modeling: Personal computer adoption and use as an illustration. Technol. Stud. 1995, 2, 285–309. [Google Scholar]
- Fornell, C.; Cha, J. Partial least squares. In Advanced Methods of Marketing Research; Bagozzi, R.P., Ed.; Blackwell: Cambridge, MA, USA, 1994; pp. 52–78. [Google Scholar]
- Nunnally, J.C.; Bernstein, I.H. Psychometric Theory; McGraw-Hill: New York, NY, USA, 1994. [Google Scholar]
- Fornell, C.; Larcker, D.F. Evaluating structural equation models with unobservable variables and measurement error. J. Mark. Res. 1981, 18, 39–50. [Google Scholar] [CrossRef]
- Chin, W.W. The partial least squares approach to structural equation modeling. In Modern Methods for Business Research; Marcoulides, G.A., Ed.; Lawrence Erlbaum Associates: Mahwah, NJ, USA, 1998; pp. 295–336. [Google Scholar]
- Cronbach, L.J. Coefficient alpha and the internal structure of tests. Psychometrika 1951, 16, 297–334. [Google Scholar] [CrossRef]
- Straub, D.; Boudreau, M.-C.; Gefen, D. Validation guidelines for IS positivist research. Commun. Assoc. Inf. Syst. 2004, 13, 380–427. [Google Scholar] [CrossRef]
- Bang, Y.S.; Lee, D.J.; Bae, Y.S. The role of perceived personalization and understanding in the acceptance of personalized services. J. Manag. Stud. 2011, 40, 355–382. [Google Scholar]
- Gu, D. Research Methodology; Hakhyeonsa: Paju, Republic of Korea, 2013. [Google Scholar]
- Armstrong, J.S.; Overton, T.S. Estimating nonresponse bias in mail surveys. J. Mark. Res. 1977, 14, 396–402. [Google Scholar] [CrossRef]
- Billings, R.S.; Wroten, S.P. Use of path analysis in industrial/organizational psychology: Criticisms and suggestions. J. Appl. Psychol. 1978, 63, 677–688. [Google Scholar] [CrossRef]
- Lindell, M.K.; Whitney, D.J. Accounting for common method variance in cross-sectional research designs. J. Appl. Psychol. 2001, 86, 114–121. [Google Scholar] [CrossRef] [PubMed]
- Cote, J.A.; Buckley, M.R. Measurement error and theory testing in consumer research: An illustration of the importance of construct validation. J. Consum. Res. 1988, 14, 579–582. [Google Scholar] [CrossRef]
- Andersson, L.M.; Bateman, T.S. Cynicism in the workplace: Some causes and effects. J. Organ. Behav. 1997, 18, 449–469. [Google Scholar] [CrossRef]
- Aulakh, P.S.; Gencturk, E.F. International principal–agent relationships: Control, governance, and performance. Ind. Mark. Manag. 2000, 29, 521–538. [Google Scholar] [CrossRef]
- Krishnan, R.; Martin, X.; Noorderhaven, N.G. When does trust matter to alliance performance? Acad. Manag. J. 2006, 49, 894–915. [Google Scholar] [CrossRef]
- Podsakoff, P.M.; MacKenzie, S.B.; Lee, J.-Y.; Podsakoff, N.P. Common method biases in behavioral research: A critical review of the literature and recommended remedies. J. Appl. Psychol. 2003, 88, 879–903. [Google Scholar] [CrossRef]
- Wisinran, Y.-S. The meaning of knowledge type on the relationship between knowledge sharing, knowledge creation, and corporate performance: A case study of the headquarters and overseas subsidiaries of global companies entering China. Strateg. Manag. Res. 2018, 21, 23–48. [Google Scholar]
- Sobel, M.E. Asymptotic Confidence Intervals for Indirect Effects in Structural Equation Models. Sociol. Methodol. 1982, 13, 290–321. [Google Scholar] [CrossRef]
- Baron, R.M.; Kenny, D.A. The moderator–mediator variable distinction in social psychological research: Conceptual, strategic, and statistical considerations. J. Personal. Soc. Psychol. 1986, 51, 1173–1182. [Google Scholar] [CrossRef] [PubMed]
- Judd, C.M.; Kenny, D.A. Process analysis: Estimating mediation in treatment evaluations. Eval. Rev. 1981, 5, 602–619. [Google Scholar] [CrossRef]
- Lumpkin, G.T.; Dess, G.G. Linking two dimensions of entrepreneurial orientation to firm performance: The moderating role of environment and industry life cycle. J. Bus. Ventur. 2001, 16, 429–451. [Google Scholar] [CrossRef]
- Ordanini, A.; Parasuraman, A. Service innovation viewed through a service-dominant logic lens: A conceptual framework and empirical analysis. J. Serv. Res. 2011, 14, 3–23. [Google Scholar] [CrossRef]
- Paladino, A. Investigating the drivers of innovation and new product success: A comparison of strategic orientations. J. Prod. Innov. Manag. 2007, 24, 534–553. [Google Scholar] [CrossRef]
- Sousa, R.; Voss, C.A. Service quality in multichannel services employing virtual channels. J. Serv. Res. 2006, 8, 356–371. [Google Scholar] [CrossRef]
- Zhang, C.; Cavusgil, S.T.; Roath, A.S. Manufacturer governance of foreign distributor relationships: Do relational norms enhance competitiveness in the export market? J. Int. Bus. Stud. 2003, 34, 550–566. [Google Scholar] [CrossRef]
- Gallino, S.; Moreno, A. Integration of online and offline channels in retail: The impact of sharing reliable inventory availability information. Manag. Sci. 2014, 60, 1434–1451. [Google Scholar] [CrossRef]
- Drnevich, P.L.; Kriauciunas, A.P. Clarifying the conditions and limits of the contributions of ordinary and dynamic capabilities to relative firm performance. Strateg. Manag. J. 2011, 32, 254–279. [Google Scholar] [CrossRef]
- Winter, S.G. Understanding dynamic capabilities. Strateg. Manag. J. 2003, 24, 991–995. [Google Scholar] [CrossRef]
- Dess, G.G.; Beard, D.W. Dimensions of organizational task environments. Adm. Sci. Q. 1984, 29, 52–73. [Google Scholar] [CrossRef]
- Hauschild, S.; Knyphausen-Aufseß, D.Z.; Rahmel, M. Measuring industry dynamics: Towards a comprehensive concept. Schmalenbach Bus. Rev. 2011, 63, 416–454. [Google Scholar] [CrossRef]
- Suh, T.; Badrinarayanan, V. Proximal and distal influences on project creativity in international marketing teams. Int. Mark. Rev. 2014, 31, 283–307. [Google Scholar] [CrossRef]
- Haarhaus, T.; Liening, A. Building dynamic capabilities to cope with environmental uncertainty: The role of strategic foresight. Technol. Forecast. Soc. Change 2020, 155, 120033. [Google Scholar] [CrossRef]
- Burns, T.; Stalker, G.M. The Management of Innovation; Tavistock: London, UK, 1961. [Google Scholar]
- Lawrence, P.R.; Lorsch, J.W. Organization and Environment: Managing Differentiation and Integration; Harvard University Press: Boston, MA, USA, 1969. [Google Scholar]
- Eisenhardt, K.M.; Martin, J.A. Dynamic capabilities: What are they? Strateg. Manag. J. 2000, 21, 1105–1121. [Google Scholar] [CrossRef]
- Schreyögg, G.; Kliesch-Eberl, M. How dynamic can organizational capabilities be? towards a dual-process model of capability dynamization. Strateg. Manag. J. 2007, 28, 913–933. [Google Scholar] [CrossRef]
- Newbert, S.L. New firm formation: A dynamic capability perspective. J. Small Bus. Manag. 2005, 43, 55–77. [Google Scholar] [CrossRef]
- Wu, L.-Y. Applicability of the resource-based and dynamic-capability views under environmental volatility. J. Bus. Res. 2010, 63, 27–31. [Google Scholar] [CrossRef]
- Courtney, H.; Kirkland, J.; Viguerie, P. Strategy under uncertainty. Harv. Bus. Rev. 1997, 75, 67–79. [Google Scholar]
- Carson, S.J.; Madhok, A.; Wu, T. Uncertainty, opportunism, and governance: The effects of volatility and ambiguity on formal and relational contracting. Acad. Manag. J. 2006, 49, 1058–1077. [Google Scholar] [CrossRef]
- Kim, M.S.; Son, G.N. Understanding the 4th industrial revolution and digital transformation. Trends Inf. Commun. Ind. 2017, 29, 26–32. [Google Scholar]
- Sebastian, I.M.; Ross, J.W.; Beath, C.; Mocker, M.; Moloney, K.G.; Fonstad, N.O. How big old companies navigate digital transformation. In Strategic Information Management; Galliers, R.D., Leidner, D.E., Eds.; Routledge: London, UK, 2020; pp. 133–150. [Google Scholar]
- Sia, S.K.; Soh, C.; Weill, P. How DBS Bank pursued a digital business strategy. MIS Q. Exec. 2016, 15, 105–121. [Google Scholar]
- Von Bertalanffy, L.; Sutherland, J.W. General systems theory: Foundations, developments, applications. IEEE Trans. Syst. Man Cybern. 1974, 6, 592. [Google Scholar] [CrossRef]
- Gong, Y.; Shenkar, O.; Luo, Y.; Nyaw, M.K. Human resources and international joint venture performance: A system perspective. J. Int. Bus. Stud. 2005, 36, 505–518. [Google Scholar] [CrossRef]
- Jeong, S.-H. Distinction, generalization, functional analysis—A study on the comparative research methods of systems theory. Philos. Thought 2008, 28, 379–419. [Google Scholar]
- Christensen, C.M. The Innovator’s Dilemma: When New Technologies Cause Great Firms to Fail; Harvard Business School Press: Boston, MA, USA, 1997. [Google Scholar]
- Hill, C.W.L.; Rothaermel, F.T. The performance of incumbent firms in the face of radical technological innovation. Acad. Manag. Rev. 2003, 28, 257–274. [Google Scholar] [CrossRef]
- Raisch, S.; Birkinshaw, J.; Probst, G.; Tushman, M.L. Organizational ambidexterity: Balancing exploitation and exploration for sustained performance. Organ. Sci. 2009, 20, 685–695. [Google Scholar] [CrossRef]
- Noruzy, A.; Dalfard, V.M.; Azhdari, B.; Nazari-Shirkouhi, S.; Rezazadeh, A. Relations between transformational leadership, organizational learning, knowledge management, organizational innovation, and organizational performance: An empirical investigation of manufacturing firms. Int. J. Adv. Manuf. Technol. 2013, 64, 1073–1085. [Google Scholar] [CrossRef]
- Teece, D.J. Business models, business strategy and innovation. Long Range Plan. 2010, 43, 172–194. [Google Scholar] [CrossRef]
- Denford, J.S. Building knowledge: Developing a knowledge-based dynamic capabilities typology. J. Knowl. Manag. 2013, 17, 175–194. [Google Scholar] [CrossRef]
- Teece, D.J. Explicating dynamic capabilities: The nature and microfoundations of (sustainable) enterprise performance. Strateg. Manag. J. 2007, 28, 1319–1350. [Google Scholar] [CrossRef]
- Berry, L.L.; Parasuraman, A. Marketing Services: Competing Through Quality; The Free Press: New York, NY, USA, 1991. [Google Scholar]
- Williams, M.R. The influence of salespersons’ customer orientation on buyer-seller relationship development. J. Bus. Ind. Mark. 1998, 13, 271–287. [Google Scholar] [CrossRef]
- Branch, B. Research and development activity and profitability: A distributed lag analysis. J. Political Econ. 1974, 82, 999–1011. [Google Scholar] [CrossRef]
- Cooper, R.G.; Edgett, S.J.; Kleinschmidt, E.J. Portfolio Management for New Products; Addison-Wesley: Reading, MA, USA, 1998. [Google Scholar]
- Griliches, Z. R&D, Patents, and Productivity; University of Chicago Press: Chicago, IL, USA, 1984. [Google Scholar]
- O’Reilly, C.A.; Tushman, M.L. Organizational ambidexterity: Past, present, and future. Acad. Manag. Perspect. 2013, 27, 324–338. [Google Scholar] [CrossRef]
- Gibson, C.B.; Birkinshaw, J. The antecedents, consequences, and mediating role of organizational ambidexterity. Acad. Manag. J. 2004, 47, 209–226. [Google Scholar] [CrossRef]
- He, Z.-L.; Wong, P.-K. Exploration vs. exploitation: An empirical test of the ambidexterity hypothesis. Organ. Sci. 2004, 15, 481–494. [Google Scholar] [CrossRef]
- Lubatkin, M.H.; Simsek, Z.; Ling, Y.; Veiga, J.F. Ambidexterity and performance in small- to medium-sized firms: The pivotal role of top management team behavioral integration. J. Manag. 2006, 32, 646–672. [Google Scholar] [CrossRef]
- Benner, M.J.; Tushman, M.L. Process management and technological innovation: A longitudinal study of the photography and paint industries. Adm. Sci. Q. 2002, 47, 676–706. [Google Scholar] [CrossRef]
- Tushman, M.L.; O’Reilly, C.A. Ambidextrous organizations: Managing evolutionary and revolutionary change. Calif. Manag. Rev. 1996, 38, 8–30. [Google Scholar] [CrossRef]
- Lee, S.-S. Marketing strategy of library digital information service—A case study of real-time information service (information service through chat). J. Korean Libr. Inf. Sci. Soc. 2009, 40, 207–221. [Google Scholar]
- Mata, R.; Schooler, L.J.; Rieskamp, J. The aging decision maker: Cognitive aging and the adaptive selection of decision strategies. Psychol. Aging 2007, 22, 796–810. [Google Scholar] [CrossRef] [PubMed]
- McDowd, J.M. An overview of attention: Behavior and brain. J. Neurol. Phys. Ther. 2007, 31, 98–103. [Google Scholar] [CrossRef] [PubMed]


| Factor | Conceptual Definition | Measure |
|---|---|---|
| Brand Awareness | The degree to which consumers are aware of or recall a particular brand | I can often come across advertisements and promotions of my main bank. My main bank’s brand is easy to remember. My main bank’s logo is easily distinguishable. My main bank is a representative brand in the banking industry. I am well informed of the characteristics of my main bank. |
| Brand Availability | The degree to which a customer can use a particular bank | My main bank has more branches compared to competing brands. My main bank offers more diverse financial products than other banks. My main bank provides more advantageous (profitable) financial products than other banks. My main bank’s products are less risky than other banks. |
| Brand Image | Overall impression customers have of a particular bank | My main bank has a sophisticated image. My main bank gives me a sense of familiarity. My main bank has a trustworthy image. My main bank gives an image leading the times. My main bank is reputable. |
| Customer Orientation | The extent to which customers are satisfied with understanding and satisfying their needs | The staff at my main bank’s branches is friendly. The staff at my main bank’s branches is very responsive to questions. The staff at my main bank’s branches wants to know what customers want. The staff at my main bank’s branches offers good solutions to customers. The staff at my main bank’s branches takes care of my problems quickly. |
| Physical Environmental Quality | Objective/physical factors that companies can control | The facilities of my main bank’s branches are clean. My main bank’s branches are a space where I want to stay for a long time. My main bank’s branches are generally convenient to use. My main bank’s branches are generally aesthetically pleasing. |
| Factor | Conceptual Definition | Measure | |
|---|---|---|---|
| System Quality | Accessibility | Digital service access speed; always use, degree of information acquisition | The main bank’s digital services (internet, mobile, platform) have fast access. The main bank’s digital services (Internet, mobile, platform) are always available. The main bank’s digital services (Internet, mobile, platform) are easy to obtain information. |
| Security | System safety, privacy, degree of security | The main bank’s digital services (Internet, mobile, platform) are safe from hacking. The main bank’s payment and payment methods are highly secure. The main bank’s security system is superior to that of other banks. | |
| Ease of Use | Simplicity, degree of affinity with using system | The main bank’s digital services (Internet, mobile, platform) are easy to use. The main bank’s digital services (Internet, mobile, platform) are simple to use. The main bank’s digital services (Internet, mobile, platform) provide a user-friendly interface (system, design). | |
| Information Quality | Sufficiency | Sufficiency of necessary information | The main bank’s digital services (internet, mobile, platform) provide sufficient information about products (e.g., savings accounts, loans). |
| Diversity | Diversity of necessary information | The main bank’s digital services (Internet, mobile, platform) provide a variety of information about products (e.g., savings, loans). | |
| Freshness | Freshness of necessary information | The main bank’s digital services (internet, mobile, platform) provide up-to-date information on products (e.g., savings accounts, loans). | |
| Accuracy | Accuracy of necessary information | The main bank’s digital services (Internet, mobile, platform) provide accurate information about products (deposits, savings, loans). | |
| Usefulness | Usefulness of necessary information | The main bank’s digital services (Internet, mobile, platform) provide useful information about products (deposits, savings, loans). | |
| Service Quality | Customer Support | Prompt response, correct response, and sincere answers (communication) to customer requests | The main bank’s digital solutions (chatbots, robo-advisors) respond quickly to my requests. The main bank’s digital solutions (chatbot, robo-advisor) respond to my request with accurate content. The main bank’s digital solutions (chatbots, robo-advisors) faithfully answer my requests. |
| Customization | Customized products for customer preferences and interest, service provided such as information, etc. | The main bank’s digital solutions (chatbot, robo-advisor) provide customized services tailored to my interests. The main bank’s digital solutions (chatbot, robo-advisor) provide differentiated services according to my conditions and circumstances. The main bank’s digital solutions (chatbot, robo-advisor) provide customized services according to my knowledge (skill) level. | |
| Reliability | Delivering promises, solutions, and defined services to customer needs | The main bank’s digital solutions (chatbot, robo-advisor) solve my problem. The main bank’s digital solutions (chatbot, robo-advisor) execute within the promised time. The main bank’s digital solutions (chatbot, robo-advisor) provide the promised service. | |
| Gender | Male | 256 people (63.2%) | Job | Employee | 79 people (19.4%) |
| Female | 150 people (36.8%) | Public officer | 13 people (3.2%) | ||
| Age | 20–29 | 174 people (42.8%) | Under-graduate Post-graduate | 166 people (40.8%) | |
| 30–39 | 30 people (7.4%) | Business men | 49 people (12%) | ||
| 40–49 | 35 people (8.6%) | Professional | 50 people (12.3%) | ||
| 50–59 | 89 people (21.9%) | Service sector | 11 people (4.4%) | ||
| More than 60 | 76 people (18.7%) | Housewife | 7 people (1.7%) | ||
| Education | High school students | 3 people (0.7%) | Agriculture, fishery, forestry, animal husbandry | 4 people (1%) | |
| Graduate from high school | 42 people (10.3%) | Unemployed | 21 people (5.2%) | ||
| Graduate from college (enrolled) | 25 people (6.1%) | Other | 18 people (4.4%) | ||
| Graduate from university (enrolled) | 242 people (59.5%) | Average monthly income | <GBP 1200 | 183 people (45%) | |
| Post-graduate (enrolled) | 95 people (23.3%) | GBP 1200~1800 | 49 people (12%) | ||
| GBP 1800~2400 | 45 people (11.1%) | ||||
| GBP 2400~3000 | 38 people (9.3%) | ||||
| >GBP 3000 | 92 people (22.6%) |
| Variables | (1) | (2) | (3) | (4) | (5) | (7) | (8) | (9) | (10) | (11) | VIF | |
|---|---|---|---|---|---|---|---|---|---|---|---|---|
| Brand Awareness (1) | 1.000 | 1.363 | ||||||||||
| Brand Availability (2) | 0.541 | 1.000 | 1.503 | |||||||||
| Brand Image (3) | 0.507 | 0.610 | 1.000 | 2.210 | ||||||||
| Customer Orientation (4) | 0.409 | 0.540 | 0.653 | 1.000 | 3.939 | |||||||
| Physical Quality (5) | 0.412 | 0.562 | 0.604 | 0.645 | 1.000 | 1.887 | ||||||
| Digital Quality | System Quality (6) | 0.416 | 0.527 | 0.539 | 0.542 | 0.591 | 1.000 | 3.356 | ||||
| Information Quality (7) | 0.387 | 0.509 | 0.569 | 0.614 | 0.613 | 0.657 | 1.000 | 4.100 | ||||
| Service Quality (8) | 0.368 | 0.464 | 0.530 | 0.591 | 0.621 | 0.598 | 0.677 | 1.000 | 4.227 | |||
| Customer Satisfaction (9) | 0.427 | 0.541 | 0.566 | 0.597 | 0.531 | 0.574 | 0.569 | 0.590 | 1.000 | 3.217 | ||
| Brand Loyalty (10) | 0.464 | 0.531 | 0.531 | 0.642 | 0.646 | 0.586 | 0.595 | 0.582 | 0.622 | 1.000 | 2.065 | |
| Items | Cronbach’s Alpha | rho_A | Synthetic Reliability | Average Variance Extracted (AVE) | |
|---|---|---|---|---|---|
| Brand | 0.711 | 0.714 | 0.813 | 0.569 | |
| Availability | 0.736 | 0.770 | 0.829 | 0.551 | |
| Customer | 0.932 | 0.934 | 0.949 | 0.787 | |
| p.Qaulity | 0.860 | 0.867 | 0.900 | 0.643 | |
| Physical | 0.830 | 0.843 | 0.887 | 0.662 | |
| Digital Quality | System | 0.934 | 0.937 | 0.945 | 0.657 |
| Information | 0.945 | 0.945 | 0.958 | 0.820 | |
| Service | 0.959 | 0.959 | 0.965 | 0.753 | |
| Satisfaction | 0.925 | 0.926 | 0.947 | 0.817 | |
| Loyal | 0.830 | 0.854 | 0.886 | 0.662 | |
| Variables | (1) | (2) | (3) | (4) | (5) | (6) | (7) | (8) | (9) | (10) |
|---|---|---|---|---|---|---|---|---|---|---|
| Availability (1) | 0.743 | |||||||||
| Brand (2) | 0.541 | 0.685 | ||||||||
| Customer (3) | 0.540 | 0.409 | 0.887 | |||||||
| Information (4) | 0.509 | 0.387 | 0.614 | 0.905 | ||||||
| Loyal (5) | 0.531 | 0.464 | 0.642 | 0.695 | 0.814 | |||||
| p.Quality (6) | 0.610 | 0.507 | 0.653 | 0.669 | 0.731 | 0.802 | ||||
| Physical (7) | 0.562 | 0.412 | 0.745 | 0.613 | 0.646 | 0.704 | 0.814 | |||
| Satisfaction (8) | 0.541 | 0.427 | 0.697 | 0.769 | 0.822 | 0.766 | 0.731 | 0.904 | ||
| Service (9) | 0.464 | 0.368 | 0.591 | 0.777 | 0.682 | 0.630 | 0.621 | 0.790 | 0.868 | |
| System (10) | 0.527 | 0.416 | 0.642 | 0.757 | 0.686 | 0.739 | 0.691 | 0.774 | 0.698 | 0.811 |
| Component | Initial Eigenvalues | Extraction Sums of Squared Loadings | ||||
|---|---|---|---|---|---|---|
| Total | % of Variance | Cumulative (%) | Total | % of Variance | Cumulative (%) | |
| 1 | 7.220 | 42.470 | 42.470 | 7.220 | 42.470 | 42.470 |
| 2 | 1.625 | 9.557 | 52.027 | 1.625 | 9.557 | 52.027 |
| 3 | 1.178 | 6.927 | 58.954 | 1.178 | 6.927 | 58.954 |
| 4 | 0.998 | 5.869 | 64.822 | 0.998 | 5.869 | 64.822s |
| Hypotheses | Original Sample (O) | Sample Mean (M) | Standard Deviation (STDEV) | T Statistics (|O/STDEV|) | p Values |
|---|---|---|---|---|---|
| Brand Awareness → Satisfaction | −0.001 | 0.000 | 0.030 | 0.019 | 0.985 |
| Availability → Satisfaction | −0.012 | −0.010 | 0.034 | 0.341 | 0.733 |
| Customer → Satisfaction | 0.104 | 0.105 | 0.047 | 2.207 | 0.027 |
| Information Quality → Satisfaction | 0.136 | 0.137 | 0.049 | 2.780 | 0.005 |
| Perceived Quality → Satisfaction | 0.226 | 0.224 | 0.053 | 4.286 | 0.000 |
| Physical → Satisfaction | 0.132 | 0.132 | 0.040 | 3.340 | 0.001 |
| Satisfaction → Loyalty | 0.822 | 0.823 | 0.019 | 43.022 | 0.000 |
| Service Quality → Satisfaction | 0.308 | 0.306 | 0.043 | 7.191 | 0.000 |
| System Quality → Satisfaction | 0.137 | 0.138 | 0.047 | 2.883 | 0.004 |
| Hypotheses | Original Sample (O) | Sample Mean (M) | Standard Deviation (STDEV) | T Statistics (|O/STDEV|) | p Values |
|---|---|---|---|---|---|
| Brand Awareness → Satisfaction | −0.003 | −0.003 | 0.036 | 0.090 | 0.928 |
| Availability → Satisfaction | −0.008 | −0.007 | 0.039 | 0.198 | 0.843 |
| Customer → Satisfaction | 0.093 | 0.094 | 0.049 | 1.882 | 0.060 |
| Information Quality → Satisfaction | 0.125 | 0.126 | 0.049 | 2.570 | 0.010 |
| Perceived Quality → Satisfaction | 0.252 | 0.248 | 0.061 | 4.133 | 0.000 |
| Physical → Satisfaction | 0.142 | 0.141 | 0.042 | 3.391 | 0.001 |
| Satisfaction → Loyalty | 0.749 | 0.750 | 0.027 | 27.909 | 0.000 |
| Service Quality → Satisfaction | 0.303 | 0.300 | 0.044 | 6.899 | 0.000 |
| System Quality → Satisfaction | 0.152 | 0.154 | 0.052 | 2.953 | 0.003 |
| Uncertainty → Satisfaction | 0.218 | 0.222 | 0.072 | 3.046 | 0.002 |
| Uncertainty × System Quality → Satisfaction | −0.150 | −0.138 | 0.109 | 1.373 | 0.170 |
| Uncertainty × Information Quality → Satisfaction | 0.090 | 0.088 | 0.102 | 0.881 | 0.378 |
| Uncertainty × Service Quality → Satisfaction | 0.027 | 0.015 | 0.096 | 0.280 | 0.780 |
| Hypotheses | Original Sample (O) | Sample Mean (M) | Standard Deviation (STDEV) | T Statistics (|O/STDEV|) | p Values |
|---|---|---|---|---|---|
| Brand Awareness → Satisfaction | −0.003 | −0.007 | 0.036 | 0.090 | 0.928 |
| Availability → Satisfaction | −0.008 | −0.007 | 0.039 | 0.198 | 0.843 |
| Customer → Satisfaction | 0.093 | 0.094 | 0.049 | 1.882 | 0.060 |
| Information Quality → Satisfaction | 0.125 | 0.126 | 0.049 | 2.570 | 0.010 |
| Perceived Quality →Satisfaction | 0.252 | 0.248 | 0.061 | 4.133 | 0.000 |
| Physical → Satisfaction | 0.142 | 0.141 | 0.042 | 3.391 | 0.001 |
| Satisfaction → Loyalty | 0.749 | 0.750 | 0.027 | 27.909 | 0.000 |
| Service Quality → Satisfaction | 0.303 | 0.300 | 0.044 | 6.899 | 0.000 |
| System Quality → Satisfaction | 0.152 | 0.154 | 0.052 | 2.953 | 0.003 |
| Uncertainty → Satisfaction | 0.218 | 0.222 | 0.072 | 3.046 | 0.002 |
| System Quality × Uncertainty → Satisfaction | −0.150 | −0.138 | 0.109 | 1.373 | 0.170 |
| Information Quality × Uncertainty → Satisfaction | 0.090 | 0.088 | 0.102 | 0.881 | 0.378 |
| Service Quality × Uncertainty → Satisfaction | 0.027 | 0.015 | 0.096 | 0.280 | 0.780 |
| Path | Sobel Test (Z) | p (Two-Tailed) | S.D. (Satisfaction) |
|---|---|---|---|
| Image → Satisfaction → Loyalty | 4.24 † | 0.000 | 0.053 |
| Customer Orientation → Satisfaction → Loyalty | 2.20 ** | 0.027 | 0.047 |
| Physical → Satisfaction → Loyalty | 3.29 *** | 0.001 | 0.040 |
| System → Satisfaction → Loyalty | 2.91 *** | 0.003 | 0.047 |
| Information → Satisfaction → Loyalty | 2.76 *** | 0.005 | 0.049 |
| Service → Satisfaction → Loyalty | 7.06 † | 0.000 | 0.043 |
| Variables | F2 (Satisfaction) | F2 (Loyalty) |
|---|---|---|
| Brand Awareness | 0.000 | - |
| Brand Availability | 0.000 | - |
| Brand Image | 0.079 | - |
| Customer Orientation | 0.021 | - |
| Physical Quality | 0.028 | - |
| System Quality | 0.027 | - |
| Information Quality | 0.026 | - |
| Service Quality | 0.158 | - |
| Customer Satisfaction | - | 2.083 |
| Hypothesis | Path | Result |
|---|---|---|
| H1-1 (+) | Brand Awareness → Customer Satisfaction → Customer Loyalty | Not Supported |
| H1-2 (+) | Brand Image → Customer Satisfaction → Customer Loyalty | Not Supported |
| H2 (+) | Brand Availability → Customer Satisfaction → Customer Loyalty | Supported |
| H3 (+) | Customer Orientation → Customer Satisfaction → Customer Loyalty | Supported |
| H4 (+) | Physical Quality → Customer Satisfaction → Customer Loyalty | Supported |
| H5-1 (+) | System Quality → Customer Satisfaction → Customer Loyalty | Supported |
| H5-2 (+) | Information Quality → Customer Satisfaction → Customer Loyalty | Supported |
| H5-3 (+) | Service Quality → Customer Satisfaction → Customer Loyalty | Supported |
| H6 (+) | Customer Satisfaction → Customer Loyalty | Supported |
| H7-1 (+) | Uncertainty → Customer Satisfaction | Supported |
| H7-2 (+) | Uncertainty × Digital Quality → Customer Satisfaction | Not Supported |
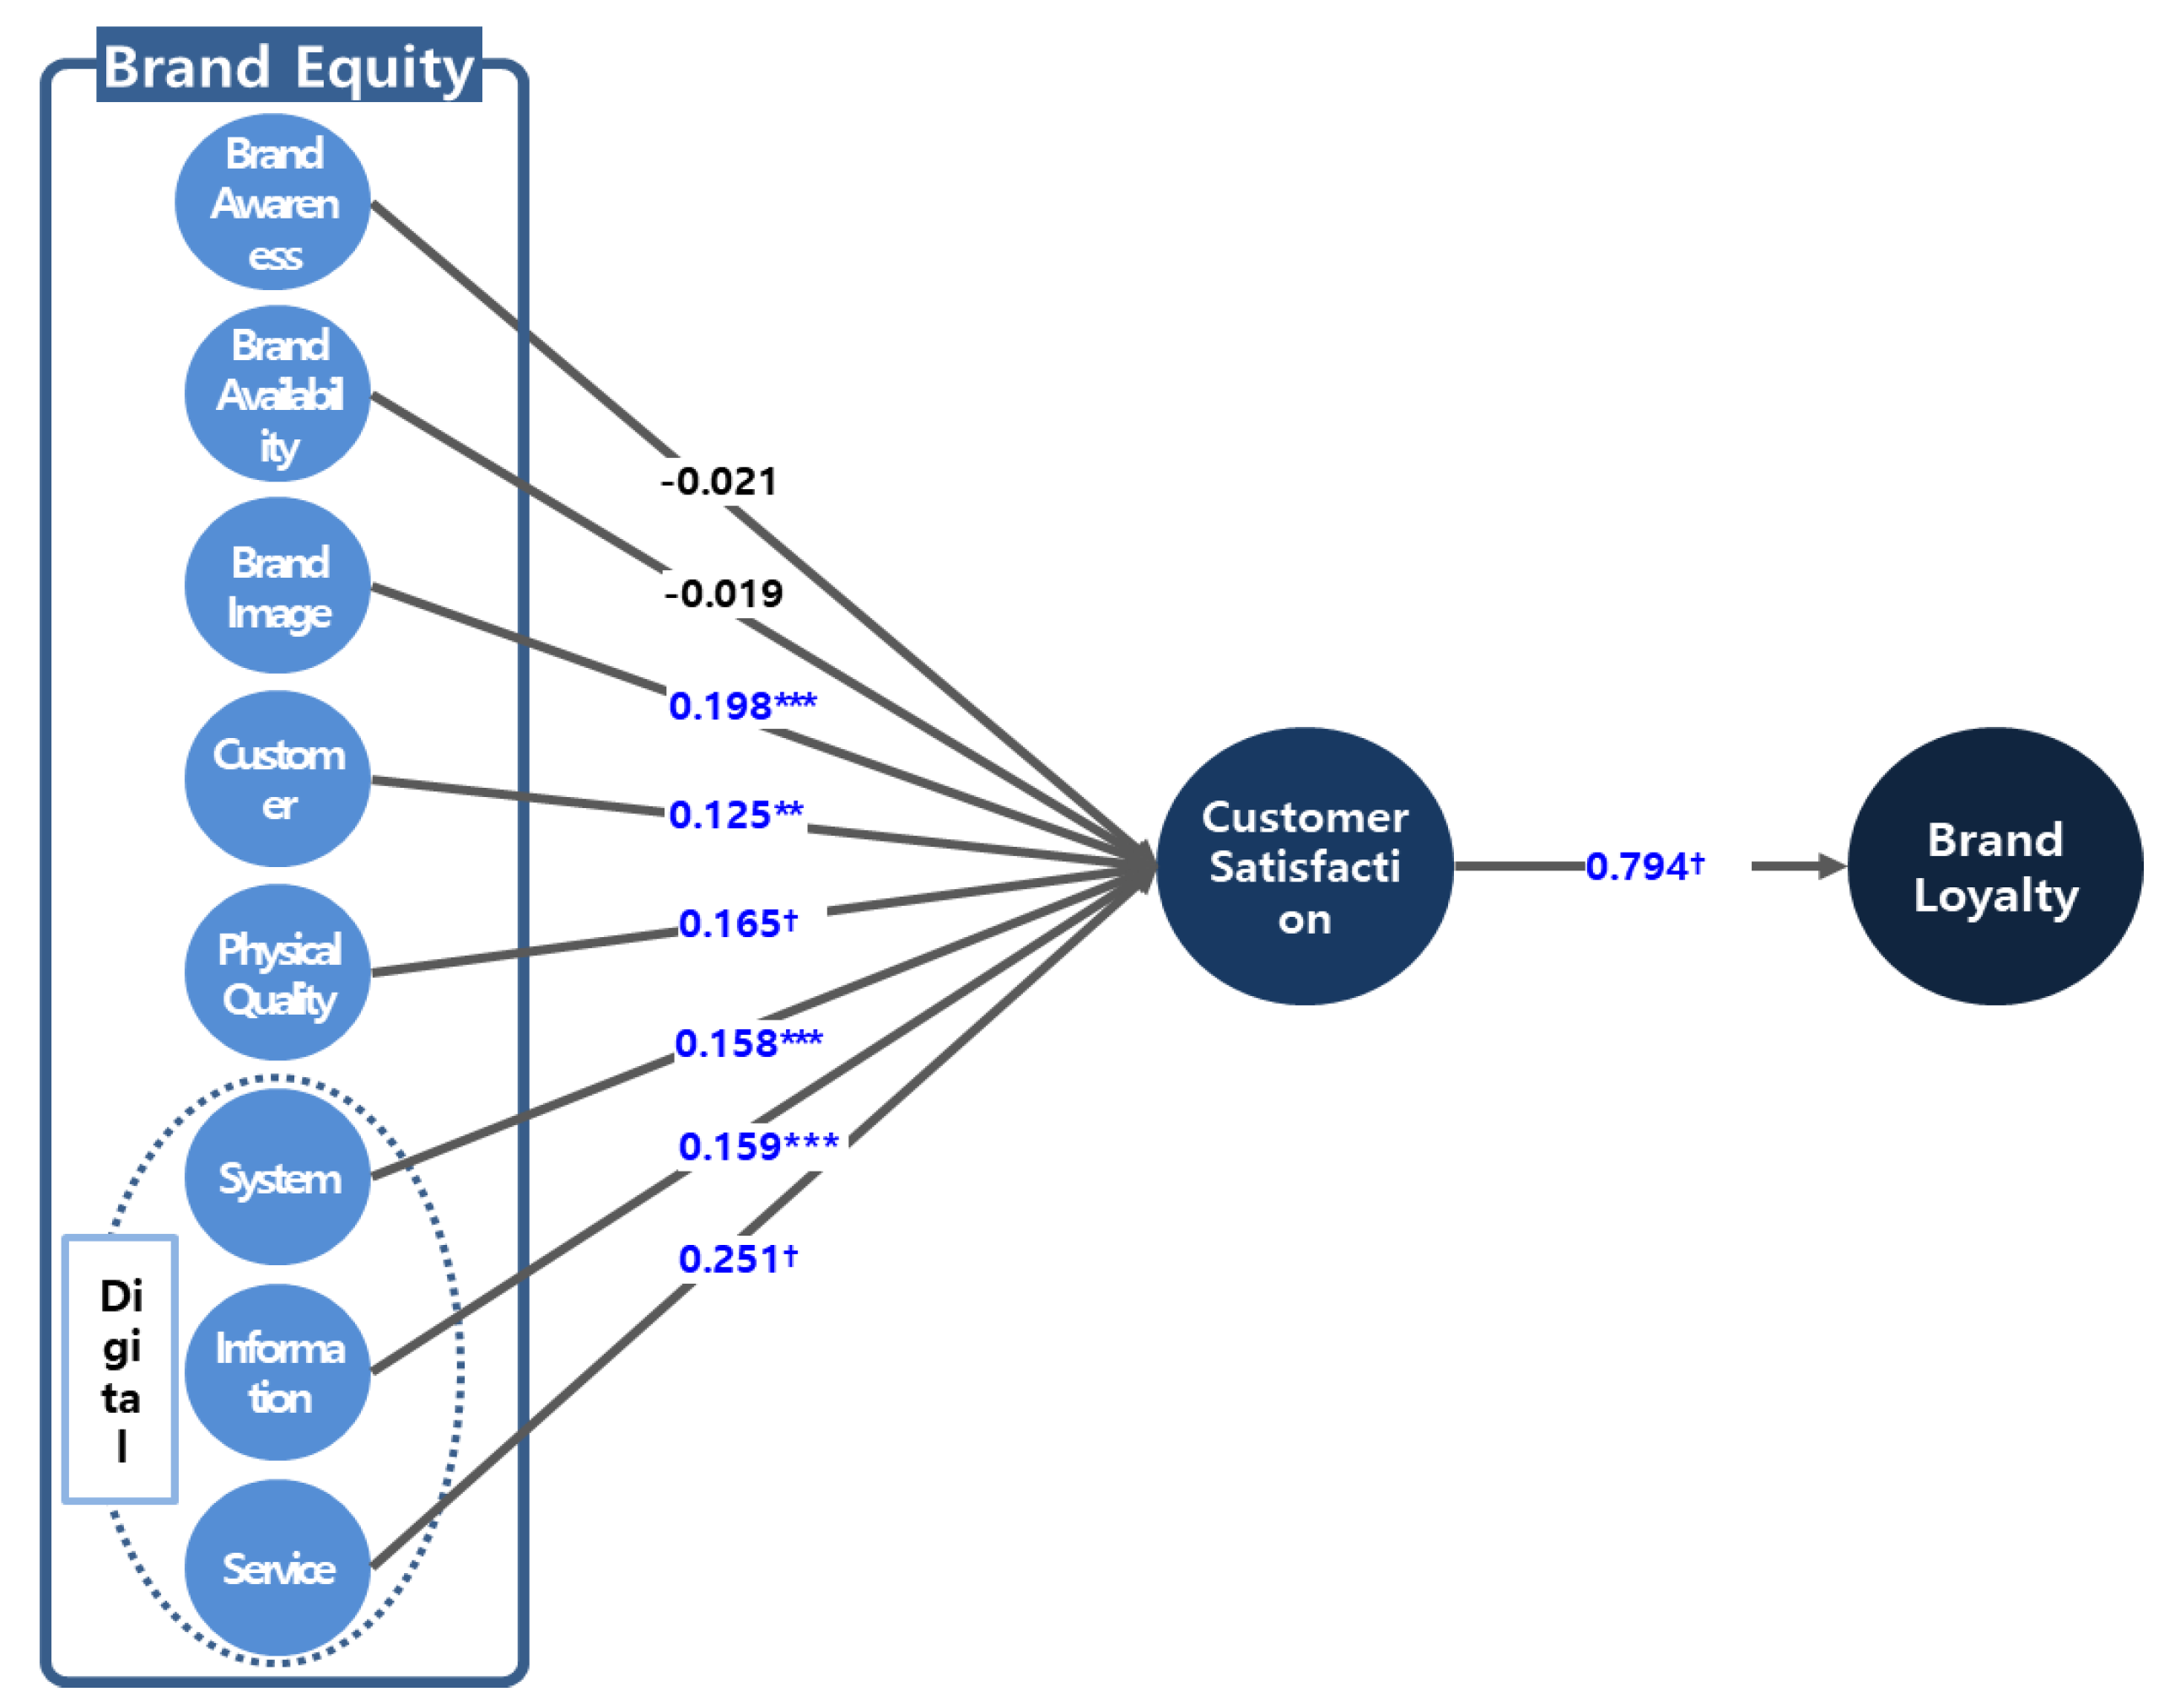
| Hypothesis | Path | Path Efficient | Result |
|---|---|---|---|
| H1-1 | Brand Awareness → Customer Loyalty | 0.087 ** | Not Mediated |
| Brand Awareness → Customer Satisfaction → Customer Loyalty | −0.021 | ||
| H1-2 | Brand Image → Customer Loyalty | 0.300 † | Partial Mediated |
| Brand Image → Customer Satisfaction → Customer Loyalty | 0.198 *** | ||
| H2 | Brand Availability → Customer Loyalty | 0.009 | Not Mediated |
| Brand Availability → Customer Satisfaction → Customer Loyalty | −0.019 | ||
| H3 | Customer Orientation → Customer Loyalty | 0.122 ** | Partial Mediated |
| Customer Orientation → Customer Satisfaction → Customer Loyalty | 0.125 ** | ||
| H4 | Physical Quality → Customer Loyalty | 0.046 | Full Mediated |
| Physical Quality → Customer Satisfaction → Customer Loyalty | 0.165 † | ||
| H5-1 | System Quality → Customer Loyalty | 0.059 | Full Mediated |
| System Quality → Customer Satisfaction → Customer Loyalty | 0.158 *** | ||
| H5-2 | Information Quality → Customer Loyalty | 0.156 *** | Partial Mediated |
| Information Quality → Customer Satisfaction → Customer Loyalty | 0.159 *** | ||
| H5-3 | Service Quality → Customer Loyalty | 0.193 † | Partial Mediated |
| Service Quality → Customer Satisfaction → Customer Loyalty | 0.251 † |
Disclaimer/Publisher’s Note: The statements, opinions and data contained in all publications are solely those of the individual author(s) and contributor(s) and not of MDPI and/or the editor(s). MDPI and/or the editor(s) disclaim responsibility for any injury to people or property resulting from any ideas, methods, instructions or products referred to in the content. |
© 2025 by the authors. Licensee MDPI, Basel, Switzerland. This article is an open access article distributed under the terms and conditions of the Creative Commons Attribution (CC BY) license (https://creativecommons.org/licenses/by/4.0/).
Share and Cite
Kim, S.H.; Yang, Y.R. The Effect of Digital Quality on Customer Satisfaction and Brand Loyalty Under Environmental Uncertainty: Evidence from the Banking Industry. Sustainability 2025, 17, 3500. https://doi.org/10.3390/su17083500
Kim SH, Yang YR. The Effect of Digital Quality on Customer Satisfaction and Brand Loyalty Under Environmental Uncertainty: Evidence from the Banking Industry. Sustainability. 2025; 17(8):3500. https://doi.org/10.3390/su17083500
Chicago/Turabian StyleKim, Seong Hun, and Yae Rim Yang. 2025. "The Effect of Digital Quality on Customer Satisfaction and Brand Loyalty Under Environmental Uncertainty: Evidence from the Banking Industry" Sustainability 17, no. 8: 3500. https://doi.org/10.3390/su17083500
APA StyleKim, S. H., & Yang, Y. R. (2025). The Effect of Digital Quality on Customer Satisfaction and Brand Loyalty Under Environmental Uncertainty: Evidence from the Banking Industry. Sustainability, 17(8), 3500. https://doi.org/10.3390/su17083500