Article

Microplastics in the Typical Mulched Farmland of Sichuan Province: Characteristics That Vary Across Farming Scales and the Risk Significantly Contributed by Priority Polymers

1
Sichuan Academy of Eco-Environmental Sciences, Sichuan Province Engineering Technology Research Center of Emerging Contaminants Treatment and Environmental Health, Chengdu 610041, China
2
College of Ecology and Environment, Chengdu University of Technology, Chengdu 610051, China
3
Sichuan Institute of Energy and Geological Survey, Chengdu 610072, China
*
Author to whom correspondence should be addressed.
Sustainability 2025, 17(8), 3516; https://doi.org/10.3390/su17083516
Submission received: 19 February 2025 / Revised: 2 April 2025 / Accepted: 8 April 2025 / Published: 14 April 2025

Abstract

:
Microplastics (MPs) in agricultural soils pose risks to human health in their potential accumulation along the food chain, and their characteristics require further understanding to implement targeted measures. This study investigated the MP characteristics in typical mulching soils from different farming scales in Sichuan Province, which is one of China’s key agricultural regions, and it also innovatively measured the ecological risk by incorporating size into assessments. The investigated sites showed average microplastic abundances of 19696.81 ± 13226.89, and these were dominated by small-sized ethylene–propylene copolymer (E/P), polypropylene (PP), and polyethylene (PE) particles in yellow-to-brown and black-to-shallow-gray soil. Size-considered evaluation suggested that most of the sites were at a high level of risk. It was found that microplastic pollution varies with farming scales. Larger-scale farming sites primarily received MPs from plastic mulching, while smaller-scale sites were likely affected by a range of non-agricultural sources. The risk assessment showed significant contributions from polyamide (PA) and polyphenylene sulfide (PPS). These results indicate that environmental management strategies should tailor source control measures according to agricultural scales and prioritize high-risk polymers, as well as that MP risk evaluations should include “size” along with “pollution load” and “chemical composition” to better reflect the impact of MPs on ecosystems.

1. Introduction

Microplastics (MPs, i.e., those with a size smaller than 5 mm) have been detected in diverse environmental media, including oceans, rivers, air, soils, and human tissue [1,2,3]. Soil acts as a major sink for MPs [4,5], and, especially in agricultural soils, MPs are now ubiquitously detected worldwide. For example, in China, which is the world’s largest plastics producer and consumer [6], agricultural soil were found to exhibit MP abundances ranging from several tens to tens of thousands of particles per kilogram of soil [7,8,9,10,11,12]. Regions with a lower plastic usage (e.g., Europe, North America, Africa, and Oceania) show agricultural soil MP abundances of several to ~1000 particles/kg [3,13,14,15,16]. The occurrence of soil MPs potentially alters soil physicochemical properties, absorbs and mobilizes co-existing pollutants, and disrupts soil biological communities [17]. These effects could even be directly related to human health in agricultural systems as MPs accumulate in crop roots and translocate into edible plant tissues [18].
Previous studies have shown that MP abundance is affected by natural factors, including the available phosphorous [19], texture [13], soil organic carbon (SOC) content [20], extreme precipitation [21], etc. Unlike traditional pollutants, MPs are exclusively anthropogenic; therefore, the farmland farming practice is the factor that largely impacts MP distribution. Global MP hotspots align with regions of intensive cultivation and irrigation [22]. In field studies, farmland amended with sewage sludge, wastewaters, and green-waste composts exhibit higher MP loads [13]. MP presence has also been associated with other non-agricultural activities as it inversely correlates with proximity to roads and residential zones, implicating non-agricultural sources [19].
It could be seen that agricultural MP risks are highly context-dependent, varying with local conditions. Previous studies have discussed MP occurrence with different land-use type [19], soil texture [19], cultivation methods [23], and informed management strategies arid ecosystems. The farming scale critically shapes the environmental impacts of agricultural activities [24], and the integration of this factor as influencing variables of MP occurrence help sustainable plastic management. Prior risk assessments have quantified MPs’ ecological impact on soils. However, most studies have assessed soil MP risks based solely on MP abundances and monomer toxicities [11,25,26], potentially overlooking the hazards posed by smaller particles.
China’s agricultural sector drives plastic demand, consuming 70% of Asia’s and 50% of global agricultural films in 2018 [27], and this implies heavy MP loads in China’s farmland. Moreover, there is also the fact that China is heterogeneous in farming scale compared to America and countries in Europe, where high degree of agricultural mechanization necessitates scale-specific MP studies to guide national policies.
Therefore, this study focused on Sichuan, a critical grain-producing region, to address three objectives:
(1)
To select representative farmland soil sample and characterize their MP pollution from the abundance, the chemical composition, the morphological attributes (shapes and colors), and the size distribution of MPs.
(2)
To test the hypothesis that microplastic pollution characteristics vary with farming scales and to analyze potential sources.
(3)
To assess the ecological risks of MPs in agricultural soil via our optimized size-inclusive evaluation method and to analyze the major contributors to MP risk.
The findings of this study could provide insight for more targeted and effective environmental management toward cleaner farmland and more sustainable agriculture.

2. Materials and Methods

2.1. Study Area and Sampling

Sichuan is one key grain production and storage hub of China, and the health of agriculture in this region, along with its environmental impact, is crucial for the sustainability of the nation’s agricultural sector. Due to its agricultural and ecological significance, Sichuan was chosen as one of the three pilot provinces in China to undergo a soil microplastic survey [28]. Therefore, this study selected representative areas in Sichuan via a two-tiered screening process.
First, we selected Jintang County as a representative agricultural county. Jintang, located in the central region of the fertile Chengdu Plain, is one of China’s first designated commodity grain bases, and it has a long history of cultivation. It serves as a secondary vegetable production base for the provincial capital, generating nearly RMB 300 million from vegetable farming. Jintang was assessed as having the highest cultivated land productivity among the counties of Chengdu [29], and plastic mulching is widely used to enhance crop production and suppress weeds. Therefore, Jintang County may represent the region most significantly impacted by microplastic pollution in agricultural soils in Sichuan Province.
Second, the research area was confined to a riverine township to isolate “farming scale” as the key experimental variable. This design enabled rigorous control over extraneous factors, minimizing variations in climatic conditions (e.g., temperature and precipitation) and external microplastic inputs (e.g., traffic emissions and atmospheric deposition). Sampling sites were selected through a two-stage process: (1) Pre-fieldwork analysis: In Jintang, GC town was prioritized due to documentary evidence of widespread plastic mulching—a primary source of farmland microplastics (MPs). (2) Field validation: Surveys revealed that plastic mulching practices were localized within GC town, potentially reflecting discrepancies between the reported and actual practices (e.g., farmer reluctance to disclose mulch use or to emphasize MP absence). Sampling sites were prioritized using field-verified data and selected based on two criteria: (1) documented long-term cultivation histories, and (2) reported plastic mulching practices (regular or intermittent), as confirmed through farmer surveys.
As a result, five more representative plots at GC town were selected, ranging from cooperatives to small-scale farmers (Figure 1). Plots boundaries followed the original agricultural field layout, and each plot had edge lengths of 100–150 m, with areas ranging from 1 to 1.5 hectares (ha). For each plot, two sites were chosen from diagonal quarters. At each site, three parallel samples were collected, and, to ensure accuracy, each parallel site was set at approximately 10 m apart from the others. As the soil MPs’ occurrence was found to be negatively correlated with the soil depth despite regular ploughing and the predominant distribution in topsoil [14,30,31], the sampling depth was set at 0~30 cm to identify the MPs’ occurrence in the topsoil and because it is also the most favorable depth in recent studies [32]. Sampling was conducted in November 2024. Approximately 2.5 kg of undisturbed surface agricultural soil was extracted using a stainless-steel shovel, and it was also collected in an aluminum foil bag for further characterization and analysis.
For analysis, we grouped the sites based on farming scale and land-use type. During our on-site survey, Site 4-2 was found to be contaminated with domestic waste, including disposable plastic bottles and waste bags. Given the potential influence of land use on the MP pollution, only the remaining nine sites were classified as “typical agricultural sites” (TA sites), while Site 4-2 was categorized separately as a “garbage dump site” (GD site). Then, among the TA sites, the sites in Plots 1 and 2 were classified as “agricultural cooperatives”, as “large-scale contractors” in Plots 3 and 4, and as “individual farmers” in Plot 5.
Information, including the latitude, longitude, crop type, the years under film mulching, plastic film residue collection, film mulching color, and types of irrigation, was collected via on-site survey, and the soil pH and organic carbon content were also analyzed. Detailed information is shown in Table S1.

2.2. Soil Microplastic Extraction

The soil samples were air-dried in the lab at room temperature for seven days. Additionally, the dried soil was then ground and sieved through a 2 mm steel mesh. Large, clearly visible plant roots and debris were removed, while microplastics ranging from 2-to-5 mm were stored separately, as shown in Figure 2a. For each batch of samples, one blank and two duplicates were prepared and analyzed. For each sample, 30 g of soil was placed in a 200 mL Erlenmeyer flask, and 50 mL of ZnCl2 solution (density = 1.6 g⋅cm⁻3) was added. To ensure thorough flotation mixing with the soil matrix and to release the microplastics from the soil aggregates, the samples were progressively applied with 5 min of glass rod stirring, 5 min of ultrasonic bath, and another 5 min of glass rod stirring. During the final stirring step, ZnCl2 solution was gradually added until it reached 2–3 mm below the bottle rim, as shown in Figure 2b.
Microplastics were collected twice from the supernatant in a 200 mL Erlenmeyer flask. The first collection occurred after 24 h (as shown in Figure 2c), during which the supernatant was carefully poured along the rotating bottle rim into a separate 100 mL Erlenmeyer flask. The remaining soil mixture was then stirred and gradually refilled with ZnCl2 solution to its original rim level. After another 24 h, the supernatant was, again, collected into a 100 mL flask. It was crucial to keep the total poured supernatant volume just below the rim of the 100 mL Erlenmeyer flask, ideally 2–3 mm below, to allow for easy pouring out after another sink-float separation.
After an additional 3–6 h, the final supernatant was poured through a pre-rinsed 10 μm mesh and a 10 cm stainless steel sieve, which had been pre-washed with diluted hydrochloric acid (HCl) (pH of 2–3).
Materials retained on the sieve were washed with HCl to remove ZnCl2, followed by rinsing with distilled water until a pH of 7 was reached, as verified by a pH test strip. The washed materials were then flushed into a 250 mL breaker using distilled water. As shown in Figure 2e, approximately 20 mL of 30% H2O2 solution and 10 mL of FeSO₄ were added to digest the organic matter. Digestion was carried out at 40 °C for 48 h, with distilled water added during the first 30 min, if needed, to prevent vigorous boiling. Throughout the digestion process, H2O2 was supplemented as necessary based on the soil organic matter (SOM) level of the sample. After digestion, the solution was filtered through the sieve again, and the retained materials were first rinsed with HCl before being flushed down with ZnCl2 into 100 mL Erlenmeyer flasks. As the materials’ densities would change again, the MPs and unwanted impurities could be further separated in a final flotation. The supernatant was then vacuum-filtered, and the extracted microplastics were collected onto an MCE membrane, as shown in Figure 2f.

2.3. Characterization of Extracted MPs

For each air-dried membrane, five 4 mm × 4 mm squares—one at the center and one each at the top, right, bottom, and left of the effective filtration area—were designated for characterization, considering the potential uneven distribution of microplastics. Renishaw inVia™ confocal Raman microspectroscopy (Renishaw, London, UK) was operated under 785 nm laser excitation. First, a Live Track montage using a 20× objective lens was utilized to capture a white light image of each square, as shown in Figure 3b. Then, a 50× objective lens was used to focus the beam on every particle larger than 20 µm, scanning the spectral range from 150-to-3200 cm⁻1. Specifically, the 600–2000 cm⁻1 range was considered as the fingerprint spectral region.
The raw Raman spectra of the detected particles were further processed by subtracting the baseline and comparing them with the reference spectra from a polymer library to identify polymer types. A screening threshold of 0.70 was set for full-range spectral similarity. For the particles that were only partially present in the designated square, the “valid count” was determined as the proportion of the particle’s area within the square relative to its total area. Once identified as microplastics, each particle’s color, shape, and type were recorded, and their sizes were calculated based on their coordinates.

2.4. Risk Assessment

Biological toxicity was first assessed using three indices [26] (which were calculated using the formulas presented below): the polymer-based pollution load index (pPLI), the polymer risk indices (pRi), and the polymer ecological risks index (pERI).
p P L I i = P i / P b ,
p R i i = P j P i × S j ,
p E R I i = p R i i × p P L I i 2
In Equation (1), p P L I i is the polymer-based pollution load index for the sampling Site I, and “ P i ” and “ P b ” are, respectively, the MP abundances of sampling Site I and those from the background reference (which, in this case, is a concentration of 540 n/kg as this was deemed safe for organisms estimated by a mathematical model [33] that was used as P b abundance). A high value of the pPLI (polymer-based pollution load index) corresponds to a high numerical abundance of microplastics (MPs) and reflects a significant pollution load of MPs.
In Equation (2), p R i i represents the polymer risk indices of sampling Site I, “ P j ” indicates an abundance of polymer j at the sampling Site I, and“ S j ”is the monomer-based toxicity score of polymer j, the coefficient of which incorporates the classification of monomers—which are polymerized into the final plastics—based on their mutagenic and/or carcinogenic hazard levels [34]. As a result, the p E R I i in Equation (3) calculates the polymer ecological risks index at sampling Site I.
The methods detailed above were used to consider the elements of the MPs’ numerical counts (abundance) and chemical composition. However, smaller MPs cause more severe toxicity to human health [35]. Therefore, the size-considered p P L I , p R i , and p E R I , respectively, which are denoted as p P L I s , p R i s , and p E R I s , were further calculated. Each identified MP particle was counted in a “size coefficient” × “valid count” equation rather than simply by its presence as a “valid count”. The size coefficient (K) of each MP particle was calculated as in Equation (4).
K m = r m μ σ .
Here, K m represents the size coefficient of the particle m in numerical counting, which indicates the degree to which the size of particle m deviated from the average level across all of the sample particles [36], where r m is the size of particle m , μ is the means of the detected MP particle sizes in all of the samples, and σ is the standard deviation of the size distribution data of the particles in all of the samples.

2.5. Analysis

SPSS 26.0 was used to perform statistical analyses. An independent samples t-test was used to compare the abundances across scales and to assess the differences in outcomes between size-inclusive and size-excluded risk assessment methods. The Chi-square test was applied to compare the categorical variables; specifically, the distribution of MPs across the shape, color, and size categories. Pearson correlation analysis was performed to assess the associations. Monte Carlo simulation, which can achieve more accurate analysis results with less sample data [37], was performed to evaluate the variability and uncertainty inherent in the risk estimations. The significance level was set at 0.05, corresponding to a 95% confidence level. Microsoft Excel from Office 365 and Origin 2024 were used to plot figures. ArcGIS 9.2 was used to draw a sampling interval map based on the longitude and latitude data collected by GPS.

3. Results

3.1. MP Abundances and Variation

All of the sites were detected as having MPs, as displayed in Figure 4a. Across the TA sites, the MP abundances did not differ significantly, and the abundances ranged from 5364.17 to 57127.07 n/kg, with an average of 19,696.81 ± 13,226.89. Regarding the variation of the MPs, the measured SOC and MPs did not exhibit correlation, but the soil dissolved carbon (DOC) was significantly negatively correlated with the soil MP abundances, as shown in Figure S1. Notably, the GD site (4-2) hit a significantly higher level (p < 0.05) than the TA sites as shown in Figure 4b, and it averaged at 117,464.59 ± 47,673.32 n⋅kg−1. As shown in Figure 5a, when grouped by farming scale, the TA sites of agricultural cooperatives showed significantly higher MP abundances than smallholder sites (p < 0.05), and scales with higher MPs abundance also exhibited lower pH (Figure 5b) and DOC (Figure 5c).

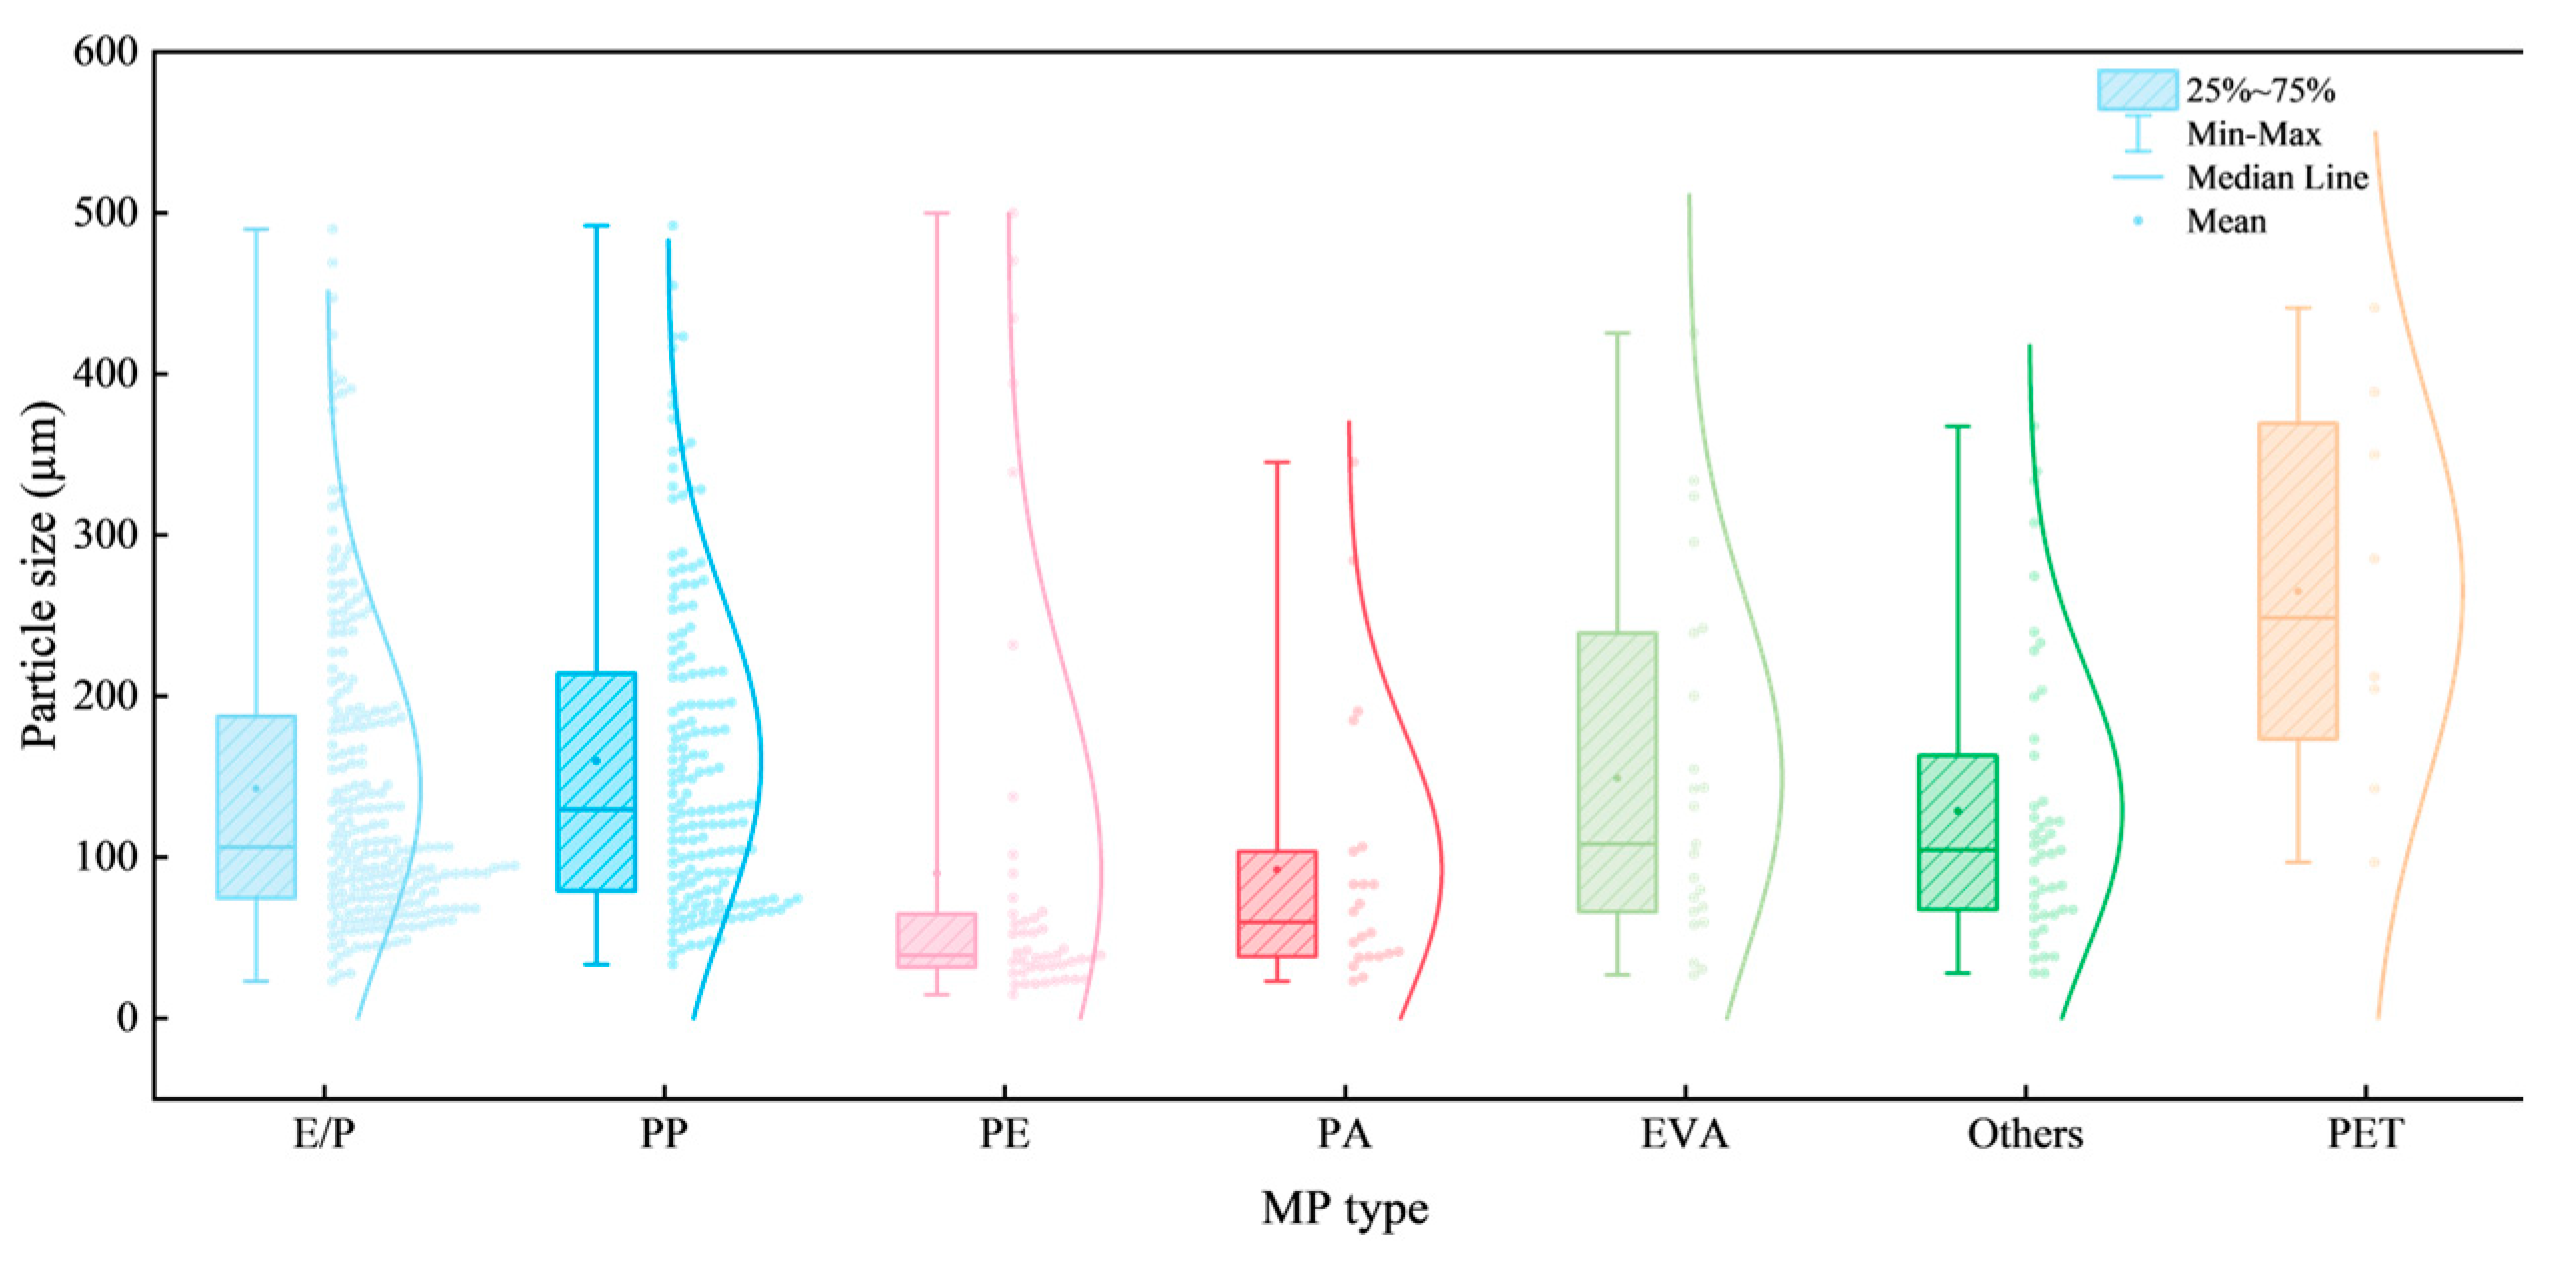
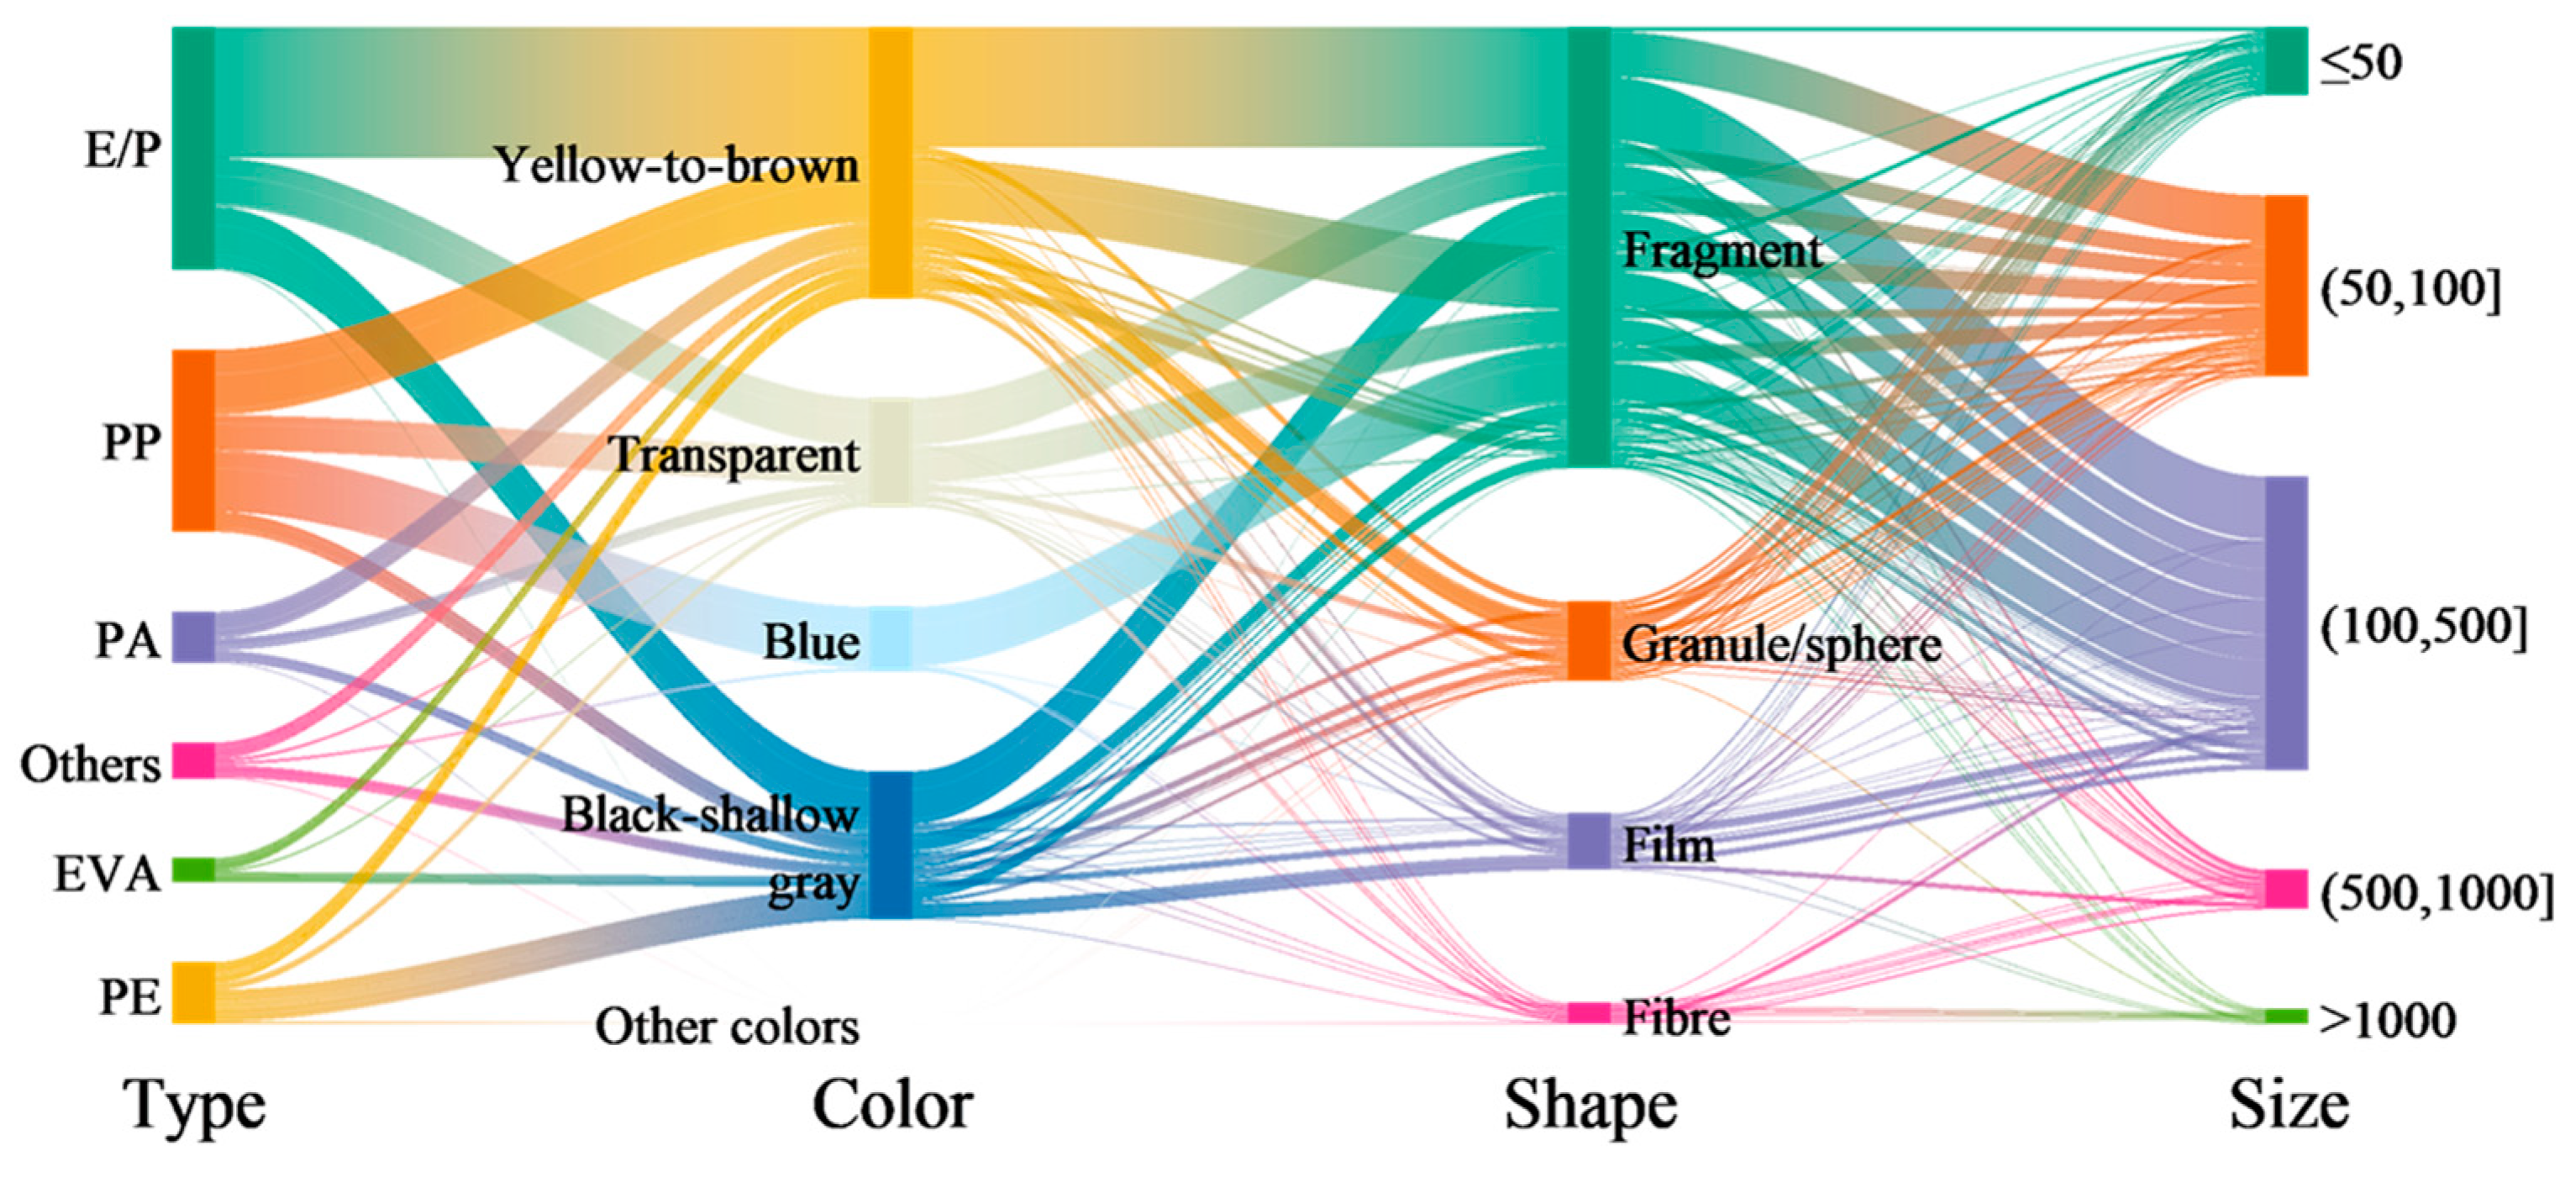
3.2. Chemical and Physical Characteristics

The top three most abundant polymer types identified in the MP samples were E/P, PP, and PE, which accounted for more than 80% of the total. These were followed by PA, EVA, and PET. Figure 6 shows the fingerprint region of the MPs identified in our samples and the standard polymer spectrum provided by a commercial library. Other polymers, including PPS and PS, were categorized as “the others” for statistical analysis, accounting for 4.42% of the total. Significant variation in the chemical composition of the MPs was observed among the sites of different farming scales (p < 0.05). As shown in Figure 7, Individual farmer sites contained less E/P but more EVA compared to the other two scales, and they also had a higher proportion of PA than large-scale contractor sites (Figure 8, Figure 9 and Figure 10).
We recorded the physical characteristics of each microplastic (MP), categorizing them into four shapes (fragment, granule/sphere, film, and fiber) and seven colors (yellow-to-brown, gray, blue, black, white, red, and transparent). We also measured their sizes using coordinate data. As shown in Figure 8, colors were primarily yellow-to-brown (44.84%) and black gray (24.78%), with transparent (18.58%) and blue (10.92%) MPs also prevalent. As shown in Figure 9, fragments dominated (74.11%), followed by granules/spheres (13.79%). As shown in Figure 10, soil microplastics (MPs) of all polymer types exhibited a size distribution skewed toward smaller particle, a pattern also found in previous studies (Table 1). MPs size averaged at 346.84 μm, and as shown in Figure 11, over 90% of MPs were <500 μm, Chi-square tests revealed significant color/shape variations across the farming scales (p < 0.05). Although the size distribution variations among the different scales were not significant, they were significant among polymer types (p < 0.05). The distribution of soil microplastics (MPs) across distinct characteristic categories was mapped in Figure 12.

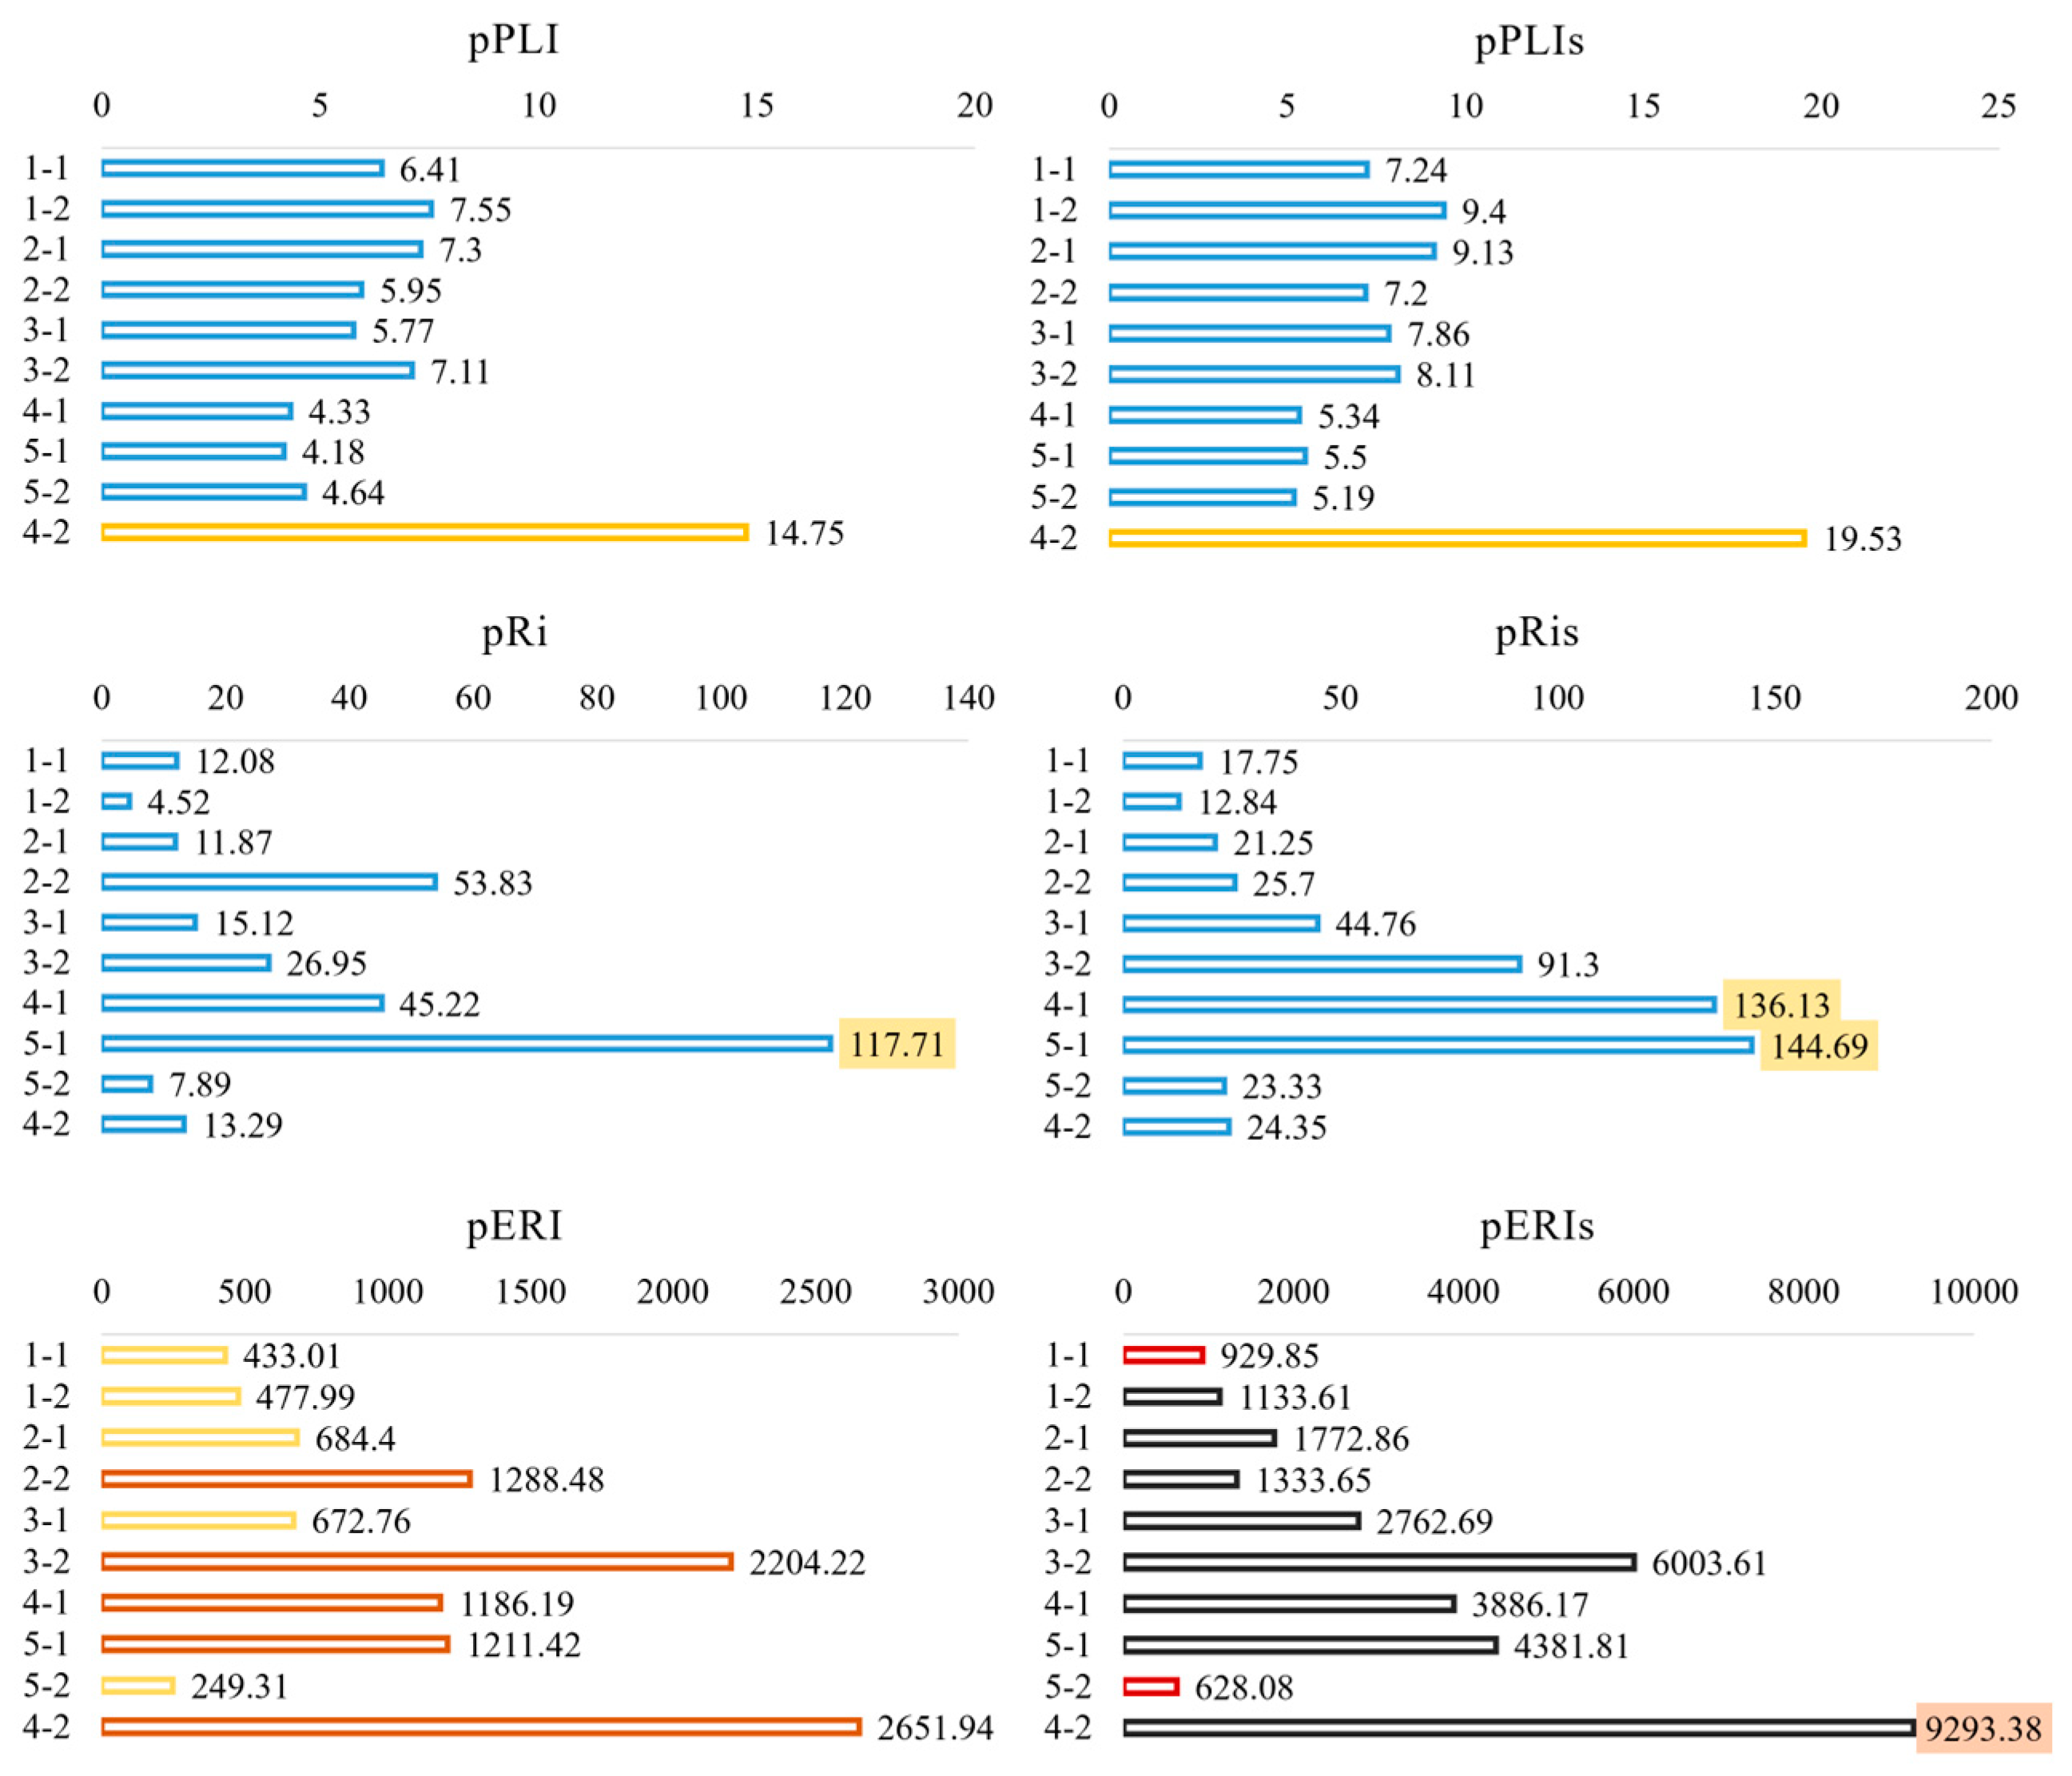
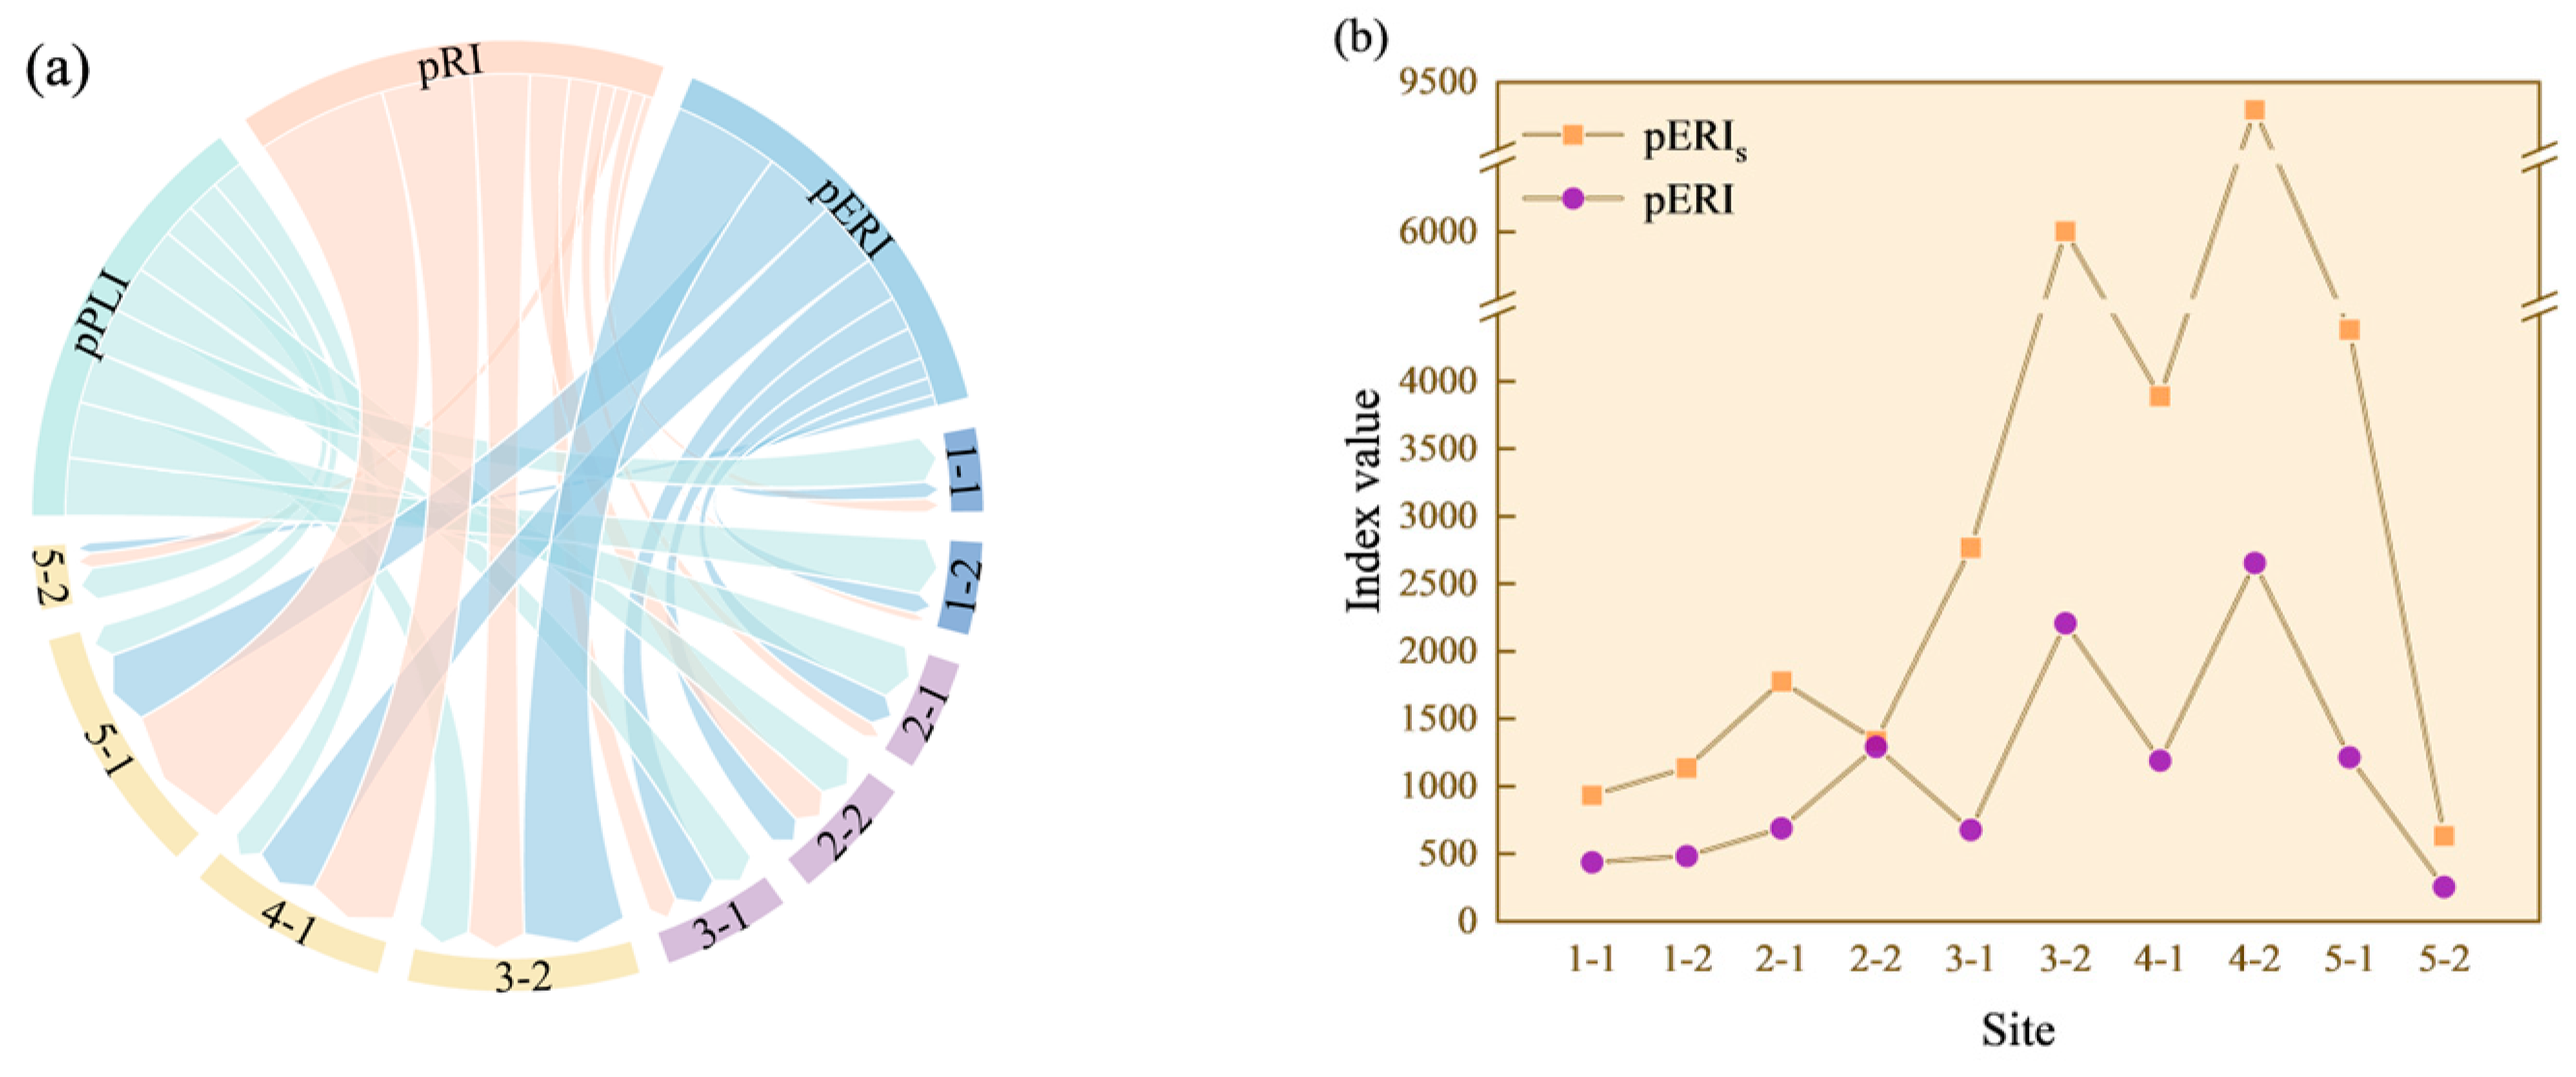
3.3. Risk Assessments and Comparisons

Six risk indices—pPLI, pRi, pERI, and their size-inclusive counterparts—were classified using hazard level criteria [26]. Ecological risk assessments were focused on the MPs of E/P, PP, PE, EVA, PET, PA, PPS, and PS; less common MPs were excluded due to insufficient toxicity data. From the formulas of these indices, it could be seen that the physical meaning were MP abundances (pPLI); the polymer compositions in MP and the monomers’ toxicities of these polymers (pRi); and the integration of MP abundances, polymer compositions, and the monomers’ toxicities (pERI). Meanwhile, for pRis, pPLIs, pERIs, and their size-exclusive counterparts, further accounted risk variation were caused by size distribution.
As shown in Figure 13, in the size-exclusive assessments, pPLI showed a low hazard level across TA sites and a medium hazard level at the GD site; pRi elevated Site 5-1 near the threshold value of a medium hazard (150); and, finally, pERI resulted in a higher hazard level for all sites, specifically elevating Sites 2-2, 3-2, 4-1, and 4-2 to a ‘high’ risk level. Size-inclusive assessments amplified the index values, pushing Site 4-2 near the “very high” threshold (10,000). For the calculation of pERI—considering the uncertainties that may arise from the variability in occurrence, as well as the size composition of these MPs—ecological risk was reconfirmed through Monte Carlo simulation. The results from Monte Carlo simulation were similar to our original output, as shown in Table S4. In addition, as shown in Figure 14, the sensitivity analysis identified PA and E/P as the most influential factors.
The sequential integration of the MP abundances, chemical composition, and monomer toxicity in the pPLI, pRi, and pERI indices introduced score disparities, precluding direct numerical comparisons. The spatial distribution of the risks assessed by these three indices could be seen in Figure 15a, and the result of Chi-square test showed that there was significant difference between these distribution patterns. As shown in Figure S4, from pPLI(to pRI and) to pERI, the site contributions varied: unchanged for Sites 2-2, 3-1, and 4-1; fluctuated for Site 5-1; increased for Site 3-2; and decreased for Sites 1-1, 1-2, and 5-2. The “size coefficient” that was calculated for p P L I s , p R i s , and p E R I s was clustered near 1, enabling a value comparison for the size-inclusive and size-exclusive index results. Size-inclusive improved the index values (Figure 15b), and as seen in Figure 16, the paired t-test analysis confirmed that such increases reached significance for pERI (p < 0.05), highlighting the risk originating from smaller particles.
We also conducted an analysis over the contribution from the polymer types to the risk index values. It was revealed that even trace quantities of high-toxicity polymers (e.g., PA and PPS) disproportionately increased the risks. As shown in Figure 17a, where the PPS contributed just over 2% to the average of abundance-based pPLI, contributed nearly half to the average pRi and pRis. The small pink area in the radar chart contrasts sharply with the large blue area, highlighting this disparity in contribution. PA contribution could also be seen in the size-inclusion effect on the index values as it tended to degrade into smaller particles, as has been previously analyzed. The pERI value was also affected by PA occurrence. As shown in Figure 15b, Plot 3, Plot 4, and Site 5-1, which contained a greater abundance in PA MPs, also experienced a stronger size-rescaling effect and exhibited a larger increase from pERI to pERIs.

4. Discussion

4.1. MP Pollution Load and Distribution

The GD site exhibited high microplastic (MP) abundance (comparable to informal landfill soils) at ~103,080 n/kg [47], contrasting sharply with the formal waste treatment centers at 820 n/kg [48], where stringent management reduced the contamination. This disparity implicates waste mismanagement—not facility presence—as the primary driver for elevated MPs.
The MP abundances at TA sites was higher than has been recorded in most previously studied agricultural soils, as shown in Table 1, and the only comparable to results to the current ones are from one mulching open field [38]. The methodological approach and study location likely contributed to the observed differences. Sonication pretreatment effectively released aggregate-bound MPs, while a higher flotation density (1.5 g/mL) enhanced the recovery of heavier MPs (e.g., PET and PVC). In contrast, preliminary trials using NaCl (1.2 g/mL) yielded minimal MPs, likely due to the biofilm-induced density increasing the overriding buoyancy [49]. Furthermore, we adopted wet sieving to separate the supernatants. This operation was reported to result in less material loss than vacuum filtration [50], the latter of which has been used by most studies and is summarized in Table 1. In addition, the glass fiber or mixed cellulose-ester commonly used on filtering devices for MP collection in many studies, and which are presented in Table 1, are both not resistant to sonication. Since only simple water rinsing was practical, a large proportion of MPs could have potentially remained on the membrane. Raman spectroscopy (at 1 μm resolution) coupled with a 10 μm sieving enabled the detection of MPs ≥20 μm, capturing smaller particles frequently overlooked elsewhere. The specific location of the study area in this study also inherently rendered higher MP abundances. Western China, where Jintang is located, has been reported to have higher microplastic abundances in agricultural soils compared to eastern China [51]. The agriculture of provinces in western China relies more heavily on plastic membrane mulching as, in this region, temperatures drop significantly in winter. These findings underscore the need for targeted monitoring in regions with high agricultural plastic dependency.
Soil organic carbon (SOC) has been previously reported to be positively correlated with MP sorption onto soil [20], and this association was also exhibited in our study, possibly due to the fact that the MPs themselves were disguised as SOC in measurement [52]. The decreases in DOC with higher MPs are in line with the report that MP addition results in the π-π conjugation of DOC and MPs [53] and the reduced C in soil dissolved matter [54]. Although the MPs found in this study were mostly conventional plastic type and resistant to biodegradation, these MPs could still impact the DOC by affecting the pH [55]. In our study, the pH levels were negatively correlated with the MPs, as shown in Figure S1 (p < 0.05). This, in turn, could modulate the labile carbon decomposition by enriching the related functional genes and enhanced related enzyme activities [53].

4.2. Sources and Hazards of Farmland MPs

The mulching film of E/P, PP, and PE have been widely used in agriculture [56], and their predominancy in soil MPs have also been shown in other studies, as summarized in Table 1, thus suggesting that plastic mulching is the primary source of farmland soil MPs. PET and PA MPs, enriched in smallholder plots near residential zones, likely originate from textile-derived gray water irrigation [57,58]. EVA, though less commonly used for agricultural mulching than PP and PE, is also employed in agricultural mulching, and it is more environmentally friendly due to being biodegradable [59]. The relatively lower proportion of EVA compared to traditional PP and PE suggests that, at least in Sichuan, biodegradable plastics have not been widely adopted and require further promotion. PPS occurrence was likely due to the intensive nearby fishing activities as this material is utilized in technical textile products [60]. PS (polystyrene) is commonly used in construction materials and can appear in the environment as the MPs accumulate through the breakdown or abrasion of primary plastic products. In this study, larger-size (>2 mm) plastics were separately collected, among which PE, PET, E/P, PP, and EVA were identified. PPS and PS, as well as other MP polymers detected only in smaller sizes (<2 mm), were assumed not to originate from mulching films or from on-site activities. Their detection is more likely related to other soil stressors, such as occasional careless littering of corresponding plastic materials or the atmospheric deposition of MPs from external sources.
Regarding morphology, black and white MPs—which were likely derived from on-site mulching films, with color choice (black for soil warming and white for cooling)—are tailored to crop needs [61]. The low fibrous MP abundance found contrasts with prior studies, potentially due to vertical mobility [62] and methodological losses (e.g., sieving artifacts from narrow fiber widths). The MPs predominantly displayed weathered morphologies (cracked and rugged) and color gradients (e.g., blue-to-transparent; Figure 18e and Figure 19f), with yellow/gray hues and opacity linked to environmental oxidation [63]. This pattern reflected conventional plastics’ non-biodegradability and progressive fragmentation over time [36]. Small size dominance also indicated that higher MP abundances may be due to prolonged degradation rather than mulching intensity.
Degraded MPs pose two additional risks due to their additives leaching and their evolution toward small-size particles. While additives (plasticizers and pigments) give plastics durability and flexibility, these compounds—which are physically blended, not chemically bonded [64]—leach during degradation, and these additives then accumulate in soil organisms as toxicants (e.g., BFRs and phthalates) [65] that impair their survival and growth [66]. MP additives—which are known endocrine disruptors and carcinogens—also pose escalating human health risks via food chain amplification, with studies showing >7-fold accumulation from soil to worms and poultry [67]. The sole occurrence of smaller MPs indicates the original plastics have undergone mechanical abrasion and biochemical degradation, potentially causing more additives to leach into the environment. Small MP particles could also enter animal organs through inhalation and digestion, impairing physiological functions [68]. In the farmland of root crops, MPs could attach to and accumulate on the surfaces of the edible roots [69]. Moreover, due to their higher specific surface area, smaller MPs’ high surface areas enhance the adsorption of pollutants (e.g., heavy metals and pesticides) at levels of 100–1000× ambient concentrations, motivating these soil pollutants and exacerbating combined toxicity [70,71]. Also, small MPs provide more niche sites for soil microorganism, thus altering community richness and diversity more significantly [72].

4.3. MP Occurrences Varying Across Farming Scales

A previous study [73] has suggested that exogenous inputs, such as organic fertilization, traffic-related MPs, and careless plastic waste disposal on smallholder farms, contribute to higher MP levels, and large-scale farming benefits from more systematic and regulated practices, suffering less MP pollution. However, our study observed elevated MPs in large-scale cooperatives (Figure 5b), which was found to be connected to intensive, long-term plastic mulching [39,51]. Smallholders reported minimal mulching use, prioritizing non-agricultural income; thus, the residual large plastic particles at their sites likely originated from residential plastic disposal. Agricultural cooperatives exhibited higher MPs alongside lower pH and dissolved organic carbon (DOC), as shown in Figure 5b, aligning with the MP–pH–DOC interactions in our above analysis.
The polymer diversity and morphological differences in the farmland MPs across farming scales also suggest distinct sources pathways and degradation status [65]. For example, the PP and E/P commonly used for mulching plastics were more abundant in the plots of a larger farming scale, highlighting the major roles of mulching activities in these sites. In contrast, there was a higher proportion of PA in smaller-scale sites. Considering PA was associated with gray water, as analyzed above, this variation could result from the intensity of domestic activities around plots of different scales. The investigated agricultural cooperative plots were located at designated farming areas with little residential activity nearby; in contrast, plots of other two scales, especially individual farmer plots, were closer to or even intersected by the residence area. At large-scale farming sites, MPs smaller than 250 µm and 1000 µm were 2.15% and 2.52% more abundant than at agricultural cooperative sites, though the difference was not statistically significant. Large-scale farmers reported rarely collecting plastic mulching film waste. Instead, they intentionally left the films in the soil between crop rotations until the films completely disintegrated. Degradation shifted the size distribution toward smaller particles, while repeated wet–dry cycles accelerated additive leaching [74] and enhanced vertical MP migration [75].

4.4. Index-Dependent Ecological Risks and Major Contributors

The spatial variations in the risk distribution under different indices highlight that the MP-induced toxicity varied geographically, even when the pollution loads were comparable. The size-dependent inclusion effect reflects the elevated risks posed by smaller microplastics, and it is attributable to their size-specific environmental behavior (e.g., bioavailability and mobility). However, most studies were constrained by coarse size classifications and insufficiently resolved the size data [76], therefore, their risk assessments have narrowly focused on MP abundances alone or have combined abundance-chemical composition metrics. Such oversights may lead to spatial inaccuracies and systemic underestimation of risk levels. These limitations underscore the necessity for comprehensive monitoring protocols that integrate precise size-specific data with concurrent analyses of physical (e.g., size and shape) and chemical (e.g., polymer type and additives) properties to ensure the robust quantification of MP-related risks.
PPS and PA were identified as major contributors to the risk index values, with PA additionally recognized as one of the most sensitive factors in the risk assessments, justifying their classification as priority pollutants. PA, in particular, exhibited a higher monomer-derived hazard score compared to E/P, PP, and PE [34], and its associated risks intensified as the polymer degraded. As illustrated in Figure 10, the PA MPs displayed a size distribution skewed toward smaller particles, which is likely attributable to progressive degradation. Being a hygroscopic thermoplastic [77] and UV-sensitive polymer [78], PA undergoes accelerated physical degradation in soil under high humidity and sunlight, fragmenting into smaller particles compared to other polymers. Notably, as discussed in the previous chapter, PPS and PA MPs were linked to the non-mulching agricultural practices (e.g., irrigation tubing and seed coatings) prevalent in small-scale farming systems. This suggests that, while plastic mulching films remain the dominant source of soil MPs, their ecological risk contribution may be outweighed by the MPs originating from non-mulching activities, particularly those involving polymers, like PA, which degrade into higher-risk smaller particles.

4.5. MP Management Strategies

Scale-dependent heterogeneity in microplastic characteristics—driven by agricultural practices and external inputs—informs region-specific mitigation strategies. In high-intensity agricultural zones (TA areas), plastic mulching remains the dominant source of contamination, particularly under elevated pollution levels, thus confirming its status as the primary contributor to farmland MPs. This underscores the urgency of prioritizing mulching-related mitigation measures. However, in the smallholder farming systems within TA areas, mismanaged waste introduces toxic MPs into soils due to the higher fragmentation rates and bioavailability of smaller particles. Consequently, these sites require targeted waste management protocols and enhanced monitoring. Given that smallholder farming dominates agriculture in Sichuan and rural China broadly, control measures against MP pollution should allocate equal or greater emphasis to regulating diffuse non-mulching sources alongside conventional mulching management.
Biodegradable mulching plastics are yet to be widely applied. The availability of raw materials—and the consumer knowledge of their benefits—are also crucial for the success of this biodegradable initiative [79]. Addressing these multifaceted challenges requires policy interventions that integrate subsidies, supply chain optimization, and farmer education programs to accelerate the transition to a sustainable alternative.

5. Conclusions

This study examined the characteristics of microplastic (MP) pollution in typical agricultural soils. Overall, microplastics (MPs) were ubiquitously detected, with an average concentration of 19,696.81 ± 13,226.89 n/kg. The soil MPs were predominantly found as fragments (74.11%), followed by granules/spheres (13.79%), with a color of yellow to brown (44.84%) and black to light gray (24.78%). Small-sized particles dominated, and MPs smaller than 500 µm accounted for 91.23% of the total. It was validated that the characteristics of soil MP pollution varied across different farming scales. At larger farming sites, plastic mulching was the primary sources of MPs; meanwhile, at the sites of a smaller farming scale, poor waste treatment was found to exacerbate soil MP pollution. Most sites were evaluated as high risk when using our size-modified method. Risk assessments under different indices varied in value and distribution. PA and PPS were assigned as the major contributor to MP risk.
In this study, the MP occurrence in farmlands exhibited variation across farming scales, and the MP risks showed disproportionately high contribution by certain polymers. This confirms that environmental management should differentiate source control measures depending on the farming scales and that the focus should be on priority polymers. “Size” matters in risk assessments; however, previous research has largely neglected this parameter and might have underestimated the risk. Future effort should be placed on more precise measurements of MP size, and these measurements should be integrated into risk assessments.

5.1. Environmental Implication

This study has provided direct evidence of the variations in microplastic characteristics across farmlands of different scales, and it has also speculated their varying MP sources. When considering the influence of small-sized particles, the ecological risk posed by microplastics in farmlands is notably high. The findings offer novel insights for refining strategies to manage and mitigate microplastic pollution, thereby supporting the development of more effective environmental governance policies.

5.2. Limitations and Future Directions

While this study advances microplastic understanding and policy insights, key limitations remain.
(1)
Composition-Driven Uncertainties: variability in microplastic chemical composition (e.g., monomer toxicity and fragmentation rates) introduces uncertainties in soil risk assessments. Future work should prioritize critical polymers and integrate sensitivity factors (e.g., degradation rates) to refine risk models.
(2)
Sampling Representativeness: samples were targeted to areas with high microplastic contamination likelihood using literature and field data. Broader geographic sampling and larger sample sizes would strengthen generalizability.
(3)
Indirect Source Attribution: pollution sources were inferred from microplastic properties and site data. Future research could further verify the linkages by the direct comparative analysis (e.g., polymer fingerprinting) between soil microplastics and suspected sources.

Supplementary Materials

The following supporting information can be downloaded at: https://www.mdpi.com/article/10.3390/su17083516/s1; Supplementary Materials for Microplastics in Typical Mulched Agricultural Soils: Characteristics Varying across Farming Scales and Risk Significantly Contributed by Priority Polymers [80,81,82,83,84,85,86,87,88,89,90].

Author Contributions

Conceptualization, Y.W. and S.L.; methodology, Y.Z., L.Z. and S.L.; software, H.L. and J.H.; validation, Y.Z. and J.H.; formal analysis, C.G. and Y.Z.; investigation, C.G. and G.X.; resources, L.Z. and Y.Z.; data curation, H.L.; writing—original draft preparation, Y.Z. and C.G.; writing—review and editing, Y.W. and J.H.; visualization, Y.Z. and J.H.; supervision, Y.W.; project administration, Y.W. and Y.Z.; funding acquisition, Y.W. and S.L. All authors have read and agreed to the published version of the manuscript.

Funding

This study was financially supported by the Basic Research Expenses for Scientific Research Institutes (2024JDKY001 and 2025JDKY0019); the Sichuan Provincial Natural Science Foundation Project (General Program) (2024NSFSC0126); and the Science and Technology Innovation Project of the Sichuan Academy of Eco-Environmental Sciences (No. ZX-2023106).

Institutional Review Board Statement

Not applicable.

Informed Consent Statement

Not applicable.

Data Availability Statement

The raw data supporting the conclusions of this article will be made available by the authors upon request.

Conflicts of Interest

The authors declare no conflicts of interest.

References

  1. Adomat, Y.; Grischek, T. Sampling and processing methods of microplastics in river sediments—A review. Sci. Total Environ. 2021, 758, 143691. [Google Scholar] [CrossRef]
  2. Zhang, Y.; Kang, S.; Allen, S.; Allen, D.; Gao, T.; Sillanpää, M. Atmospheric microplastics: A review on current status and perspectives. Earth-Sci. Rev. 2020, 203, 103118. [Google Scholar] [CrossRef]
  3. Yang, L.; Zhang, Y.; Kang, S.; Wang, Z.; Wu, C. Microplastics in soil: A review on methods, occurrence, sources, and potential risk. Sci. Total Environ. 2021, 780, 146546. [Google Scholar] [CrossRef] [PubMed]
  4. Ya, H.; Jiang, B.; Xing, Y.; Zhang, T.; Lv, M.; Wang, X. Recent advances on ecological effects of microplastics on soil environment. Sci. Total Environ. 2021, 798, 149338. [Google Scholar] [CrossRef]
  5. An, Q.; Zhen, Z.; Zhong, N.; Qiu, D.; Xie, Y.; Yan, C. Effects of biodegradable microplastics on arsenic migration and transformation in paddy soils: A comparative analysis with conventional microplastics. J. Hazard. Mater. 2024, 469, 134053. [Google Scholar] [CrossRef]
  6. Jiang, X.; Wang, T.; Jiang, M.; Xu, M.; Yu, Y.; Guo, B.; Chen, D.; Hu, S.; Jiang, J.; Zhang, Y.; et al. Assessment of Plastic Stocks and Flows in China: 1978–2017. Resour. Conserv. Recycl. 2020, 161, 104969. [Google Scholar] [CrossRef]
  7. Ding, L.; Zhang, S.; Wang, X.; Yang, X.; Zhang, C.; Qi, Y.; Guo, X. The occurrence and distribution characteristics of microplastics in the agricultural soils of Shaanxi Province, in north-western China. Sci. Total Environ. 2020, 720, 137525. [Google Scholar] [CrossRef] [PubMed]
  8. Miao, H.; Zhang, S.; Gao, W.; Zhou, J.; Cai, H.; Wu, L.; Liu, J.; Wang, Z.; Liu, T. Microplastics occurrence and distribution characteristics in mulched agricultural soils of Guizhou province. Sci. Rep. 2024, 14, 21505. [Google Scholar] [CrossRef]
  9. Zhang, J.; Zou, G.; Wang, X.; Ding, W.; Xu, L.; Liu, B.; Mu, Y.; Zhu, X.; Song, L.; Chen, Y. Exploring the Occurrence Characteristics of Microplastics in Typical Maize Farmland Soils With Long-Term Plastic Film Mulching in Northern China. Front. Mar. Sci. 2021, 8, 800087. [Google Scholar] [CrossRef]
  10. Ye, C.; Lin, J.; Li, Z.G.; Wang, G.H.; Li, Z.L. Characteristics of Microplastic Pollution in Agricultural Soils in Xiangtan, China. Sustainability 2024, 16, 7254. [Google Scholar] [CrossRef]
  11. Jia, Z.F.; Wei, W.; Wang, Y.H.; Chang, Y.J.; Lei, R.; Che, Y.H. Occurrence characteristics and risk assessment of microplastics in agricultural soils in the loess hilly gully area of Yan’ an, China. Sci. Total Environ. 2024, 912, 169627. [Google Scholar] [CrossRef]
  12. Chen, Y.; Leng, Y.; Liu, X.; Wang, J. Microplastic pollution in vegetable farmlands of suburb Wuhan, central China. Environ. Pollut. 2020, 257, 113449. [Google Scholar] [CrossRef]
  13. Medyńska-Juraszek, A.; Szczepańska, A. Microplastic Pollution in EU Farmland Soils: Preliminary Findings from Agricultural Soils (Southwestern Poland). Agriculture 2023, 13, 1733. [Google Scholar] [CrossRef]
  14. Harms, I.K.; Diekötter, T.; Troegel, S.; Lenz, M. Amount, distribution and composition of large microplastics in typical agricultural soils in Northern Germany. Sci. Total Environ. 2021, 758, 143615. [Google Scholar] [CrossRef]
  15. Palazot, M.; Soccalingame, L.; Froger, C.; Jolivet, C.; Bispo, A.; Kedzierski, M.; Bruzaud, S. First national reference of microplastic contamination of French soils. Sci. Total Environ. 2024, 918, 170564. [Google Scholar] [CrossRef] [PubMed]
  16. Jin, T.; Tang, J.; Lyu, H.; Wang, L.; Gillmore, A.B.; Schaeffer, S.M. Activities of Microplastics (MPs) in Agricultural Soil: A Review of MPs Pollution from the Perspective of Agricultural Ecosystems. J. Agric. Food Chem. 2022, 70, 4182–4201. [Google Scholar] [CrossRef]
  17. Zhang, X.; Li, Y.; Ouyang, D.; Lei, J.; Tan, Q.; Xie, L.; Li, Z.; Liu, T.; Xiao, Y.; Farooq, T.H.; et al. Systematical review of interactions between microplastics and microorganisms in the soil environment. J. Hazard. Mater. 2021, 418, 126288. [Google Scholar] [CrossRef] [PubMed]
  18. Tian, L.; Jinjin, C.; Ji, R.; Ma, Y.; Yu, X. Microplastics in agricultural soils: Sources, effects, and their fate. Curr. Opin. Environ. Sci. Health 2022, 25, 100311. [Google Scholar] [CrossRef]
  19. Wang, X.; Feng, Q.; Yang, L.; Li, M.; Zhao, F.; Tang, J.; Bu, Q.; Zhang, Y.; Chen, L. Effect of land use on occurrence and spatial variability of soil microplastics in agricultural watershed. Ecol. Front. 2025, 45, 497–506. [Google Scholar] [CrossRef]
  20. Luo, Y.; Zhang, Y.; Xu, Y.; Guo, X.; Zhu, L. Distribution characteristics and mechanism of microplastics mediated by soil physicochemical properties. Sci. Total Environ. 2020, 726, 138389. [Google Scholar] [CrossRef]
  21. Chen, X.; Lu, Z.; Heng, L.; Chappell, A.; Oshunsanya, S.O.; Adu-Gyamfi, J.; Liu, W.; Yu, H. The spatio-temporal variability of soil microplastic distribution and erosion-induced microplastic export under extreme rainfall event using sediment fingerprinting and 7Be in intensive agricultural catchment. J. Hazard. Mater. 2025, 488, 137378. [Google Scholar] [CrossRef] [PubMed]
  22. Kedzierski, M.; Cirederf-Boulant, D.; Palazot, M.; Yvin, M.; Bruzaud, S. Continents of plastics: An estimate of the stock of microplastics in agricultural soils. Sci. Total Environ. 2023, 880, 163294. [Google Scholar] [CrossRef]
  23. Yu, L.; Zhang, J.; Liu, Y.; Chen, L.; Tao, S.; Liu, W. Distribution characteristics of microplastics in agricultural soils from the largest vegetable production base in China. Sci. Total Environ. 2021, 756, 143860. [Google Scholar] [CrossRef]
  24. Deng, L.; Chen, L.; Zhao, J.J.; Wang, R.M. Comparative analysis on environmental and economic performance of agricultural cooperatives and smallholder farmers: The case of grape production in Hebei, China. PLoS ONE 2021, 16, e0245981. [Google Scholar] [CrossRef]
  25. Wang, Y.; Xv, X.; Shao, T.; He, Q.; Guo, Z.; Wang, Y.; Guo, Q.; Xing, B. A case on source to soil to solutions: Distribution characteristics of microplastics in farmland soil of the largest vegetable base in Northwest China. Sci. Total Environ. 2024, 907, 167910. [Google Scholar] [CrossRef] [PubMed]
  26. Yakub, A.S.; Bassey, B.O.; Bello, A.I.; Bello, B.O.; Olapoju, O.A.; Agwu, O.A.; Balogun, K.J.; Igbo, J.K.; Ajani, G.; Odedere, A.O.; et al. Eco-toxic Risk Assessment of microplastics in water and sediment across Nigeria Offshore, Gulf of Guinea. Environ. Monit. Assess. 2024, 196, 906. [Google Scholar] [CrossRef]
  27. Ren, S.; Kai, W.; Jinrui, Z.; Jingjing, L.; Hanyue, Z.; Ruimin, Q.; Wen, X.; Changrong, Y.; Xuejun, L.; Fusuo, Z.; et al. Potential sources and occurrence of macro-plastics and microplastics pollution in farmland soils: A typical case of China. Crit. Rev. Environ. Sci. Technol. 2024, 54, 533–556. [Google Scholar] [CrossRef]
  28. Ministry of Ecology and Environment, The People’s Republic of China. Letter of Reply to Proposal No. 01680 (Resources and Environment Category No. 122) of the Second Meeting of the 14th National Committee of the CPPCC. 2024. Available online: https://www.mee.gov.cn/xxgk2018/xxgk/xxgk13/202411/t20241125_1096649_wh.html (accessed on 12 April 2025).
  29. Liu, Y.; Liao, Q.; Shao, Z.; Gao, W.; Cao, J.; Chen, C.; Liao, G.; He, P.; Lin, Z. Spatial Distribution Characteristics and Influencing Factors of Cultivated Land Productivity in a Large City: Case Study of Chengdu, Sichuan, China. Land 2025, 14, 239. [Google Scholar] [CrossRef]
  30. Qiu, Y.; Zhou, S.; Zhang, C.; Chen, L.; Qin, W.; Zhang, Q. Vertical distribution and weathering characteristic of microplastics in soil profile of different land use types. Sci. Total Environ. 2023, 905, 166902. [Google Scholar] [CrossRef]
  31. Du, A.; Hu, C.; Wang, X.; Zhao, Y.; Xia, W.; Dai, X.; Wang, L.; Zhang, S. Experimental Study on the Migration and Distribution of Microplastics in Desert Farmland Soil Under Drip Irrigation. Environ. Toxicol. Chem. 2024, 43, 1250–1259. [Google Scholar] [CrossRef]
  32. Chia, R.W.; Lee, J.-Y.; Cha, J.; Rodríguez-Seijo, A. Methods of soil sampling for microplastic analysis: A review. Environ. Chem. Lett. 2024, 22, 227–238. [Google Scholar] [CrossRef]
  33. Everaert, G.; Van Cauwenberghe, L.; De Rijcke, M.; Koelmans, A.A.; Mees, J.; Vandegehuchte, M.; Janssen, C.R. Risk assessment of microplastics in the ocean: Modelling approach and first conclusions. Environ. Pollut. 2018, 242, 1930–1938. [Google Scholar] [CrossRef] [PubMed]
  34. Lithner, D.; Larsson, Å.; Dave, G. Environmental and health hazard ranking and assessment of plastic polymers based on chemical composition. Sci. Total Environ. 2011, 409, 3309–3324. [Google Scholar] [CrossRef]
  35. Wu, P.; Lin, S.; Cao, G.; Wu, J.; Jin, H.; Wang, C.; Wong, M.H.; Yang, Z.; Cai, Z. Absorption, distribution, metabolism, excretion and toxicity of microplastics in the human body and health implications. J. Hazard. Mater. 2022, 437, 129361. [Google Scholar] [CrossRef]
  36. Yuan, Z.; Nag, R.; Cummins, E. Ranking of potential hazards from microplastics polymers in the marine environment. J. Hazard. Mater. 2022, 429, 128399. [Google Scholar] [CrossRef] [PubMed]
  37. Panqing, Y.; Abliz, A.; Xiaoli, S.; Aisaiduli, H. Human health-risk assessment of heavy metal–contaminated soil based on Monte Carlo simulation. Sci. Rep. 2023, 13, 7033. [Google Scholar] [CrossRef]
  38. Qi, R.; Tang, Y.; Jones, D.L.; He, W.; Yan, C. Occurrence and characteristics of microplastics in soils from greenhouse and open-field cultivation using plastic mulch film. Sci. Total Environ. 2023, 905, 166935. [Google Scholar] [CrossRef]
  39. Sun, H.; Shi, Y.; Li, C.; He, S.; Bai, Y.; Zhao, P.; Qiu, D.; Liu, J.; He, S. Factors controlling the heavy metal ion activity in soil contaminated by microplastics with different mulch durations: Partial least squares path model. J. Hazard. Mater. 2024, 464, 133027. [Google Scholar] [CrossRef]
  40. Pan, J.; Zhang, Q.; Zhang, K.; Zhang, Z.; Guo, X. Occurrence of microplastics in agricultural soils in ecologically fragile areas of China. Sci. Total Environ. 2023, 904, 166350. [Google Scholar] [CrossRef]
  41. Bai, R.; Liu, H.; Cui, J.; Wu, Y.; Guo, X.; Liu, Q.; Liu, Q.; Gao, H.; Yan, C.; He, W. The characteristics and influencing factors of farmland soil microplastic in Hetao Irrigation District, China. J. Hazard. Mater. 2024, 465, 133472. [Google Scholar] [CrossRef]
  42. Liu, H.; Wang, X.; Shi, Q.; Liu, Y.; Lei, H.; Chen, Y. Microplastics in arid soils: Impact of different cropping systems (Altay, Xinjiang). Environ. Pollut. 2022, 303, 119162. [Google Scholar] [CrossRef] [PubMed]
  43. Liao, Y.-l.; Tang, Q.-x.; Yang, J.-y. Microplastic characteristics and microplastic-heavy metal synergistic contamination in agricultural soil under different cultivation modes in Chengdu, China. J. Hazard. Mater. 2023, 459, 132270. [Google Scholar] [CrossRef] [PubMed]
  44. Ye, Q.; Wu, Y.; Liu, X.; Wu, J.; Wu, P.; Wu, W. Microplastics abundance associated with farmland use types and the impact on soil microbial communities: A case study in Southern China. J. Hazard. Mater. 2024, 480, 136477. [Google Scholar] [CrossRef]
  45. Cao, L.; Wu, D.; Liu, P.; Hu, W.; Xu, L.; Sun, Y.; Wu, Q.; Tian, K.; Huang, B.; Yoon, S.J.; et al. Occurrence, distribution and affecting factors of microplastics in agricultural soils along the lower reaches of Yangtze River, China. Sci. Total Environ. 2021, 794, 148694. [Google Scholar] [CrossRef]
  46. Zhang, X.; Chen, Y.; Li, X.; Zhang, Y.; Gao, W.; Jiang, J.; Mo, A.; He, D. Size/shape-dependent migration of microplastics in agricultural soil under simulative and natural rainfall. Sci. Total Environ. 2022, 815, 152507. [Google Scholar] [CrossRef] [PubMed]
  47. Wan, Y.; Chen, X.; Liu, Q.; Hu, H.; Wu, C.; Xue, Q. Informal landfill contributes to the pollution of microplastics in the surrounding environment. Environ. Pollut. 2022, 293, 118586. [Google Scholar] [CrossRef]
  48. Liu, X.; Lin, H.; Xu, S.; Yan, Y.; Yu, R.; Hu, G. Occurrence, distribution, and characteristics of microplastics in agricultural soil around a solid waste treatment center in southeast China. J. Soils Sediments 2023, 23, 936–946. [Google Scholar] [CrossRef]
  49. Corcoran, P.L. Degradation of microplastics in the environment. In Handbook of Microplastics in the Environment; Springer: Berlin/Heidelberg, Germany, 2022; pp. 531–542. [Google Scholar]
  50. Nakajima, R.; Lindsay, D.J.; Tsuchiya, M.; Matsui, R.; Kitahashi, T.; Fujikura, K.; Fukushima, T. A small, stainless-steel sieve optimized for laboratory beaker-based extraction of microplastics from environmental samples. MethodsX 2019, 6, 1677–1682. [Google Scholar] [CrossRef]
  51. Qadeer, A.; Ajmal, Z.; Usman, M.; Zhao, X.; Chang, S. Agricultural plastic mulching as a potential key source of microplastic pollution in the terrestrial ecosystem and consequences. Resour. Conserv. Recycl. 2021, 175, 105855. [Google Scholar] [CrossRef]
  52. Rillig, M.C. Microplastic Disguising As Soil Carbon Storage. Environ. Sci. Technol. 2018, 52, 6079–6080. [Google Scholar] [CrossRef]
  53. Wang, J.; Song, M.; Lu, M.; Wang, C.; Zhu, C.; Dou, X. Insights into effects of conventional and biodegradable microplastics on organic carbon decomposition in different soil aggregates. Environ. Pollut. 2024, 359, 124751. [Google Scholar] [CrossRef]
  54. Li, R.; Xi, B.; Tan, W.; Yuan, Y. Spatiotemporal heterogeneous effects of microplastics input on soil dissolved organic matter (DOM) under field conditions. Sci. Total Environ. 2022, 847, 157605. [Google Scholar] [CrossRef]
  55. Wu, J.; Cao, X.; Zhang, T.; Ouyang, L. Effect of polyethylene microplastics on soil organic carbon pool dynamics in the soil-rhizosphere-alfalfa system. J. Environ. Chem. Eng. 2024, 12, 114724. [Google Scholar] [CrossRef]
  56. Zhang, S.; Wang, J.; Liu, X.; Qu, F.; Wang, X.; Wang, X.; Li, Y.; Sun, Y. Microplastics in the environment: A review of analytical methods, distribution, and biological effects. Trac-Trends Anal. Chem. 2019, 111, 62–72. [Google Scholar] [CrossRef]
  57. De Falco, F.; Di Pace, E.; Cocca, M.; Avella, M. The contribution of washing processes of synthetic clothes to microplastic pollution. Sci. Rep. 2019, 9, 6633. [Google Scholar] [CrossRef] [PubMed]
  58. Luo, J.; Jin, X.; Wang, Y.; Jin, P. Advanced Treatment of Laundry Wastewater by Electro-Hybrid Ozonation–Coagulation Process: Surfactant and Microplastic Removal and Mechanism. Water 2022, 14, 4138. [Google Scholar] [CrossRef]
  59. Zhang, Y.; Lan, Z.; Pang, K.; Zhou, Y.; Li, T. Experimental transmittance of eva and po film mulches. Eng. Agrícola 2024, 44. Available online: https://www.scielo.br/j/eagri/a/LJPqzL38R9kb4PcrYVLpNrC/ (accessed on 7 April 2025). [CrossRef]
  60. Olguner, B.; Mulayim, A.; Gunduz, S.K. Microplastic concentration in the sediment of the Istanbul Strait (the Sea of Marmara, Turkiye). J. Soils Sediments 2023, 23, 2892–2904. [Google Scholar] [CrossRef]
  61. Amare, G.; Desta, B. Coloured plastic mulches: Impact on soil properties and crop productivity. Chem. Biol. Technol. Agric. 2021, 8, 4. [Google Scholar] [CrossRef]
  62. Huang, F.; Liu, Z.; Li, Z.; Wang, B.; Zhang, P.; Jia, Z. Is biodegradable film an alternative to polyethylene plastic film for improving maize productivity in rainfed agricultural areas?—Evidence from field experiments. Agric. Water Manag. 2022, 272, 107868. [Google Scholar] [CrossRef]
  63. Sun, Y.; Yuan, J.; Zhou, T.; Zhao, Y.; Yu, F.; Ma, J. Laboratory simulation of microplastics weathering and its adsorption behaviors in an aqueous environment: A systematic review. Environ. Pollut. 2020, 265, 114864. [Google Scholar] [CrossRef] [PubMed]
  64. Luo, H.; Zhao, Y.; Li, Y.; Xiang, Y.; He, D.; Pan, X. Aging of microplastics affects their surface properties, thermal decomposition, additives leaching and interactions in simulated fluids. Sci. Total Environ. 2020, 714, 136862. [Google Scholar] [CrossRef]
  65. Hermabessiere, L.; Dehaut, A.; Paul-Pont, I.; Lacroix, C.; Jezequel, R.; Soudant, P.; Duflos, G. Occurrence and effects of plastic additives on marine environments and organisms: A review. Chemosphere 2017, 182, 781–793. [Google Scholar] [CrossRef] [PubMed]
  66. Ding, J.; Liu, C.; Chen, Q.; Zhang, Z.; Han, J.; Liang, A.; Zhu, D.; Wang, H.; Lv, M.; Chen, L. Extractable additives in microplastics: A hidden threat to soil fauna. Environ. Pollut. 2022, 294, 118647. [Google Scholar] [CrossRef] [PubMed]
  67. Huerta Lwanga, E.; Mendoza Vega, J.; Ku Quej, V.; de los Angeles Chi, J.; Sanchez del Cid, L.; Chi, C.; Escalona Segura, G.; Gertsen, H.; Salanki, T.; van der Ploeg, M.; et al. Field evidence for transfer of plastic debris along a terrestrial food chain. Sci. Rep. 2017, 7, 14071. [Google Scholar] [CrossRef]
  68. Wang, W.; Ge, J.; Yu, X. Bioavailability and toxicity of microplastics to fish species: A review. Ecotoxicol. Environ. Saf. 2020, 189, 109913. [Google Scholar] [CrossRef]
  69. Taylor, S.E.; Pearce, C.I.; Sanguinet, K.A.; Hu, D.; Chrisler, W.B.; Kim, Y.-M.; Wang, Z.; Flury, M. Polystyrene nano- and microplastic accumulation at Arabidopsis and wheat root cap cells, but no evidence for uptake into roots. Environ. Sci.-Nano 2020, 7, 1942–1953. [Google Scholar] [CrossRef]
  70. Teuten, E.L.; Rowland, S.J.; Galloway, T.S.; Thompson, R.C. Potential for Plastics to Transport Hydrophobic Contaminants. Environ. Sci. Technol. 2007, 41, 7759–7764. [Google Scholar] [CrossRef]
  71. Zhang, X.; Zheng, M.; Yin, X.; Wang, L.; Lou, Y.; Qu, L.; Liu, X.; Zhu, H.; Qiu, Y. Sorption of 3,6-dibromocarbazole and 1,3,6,8-tetrabromocarbazole by microplastics. Mar. Pollut. Bull. 2019, 138, 458–463. [Google Scholar] [CrossRef]
  72. Ren, X.; Tang, J.; Liu, X.; Liu, Q. Effects of microplastics on greenhouse gas emissions and the microbial community in fertilized soil. Environ. Pollut. 2020, 256, 113347. [Google Scholar] [CrossRef]
  73. Hao, Y.; Sun, H.; Zeng, X.; Dong, G.; Kronzucker, H.J.; Min, J.; Xia, C.; Lam, S.S.; Shi, W. Smallholder vegetable farming produces more soil microplastics pollution than large-scale farming. Environ. Pollut. 2023, 317, 120805. [Google Scholar] [CrossRef] [PubMed]
  74. Kim, S.W.; Waldman, W.R.; Kim, T.-Y.; Rillig, M.C. Effects of Different Microplastics on Nematodes in the Soil Environment: Tracking the Extractable Additives Using an Ecotoxicological Approach. Environ. Sci. Technol. 2020, 54, 13868–13878. [Google Scholar] [CrossRef]
  75. O’Connor, D.; Pan, S.; Shen, Z.; Song, Y.; Jin, Y.; Wu, W.-M.; Hou, D. Microplastics undergo accelerated vertical migration in sand soil due to small size and wet-dry cycles. Environ. Pollut. 2019, 249, 527–534. [Google Scholar] [CrossRef] [PubMed]
  76. Schnepf, U. Realistic Risk Assessment of Soil Microplastics Is Hampered by a Lack of Eligible Data on Particle Characteristics: A Call for Higher Reporting Standards. Environ. Sci. Technol. 2023, 57, 3–4. [Google Scholar] [CrossRef]
  77. Monson, L.; Braunwarth, M.; Extrand, C.W. Moisture absorption by various Polyamides and their associated dimensional changes. J. Appl. Polym. Sci. 2008, 107, 355–363. [Google Scholar] [CrossRef]
  78. Aekjira Kuyyakanont, M.I.A. Study of different degradation effects in UV-sensitive polymers using xenon lamp and deuterium lamp to simulate UV irradiation in space environment. Nucl. Instrum. Methods Phys. Res. Sect. B Beam Interact. Mater. At. 2024, 549, 165267. [Google Scholar] [CrossRef]
  79. Moshood, T.D.; Nawanir, G.; Mahmud, F.; Mohamad, F.; Ahmad, M.H.; AbdulGhani, A. Biodegradable plastic applications towards sustainability: A recent innovations in the green product. Clean. Eng. Technol. 2022, 6, 100404. [Google Scholar] [CrossRef]
  80. Han, X.; Lu, X.; Vogt, R.D. An optimized density-based approach for extracting microplastics from soil and sediment samples. Environ. Pollut. 2019, 254, 113009. [Google Scholar] [CrossRef]
  81. Kang, Y.; Hirota, Y.; Tsukayama, K.; Ikejima, K.; Sakurai, K. Separation and Measurement of Microplastics in Paddy Soil. J. Environ. Prot. 2024, 15, 1016–1021. [Google Scholar] [CrossRef]
  82. Li, W.X.; Wu, Y.M.; Wang, K.; Chen, W.; Tian, J.Y.; Xu, L. The Method for Determination of Microplastics in Typical Chinese Soils. J. Ecol. Rural. Environ. 2023, 39, 568–575. [Google Scholar]
  83. Liu, M.; Song, Y.; Lu, S.; Qiu, R.; Hu, J.; Li, X.; Bigalke, M.; Shi, H.; He, D. A method for extracting soil microplastics through circulation of sodium bromide solutions. Sci. Total Environ. 2019, 691, 341–347. [Google Scholar] [CrossRef]
  84. Goli, V.S.N.S.; Singh, D.N. Effect of ultrasonication conditions on polyethylene microplastics sourced from landfills: A precursor study to establish guidelines for their extraction from environmental matrices. J. Hazard. Mater. 2023, 459, 132230. [Google Scholar] [CrossRef] [PubMed]
  85. Li, G.; Pei, Z.; Li, Y.; Yang, R.; Wang, P.; Liang, Y.; Zhang, J.; Zhang, Q.; Jiang, G. A high-precision, effective method for extraction and identification of small-sized microplastics from soil. Talanta 2024, 272, 125802. [Google Scholar] [CrossRef]
  86. Maw, M.M.; Boontanon, N.; Fujii, S.; Boontanon, S.K. Rapid and efficient removal of organic matter from sewage sludge for extraction of microplastics. Sci. Total Environ. 2022, 853, 158642. [Google Scholar] [CrossRef] [PubMed]
  87. Prosenc, F.; Leban, P.; Šunta, U.; Bavcon Kralj, M. Extraction and Identification of a Wide Range of Microplastic Polymers in Soil and Compost. Polymers 2021, 13, 4069. [Google Scholar] [CrossRef] [PubMed]
  88. Yan, P.; Hao, X.; Zhang, S. Extraction and decontamination of microplastics from high organic matter soils: A simple, cost-saving and high efficient method. J. Environ. Manag. 2023, 344, 118381. [Google Scholar] [CrossRef]
  89. Gupta, E.; Mishra, V.K.; Patel, A.; Srivastava, P.K. A modified methodology for extraction and quantification of microplastics in soil. NanoImpact 2024, 35, 100525. [Google Scholar] [CrossRef]
  90. Radford, F.; Zapata-Restrepo, L.M.; Horton, A.A.; Hudson, M.D.; Shaw, P.J.; Williams, I.D. Developing a systematic method for extraction of microplastics in soils. Anal. Methods 2021, 13, 1695–1705. [Google Scholar] [CrossRef]
Figure 1. Location of the sampling sites.
Sustainability 17 03516 g001
Figure 2. Soil MP extraction. (a) Separately stored microplastics of sizes ranging from 2 to 5 mm; (b) soil-ZnCl2 solution mixture after stirring; (c) soil-ZnCl2 solution mixture after standing for 24 h; (d) the remaining ZnCl2 solution after flotation; (e) the floated materials in digestion; and (f) the MPs collected on an MCE membrane.
Sustainability 17 03516 g002
Figure 3. (a) Renishaw inVia™ confocal Raman microspectroscope; (b) a 4 mm × 4 mm square scanned under a 20× objective lens. In (b), the black particles were mostly carbon, and the yellow particles were SOM or oxidized MPs.
Sustainability 17 03516 g003
Figure 4. The abundances (a) of the sampling sites (b), as grouped by land-use type, where TA refers to typical agriculture and GD to garbage dump, and different lowercase letters above the columns indicate statistically significant differences (p < 0.05).
Sustainability 17 03516 g004
Figure 5. The MP abundance (a), the pH (b), and the DOC (c) content of the different farming scales. Different lowercase letters above the columns indicate statistically significant differences (p < 0.05).
Sustainability 17 03516 g005
Figure 6. Fingerprint region of the Raman spectra of the (a) E/P, (b) PET, (c) PA, (d) EVA, (e) PE, and (f) PP obtained from the soil MPs extracted in this study. The red line represents the raw/smoothed spectrum of the MPs in the sample, while the black line represents the spectrum of the standard polymer.
Sustainability 17 03516 g006
Figure 7. Chemical compositions of the soil MPs. Significant variation was observed among the sites in terms of different scales (p < 0.05).
Sustainability 17 03516 g007
Figure 8. Color compositions of the soil MPs. Significant variation was found across the farming scales (p < 0.05).
Sustainability 17 03516 g008
Figure 9. Shape compositions of the soil MPs. Significant variation was found across the farming scales (p < 0.05).
Sustainability 17 03516 g009
Figure 10. Size distribution of the MPs of different polymer types. This plot includes particles smaller than 500 µm, which equal to 91.23% of the total.
Sustainability 17 03516 g010
Figure 11. (a) the MP size distributions in general; (b) Across the different farming scales, the MP size distributions varied but not significantly (p < 0.05); and (c) between the polymer types, the MP size distributions varied significantly (p < 0.05).
Sustainability 17 03516 g011
Figure 12. Alluvial mapping of the soil MPs characteristics.
Sustainability 17 03516 g012
Figure 13. Index values of the site MPs’ risk assessments. Bar outlines denote the hazard levels: blue (low), yellow (mild), red (considerable), and black (high). Yellow or red highlights indicate proximity to threshold values.
Sustainability 17 03516 g013
Figure 14. Sensitivity values of the MP types in the pERI and pERIS assessments.
Sustainability 17 03516 g014
Figure 15. The risk distribution across the sites under index assessments (a), and the pERI values that changed significantly after size inclusion (b).
Sustainability 17 03516 g015
Figure 16. Results of t-test comparison for the size-inclusive and size-exclusive indices for (a) pPLI, (b) pRi, and (c) pERI. Different lowercase letters above the columns indicate statistically significant differences (p < 0.05).
Sustainability 17 03516 g016
Figure 17. (a) The contributions of the various MPs to different risk index values as an average. The disparities in contribution were most evident at (b) Site 2-2 and (c) Site 3-2.
Sustainability 17 03516 g017
Figure 18. Small MP particles under the microscope (20× or 50× objective lens).
Sustainability 17 03516 g018
Figure 19. MPs shown at a larger size under the microscope (0.8× or 4× objective lens).
Sustainability 17 03516 g019
Table 1. Sampling method and identified MPs characteristics in China agricultural soil.
No.Location (Province)PretreatmentAbundance Average (n/kg)Abundance Range (n/kg)Major Size Range (μm), PercentageMajor MPs TypesReference
Pore/Mesh Size in Separation (μm)Separation for MPs and SolutionDensity of Flotation Reagents (g/cm3)
1Shaanxi//1.5/1430 to 34100–490, 81%PS, PE, PP, HDPE, PVC, PET[7]
2Guizhou0.45Vacuum filtration1.21150.60  ±  647.86143.28 to 3283.4610~100, 64.79%/[8]
3Hebei0.45Vacuum filtration1.2754 ± 477240 to 2253<500, 50%PE, PP, PET, rayon, PEA, cellophane, PAN[9]
4Hunan0.45Vacuum filtration1.54377.44776.33 to 12,292.33<100, as high as 45.99%PE, PP, PS, PA, PVC[10]
5Shandong48Sieve1.234,900/50–250, 80%PE, PP, PS, PA, UF, POM[38]
6Beijing18,300
7Xinjiang33,200
8Qinghai0.45Vacuum filtration1.2/168.18 to 259.72<3000, 90.3%PE, PP, PS, PA, PVC[39]
9Tibet183.33 to 611.11
10Shaanxi13Vacuum filtration1.74505 ± 4351398 to 8568<100, 90%PE, PET, EVA, PU, PVC[11]
11Shandong20Vacuum filtration1.21444 ± 986310 to 5698<500, 58%PP, E/P, PE[23]
12Hubei0.45Vacuum filtration1.5 2020320 to 12,560<200, 70%PA, PP[12]
13Xinjiang, Guizhou0.45Vacuum filtration1.52685 ± 938/0~490, 81.71%PE, PP, PS, PVC[40]
14Inner Mongolia10Vacuum filtration1.46/1810 to 86,331<180, 90%PE, PA, PP[41]
15Xinjiang0.22Vacuum filtration1.4252,081.711,347 to 78,061<200, 70%PE[42]
16Sichuan20Vacuum filtration1.196544  ±  25611333  ±  138 to 15,067  ±  263850–100, up to 29%PP, PE[43]
17Guangdong20Vacuum filtration1.710,562528 to 39,8640–30, up to 51.7%PET, PVC, FKM[44]
18Jiangsu, Shanghai0.03Vacuum filtration1.237.324.94 to 252.70100~500, 49%PP, PE, rayon[45]
19Shaanxi 0.45Vacuum filtration1.21955200.00 to 4733.33<100, 96.65%PE, PET[25]
20Yunnan5Vacuum filtration1.6595.00 ± 740.0050.000 to 3450.0<1000, 75.7%PP, EPR, PE[46]
“/” indicates information not mentioned in the reference. PS: polystyrene; PE: polyethylene; PP: polypropylene; HDPE: high-density polyethylene; PVC: polyvinyl chloride; PET: polyethylene terephthalate; PEA: poly (ethylene adipate); PAN: polyacrylonitrile; PA: polyamide; POM: polyoxymethylene; UF: urea-formaldehyde; PU: polyurethane; EVA: ethylene-vinyl acetate; E/P: ethylene–propylene copolymer; FKM: fluoroelastomer; and EPR: ethylene propylene rubber.
Disclaimer/Publisher’s Note: The statements, opinions and data contained in all publications are solely those of the individual author(s) and contributor(s) and not of MDPI and/or the editor(s). MDPI and/or the editor(s) disclaim responsibility for any injury to people or property resulting from any ideas, methods, instructions or products referred to in the content.

