Article

Quantification and Analysis of Factors Influencing Territorial Spatial Conflicts in the Gully Region of the Loess Plateau: A Case Study of Qingyang City, Gansu Province, China

1
School of Architecture and Urban Planning, Lanzhou Jiao Tong University, Lanzhou 730070, China
2
The Institute of Land Spatial Planning and Engineering Technology, Lanzhou Jiaotong University, Lanzhou 730070, China
*
Author to whom correspondence should be addressed.
Sustainability 2025, 17(8), 3552; https://doi.org/10.3390/su17083552
Submission received: 21 February 2025 / Revised: 11 April 2025 / Accepted: 12 April 2025 / Published: 15 April 2025

Abstract

:
The gullied Loess Plateau, a region characterized by the overlapping of ecological fragility and energy abundance in China, requires urgent analysis of its territorial spatial conflict mechanisms to harmonize human–environment relationships. This study integrated multi-temporal remote sensing data (1990–2020) to develop a Comprehensive Spatial Conflict Index (CSCI) and applied the Optimal Parameter-based Geographical Detector (OPGD) to unravel the driving mechanisms of territorial spatial evolution in Qingyang City, Gansu Province. The results revealed that: (1) Territorial spaces exhibit a transition pattern of ecological restoration, urban expansion, and agricultural contraction. Forest and grassland ecological spaces increased by 1.42 percentage points (to 13.14%) and 1.26 percentage points (to 49.29%), respectively, while industrial-mining production spaces expanded sevenfold (0.01% to 0.08%), and agricultural production spaces decreased by 3.36 percentage points. (2) Spatial conflicts transitioned through three phases: ① A low-intensity stabilization phase (1990–2000), with 90.55% of areas under weak and moderately weak conflict (CSCI ≤ 0.4); ② A moderate conflict contraction phase (2000–2010), where weak conflict zones surged by 28.18 percentage points (13.06% → 41.24%), with moderate and moderately weak spatial conflict (0.2–0.6) decreasing by 28.27 percentage points (86.06% → 57.79%); ③ A moderately strong to strong expansion phase (2010–2020), with moderate and moderately strong conflict areas rising to 16.82%. Strong conflict zones (CSCI ≥ 0.8) expanded to 0.61%, spatially clustered in the Xifeng urban area and the Malian–Pu River corridor, showing significant positive correlations with gully density (>3.5 km∙km−2) and nighttime light index (NL). (3) The interaction between NDVI and land use intensity (LUI) dominated conflict patterns (q = 0.2583). In northern energy development zones (Huanxian County), LUI and precipitation (PRE) synergistically intensified landslide risks, while facility agriculture in central plateau farmlands (Ningxian County) triggered groundwater overexploitation. The coupling of road density (RND) and population (POP) factors (q = 0.1892) formed a transportation–population axial belt compression. Policy interventions exhibited spatial heterogeneity: the Grain-for-Green Program increased weak conflict zones by 28.18 percentage points, whereas wind power development in the Huanxian–Huachi northern belt escalated moderately strong to strong conflict zones by 3.6 percentage points. A three-dimensional governance framework integrating geomorphological adaptation, development phasing, and ecological compensation is proposed to optimize territorial spatial planning in the gullied Loess Plateau.

1. Introduction

Land-use conflicts are defined as the competition and disputes over land rights that occur among stakeholders during land resource use, particularly regarding methods and structures of land use [1]. Research in this area dates back to 1977, when the British Countryside Commission organized discussions on “Land Management, Land Use Relationships, and Conflicts.” Since then, international studies have primarily explored the origins and types of land-use conflicts, how these conflicts evolve, and strategies for their management [2,3,4,5]. In ecologically fragile regions like the Loess Plateau, such conflicts are exacerbated by rapid urbanization, resource scarcity, and environmental degradation, posing significant threats to sustainable development [6,7].
China’s socio-economic transformation and intensified ecological protection efforts have further amplified land-use pressures, creating imbalances in territorial spatial patterns [8,9]. These challenges are particularly acute in the gully region of the Loess Plateau, where complex topography and competing demands for agricultural, urban, and ecological spaces drive intense spatial conflicts [10,11]. Within China’s spatial governance framework, territorial spatial conflicts specifically refer to the incompatibility of functional demands arising from the competitive allocation of limited spatial resources among ecological, agricultural, and urban spaces under the “Three Zones and Three Lines” regulatory system (ecological conservation redlines, permanent basic farmland protection zones, and urban development boundaries). This manifests as contradictions between: (1) Ecological conservation requirements and production/living space expansion; (2) Intensive land use objectives and extensive development practices; (3) Statutory spatial controls and local development needs. The importance of this research lies in addressing the critical need to balance ecological conservation with socio-economic development in fragile ecosystems.
Territorial spatial conflicts in the Loess Plateau not only hinder regional sustainability but also contribute to soil erosion, habitat fragmentation, and reduced agricultural productivity—issues with cascading impacts on national food security and climate resilience [12,13]. Despite progress in spatial planning, current studies face three key challenges: First, methodological limitations persist as existing models (e.g., territorial suitability evaluations and landscape pattern indices) often oversimplify the dynamic interactions between natural and anthropogenic factors [14,15]. Traditional conflict indices, for instance, may fail to capture the nonlinear effects of precipitation or vegetation changes on land-use intensity. Second, data integration gaps remain a critical constraint, where existing studies often lack systematic integration of long-term remote sensing data with spatially refined socio-economic indicators, thereby limiting mechanistic analysis of conflict drivers [16]. Third, policy–practice gaps emerge in operationalizing spatial governance frameworks—while China’s 2019 territorial spatial planning system advocates “multi-plan integration,” its implementation in topographically complex regions demonstrates limited effectiveness due to conflicting stakeholder priorities and insufficient spatially explicit guidance [17,18].
Recent advances in geospatial analytics, such as the optimal parameter geographical detector (OPGD) model, offer new opportunities to address these gaps by identifying dominant drivers of spatial conflicts and their interactive effects [19,20]. However, applications in the Loess Plateau’s gully regions remain sparse, particularly in quantifying how factors like the normalized difference vegetation index (NDVI), land-use intensity, and precipitation synergistically shape conflict patterns over time. This study examines Qingyang City, a representative gully region of the Loess Plateau, through integrated analysis of Landsat TM/ETM/OLI multispectral imagery (30 m resolution, 1990–2020; obtained from Data Center for Resources and Environmental Sciences, Chinese Academy of Sciences) and the Optimal Parameter Geographical Detector (OPGD) model. The OPGD approach, which identifies dominant drivers through variance-based Q-statistics with parameter optimization (Section 3.3), enables systematic quantification of natural–socioeconomic interactions shaping territorial conflicts. Our approach advances the understanding of how ecological and socioeconomic factors interactively shape territorial conflicts, offering empirical evidence for spatial optimization in rapidly urbanizing fragile ecosystems.

2. Study Area and Data Sources

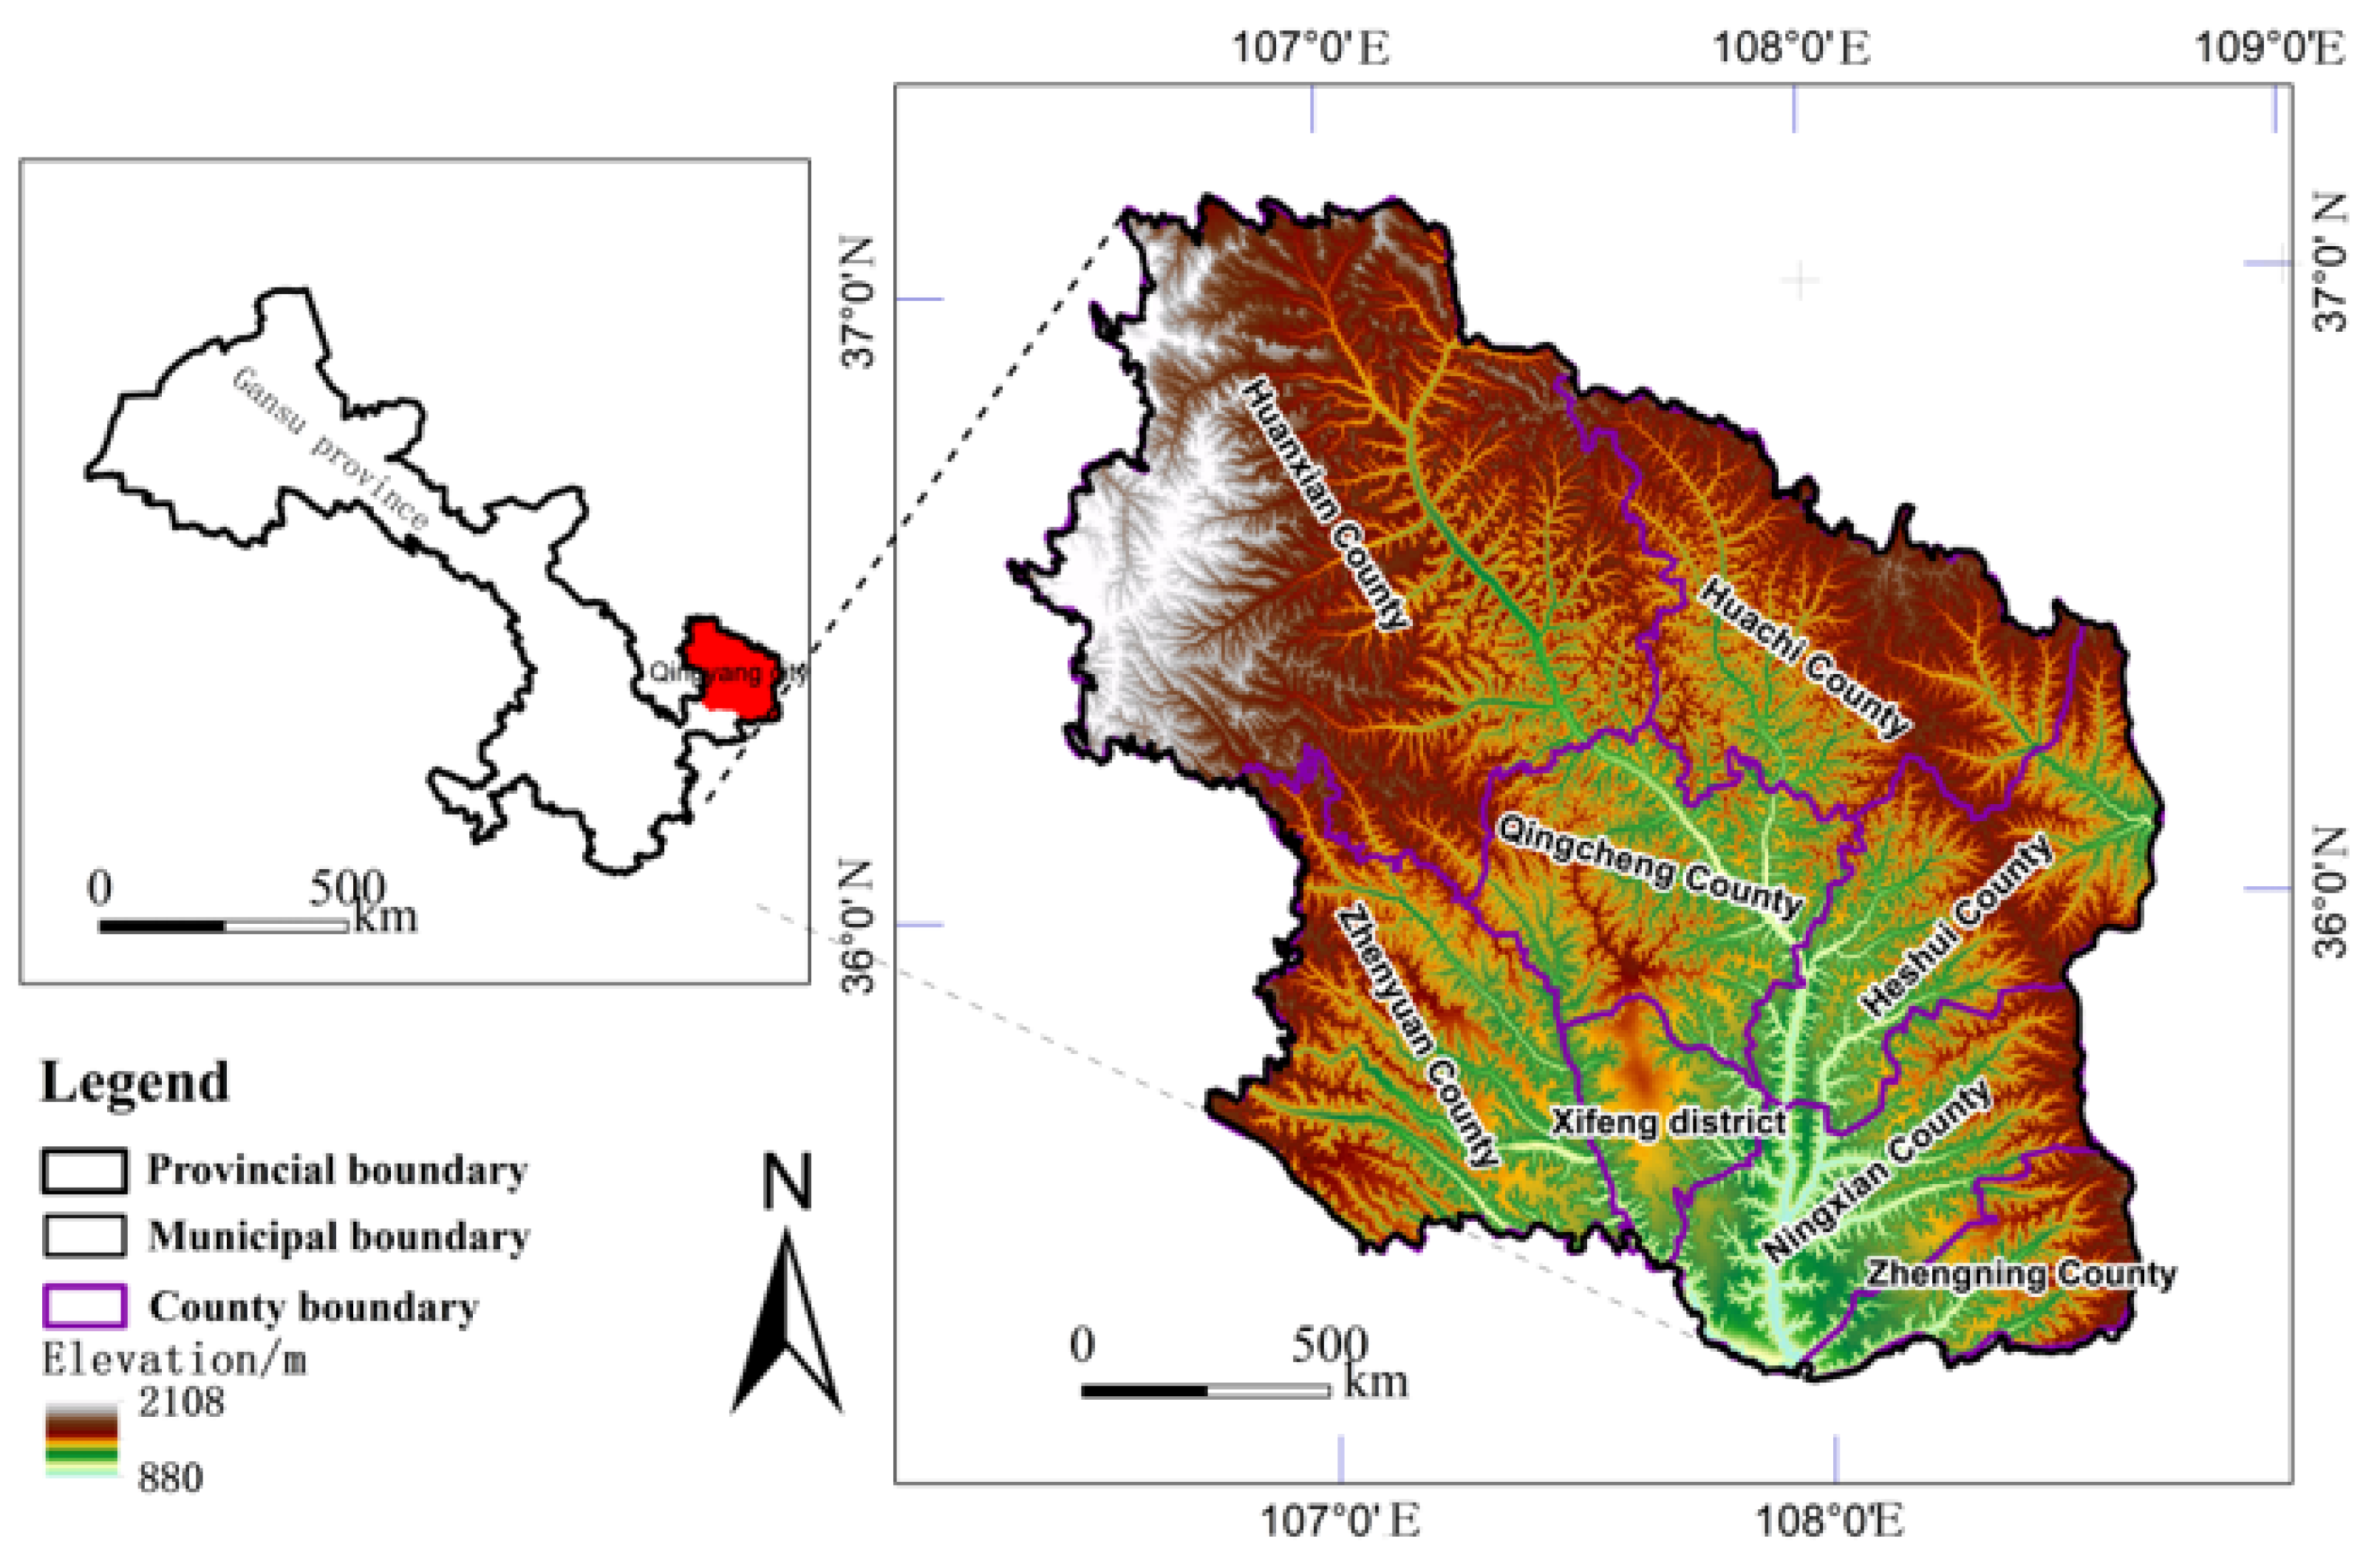
2.1. Overview of the Study Area

Qingyang City, situated in the eastern section of Gansu Province, is a representative area within China’s Loess Plateau gully region (Figure 1). The city lies at coordinates 35°42′ N–107°38′ E and governs one district and seven counties, with a resident population of around 2.13 million (2023). Its geomorphological uniqueness stems from three interconnected geological risk factors: (1) Loess structure vulnerability. The thick (>50 m) Quaternary loess deposits exhibit vertical joints and collapsibility upon saturation, triggering landslides and collapses [21]. (2) Intense hydraulic erosion. Steep gullies (slope angles >25° [22]) combined with concentrated summer rainfall (70% of the annual precipitation of 382.9–602.0 mm [23]) accelerate soil erosion rates [24]. (3) Anthropogenic disturbances. Large-scale mining (e.g., oil extraction-induced subsidence) and urban land modification destabilize slope integrity [25].
As a resource-economic paradox, Qingyang hosts China’s second-largest oilfield (Changqing Oilfield) and abundant minerals driving rapid industrialization, yet these activities intensify water-environment stresses. Recent socioeconomic development has further escalated spatial tensions between ecological preservation needs and industrial/urban expansion, making it a microcosm of sustainability challenges in ecologically fragile yet resource-rich regions.

2.2. Data Sources and Processing

This study employs multi-temporal land use/land cover (LULC) remote sensing data (1990, 2000, 2010, 2020) from the Chinese Academy of Sciences (http://www.resdc.cn, accessed on 20 December 2024) to analyze Qingyang City’s territorial spatial evolution and conflict indices. The datasets, with 30 m resolution from Landsat-TM/ETM (1990–2010) and Landsat 8 (2020), follow a three-tier classification system: primary categories (cultivated land, forest, grassland, water bodies, construction land, unused land), 25 secondary subcategories, and tertiary subdivisions. Qingyang’s data include six primary and 18 secondary categories. Aligned with China’s territorial governance frameworks—Guidelines for Provincial Territorial Space Planning (MNR, 2020) [26] and Technical Guidelines for Resource and Environmental Carrying Capacity Evaluation (MNR, 2020) [27]—we redefined a hierarchical system comprising Ecological, Urban, and Agricultural Spaces, further divided into eight subtypes: Water Ecological Space (WES), Forest Ecological Space (FES), Grassland Ecological Space (GES), Unutilized Land (UL), Urban Living Space (ULS), Industrial and Mining Production Space (IMPS), Agricultural Production Space (APS), and Rural Living Space (RLS).
The classification system operationalizes China’s “Three Zones and Three Lines” policy (ecological redlines, permanent farmland, urban boundaries), linking subtypes to specific land use codes (e.g., UL: 61—Sandy Land, 65—Bare Land). By integrating disciplinary advancements with regional characteristics, this framework balances statutory standardization under national spatial governance with localized adaptive practices, ensuring both scientific rigor and policy compliance in Qingyang’s territorial management (Table 1).

3. Research Methods

3.1. Analysis of Changes in Territorial Spatial Structure

This study uses the transfer probability matrix model to analyze the transformation of territorial spatial structure over different periods. Based on the classified territorial spatial data (eight categories, codes 1–8, Table 1) processed in Section 2.2 for 1990–2020, the original secondary land use classifications (e.g., 31—High cover grassland; 32—Medium cover) were reclassified into primary categories to generate 30 m resolution raster data. We quantified inter-period transitions between territorial spatial types using cross-tabulation analysis. To derive the actual transition area, we integrated grid transition counts with the unit cell area (30 m × 30 m = 900 m2) through the formula:
S i j = N i j × 900 m 2 ( i , j = 1 , 2 , , 8 )
where Sij represents the area of type i converted to type j (e.g., i = 3 denotes grassland ecological space, j = 5 denotes urban living space), and Nij is the corresponding grid count. By constructing an 8 × 8 territorial spatial transition matrix, the dynamic scale of inter-type transitions was quantified, thereby revealing the quantitative characteristics of structural changes in the study area.

3.2. Construction of the Comprehensive Index for Territorial Spatial Conflicts

Building on ecological risk assessment methods, a spatial conflict model was developed using the risk source–risk receptor–risk effect framework [28,29,30,31]. Based on prior research, the measurement of territorial spatial conflict levels is expressed as: “Spatial Conflict = External Pressure + Spatial Exposure − Spatial Stability.” The calculation formula is detailed in Table 2.
Given that the scale of analysis can affect both the scientific validity and practical applicability of the results, this study uses the moving window method in Fragstats 4.3 to assess territorial spatial conflict levels. This method quantifies multi-scale spatial heterogeneity by calculating landscape pattern indices (e.g., patch density, aggregation index) within window units [32,33], and is particularly suitable for analyzing gradient changes in conflict intensity within topographically fragmented regions. By comparing four grid scales (300 m to 3 km, Table 3), we found that finer resolutions (300 m × 300 m) achieved a high terrain variation retention rate of 92.7%, but resulted in a sharp increase in grid count (45,620) and data volume (18.6 GB), coupled with weak spatial autocorrelation (Moran’s I = 0.12, p = 0.147), which introduced significant model noise and reduced statistical reliability. Conversely, coarser scales (≥2 km) reduced data volume to below 1.3 GB but retained less than 70% of terrain variation, underestimated gully density (2.1 ± 0.2 km·km−2), and failed to capture microtopographic heterogeneity in the Loess Plateau gully region, while exhibiting insufficient spatial autocorrelation strength (Moran’s I ≤ 0.37), thereby compromising the precision of conflict pattern identification. The 1 km × 1 km grid, however, balanced these trade-offs: it retained 85.2% of terrain variation, maintained manageable data volume and computational efficiency, while it demonstrated strong spatial clustering (Moran’s I = 0.58, p < 0.001), effectively revealing conflict differentiation patterns driven by the gully–tableland topographic system. The overall spatial conflict index was then categorized into five levels using the equal interval method: weak spatial conflict (0.0–0.2), moderately weak spatial conflict (0.2–0.4), moderate spatial conflict (0.4–0.6), moderately strong spatial conflict (0.6–0.8), and strong spatial conflict (0.8–1.0).

3.3. Optimal Parameter Geographic Detector (OPGD)

The OPGD is a statistical technique used to identify spatial differentiation in geographical phenomena and to determine the factors driving these variations.
  • Spatial differentiation and factor detection
The factor detector evaluates the significance of explanatory variables using the Q statistic. The Q statistic gauges a factor’s explanatory power by comparing the total variance across the study area with the variance within the variable layers. The formula is as follows:
Q = 1 h = 1 L N h σ h 2 N σ 2
where Q represents the explanatory power index of each influencing factor, with values ranging from 0 to 1. A higher Q value indicates a greater influence of the factor on the formation and evolution of the territorial spatial pattern. L denotes the number of categories for the influencing factor. Nh and N denote the number of units in the hth layer and the entire study area, while σ h 2 and σ 2 represent the variance of territorial spatial land use area in the hth layer and the entire study area, respectively. The formula for calculating the total variance of Y in the entire area is:
σ 2 = 1 N i = 1 N Y i Y 2
where Y i and Y represent the value of the ith sample in the study area and the mean value of the entire region, respectively.
  • Parameter optimization
In this study, the q value for each continuous variable is calculated by testing various combinations of discretization methods and category counts. Different classification methods and numbers of categories are applied to the continuous variables in the geographic spatial data. The combination that produces the highest q value is chosen as the optimal discretization method, effectively capturing the explanatory power of the factors.
The factor detection analyzes how each factor influences the territorial spatial types (ecological, urban, and agricultural spaces) within the study area. Interaction detection assesses how the interactions between different factors affect the results. The calculation formula is:
q = 1 h = L L N h σ h 2 N σ 2
where q is the explanatory power index of each influencing factor, also ranging from 0 to 1. A higher q value indicates a stronger influence of the factor on the formation and evolution of the territorial spatial pattern. L represents the number of categories for the influencing factor, N h denotes the number of units in the hth layer, and N is the total number of units in the entire study area. σ h 2 and σ 2 represent the variance of territorial spatial land use area in the hth layer and the entire study area, respectively.

4. Results

4.1. Characteristics of Territorial Spatial Evolution

4.1.1. Spatiotemporal Patterns of Territorial Spatial Evolution

The territorial spatial pattern in Qingyang City exhibits notable regional differences (Figure 2, Table 4), with significant changes across various spatial areas. The key details are as follows:
  • Ecological spaces show a general trend of expansion.
The Water Ecological Space occupies a relatively small area and has experienced little change from 1990 to 2020. The Forest Ecological Space is primarily located along the Zi Wuling Mountain range in Zhengning, Ningxian, Heshui, and Huachi Counties, with Heshui County having the largest forested area. From 1990 to 2020, the Forest Ecological Space expanded significantly, increasing from 11.72% to 13.14%. Grassland Ecological Space is mainly distributed in Huanxian County and is dominated by natural grasslands. Grassland areas increased from 48.03% in 1990 to 49.29% by 2020, with most of the growth concentrated in Qingcheng and Zhengyuan Counties.
  • Urban space has expanded considerably.
Urban Living Space grew from 0.06% in 1990 to 0.19% in 2020, with significant expansion around key cities such as Xifeng District, Zhengyuan County, and Qingcheng County. Although the area of Industrial and Mining Production Space remains relatively small, it has seen notable growth, increasing from 0.01% in 1990 to 0.08% in 2020.
  • Agricultural space has generally shown a trend of contraction.
In 1990, Agricultural Production Space covered 38.98% of the total area, decreasing to 35.62% by 2020. This reduction mainly occurred around Xifeng District and surrounding areas in Zhengyuan, Huanxian, and Huachi Counties. Meanwhile, Rural Living Space has gradually expanded by 0.45 percentage points (from 0.94% in 1990 to 1.39% in 2020), primarily in the central and southern regions, including Ningxian, Zhengning, and Zhengyuan Counties.

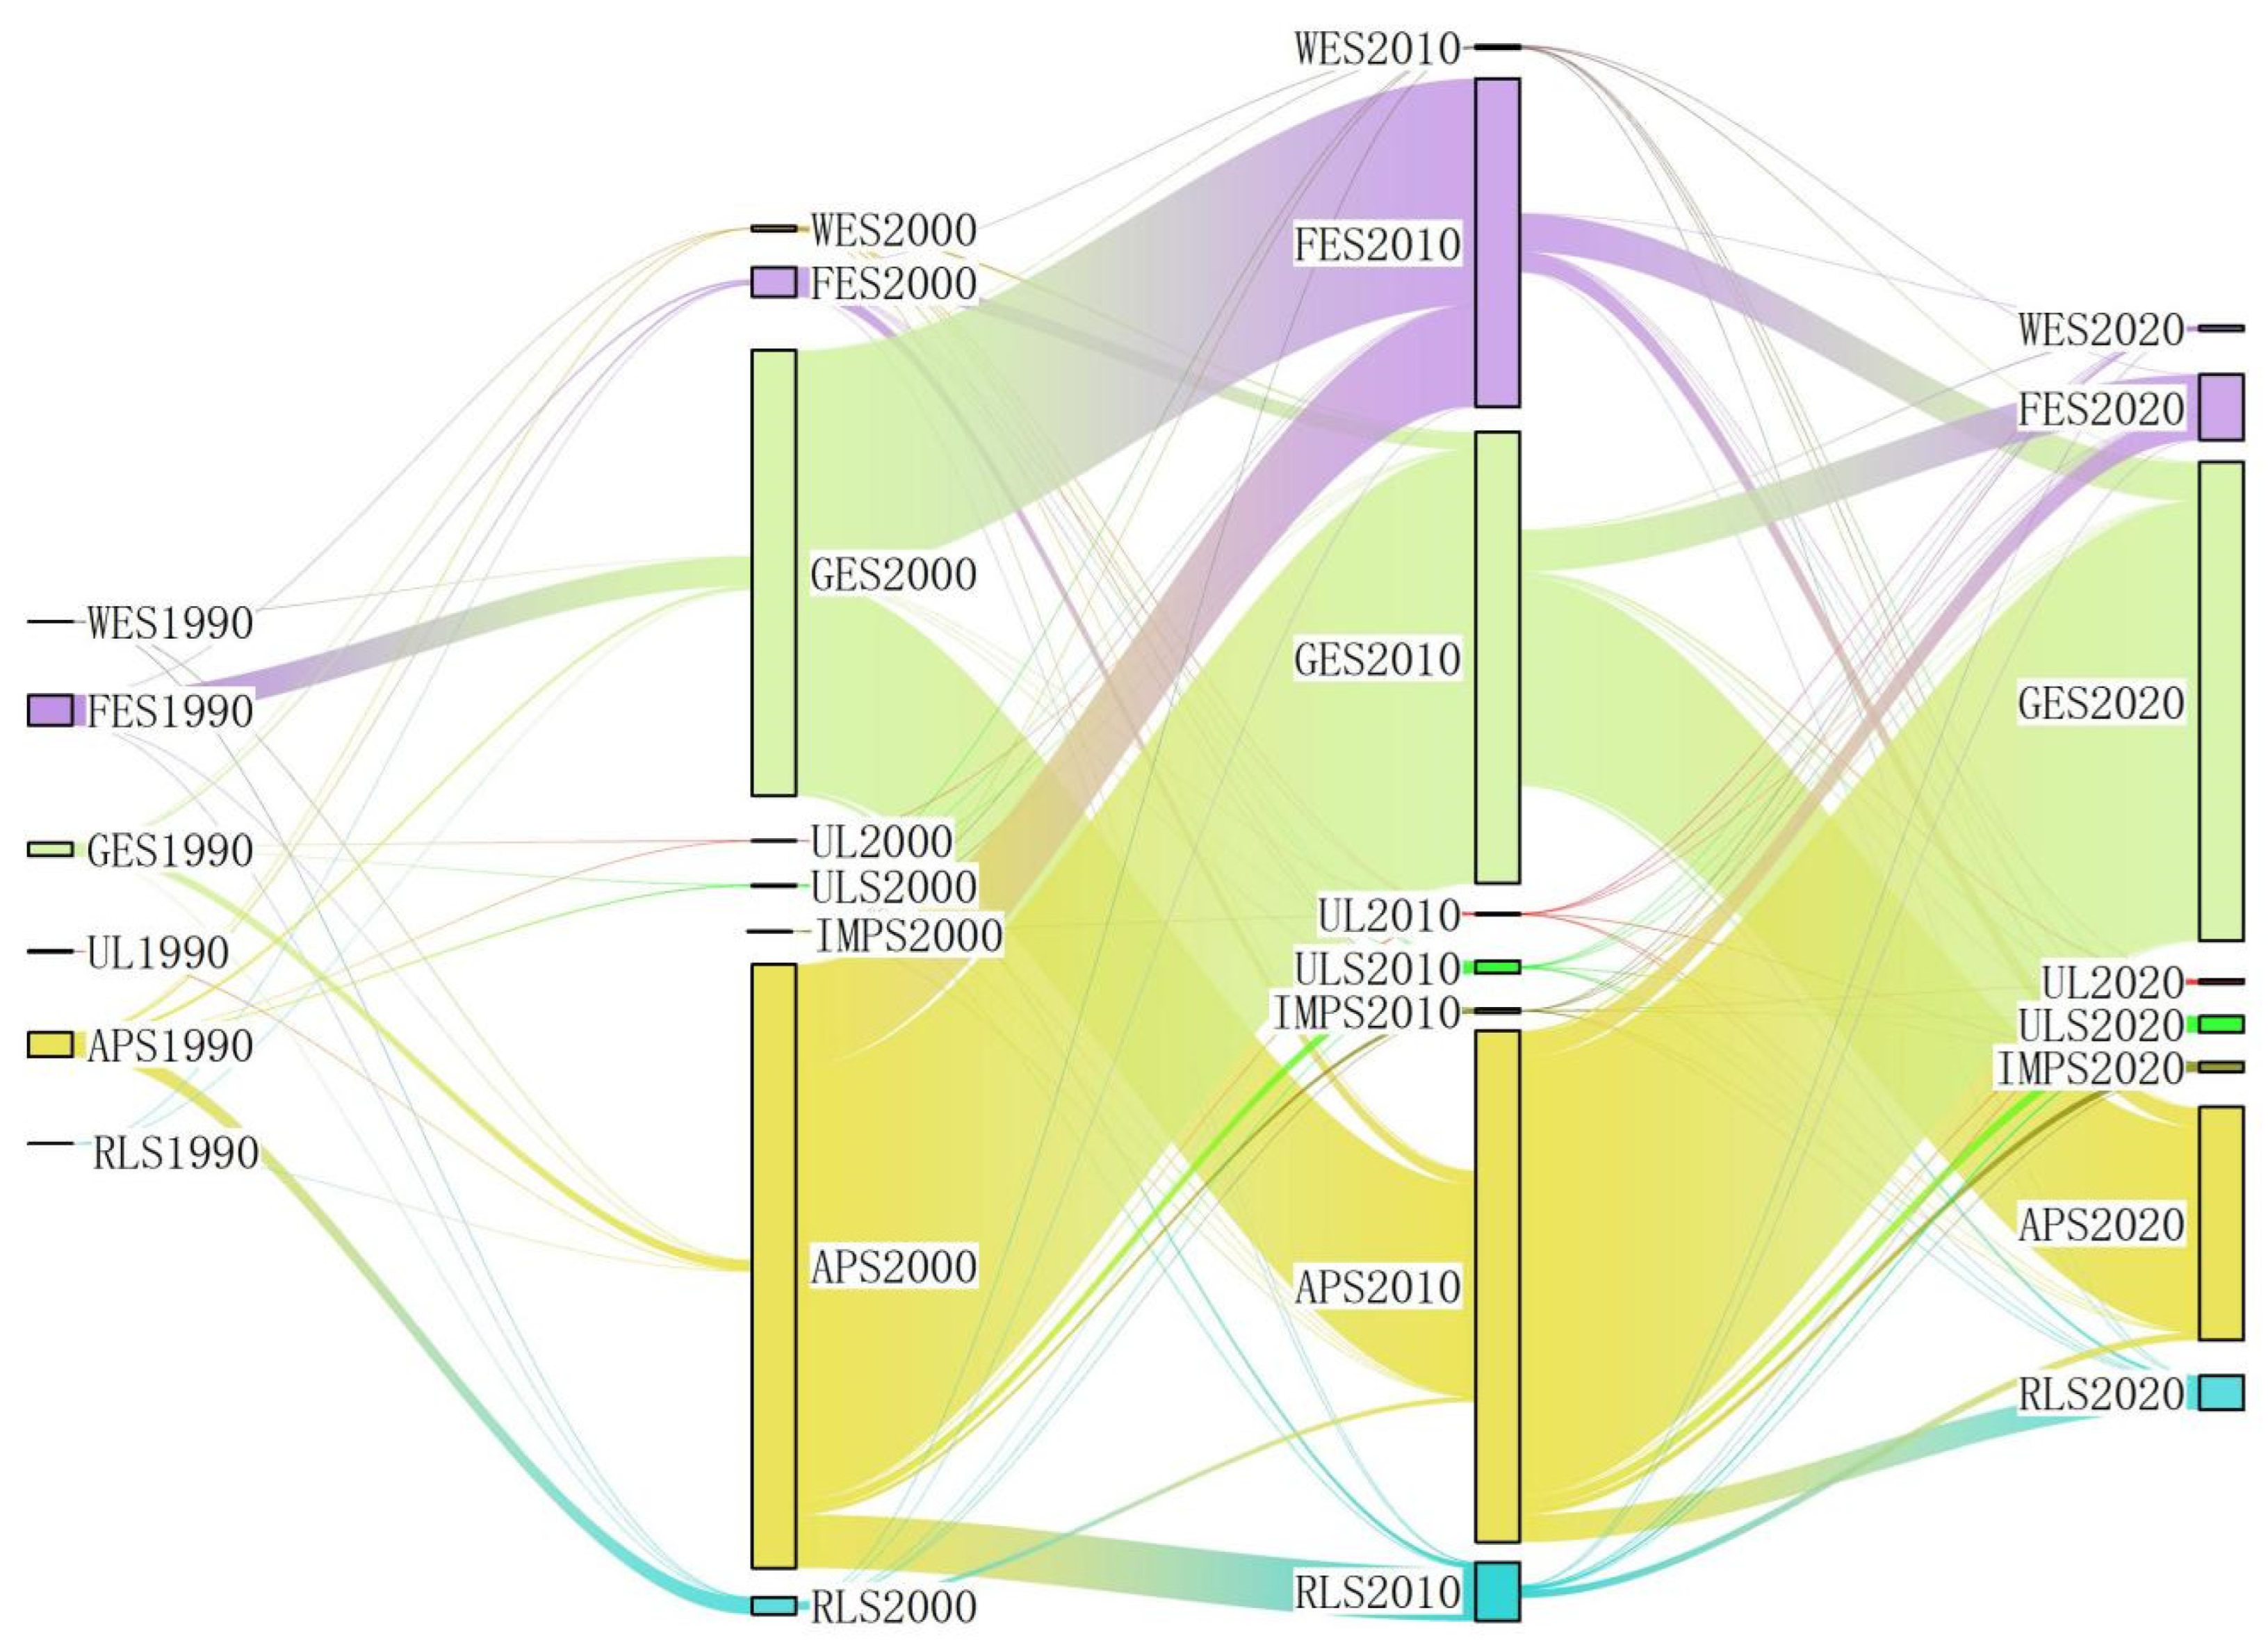
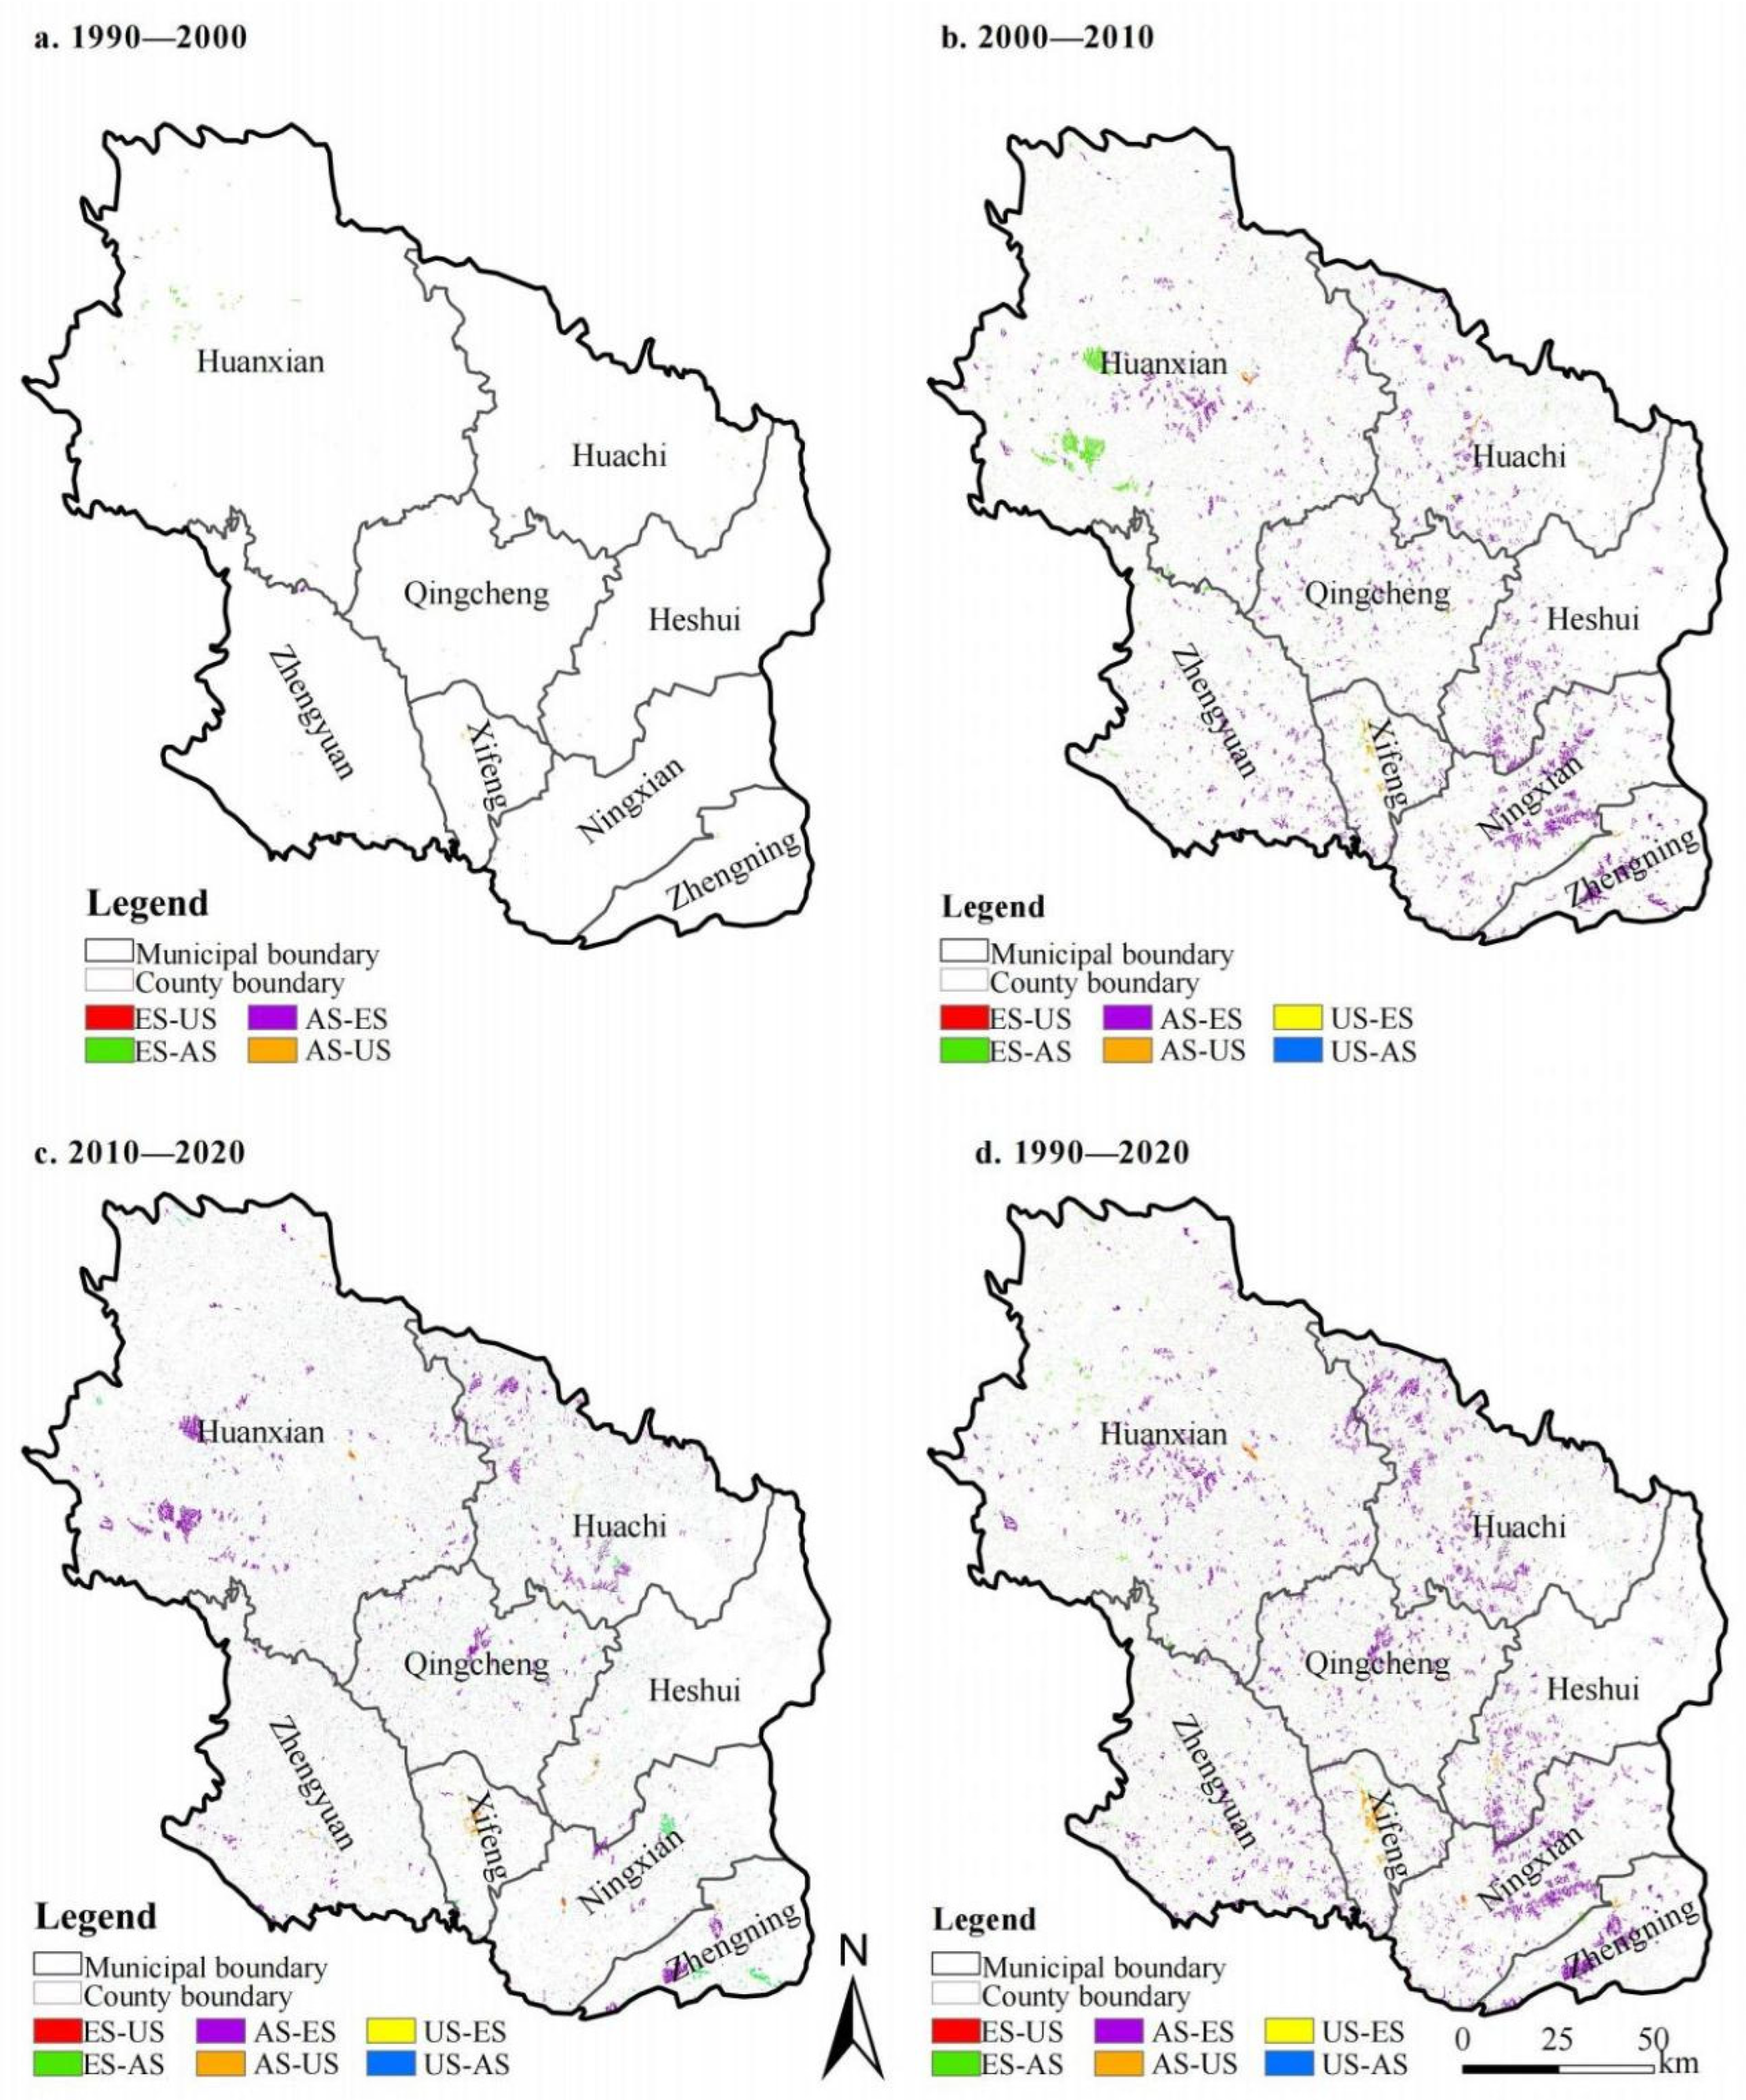
4.1.2. Characteristics of Territorial Spatial Structure Transformation

Between 1990 and 2020, the transformation of Qingyang City’s territorial spatial structure was primarily marked by the exchange between ecological and agricultural spaces, with the most significant changes occurring between grassland and agricultural production areas (Figure 3 and Figure 4).
From 1990 to 2000, spatial transformation was relatively modest, primarily involving the conversion of ecological space into agricultural production space, particularly in Huanxian and Huachi Counties. However, from 2000 to 2010, there was a substantial increase in spatial transformation, with the predominant trend being the conversion of agricultural space back into ecological space. This shift led to significant growth in forested areas across various counties.
From 2010 to 2020, the trend of converting agricultural space into ecological space continued to dominate. This period also saw urbanization in Xifeng District, Ningxian, Zhengyuan, and Heshui, where urban construction land expanded significantly, largely at the expense of agricultural space.
In 1999, in response to the national “Grain for Green” policy, Qingyang City initiated two rounds of farmland-to-forest and grassland conversion projects. These initiatives rapidly transformed large areas of farmland into forest and grassland, resulting in a notable reduction in agricultural space. As a result, soil erosion and land desertification were mitigated, leading to significant improvements in the quality of the ecological environment.

4.2. Spatiotemporal Evolution Characteristics of Territorial Spatial Conflicts

The comprehensive assessment of territorial spatial conflict in Qingyang City across different stages was conducted using the Comprehensive Spatial Conflict Index model (Table 5), and the spatial characteristics of conflict levels are visualized in Figure 5. From 1990 to 2020, Qingyang City experienced significant spatiotemporal changes in territorial spatial conflicts. Over time, conflict levels showed a general trend of fluctuating increases. Spatially, there were notable differences in conflict levels across regions, with the most significant conflicts occurring in central urban areas and the urban–rural fringe.

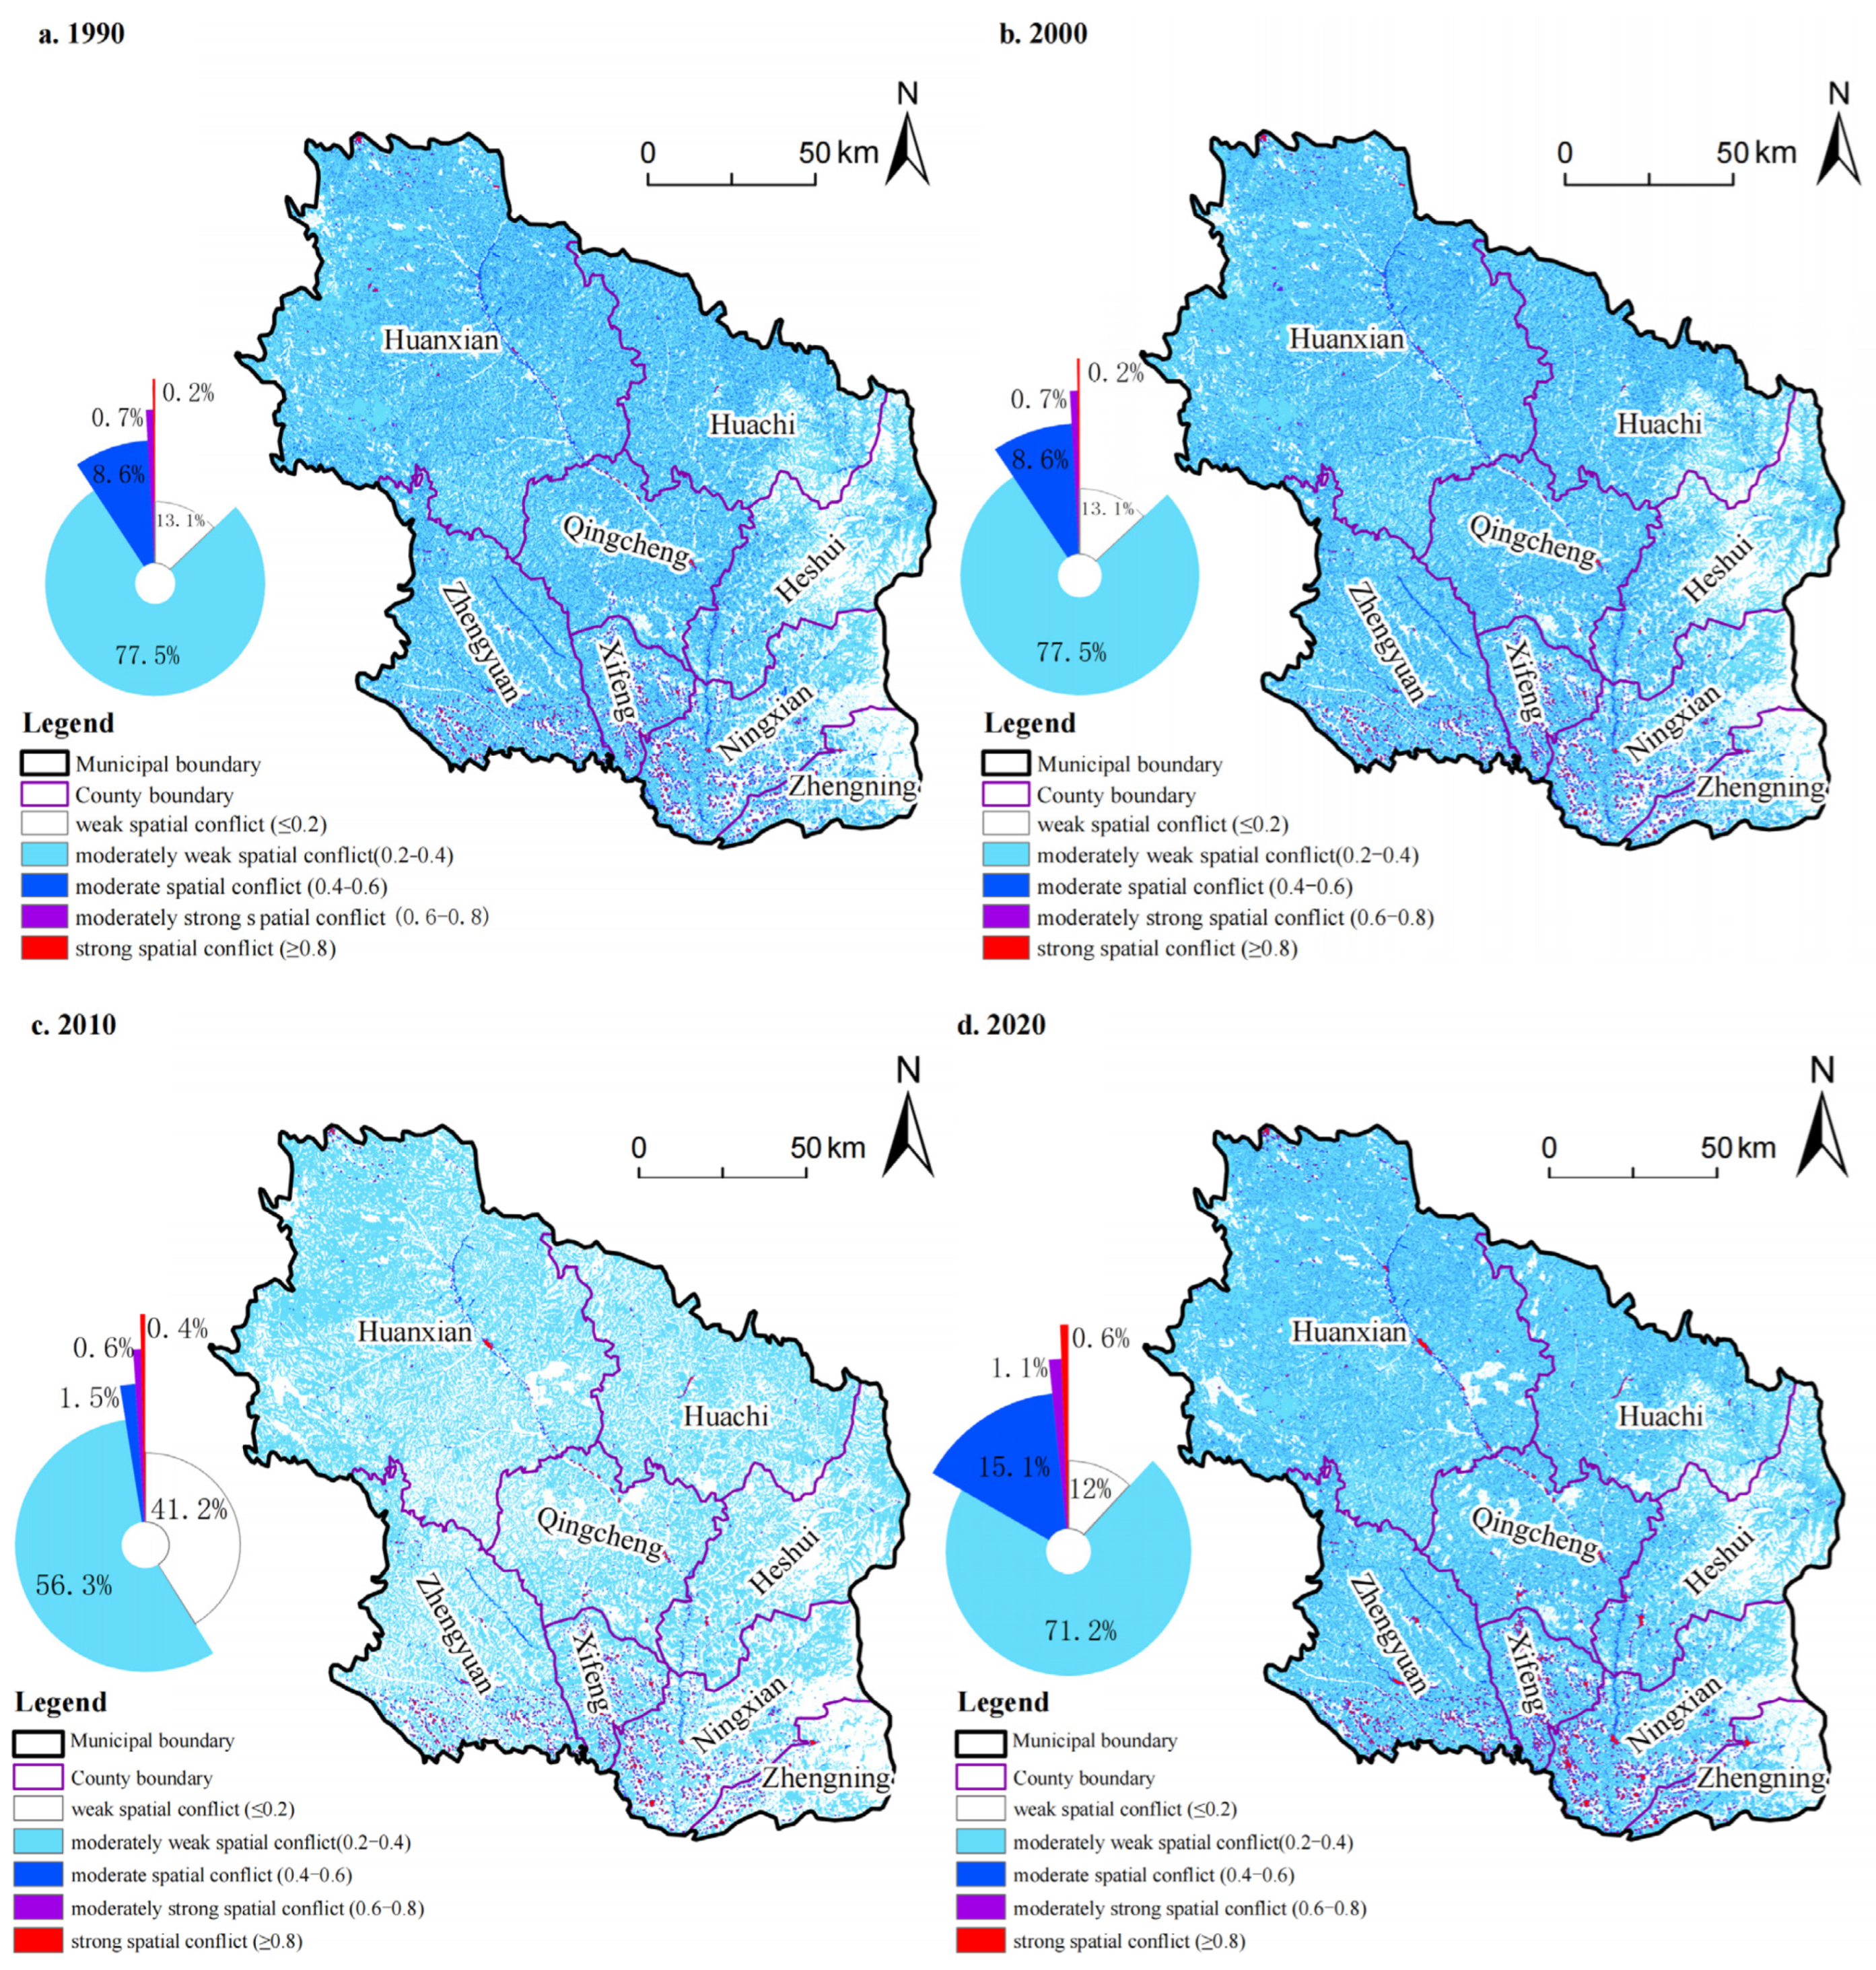
4.2.1. Temporal Variation Characteristics

The evolution of territorial spatial conflicts in Qingyang City from 1990 to 2020 followed a three-phase trajectory of mitigation, fluctuation, and intensification. During 1990–2000, low-intensity territorial development maintained stable proportions of conflict levels, with weak and moderately weak conflicts accounting for 13.06% and 77.49%, respectively. Between 2000 and 2010, ecological restoration initiatives and agricultural intensification drove a surge in weak conflicts to 41.24% (+28.18 percentage points), while moderate and higher-intensity conflicts diminished, reflecting an overall alleviation of spatial tensions. From 2010 onward, rapid urbanization post-2010 triggered intense competition for spatial resources (particularly between agricultural, ecological, and construction spaces), sharply reducing weak conflicts to 12.00% (−29.24 percentage points) and elevating moderate, moderately strong, and strong conflicts to 15.14%, 1.07%, and 0.61%, respectively. This marked escalation underscores the growing dominance of human-induced pressures over territorial stability, highlighting the intensifying impacts of urbanization on spatial resource allocation.

4.2.2. Spatial Differentiation Characteristics

From a spatial distribution perspective, the level of territorial spatial conflicts in Qingyang City’s counties (districts) exhibits significant spatial differentiation (Figure 5, Table 5). In 1990 and 2000, conflicts were primarily concentrated at moderate and moderately weak levels, with relatively weaker conflicts observed in Huanxian County, Huachi County, and Zhengyuan County. By 2010, the proportion of moderately weak conflicts had increased significantly across Qingyang City, particularly in Qingcheng County, Ningxian County, Huachi County, and Zhengyuan County, where conflict levels eased. In 2020, the moderately weak conflict level increased once again, but there was also a notable rise in moderate and strong conflict levels, particularly in Xifeng District, Zhengyuan County, and Zhengning County. The rise in conflicts in these areas reflects the intensifying pressure of urbanization on territorial spatial conflicts.

4.3. Analysis of Factors Influencing the Evolution of Territorial Spatial Conflicts

The evolution of territorial spatial conflicts is driven by the interaction of multiple factors. Differences in terrain and hydrothermal conditions lead to uneven spatial distribution and varying sensitivities to human disturbances. These natural environmental factors serve as the foundation for the development of territorial spatial conflicts. As urbanization progresses rapidly, the allocation of regional resources and spatial structures undergo significant changes [34,35]. The patterns of resource use and availability change quickly, often reflecting specific stages of economic and social development. For instance, population migration and industrial agglomeration during urbanization intensify competition for land resources between urban expansion and ecological/agricultural conservation (e.g., industrial zones encroaching on arable land). Concurrently, economic restructuring—such as transitioning from agriculture to manufacturing or services—reshapes functional demands for spatial resources. Additionally, government-led initiatives like new urban district planning or transportation hub construction often disrupt pre-existing spatial equilibria, amplifying conflicts over resource allocation [36]. These socioeconomic dynamics directly alter land-use intensity, reconfigure spatial power relations (e.g., negotiations among developers, local communities, and policymakers), and drive infrastructure expansion, thereby acting as core mechanisms in conflict generation. As a result, socioeconomic factors become the primary drivers of territorial spatial conflicts. The spatial heterogeneity of an area plays a vital role in shaping geographical patterns. Transportation, as a key component of spatial connectivity, directly affects urbanization and interacts in complex ways with other factors. Variations in transportation conditions lead to different urbanization strategies. By influencing the economic structure, transportation conditions contribute to changes in both urbanization levels and urban spatial configurations. Thus, transportation and locational factors are essential spatial drivers in the evolution of territorial spatial conflicts [37,38,39]. The evolution of territorial spatial conflicts is driven by the interaction between natural environmental factors, socioeconomic conditions, and locational factors. Therefore, changes in the allocation and unequal influence of these factors across regions result in spatiotemporal variations in conflict intensity.

4.3.1. Selection of Influencing Factors

Based on a comprehensive assessment of the current state of territorial spatial conflicts in Qingyang City, 13 factors were selected across three key categories: natural conditions, socioeconomic factors, and locational factors. These factors were then used to construct an influencing factor index system for analyzing territorial spatial conflicts (Table 6).

4.3.2. Detection of Influencing Factors

  • Optimal Parameter Selection
The choice of spatial discretization methods and classification approaches can greatly influence the q value, which reflects the relationship between driving factors and geographical phenomena. Subjective classification may not always provide an accurate explanation of this relationship. To scientifically explore the driving mechanisms behind territorial spatial evolution in the study area, we selected the parameter combination that produced the highest q value (in terms of both classification method and number of breaks) as the optimal choice for geographic detection. The classification methods employed in the analysis include natural breaks, equal interval breaks, standard deviation breaks, geometric interval breaks, and quantile breaks. The number of classes ranged from four to 10, based on the principle of avoiding excessive classifications [40,41,42]. Table 7 delineates the optimal parameter configurations yielding the highest q values across distinct driving factors of 2000 and 2020. For the year 2000, classification methods were implemented as follows: TR adopted the standard deviation method with nine breaks; DEM, RID, GDP, and NL were categorized by the quantile method into 10, 10, nine, and 10 breaks respectively; SL, POP, and RND utilized the geometric interval method with nine, seven, and nine breaks; DCC was divided into six breaks through the natural breaks method; while TEM, PRE, NDVI, and LUI employed the equal interval method with 10, 10, nine, and 10 breaks, aligning classification granularity with the intrinsic statistical properties of each factor.
  • Single-factor detection analysis
During the analysis of factors influencing territorial spatial conflicts, it was observed that the spatial distribution of natural environment, socioeconomic factors, and locational conditions demonstrated a high degree of convergence across different years. Therefore, this study focuses on the key influencing factors of territorial spatial conflicts in Qingyang City, using 2000 and 2020 as time points for analysis. According to the detection results for both years, the driving factors were categorized by q value into key influencing factors, major influencing factors, and other factors (Table 8). The key influencing factors are the primary determinants shaping the territorial spatial structure in Qingyang. In 2000, the key influencing factors included NDVI, LUI, and PRE, with q values of 0.2083, 0.1409, and 0.1142, respectively. The major influencing factors, which mainly drove the evolution of territorial space, included GDP per unit area, TEM, DEM, and RND.
In 2020, the key influencing factors continued to be the NDVI, LUI, and PRE, though their impacts changed, with q values of 0.1481, 0.1622, and 0.1358, respectively. Notably, LUI became the most influential factor in 2020, indicating that over the 20-year period, changes in land use intensity had a more significant impact on territorial spatial conflicts. The major influencing factors, ranked by their q values, were RND, POP, GDP per unit area, and NL. This shift highlights the growing significance of infrastructure development in spatial conflicts, the increasing impact of population changes on spatial distribution, and a reduction in the relative influence of GDP, though it remained a key factor. NL reflects the effects of human activities during urbanization on spatial distribution. Comparing the two periods, it is evident that natural factors, such as vegetation cover and precipitation, remained consistently important, while the influence of land use intensity notably increased by 2020. Simultaneously, socioeconomic factors, particularly infrastructure development and population density, exerted a much stronger influence in 2020, underscoring the substantial role of economic growth and urbanization in shaping territorial spatial conflicts. These changes highlight the complex interaction between natural and socioeconomic factors in the evolution of territorial space in the Qingyang region.
  • Multi-factor interactive detection analysis
The formation and evolution of regional territorial spaces are driven by the combined effects of multiple factors, making the analysis of their interactions essential. The interaction detection results of influencing factors can be classified into five categories: nonlinear weakening, single-factor nonlinear weakening, two-factor enhancement, independence, and nonlinear enhancement. Analysis of the interaction of influencing factors for territorial spatial conflicts in the Qingyang region (Figure 6) revealed that most factor interactions exhibit an enhanced effect. The impact of interacting factors is stronger than that of any single factor and shows an upward trend. No factors act independently, meaning that the interaction between any two factors has a greater impact on territorial spatial conflicts than the effect of a single factor alone.
In 2000, the interaction of driving factors for territorial spatial conflicts in Qingyang City exhibited a natural–economic dual dominance. The interplay between NDVI and PRE profoundly reflected the regulatory mechanism of the ecological baseline in the gullied Loess Plateau on spatial conflicts. In the northern loess tableland regions (e.g., Zhenyuan County), high NDVI values (linked to farmland shelterbelts on tablelands) synergized with seasonal rainfall to stabilize soil and retain moisture, mitigating conflicts between agricultural development and soil erosion. Conversely, in the southern Ziwuling forest fringe areas (e.g., Heshui County), low NDVI (associated with sloping croplands) combined with intense rainfall exacerbated headward gully erosion, intensifying tensions between the Grain-for-Green policy and local farmland expansion demands. Meanwhile, the strong interaction between GDP and LUI (q = 0.2453) highlighted the role of industrial-mining economies in reshaping spatial patterns. In key oil–gas development zones like Huachi County (part of the Changqing Oilfield), GDP growth driven by resource extraction spurred high-intensity land uses (e.g., drilling platforms, pipelines), directly encroaching on high-quality tableland croplands and ecological woodlands, forming a vertical conflict belt of black economy versus green space. During this phase, natural factors constrained spatial utilization through ecological processes, while economic factors restructured spatial order via resource exploitation, jointly establishing the foundational conflict framework.
By 2020, the factor interaction network evolved into a dual-track pattern of intensified natural constraints and amplified human–land contradictions. Although PRE, NDVI, and LUI retained strong interactive effects, their pathways underwent structural shifts. In northern energy development zones (e.g., Huanxian County), the LUI and PRE interaction (q = 0.2583) manifested as traditional vertical drilling-induced ground fissures synergizing with extreme rainfall to heighten landslide risks [43] (eight new hazard sites annually), forcing settlements to retreat toward tablelands and creating a new conflict axis of subsurface resource extraction versus surface habitation safety. In central tableland agricultural belts (e.g., Ningxian County), the LUI–NDVI interaction (q = 0.2531) intensified as facility agriculture expansion aggravated groundwater overdraft [44,45] (annual decline of 1.8 m), triggering vegetation degradation on tablelands (NDVI↓) and sharpening conflicts between irrigation demands and ecological water retention. The surged interaction between POP and RND (q = 0.1892) revealed an urbanization-driven “transportation–population corridor effect”; the Qinglan Expressway (Xifeng–Qingcheng section) spurred logistics park agglomeration, with slope-cutting land creation fragmenting ecological corridors in loess gullies, leading to horizontal spatial compression of transport arteries versus gully ecosystems. In contrast, the diminished interactive role of GDP reflected policy-driven corrections to extensive growth models. Towns near the Ziwuling Provincial Nature Reserve partially resolved energy-GDP versus ecological space conflicts by restricting oil–gas extraction and developing wind power [46]. However, inter-county disparities persisted; Yongzheng Town’s modern Apple industrial park (Zhengning County) achieved GDP–NDVI synergy (q = 0.161) through water-saving irrigation plus policy subsidies (40% reduced water use per acre), while Miaoqu Township (Zhenyuan County) saw short-term conflict peaks (q = 0.174) due to temporal–spatial competition between shale gas exploration (temporary LUI↑) and gully ecological restoration (NDVI↑). This evolution underscores that natural factors amplify conflict effects through geomorphic fragility, human–land factors reshape conflict dimensions via spatial restructuring, and policy interventions (e.g., ecological compensation, phased land-use regulation) serve as critical mediators in balancing interactive forces.

5. Discussion

5.1. Geomorphic Constraints and Spatial Competition Between Human Activities

Territorial spatial conflicts in the gully-dominated Loess Plateau arise from the dynamic interplay between fragile ecosystems and intensive human development. In Qingyang City, the coupling of high gully density (>3.5 km∙km2) and energy exploitation has created a topography-locked conflict pattern. The wind power clusters in the northern Huanxian–Huachi energy corridor, superimposed on densely dissected gullies, have formed strong conflict hotspots (CSCI ≥ 0.8), with nighttime light index (>50) showing significant positive correlation with conflict intensity (r = 0.73). This phenomenon differs markedly from ecological conflicts in the oasis–desert transition zones of the Aksu River Basin [47] and agricultural–construction land competition in the Raohe River Basin [48], highlighting the unique geomorphology-dominated conflict characteristics of the Loess Plateau. The rapid urbanization driven by energy development has approached the topographic carrying capacity threshold, a spatial effect analogous to the development constraints in Yibin’s terrain-restricted zones [49], though water scarcity in Qingyang exacerbates resource competition pressures.

5.2. Dual Effects of Policy Interventions and Spatial Compatibility Challenges

Spatial governance policies in Qingyang exhibit divergent outcomes. The Grain-for-Green Program enhanced vegetation recovery (1.42% increase in forest cover), effectively mitigating eco–agricultural conflicts in the Ziwuling forest edge area and expanding low-intensity conflict zones (CSCI ≤ 0.2) by 23.6%. Conversely, large-scale wind power development in northern energy zones increased moderate-to-strong conflict areas (0.6 ≤ CSCI < 0.8) by 3.6%, with conflict intensity rising 28.3%. This coexistence of ecological restoration dividends and energy development costs reveals the inherent tension between standardized policies and regional complexity. For instance, concentrated wind turbine installations in gully-head areas of Huanxian, while meeting energy targets, have aggravated slope erosion and landslide risks (LUI–PRE interaction, q = 0.2583). These findings underscore the need to transition from goal-oriented to spatially adaptive policy design, establishing vertical compensation mechanisms such as gully development paired with plateau surface restoration.

5.3. SDGs-Oriented Pathways for Conflict Mitigation

To align with the UN Sustainable Development Goals (SDGs), Qingyang requires differentiated conflict resolution strategies:
  • SDG11 (Sustainable Cities)
Xifeng urban area should adopt 3D geological risk assessment to optimize spatial expansion, converting high-conflict zones along the Malian–Pu River corridor into ecological buffers. Transit-Oriented Development (TOD) models should reorganize the road–population axial belt.
  • SDG2 (Zero Hunger) and SDG15 (Life on Land)
Central plateau areas must implement water quotas for facility agriculture, integrating gully rainwater harvesting with drip irrigation to limit annual groundwater decline to <0.5 m. Northern energy zones could pilot ecological restoration bonds, allocating 20% of wind power revenue to gully-head stabilization, balancing development and conservation.

5.4. Limitations and Future Research Directions

The current static CSCI framework inadequately addresses dynamic factors like climate change and market fluctuations. For example, global energy price volatility may alter wind power development intensity, reshaping conflict patterns. Future studies could integrate Agent-Based Modeling (ABM) with climate scenarios to assess conflict evolution under policy combinations. Additionally, the Fuzzy Analytic Hierarchy Process (FAHP) could enhance weight assignment for nonlinear interactions in gully systems—a method validated in the Raohe Basin’s spatial zoning but requiring further adaptation to arid loess environments.

6. Conclusions

This study reveals the dynamic mechanisms of land-use conflicts in the gully region of the Loess Plateau through multi-scale integration of remote sensing data and geographical detector models, with the following key theoretical advances.
First, the spatial polarization of strong spatial conflict zones (CSCI ≥ 0.8) demonstrates that when gully density exceeds 3.5 km∙km−2, the synergistic effects of urban expansion (NL > 50) and transportation networks (RND > 0.8 km∙km2) trigger nonlinear escalation of conflict intensity (abrupt transition probability: 73%, p < 0.01). This finding verifies the strong dependence of territorial development on gully fragmentation and exposes the structural mismatch between homogeneous spatial governance policies and heterogeneous geomorphic characteristics.
Second, the grain-for-green program expanded weak spatial conflict zones by 23.6% through NDVI enhancement, yet its ecological benefits were partially offset by a 700% surge in mining–industrial spaces, forming a restoration–compression negative feedback loop. The dominant interaction between NDVI and LUI (q = 0.2583) indicates that the conflict evolution is fundamentally driven by the competition between ecological recovery and industrialization/urbanization. This mechanism becomes particularly pronounced in areas with gully density exceeding 3.2 km·km−2, corroborating the nonlinear cumulative effects of human-environment system vulnerability.
Third, the coexistence of conflict mitigation from afforestation and conflict aggravation from energy development reflects the spatial adaptability gap between policy objectives and geographic contexts. In the Huanxian–Huachi wind power corridor, a 28.3 percentage points surge in conflict intensity suggests that energy expansion in ecologically fragile areas may trigger development-disaster chain reactions (e.g., LUI–PRE synergy amplifying landslide risks). Simultaneously, groundwater depletion caused by facility agriculture in central Ningxian highlights the limitations of unidimensional policy design.
Finally, by quantifying the critical regulatory role of gully density thresholds on spatial conflicts, this study transcends the traditional linear phenomenon-factor analytical framework in conflict research and establishes a geomorphology-process-policy adaptive theoretical model. These advancements provide scientific foundations for transforming territorial spatial governance in fragile ecosystems from passive response to geographic design-oriented strategies, particularly establishing methodological bases for multi-scale conflict early warning and differentiated ecological compensation mechanisms.

Author Contributions

Conceptualization, M.Z. and X.T.; methodology, M.Z.; software, M.Z.; validation, X.T.; formal analysis, M.Z. and X.T.; investigation, M.Z.; resources, X.T.; data curation, M.Z.; writing—original draft preparation, M.Z.; writing—review and editing, M.Z.; visualization, M.Z.; supervision, X.T.; project administration, X.T.; funding acquisition, X.T. All authors have read and agreed to the published version of the manuscript.

Funding

This research was funded by the the Regional Science Foundation and the National Natural Science Foundation of China (grant number 52068040).

Institutional Review Board Statement

Not applicable.

Informed Consent Statement

Not applicable.

Data Availability Statement

All data supporting the findings of this study are included in this article.

Acknowledgments

We would like to express our gratitude to the Resource and Environmental Science and Data Center of the Chinese Academy of Sciences for providing the land use/land cover remote sensing data that were fundamental to our analysis. We also extend our appreciation to the experts and colleagues at Lanzhou Jiaotong University for their valuable feedback and technical support. Special thanks to the local government of Qingyang City for offering essential information and field access during the study. Finally, we are deeply grateful to our families and friends for their continued support and encouragement throughout this research.

Conflicts of Interest

The authors declare no conflict of interest.

References

  1. Liu, J.; Ning, J.; Kuang, W.; Xu, X.; Zhang, S.; Yan, C.; Li, R.; Wu, S.; Hu, Y.; Du, G.; et al. Spatio-temporal patterns and characteristics of land-use change in China during 2010–2015. Acta Geogr. Sin. 2018, 73, 789–802. [Google Scholar] [CrossRef]
  2. Adam, Y.O.; Pretzsch, J.; Darr, D. Land Use Conflicts in Central Sudan: Perception and Local Coping Mechanisms. Land Use Policy 2015, 42, 1–6. [Google Scholar] [CrossRef]
  3. Delphin, S.; Snyder, K.A.; Tanner, S.; Musálem, K.; Marsh, S.E.; Soto, J.R. Obstacles to the Development of Integrated Land-Use Planning in Developing Countries: The Case of Paraguay. Land 2022, 11, 1339. [Google Scholar] [CrossRef]
  4. Wang, G.; Wang, J.; Wang, L.; Zhang, Y.; Zhang, W. Land-Use Conflict Dynamics, Patterns, and Drivers under Rapid Urbanization. Land 2024, 13, 1317. [Google Scholar] [CrossRef]
  5. Zhao, G.; Mu, X.; Wen, Z.; Wang, F.; Gao, P. Soil Erosion, Conservation, and Eco-Environment Changes in the Loess Plateau of China. Land Degrad. Dev. 2013, 24, 499–510. [Google Scholar] [CrossRef]
  6. Long, H.; Kong, X.; Hu, S.; Li, Y. Land Use Transitions under Rapid Urbanization: A Perspective from Developing China. Land 2021, 10, 935. [Google Scholar] [CrossRef]
  7. Zhang, L.; Zhou, D.; Fan, J.; Zhang, H.; Yue, X. Consistency analysis of the spatial distribution patterns and their drivers of the ecological vulnerability on the Loess Plateau. Acta Ecol. Sin. 2024, 44, 10096–10105. [Google Scholar] [CrossRef]
  8. Zhang, Y.; Man, X.; Zhang, Y. From “Division” to “Integration”: Evolution and Reform of China’s Spatial Planning System. Buildings 2023, 13, 1555. [Google Scholar] [CrossRef]
  9. Yan, J.M.; Chen, H.; Xia, F.Z. Cognition, Direction and Path of Future Spatial Planning based on the Background of Multiple Planning Integration. China Land Sci. 2017, 31, 21–27+87. [Google Scholar]
  10. Liu, X.; Huang, M.; Lei, W. Spatiotemporal evolution of land use in ecologically fragile areas of the loess plateau in northern shaanxi. Chin. J. Agric. Resour. Reg. Plan. 2022, 44, 47–57. [Google Scholar]
  11. Wang, J.; Xu, C. Geodetector: Principle and prospective. Acta Geogr. Sin. 2017, 72, 116–134. [Google Scholar]
  12. Li, Z.; Yang, L.; Wang, G.; Hou, J.; Xin, Z.; Liu, G.; Fo, B. The management of soil and water conservation in the Loess Plateau of China: Present situations, problems, and counter-solutions. Acta Ecol. Sin. 2019, 39, 7398–7409. [Google Scholar]
  13. Shen, W.; Zhang, J.; Wang, K.; Zhang, S.; Wu, H.; Song, Y. Identification and differentiation of dominant ecological risks in the Loess Plateau: A case study of the middle Yellow River Basin. Acta Ecol. Sin. 2022, 42, 7417–7429. [Google Scholar]
  14. Qiao, Z.; Yang, Y. Land use change simulation: Progress, challenges, and prospects. Acta Ecol. Sin. 2022, 42, 5165–5176. [Google Scholar]
  15. He, C.; Zhang, J.; Liu, Z.; Huang, Q. Characteristics and Progress of Land Use/Cover Change Research during 1990–2018. J. Geogr. Sci. 2022, 32, 537–559. [Google Scholar] [CrossRef]
  16. Dang, A.N.; Kawasaki, A. Integrating biophysical and socio-economic factors for land-use and land-cover change projection in agricultural economic regions. Ecol. Model. 2017, 344, 29–37. [Google Scholar] [CrossRef]
  17. Liu, Y.; Zhou, Y. Territory Spatial Planning and National Governance System in China. Land Use Policy 2021, 102, 105288. [Google Scholar] [CrossRef]
  18. Zhou, G.P.; Long, H.L. The mechanism of land use transitions and optimization of territorial spatial development patterns: Analysis based on the spatial functions of land use benefits. J. Nat. Resour. 2023, 38, 2447–2463. [Google Scholar] [CrossRef]
  19. Song, Y.; Wang, J.; Ge, Y.; Xu, C. An Optimal Parameters-Based Geographical Detector Model Enhances Geographic Characteristics of Explanatory Variables for Spatial Heterogeneity Analysis: Cases with Different Types of Spatial Data. GIScience Remote Sens. 2020, 57, 593–610. [Google Scholar] [CrossRef]
  20. Wang, J.-F.; Hu, Y. Environmental Health Risk Detection with GeogDetector. Environ. Model. Softw. 2012, 33, 114–115. [Google Scholar] [CrossRef]
  21. Mei, W. Study on Structure of Collapsible Loess in China. Ph.D. Thesis, Taiyuan University of Technology, Taiyuan, China, 2010; p. 137. [Google Scholar]
  22. Li, F.; He, X.; Zhou, C. Advances in Researches on Slope Gradient Factor in Soil Erosion. Res. Soil Water Conserv. 2008, 15, 229–231. [Google Scholar]
  23. Wen, X.; Zhen, L. Soil erosion control practices in the Chinese Loess Plateau: A systematic review. Environ. Dev. 2020, 34, 100493. [Google Scholar] [CrossRef]
  24. Han, Y.; Gao, J.; Wang, B.; Liu, C.; Wang, J.; Tuo, X. Evaluation of soil conservation function and its values in major eco-function areas of Loess Plateau in eastern Gansu province. Trans. Chin. Soc. Agric. Eng. 2012, 28, 78–85+294. [Google Scholar]
  25. Gai, A. Study on Land Use/Cover Change and Land Ecological Security Based on3S Technique in Qingyang City. Ph.D. Thesis, Gansu Agricultural University, Lanzhou, China, 2013; pp. 164–165. [Google Scholar]
  26. Available online: https://gi.mnr.gov.cn/202001/t20200120_2498397.html (accessed on 20 December 2024).
  27. Available online: https://www.gov.cn/zhengce/zhengceku/2020-01/22/content_5471523.htm (accessed on 20 December 2024).
  28. Gao, L. Measurement and Regulation of Land Use Spatial Conflict in Jining City. Master’s Thesis, Shandong Agricultural University, Tai’an, China, 2019. [Google Scholar]
  29. Wang, X.; Xie, B.; Pei, T.; Chen, Y.; Shen, Y. Measurement of spatial conflicts and multi-scenario simulation of ‘production-living-ecological’ spaces in the Lanzhou-Xining Urban Agglomeration based on the MOP-PLUS model. Res. Soil Water Conserv. 2025, 32, 363–372. [Google Scholar] [CrossRef]
  30. Tian, L.; Lv, S.; Wu, Z.; Wang, J.; Shi, X. Changes and spatial conflict measurement of land use in Urumqi City. Remote Sens. Nat. Resour. 2023, 35, 282–291. [Google Scholar]
  31. Liu, X.; Li, X.; Chen, X.; Zhang, Y.; Li, G.; Chen, C. Coupling measurement and spatial conflict diagnosis between urbanization and ecological environment in Jiangsu Province of China. Trans. Chin. Soc. Agric. Eng. 2023, 39, 238–248. [Google Scholar]
  32. Liu, Y.; Lv, Y.; Fu, B. Implication and limitation of landscape metrics in delineating relationship between landscape pattern and soil erosion. Acta Ecol. Sin. 2011, 31, 267–275. [Google Scholar] [CrossRef]
  33. Liu, X.; Guo, Q. Landscape pattern in Northeast China based on moving window method. Chin. J. Appl. Ecol. 2009, 20, 1415–1422. [Google Scholar]
  34. Fang, Y.; Wang, J.; Huang, L.; Zhai, T. Determining and identifying key areas of ecosystem preservation and restoration for territorial spatial planning based on ecological security patterns: A case study of Yantai city. J. Nat. Resour. 2020, 35, 190–203. [Google Scholar]
  35. Feng, K.; Liu, Z.; Liu, S.; Liu, H. Evolution and influencing factors of population shrinkage in China’s border areas, 1990-2020. Resour. Sci. 2024, 46, 1045–1059. [Google Scholar]
  36. Peng, M.; Wei, Z. An Analysis of the Evolution of Spatial Planning and Its Theories in China Since 1949: Based on the Comprehensive Analysis of National Spatial Governance and Planning System Evolution. Planners 2021, 37, 54–60. [Google Scholar]
  37. Yong, L. Transport Infrastructure Investment, Regional Economic Growth and the Spatial Spillover Effects—Based on Highway and Marine’s Panel Data Analysis. China Ind. Econ. 2010, 12, 37–46. [Google Scholar] [CrossRef]
  38. Wang, B.; Shu, X.; Liao, F.; Li, Y.; Wan, Z. Spatiotemporal Evolution and Multi-Scenario Simulation of Land-Use Conflicts in the Poyang Lake Area Based on Optimal Landscape Scale. J. Soil Water Conserv. Res. 2024, 31, 336–347. [Google Scholar] [CrossRef]
  39. Chen, S.; Ai, D.; Fu, Y. Spatial conflict measurement and influencing factors based on ecological security: A case study of Kunming City. J. China Agric. Univ. 2020, 25, 141–150. [Google Scholar]
  40. Wang, Z.; Zheng, B.; He, X.; Zhang, Y.; Shen, H. Spatial-temporal variations and influencing factors of glacial lakes in Tibet based on Optimal Parameters-Based Geographical Detector. J. Glaciol. Geocryol. 2023, 45, 1950–1960. [Google Scholar]
  41. Zhang, R.; Chen, Y.; Zhang, X.; Fang, X.; Ma, Q.; Ren, L. Spatial-Temporal Pattern and Driving Factors of Flash Flood Disasters in Jiangxi Province Analyzed by Optimal Parameters-Based Geographical Detector. Geogr. Geo-Inf. Sci. 2021, 37, 72–80. [Google Scholar]
  42. Shi, Z.; Xie, H.; Wang, Z.; Hu, X.; Wang, X.; Xie, X.; Lin, H.; Liu, X. Analysis of spatiotemporal heterogeneity of habitat quality and their driving factors based on optimal parameters-based geographic detector for Fuzhou City, China. J. Environ. Eng. Technol. 2023, 13, 1921–1930. [Google Scholar]
  43. The Dataset Is Provided by National Cryosphere Desert Data Center. Available online: http://www.ncdc.ac.cn (accessed on 20 December 2024).
  44. Wen, Y. Sustainable Solutions to Groundwater Over-Extraction in Semi-Arid Regions: Evidence from Qingyang, China. Agric. Sci.-Technol. Inf. 2020, 23, 50–52. [Google Scholar] [CrossRef]
  45. Available online: https://www.gsdfszw.org.cn/gsxnj/qys_306/nxnj/ (accessed on 20 December 2024).
  46. Available online: https://www.zhp.gov.cn/UploadFiles/akjyhfj63/file/20231221/20231221145950_9483.pdf (accessed on 20 December 2024).
  47. Cao, Y.; Jiang, Y.; Feng, L.; Shi, G.; He, H.; Yang, J. Identifcation of Territorial Spatial Pattern Conficts in Aksu River Basin, China, from 1990 to 2020. Sustainability 2022, 14, 14941. [Google Scholar] [CrossRef]
  48. Chen, L.; Cai, H. Study on Land Use Conflict Identification and Territorial Spatial Zoning Control in Rao River Basin, Jiangxi Province, China. Ecol. Indic. 2022, 145, 109594. [Google Scholar] [CrossRef]
  49. Meng, B.; Zhang, S.; Deng, W.; Peng, L.; Zhou, P.; Zhang, H. Identification and Analysis of Territorial Spatial Utilization Conflicts in Yibin Based on Multidimensional Perspective. Land 2023, 12, 1008. [Google Scholar] [CrossRef]
Figure 1. Location of the study area.
Sustainability 17 03552 g001
Figure 2. Spatial pattern characteristics of territorial space in Qingyang City (1990–2020).
Sustainability 17 03552 g002
Figure 3. Sankey diagram of territorial spatial transfers in Qingyang City (1990–2000).
Sustainability 17 03552 g003
Figure 4. Spatial pattern changes of territorial space structure in Qingyang City (1990–2020).
Sustainability 17 03552 g004
Figure 5. Evolution of territorial spatial conflicts in Qingyang City (1990–2020).
Sustainability 17 03552 g005
Figure 6. Interactions of influencing factors for territorial spatial conflicts in the Qingyang region.
Sustainability 17 03552 g006
Table 1. Territorial spatial classification system.
Territorial SpaceSpatial SubtypeSubtype
Code
Secondary Land Use Classification
Ecological spaceWater ecological space (WES)141. Graff;
42. Lake;
43. Reservoirs and ponds;
46. Intertidal zone.
Forest ecological space (FES)221. Forest land;
22. Shrubland;
23. Sparse wood;
24. Other forest land.
Grassland ecological space (GES)331. High cover grassland;
32. Medium cover grassland;
33. Low-coverage grassland.
Unutilized land (UL)461. Sandy land;
65. Bare land.
Urban spaceUrban living space (ULS)551. Urban land.
Industrial and mining production space (IMPS)653. Other construction land (including land for factories, mines, large industrial zones, oilfields, salt fields, quarries, as well as transportation land, roads, airports, and special use land).
Agricultural spaceAgricultural production space (APS)711. Paddy field;
12. Dry farm.
Rural living space (RLS)852. Rural residential land.
Table 2. Calculation method for the comprehensive index of territorial spatial conflicts.
Index NameCalculation Formula Formula Description
Spatial complexity index (CI) A W M P E D = i = 1 m j = 1 n 2 l n 0.25 p i j l n a i j a i j A (2)Pij represents the perimeter of the patch; aij denotes the area of the patch; A is the total area of the spatial type; ij refers to the jth spatial type within the ith spatial unit; m represents the total number of spatial evaluation units in the study area; and n is the total number of spatial types.
Spatial vulnerability index (FI) F I = i = 1 n F i × a i S (3)Fi represents the vulnerability index of spatial type i; n is the total number of spatial types; ai denotes the area of each spatial type within the unit; S is the total area of the spatial unit. According to the existing literature, the spatial vulnerability of Fi is ranked from highest to lowest as follows: construction land (6), forest land (5), water bodies (4), arable land (3), grassland (2), and unused land (1).
Spatial stability index (SI) S I = 1 P D P D m i n P D m a x P D m i n , P D = n i A (4)ni represents the number of patches of spatial type i within the spatial unit; A denotes the area of the spatial unit.
Comprehensive spatial conflict index (CSCI) C S C I = C I + F I S I (5)CSCI stands for the Comprehensive Spatial Conflict Index; CI, FI, and SI represent the Spatial Complexity Index, Spatial Vulnerability Index, and Spatial Stability Index, respectively.
Table 3. Comparison of different scale units.
Window UnitNumber of GridsTerrain Variation Retention (%)Gully Density (km·km−2)Moran’s IZ-Scorep-ValueData Volume (GB)
300 m × 300 m45,62092.73.5 ± 0.40.121.450.14718.6
1 km × 1 km12,81585.23.2 ± 0.30.586.320.0015.2
2 km × 2 km320468.92.1 ± 0.20.374.110.0031.3
3 km × 3 km142354.31.3 ± 0.10.242.890.0120.7
Table 4. Proportion of territorial spatial area in Qingyang City, 1990–2020, by spatial type.
1990200020102020Absolute Change Δ (1990–2020)Relative Change Rate (%)
Ecological space (%)WES0.27%0.27%0.25%0.26%−0.01%−3.70%
FES11.72%11.59%13.11%13.14%+1.42%▲+12.10%
GES48.03%48.13%48.16%49.29%+1.26%▲+2.60%
UL0.01%0.01%0.02%0.03%+0.02%▲+200.00%●
Urban space (%)ULS0.06%0.06%0.12%0.19%+0.13%▲+216.70%●
IMPS0.01%0.01%0.04%0.08%+0.07%▲+700.00%●
Agricultural space (%)APS38.98%38.91%37.03%35.62%−3.36%▼−8.62%
RLS0.94%1.02%1.28%1.39%+0.45%▲+47.90%
Symbols: ▲ Significant increase (Δ ≥ 0.02% or growth rate ≥ 20%); ▼ Significant decrease (Δ ≤ −0.5% or decrease rate ≥ 5%); ● Exceptionally high growth rate (≥200%).
Table 5. Calculation results of the comprehensive territorial spatial conflict index for Qingyang City (1990–2020).
Type of Spatial Conflict1990200020102020
Quantity (Number)Proportion (%)Quantity (Number)Proportion (%)Quantity (Number)Proportion (%)Quantity (Number)Proportion (%)
Weak spatial conflict (≤0.2)39,20613.06%39,20613.06%123,74241.24%36,03812.00%
Moderately weak spatial conflict (0.2–0.4)232,56977.49%232,57377.49%168,91056.29%213,81871.19%
Moderate spatial conflict (0.4–0.6)25,7128.57%25,7188.57%44861.50%45,46615.14%
Moderately strong spatial conflict (0.6–0.8)19750.66%19770.66%18500.62%32171.07%
Strong spatial conflict (≥0.8)6690.22%6570.22%10770.36%18210.61%
Table 6. Influencing factors of territorial spatial conflicts in Qingyang City and their descriptions.
AttributeInfluencing FactorsData Source and DescriptionUnitSelection Rationale
Natural FactorsDigital elevation model (DEM)30 m resolution elevation data GDEM v2, sourced from the Geospatial Data Cloud site, Computer Network Information Center, Chinese Academy of Sciences. (http://www.gscloud.cn)
(accessed on 20 December 2024).
mTerrain element controlling land use patterns and spatial differentiation of ecological processes.
Slope (SL)Generated using the slope tool in ArcGIS, based on DEM data.degreeConstrains agricultural/construction activities; areas with slopes > 15° face development restrictions.
Topographic Relief (TR)The maximum elevation difference in the DEM (maximum DEM value − minimum DEM value), generated using the Focal Statistics tool in ArcGIS.dimensionlessPositively correlates with soil erosion and geological hazard risks.
Mean annual temperature (TEM)Geospatial Data Cloud platform of the Chinese Academy of Sciences, 1 km resolution. (http://www.resdc.cn)
(accessed on 20 December 2024)
degree centigradeClimatic driver affecting ecosystem productivity and agricultural suitability.
Mean annual precipitation (PRE)Geospatial Data Cloud platform of the Chinese Academy of Sciences, 1 km resolution. (http://www.resdc.cn)
(accessed on 20 December 2024)
mmPrecipitation patterns determine water resource capacity and constrain land use intensity in arid regions.
River network density (RID)Geospatial Data Cloud platform of the Chinese Academy of Sciences, 1 km resolution. (http://www.resdc.cn)
(accessed on 20 December 2024)
km∙km−2Reflects water resource distribution and flood risks, influencing human settlement safety and cropland quality.
Normalized difference vegetation index (NDVI)Based on MODIS 16-day 250 m continuous time series NDVI and EVI data products, from the Chinese Academy of Sciences (http://www.resdc.cn).
(accessed on 20 December 2024)
dimensionlessCore indicator of vegetation coverage, revealing ecological baseline quality and land degradation sensitivity.
Socioeconomic FactorsPopulation density (POP)Kilometer-grid data of population spatial distribution; Geospatial Data Cloud platform of the Chinese Academy of Sciences, 1 km resolution. (http://www.resdc.cn)
(accessed on 20 December 2024)
people∙km−2Indicative of human activity intensity, driving demand for residential and production land use.
Gross domestic product (GDP)The Geospatial Data Cloud platform of the Chinese Academy of Sciences, 1 km resolution. (http://www.resdc.cn)
(accessed on 20 December 2024)
CYN 10,000∙km−2Key metric of regional economic development, linked to industrial/urban land occupation.
Nighttime light index (NL)Derived from two sets of nighttime light remote sensing data: DMSP/OLS (1992–2013) and NPP/VIIRS (2012 to present); Geospatial Data Cloud platform of the Chinese Academy of Sciences, 1 km resolution. (http://www.resdc.cn)
(accessed on 20 December 2024)
dimensionlessCaptures spatial distribution of human activities, effectively identifying informal economy and hidden urbanization.
Land use intensity (LUI)The Comprehensive Index of Land Use Intensity reflects the overall level of land use intensification for all land use types within a specific year.dimensionlessIntegrates land development intensity, quantifying competition among production-living-ecological spaces.
L a = 100 × i = 1 n A i × C i (9)
In the formula, La represents the Comprehensive Land Use Intensity Index, Ai denotes the land use intensity classification index for the ith level, Ci is the percentage of land area for the ith land use intensity classification.
Locational Condition FactorsRoad network density (RND)Geospatial Data Cloud site, Computer Network Information Center, Chinese Academy of Sciences, 1 km resolution. (https://www.gscloud.cn)
(accessed on 20 December 2024)
km∙km−2Core metric of transportation accessibility, shaping economic locational advantages for land development.
Distance from county center (DCC)The coordinates of the county and district centers were obtained from Amap, and the Euclidean distance was calculated using the ArcGIS Euclidean Distance tool.kmCore variable in location theory, reflecting administrative center radiation effects and public service accessibility.
Table 7. Parameter combinations of different factors when the q value is at its maximum.
20002020
Variable FactorsSymbolBreak MethodNumber of BreaksVariable FactorsSymbolBreak MethodNumber of Breaks
TRX3Standard deviation9TEMX4Standard deviation9
DEMX1Quantile10NLX1010
RIDX710DCCX1210
GDPX99DEMX1Quantile10
NLX1010SLX2Geometric9
SLX2Geometric9TRX39
POPX87RIDX78
RNDX119POPX88
DCCX12Natural6GDPX99
TEMX4Equal10PREX5Equal10
PREX510NDVIX610
NDVIX69LUIX1310
LUIX1310RNDX11Natural9
Table 8. Detection results of single factors influencing territorial spatial conflicts in Qingyang City.
Impact Factors20002020
qpRanking by q ValueqpRanking by q Value
DEM0.0210060.020208
SL0.00180130.0090012
TR0.00200120.0135011
TEM0.0217050.019709
PRE0.1142030.135803
NDVI0.2083010.148102
RID0.00320.3206110.0048013
POP0.0079080.051205
GDP0.0917040.036406
NL0.00430.6163100.021507
RND0.0117070.056304
DCC0.0050090.0149010
LUI0.1409020.162201
Disclaimer/Publisher’s Note: The statements, opinions and data contained in all publications are solely those of the individual author(s) and contributor(s) and not of MDPI and/or the editor(s). MDPI and/or the editor(s) disclaim responsibility for any injury to people or property resulting from any ideas, methods, instructions or products referred to in the content.

