Article

The Influence of Vehicle Color on Speed Perception in Nighttime Driving Conditions

by
Nenad Marković
1,
Aleksandar Trifunović
1,*,
Tijana Ivanišević
2 and
Sreten Simović
3
1
Faculty of Transport and Traffic Engineering, University of Belgrade, 11000 Belgrade, Serbia
2
Department in Kragujevac, Academy of Professional Studies Sumadija, 34000 Kragujevac, Serbia
3
Faculty of Mechanical Engineering, University of Montenegro, 81000 Podgorica, Montenegro
*
Author to whom correspondence should be addressed.
Sustainability 2025, 17(8), 3591; https://doi.org/10.3390/su17083591
Submission received: 24 January 2025 / Revised: 10 April 2025 / Accepted: 11 April 2025 / Published: 16 April 2025
(This article belongs to the Special Issue Sustainable Transportation and Traffic Psychology)

Abstract

:
Vehicle color coatings have long been recognized as a factor influencing road safety, particularly regarding their impact on speed perception and crash risk. This study aims to examine how different vehicle color coatings affect drivers’ perception of speed under nighttime driving conditions, with a specific focus on sustainability and visibility. A controlled laboratory experiment was conducted using a driving simulator to replicate realistic night traffic scenarios. A total of 161 participants evaluated passenger vehicles in four distinct color treatments, white (high-reflective paint), yellow (matte safety film), blue (glossy metallic finish), and black (low-reflective coating), at two speeds: 30 km/h and 50 km/h. Participants’ perceived speeds were collected and analyzed using standardized statistical methods. Results indicated a consistent pattern: speed was overestimated at 30 km/h and underestimated at 50 km/h across all vehicle colors. Lighter-colored vehicles (white and yellow) were perceived as moving faster than darker-colored vehicles (blue and black), with significant differences between black and yellow (30 km/h), yellow and blue (30 km/h), and black and white (50 km/h). Additionally, female participants tended to estimate higher speeds than male participants across most conditions. Other individual factors, such as place of residence, driver’s license type, driving experience, and frequency of driving, also showed measurable effects on speed perception. By using a simulator and accounting for diverse demographic characteristics, the study highlights how perceptual biases related to vehicle color can influence driver behavior. These findings emphasize the importance of considering vehicle color in traffic safety strategies, including driver education, vehicle design, and policy development aimed at reducing crash risk.

1. Introduction

Road crashes are a persistent global problem, leading not only to serious public health consequences but also posing challenges to sustainable development [1,2,3,4,5]. Despite global efforts aimed at improving traffic safety, including initiatives that resulted in a 5% reduction in road traffic fatalities from 2010 to 2021, approximately 1.19 million people still lost their lives in road crashes in 2021 [6]. According to the World Health Organization, road traffic accidents accounted for 9.19% of all fatalities globally in 2020 [7]. Among the factors contributing to crashes, human behavior plays a predominant role, independently contributing to 92.24% of cases and, when combined with vehicle and infrastructure factors, accounting for 95.78% of crashes [8].
The perception of the traffic environment, and, in particular, the perception of vehicles, is a fundamental prerequisite for safe driving [9,10,11,12]. Studies consistently demonstrate that visual contrast between a vehicle and its background significantly affects its detectability [13], distance perception [14], and speed estimation [15,16]. Each perception is accompanied by interpretation and decision-making processes that form the basis of drivers’ actions on the road [17,18]. While various factors influencing crash risk have been explored in-depth, one variable that remains relatively underexplored is vehicle color [19,20]. Psychological research has shown that color influences both the visibility of objects [19] and human behavior [21,22]. Approximately 80% of the information drivers process is obtained visually, with color playing a major role in this process [23,24]. However, the specific effects of vehicle color on detectability, speed perception, and traffic safety have yet to be fully clarified [25]. The way drivers perceive vehicles of different colors depends on multiple interconnected factors, such as environmental lighting, road surfaces, and the contrast between the vehicle and its surroundings. Reduced contrast sensitivity, especially among older drivers, can significantly impair the detection of darker vehicles, particularly under low-light conditions [25,26,27]. Cognitive load and driver distractions, caused by complex driving environments or secondary tasks, may further impair visual attention and lead to errors in speed perception [28,29].
Recent advancements in human visual perception research, combined with sustainable transport practices, highlight the crucial role of environmental factors and cognitive load in vehicle recognition and speed estimation [30,31]. Studies using eye-tracking technology provide insights into how drivers allocate their attention, showing that certain vehicle colors attract more visual attention while others blend into the background, making them less noticeable in demanding traffic scenarios [32,33]. Additionally, virtual reality (VR) simulations offer a controlled environment to study drivers’ reactions to different vehicle colors by monitoring eye movements, reaction times, and speed estimation errors without exposing participants to real-world risks [34]. Parallel to traffic safety research, other scientific [35,36] domains have emphasized the need to quantify risks using advanced statistical methods [37,38]. Similarly, in traffic safety, it is essential to define and analyze the risks to which road users are exposed [39]. Further, modern vehicle design has prioritized color and lighting as key elements for improving road safety. Studies suggest that adaptive lighting systems and high-visibility coatings could reduce risks associated with poor contrast visibility, particularly in nighttime or adverse weather conditions [40,41]. Research into bio-inspired perception models also reveals how the human visual system processes color in dynamic environments, influencing key decisions such as braking and lane changes [42,43].
Despite these advancements, the connection between vehicle color and speed perception remains insufficiently examined in empirical studies. Existing literature confirms that light-colored vehicles, such as those yellow and white, are generally less likely to be involved in crashes compared to darker vehicles [19,20,26], such as those black, gray, or blue [44,45,46,47,48,49]. For example, yellow vehicles are reported to have the lowest crash risk due to their high visibility [44], while darker vehicles are more frequently linked to crashes, especially in low-light conditions [45,46,47,48,49]. However, some studies suggest that no single vehicle color guarantees greater safety compared to others [19,50]. Additionally, vehicle color has been found to affect drivers’ perception of distance and speed. Research indicates that blue and yellow objects tend to appear closer to drivers, while gray objects may seem farther away than they actually are [44,48]. Trifunović et al. [17] found that drivers estimated the distance to yellow and red objects more accurately than to blue and green objects. Wu [51,52] reported that red vehicles were associated with the smallest errors in speed estimation compared to green and blue vehicles.
Drivers’ perceptions are further influenced by demographic factors. Gender and age have been shown to play significant roles in driving behavior and speed perception. Male drivers are more prone to risky driving and speed underestimation, contributing to higher crash rates, while female drivers often display more cautious behavior, sometimes overestimating vehicle speeds [53,54,55,56,57]. Moreover, technical measures such as daytime running lights have been recommended to improve the visibility of darker vehicles, particularly at higher speeds and outside urban areas [12,49]. Pešić et al. [12] demonstrated that the activation of daytime running lights reduces speed estimation errors at speeds of 70 km/h and above.
Considering the lack of studies that specifically address the influence of vehicle color on speed perception under nighttime conditions, this research aims to fill that gap. The present study utilizes a driving simulator to collect empirical data on how vehicle color affects drivers’ speed perception in low-light environments and compares these findings with those obtained in daytime or well-lit scenarios.

2. Materials and Methods

The present experiment was carried out on a driving simulator, with the goal of analyzing the variations in the assessment of the speed of white vehicles with high-reflective paint (hereafter referred to as white vehicles), yellow vehicles coated with a matte safety film (hereafter referred to as yellow vehicles), blue vehicles featuring a glossy metallic finish (hereafter referred to as blue vehicles), and black vehicles treated with a low-reflective coating (hereafter referred to as black vehicles).

2.1. Carrying out the Experiment

The present experiment involved showing participants eight traffic scenarios featuring a passenger vehicle on the driving simulator: two scenarios with a white passenger vehicle, two with a yellow passenger vehicle, two with a blue passenger vehicle, and two with a black passenger vehicle. In all the mentioned scenarios, the passenger vehicle was traveling at speeds of 30 or 50 km/h. In this study, a driving simulator was used to simulate vehicle movement on a two-way, non-divided road under nighttime conditions [12]. To replicate realistic nighttime driving conditions, the simulator environment was set with reduced ambient lighting and a contrast ratio matching typical urban and rural night visibility levels. The luminance of the road surface and surrounding objects was calibrated based on prior studies on nighttime perception [58,59]. Headlights were the primary illumination source, and no additional street lighting was included to avoid artificial brightness effects. The focus was on the path features of uninterrupted driving, without roadside obstruction. The driving environment featured standard traffic signage and vegetation, with no additional objects included to avoid influencing participants’ expectations or causing distractions [12,15,16]. Respondents were tasked with estimating the speed of passenger cars—white, yellow, blue, and black—approaching them at speeds of 30 km/h and 50 km/h. Their judgments were provided orally [12,15], and an assistant entered the responses into an online questionnaire [16,17].
The survey also contained inquiries concerning demographic traits (sex, age, and residence location), ownership of a driver’s license (the type of driver’s license held by the participants, duration of holding the license), frequency of vehicle operation, and involvement in traffic accidents [12,15,16].

2.2. Stimuli

For the objectives of this study, a standardized approach was used to ensure uniformity in the visual representation of the experimental stimuli. The selection of vehicle colors was based on prior research on visibility, contrast sensitivity, and risk perception in traffic environments [60,61,62,63]. Each vehicle was displayed in a controlled digital environment within the simulator to maintain consistency in lighting, shading, and reflective properties. A ‘Renault’ type ‘Megane’ passenger vehicle was chosen as the experimental stimulus. This model was selected due to its common use in urban and suburban traffic, ensuring ecological validity in driver perception studies. The vehicles were presented in four distinct colors—white, yellow, blue, and black—to examine the influence of contrast and brightness on speed perception under nighttime driving conditions. Each vehicle maintained identical dimensions, measuring 4359 mm in length, 1814 mm in width, and 1447 mm in height. The white vehicle featured a high-reflective paint finish, enhancing its visibility in low-light conditions. The yellow vehicle was coated with a matte safety film, reducing glare while maintaining high visibility. The blue vehicle had a glossy metallic finish, and the black vehicle was treated with a low-reflective coating, making it the least conspicuous under nighttime conditions. By carefully selecting vehicle colors and finishes, the study aimed to simulate realistic visual conditions that drivers encounter on the road, ensuring that perceptual differences in speed estimation could be attributed primarily to color and contrast variations rather than other confounding factors.

Characteristics of the Driving Simulator

A driving simulator was employed to investigate how the color of a vehicle influences the perception of its speed. The simulator is outfitted with three 42-inch plasma screens, providing participants with a 180° horizontal and 50° vertical viewing angle. Each screen features a display quality of 1360 × 768 pixels and a refresh rate of 60 Hz [12,15,16]. Research has shown that a lateral viewing angle of at least 120° is necessary for accurate speed perception [12,15]. The simulator environment was designed to closely replicate real-world driving conditions, with realistic vehicle movement, standard traffic signage, and road characteristics, ensuring that participants’ perceptual judgments align with real-life scenarios [64,65,66]. To enhance realism, the brightness and contrast settings of the simulator screens were calibrated to match nighttime driving conditions, following recommendations from prior research on perceptual fidelity in driving simulations [67,68]. Additionally, auditory stimuli were incorporated to reinforce visual perception, as studies suggest that multi-sensory integration improves speed estimation accuracy [69,70]. The validity of driving simulators in speed perception studies has been confirmed in previous research, demonstrating a strong correlation between simulated and real-world speed estimation tasks [71,72]. These elements ensure that the experimental setup provides reliable insights into how vehicle color influences speed perception in real-world traffic environments.

2.3. Research Procedure

The study was carried out in September and October 2023, with respondents not receiving any remuneration for their involvement [12,15,16,17]. At the start of the experiment, each respondent was assigned a unique set of experimental stimuli sequence, which was determined through a random number generator [12,15,16]. To ensure uniformity in visual perception conditions, screen brightness and contrast levels were adjusted to align with human visual sensitivity under nighttime driving conditions [73,74]. These calibrations prevent perceptual distortions caused by artificial lighting, which can influence speed estimation accuracy [75,76]. The combination of realistic vehicle dynamics, calibrated visual settings, and auditory feedback strengthens the reliability of our findings in the context of real-world driving conditions.

2.4. Collecting and Processing Data

Data collection was carried out through an online questionnaire, and the responses were subsequently imported into MS Excel for further analysis [15]. The data evaluation was then conducted using IBM SPSS Statistics v.26 [15]. To evaluate the distribution’s normality, histograms were reviewed, and the Kolmogorov–Smirnov test was applied. Given that all variables followed a normal distribution, parametric statistical methods were employed [15,16]. To evaluate the significance of variations [12,15], the One-Sample test, Independent Samples t-Test, Paired-Samples t-Test, and One-way ANOVA were conducted [16,17].
The null hypothesis (H0) stated that there would be no significant difference in how participants perceived the speed of the vehicle. On the other hand, the alternative hypothesis (Ha) suggested that there would be significant differences in participants’ speed estimations, which could indicate the influence of various factors on how speed is perceived.
The significance level (α) was established at 5%. If the probability value (p) is 0.05 or lower, the null hypothesis (H0) is dismissed, and the alternative hypothesis (Ha) is accepted. However, if p is greater than 0.05, the null hypothesis (H0) stands.

3. Results

3.1. Socio-Demographic Data

A total of 161 respondents participated in the study. The majority were young drivers, which corresponds with global trends indicating that this group is more prone to speed misjudgment and traffic crashes. Although older drivers were underrepresented in the sample, their inclusion remains important, as previous research has demonstrated that cognitive processing speed, contrast sensitivity, and risk assessment change with age and influence speed perception accuracy [77,78,79]. Younger participants are generally characterized by quicker reaction times, better visual acuity, and greater adaptability to digital environments, including driving simulators [77,78,79]. On the other hand, age-related differences in visual processing and perception—particularly in contrast sensitivity and peripheral vision—have been shown to significantly affect how speed and vehicle motion are interpreted in traffic settings [80,81,82]. This highlights the need for future studies to include a more diverse age range to better capture perceptual differences across age groups.
Table 1 provides an overview of key participant characteristics, including age, gender, residence, education, license category, driving experience, driving frequency, and crash history. In terms of gender, 58.4% of the participants were male, and 41.6% were female, which is sufficiently balanced to support the analysis of gender-based differences. Prior studies have suggested that males typically rely more on motion perception cues, while females may be more influenced by contextual and environmental factors such as contrast and lighting [83,84]. Additionally, 42.9% of respondents reported being involved in a traffic crash, which may influence their perception of risk and speed estimation.

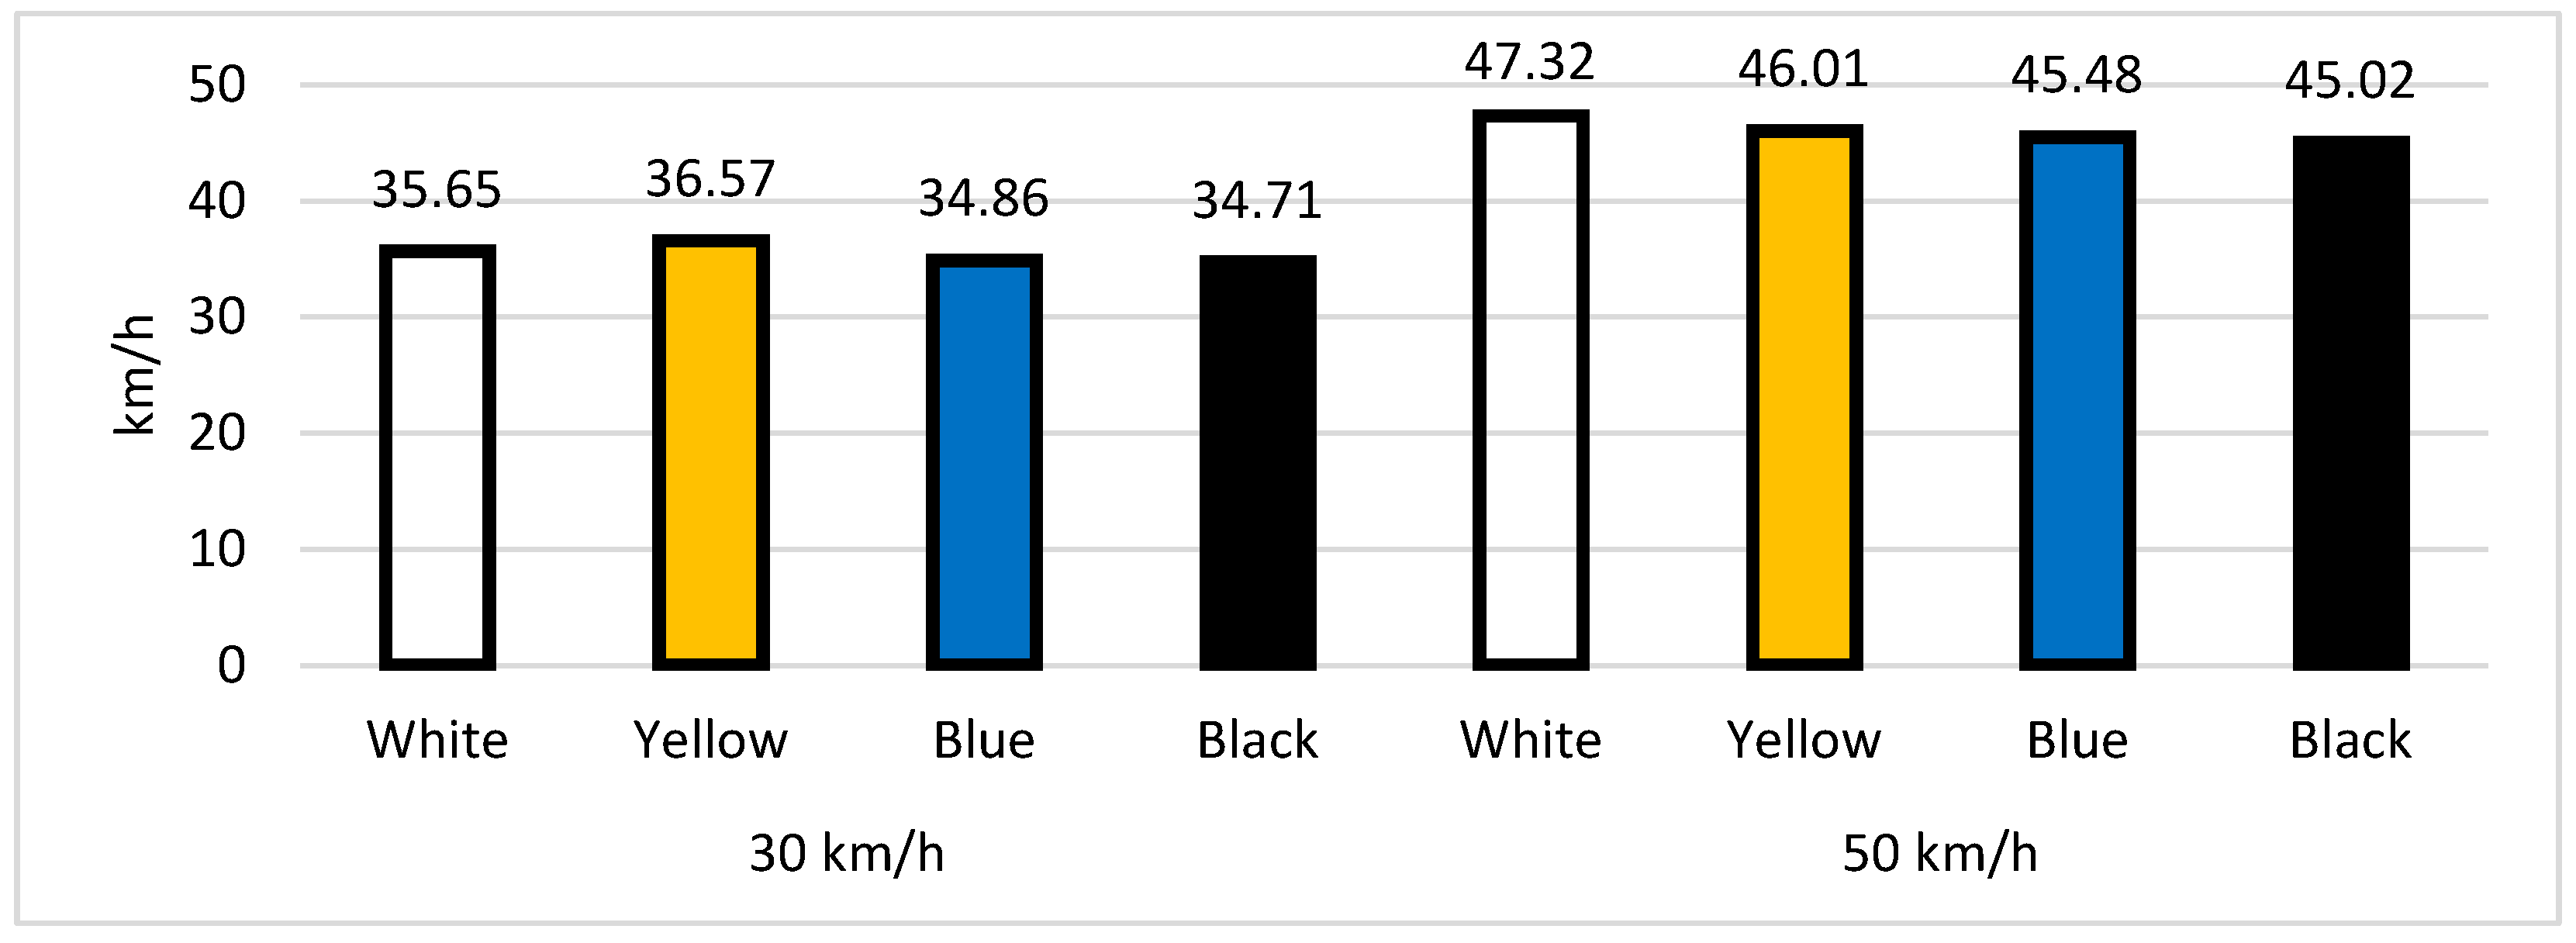
3.2. Evaluation of the Vehicle Speed Observed According to Colors

Figure 1 displayed the summary statistics of passenger vehicle speed as observed for various vehicle colors. The data indicated that participants generally overestimated the speed of the passenger vehicle at the evaluated speed of 30 km/h for all vehicle colors considered. Conversely, at the evaluated speed of 50 km/h, participants consistently underestimated the vehicle’s speed across all the vehicle colors examined.
Figure 2 depicts the mean inaccuracies in assessing passenger vehicle speed, illustrating how different vehicle colors influence estimation errors at speeds of 30 km/h and 50 km/h. The results indicate that respondents generally overestimate speed at 30 km/h and underestimate it at 50 km/h, with variations depending on the color of the vehicle. At 30 km/h, the greatest overestimation occurred for the yellow vehicle (M = −6.57), followed by the white vehicle (M = −5.65), while the blue (M = −4.86) and black (M = −4.71) vehicles were perceived with slightly lower errors. These findings suggest that lighter-colored vehicles tend to be perceived as moving faster than they actually are, likely due to higher contrast with the background in low-light conditions. Conversely, at 50 km/h, the pattern reverses, with respondents underestimating the vehicle’s speed. The black vehicle had the largest underestimation (M = 4.98), followed by blue (M = 4.52), yellow (M = 3.99), and white (M = 2.68). This suggests that darker vehicles may be perceived as moving slower, potentially due to reduced contrast and visibility in nighttime conditions. These results indicate that vehicle color significantly influences speed estimation errors. The outcomes of the One Sample test revealed a statistically important variation across all evaluated speeds and for every passenger vehicle color.
This section of the paper explored the potential link between passenger vehicle colors and speed estimation. The relationship between vehicle color and speed estimation was examined using the Paired-Samples T-Test. Notable differences were found between the black and yellow vehicles (F = −2.036; p = 0.043), as well as between the yellow and blue vehicles (F = 2.053; p = 0.042) at the 30 km/h speed. For the 50 km/h speed, significant variations were observed between the black and white vehicles (F = 2.325; p = 0.021).
Although the statistical analysis confirmed significant variations in speed perception based on vehicle color, several potential confounding variables could have influenced the results. Participants’ driving experience plays a critical role, as prior research suggests that experienced drivers rely more on motion perception cues, while less experienced drivers depend more on color contrast for speed estimation [51,85,86]. Additionally, gender-based differences have been observed in visual attention and risk assessment, where male drivers are typically more sensitive to motion-related cues, while female drivers may be more influenced by contextual elements, such as vehicle brightness and contrast [87,88].
Furthermore, environmental factors, such as ambient light conditions, exposure to different types of roadways, and personal familiarity with simulated driving scenarios, could have played a role in how participants estimated speed. While the experimental design aimed to control for external influences by using a standardized nighttime driving environment, variations in individual contrast sensitivity may have still introduced biases. These aspects should be further examined in future research, which could incorporate additional statistical controls to account for individual differences.
The observed differences in speed perception across vehicle colors can be explained through psychological and physiological mechanisms related to contrast sensitivity, visual attention, and cognitive biases in color processing. Research suggests that darker colors, such as black, tend to be perceived as moving slower due to lower contrast with the background, while brighter colors, particularly yellow, create a stronger visual contrast, leading to an overestimation of speed [89,90]. This aligns with theories of motion perception, where high-contrast objects appear to move faster than low-contrast objects in similar conditions [91,92]. Additionally, color psychology research indicates that warm colors (e.g., yellow, red) tend to attract more attention, potentially causing participants to perceive motion more vividly, whereas cooler colors (e.g., blue) are often associated with calmness and stability, leading to lower speed estimations [93,94]. These findings suggest that both perceptual and cognitive factors contribute to speed estimation errors, emphasizing the need for further exploration of individual differences in visual processing and their impact on road safety judgments.

3.3. Gender-Based Disparities in the Assessment of Passenger Vehicle Speed for Different Colors

The Independent Samples T-Test was conducted to assess gender-based differences in the estimation of passenger vehicle speeds, considering the color of the vehicle. The findings showed statistically significant variations in speed predictions for white (F = −2.372; p = 0.019) and black (F = −2.463; p = 0.015) vehicles at a speed of 30 km/h. Male participants made more precise speed predictions for both white vehicles (M = 33.128; SD = 13.960) and black vehicles (M = 32.426; SD = 13.086).
Female respondents generally overestimated the velocity of a passenger vehicle with a greater margin of error for all evaluated colors at 30 km/h. On the other hand, male respondents tended to make a larger error when assessing the vehicle’s velocity across all examined colors at 50 km/h.

3.4. Factorial ANOVA Results

A three-way factorial ANOVA was conducted to investigate the effects of speed (30 km/h vs. 50 km/h), gender (male vs. female), and vehicle color (white, yellow, blue, black) on drivers’ speed perception. The analysis revealed statistically significant main effects of speed, vehicle color, and gender. Participants systematically overestimated vehicle speeds at 30 km/h and underestimated them at 50 km/h (F = 1555.65, p < 0.001). Female participants consistently provided higher speed estimates compared to male participants (F = 56.28, p < 0.001). Additionally, lighter-colored vehicles (white and yellow) were perceived as moving faster than darker-colored vehicles (blue and black) (F = 5.88, p < 0.001).
A significant interaction between speed and color was detected (F = 4.03, p = 0.007), indicating that color-related differences in speed perception were more pronounced at lower speeds (30 km/h) than at higher speeds (50 km/h). No statistically significant interactions were found between gender and color, nor was the three-way interaction significant. The observed patterns are summarized in Figure 3, which highlights the combined effects of speed, gender, and vehicle color on drivers’ speed perception under low-light conditions.
Post hoc comparisons using Tukey’s HSD test showed that at 30 km/h, yellow vehicles were perceived as moving significantly faster than black vehicles (p < 0.05). Similarly, at 50 km/h, white vehicles were judged to be moving faster than black vehicles (p < 0.05).

3.5. Respondents’ Place of Residence and Estimation of the Passenger Vehicles’ Speed with Different Colors

The results of the One-way ANOVA indicated a statistically significant difference in the estimation of the speed of the black passenger vehicle at a speed of 30 km/h, depending on the drivers’ place of residence (F = 2.678; p = 0.024). The worst estimation of the passenger vehicle speed in terms of color and the biggest error in the estimation were given by respondents who lived in the ‘town’ (M = 45.000; SD = 16.832) category, while the best estimation and the smallest error in estimation were given by the respondents who lived in the city center (wider city area) (M = 30.727; SD = 12.438).

3.6. License Type and Assessment of the Passenger Vehicle Velocity for Various Colors

The outcomes of the One-way ANOVA showed a notable statistical difference in the assessment of the speed of a black passenger vehicle at 30 km/h (F = 2.697; p = 0.023) based on the categories of driver’s license class. Furthermore, significant variations were observed for the estimation of the speed of passenger vehicles in white (F = 4.555; p < 0.001), yellow (F = 4.346; p < 0.001), and black (F = 2.591; p = 0.028) colors at the evaluated speed of 50 km/h.

3.7. Years of Having a Driver’s License Class and Passenger Vehicle Speed Estimation for Different Colors

One-way ANOVA was performed to assess the variations in the evaluation of the speed of passenger vehicles of various colors based on the years of driver’s license class ownership. The findings revealed notable statistical variations between drivers with differing years of license ownership in estimating the speed of blue (F = 2.156; p = 0.034) and black (F = 2.652; p = 0.009) passenger vehicles at the tested speed of 30 km/h. Additionally, significant differences were found for the estimation of the speed of white (F = 3.360; p < 0.001) and yellow (F = 3.807; p < 0.001) passenger vehicles at the tested speed of 50 km/h.
The respondents with over 30 years of driving experience estimated the speed of the blue passenger vehicle with the least error (M = 30.000; SD = 7.638), while those with over 20 years of experience estimated the speed of the black passenger vehicle with the smallest error (M = 31.000; SD = 11.437) at a speed of 30 km/h. For the tested speed of 50 km/h, respondents with over 10 years of driving experience estimated the speed of the white passenger vehicle (M = 49.901; SD = 6.725) and the yellow passenger vehicle (M = 50.227; SD = 9.817) with the least error.

3.8. Driving Frequency and the Assessment of Speed for Passenger Vehicles of Different Colors

A one-way analysis of variance (One-way ANOVA) was employed to explore the connection between the frequency of motor vehicle usage and the assessment of passenger vehicle velocity for various colors. The outcomes of the One-way ANOVA showed considerable statistical variations in speed estimation based on driving frequency for yellow (F = 2.981; p = 0.013)-, blue (F = 2.697; p = 0.023)-, and black (F = 2.304; p = 0.047)-colored vehicles at a tested speed of 30 km/h. Additionally, a significant variation was observed for the white vehicle (F = 2.746; p = 0.021) at a tested speed of 50 km/h.

3.9. The Association Between Road Crashes and the Evaluation of Passenger Vehicle Speed for Different Colors

The possible connection between participants’ involvement in road crashes and the assessment of passenger vehicle velocity for various colors was examined using the Independent Samples t-Test. The findings revealed that no statistically meaningful differences existed in the evaluation of passenger vehicle speed for any of the evaluated colors or speeds.

4. Discussions

The present study explored how speed perception varies according to gender, vehicle color, and actual vehicle speed under nighttime conditions, contributing to an emerging body of research on visual perception in traffic environments with reduced visibility. These findings are particularly relevant when compared to past research conducted under daylight conditions.
Previous studies carried out during daytime or well-lit conditions have generally shown [18,19,25] that lighter-colored vehicles are more detectable and tend to be perceived as moving faster than darker-colored vehicles due to their higher contrast with the environment [44,45]. The results align with this pattern, showing that under nighttime conditions, white and yellow vehicles were also perceived as moving faster than black and blue vehicles. This suggests that the influence of contrast sensitivity on speed perception is consistent across lighting conditions, though it may be amplified at night when overall visibility is reduced. However, unlike some daylight studies where color effects may be less pronounced at higher speeds due to improved visual processing with better ambient lighting [44,48], the results demonstrated that the color effect on speed perception remained significant under nighttime conditions, especially at the lower speed of 30 km/h. This highlights the critical role of contrast and low ambient lighting in influencing drivers’ judgments.
In terms of gender differences, the findings corroborate earlier research which indicated that female drivers tend to provide higher speed estimates compared to male drivers [95,96,97]. While some studies suggest that this discrepancy may stem from neurological or cognitive processing differences, with males relying more on motion cues and females integrating color and contrast information more prominently, it is also important to consider other contributing factors. Driving experience, risk perception, and prior exposure to varying traffic and lighting conditions may also explain gender-based differences in speed perception [87,88]. Since this study did not control for these variables, future research should consider integrating these factors to gain a more nuanced understanding.
The present findings also offer insights into how drivers from different environmental backgrounds perceive vehicle speed. Respondents from urban areas, who are generally exposed to more complex traffic environments and higher visual stimulation, demonstrated better accuracy in speed estimation. Conversely, participants from less populated areas, potentially less accustomed to processing complex visual information, appeared to rely more on vehicle color contrast cues, leading to larger estimation errors, particularly for darker vehicles [4,17]. This observation is consistent with previous findings suggesting that traffic experience and environmental exposure can influence how individuals process motion-related visual stimuli. From a safety perspective, one of the most critical implications of this study is the connection between perceptual biases and risky driving behaviors [95,96,97]. The tendency to underestimate the speed of darker vehicles under nighttime conditions could contribute to dangerous decisions in situations such as merging or crossing intersections, where misjudging an oncoming vehicle’s speed can lead to collisions [98,99,100]. This pattern aligns with crash data indicating that dark-colored vehicles are overrepresented in intersection crashes. Similarly, the finding that male drivers are more likely to underestimate speed than female drivers may help explain gender-related differences in crash rates, particularly in risky scenarios such as overtaking. Additionally, the consistent overestimation of speed at lower velocities (30 km/h) and underestimation at higher velocities (50 km/h) observed in this study raises concerns regarding driver decision-making accuracy in urban environments, where speed limits often fall within this range. Such perceptual biases could influence critical behaviors such as gap acceptance and following distances.
Overall, this study extends existing research by providing empirical evidence that vehicle color, gender, and speed interact to influence speed perception under nighttime conditions. These findings have practical implications for traffic safety policies, driver education, and vehicle design standards aimed at reducing nighttime crash risk.

5. Conclusions

The findings of this study align with previous research on speed perception biases, confirming that drivers tend to overestimate speeds at lower velocities (30 km/h) and underestimate them at higher velocities (50 km/h) [28,29]. This pattern may be explained by perceptual adaptation and the relative motion of objects in low-light environments. From a safety perspective, the results reinforce that lighter-colored vehicles (yellow/white) are perceived as moving faster than darker-colored ones (black/blue), which can affect drivers’ decisions at intersections. These outcomes are in line with prior evidence highlighting the role of contrast sensitivity in vehicle detectability and distance estimation [4]. Gender-based differences were also observed, with female participants estimating higher speeds than males—findings that are consistent with research on gender-specific risk perception and cautious driving behavior [77,78,79,83,84]. Demographic factors such as place of residence, license category, and driving frequency further influenced perception accuracy, supporting the need to account for individual and contextual factors. Respondents showed greater accuracy when estimating the speed of dark-colored vehicles at 30 km/h and light-colored ones at 50 km/h. Cooler colors, such as blue, were perceived more accurately than warmer ones, like yellow, pointing to possible psychophysical underpinnings of color perception. These trends suggest the importance of perceptual training and awareness in driver education programs.
While the study provides valuable insights, certain limitations must be acknowledged. The controlled simulator environment may not fully replicate real-world complexity. The sample was predominantly young, limiting generalizability across age groups. Differences in driving experience, contrast sensitivity, and environmental familiarity may have influenced results and should be examined in future work.
Future research should address these limitations by including a more demographically diverse sample and incorporating additional variables such as a broader spectrum of vehicle colors and surface coatings (e.g., matte and metallic finishes), as well as varying speed levels, weather conditions, and lighting environments, including fog, dusk, and rain [80,81,82]. It is also important to investigate a wider range of vehicle types, such as motorcycles, buses, and trucks, in order to enhance the generalizability of findings. The validity of simulator-based findings should be further supported by field experiments or through the use of advanced driving simulations based on augmented reality (AR) technologies [101,102]. In addition, exploring how broader socio-economic and cultural contexts influence perception could further improve the interpretability and applicability of the results [103]. Furthermore, psychophysical factors, including cognitive style and visual acuity, should be taken into account, as they may influence individual differences in speed perception [37,104,105]. In line with recent advancements in data-driven modeling and intelligent navigation systems [106], future studies may also consider integrating vehicle trajectory data analysis and AI-enhanced route-planning approaches into driving behavior research [107].
These findings have direct implications for road safety and design. Vehicle manufacturers should consider optimizing coatings and reflective elements for better nighttime visibility. Urban planners could implement contrast-based signage and road markings to improve speed perception accuracy. Driver training programs should incorporate education about color perception and motion cues. Moreover, road infrastructure can be adapted to enhance contrast at key decision points, improving awareness of actual vehicle speeds [108].

Author Contributions

Conceptualization, A.T. and T.I.; methodology, S.S.; software, T.I.; validation, A.T. and N.M.; formal analysis, T.I.; investigation, S.S.; resources, A.T.; data curation, T.I.; writing—original draft preparation, T.I.; writing—review and editing, N.M.; visualization, N.M.; supervision, N.M.; project administration, T.I.; funding acquisition, A.T. All authors have read and agreed to the published version of the manuscript.

Funding

This research received no external funding.

Institutional Review Board Statement

Not applicable.

Informed Consent Statement

Not applicable.

Data Availability Statement

The original contributions presented in this study are included in the article. Further inquiries can be directed to the corresponding author.

Conflicts of Interest

The authors declare no conflicts of interest.

References

  1. Ahmed, S.K.; Mohammed, M.G.; Abdulqadir, S.O.; El-Kader, R.G.A.; El-Shall, N.A.; Chandran, D.; Rehman, M.E.U.; Dhama, K. Road traffic accidental injuries and deaths: A neglected global health issue. Health Sci. Rep. 2023, 6, e1240. [Google Scholar] [CrossRef] [PubMed]
  2. Hermawan, I.; Firdausy, C.M.; Rambe, K.R.; Zuhdi, F.; Erwidodo, N.; Nugraheni, R.D.; Malisan, J.; Isnasari, Y.; Marpaung, E.; Asshagab, S.M. Road traffic facilities, traffic accidents, and poverty: Lesson learned from Indonesia. Transp. Res. Interdiscip. Perspect. 2024, 28, 101273. [Google Scholar] [CrossRef]
  3. World Health Organization. Road Traffic Injuries. 2024. Available online: https://www.who.int/news-room/fact-sheets/detail/road-traffic-injuries (accessed on 27 January 2025).
  4. Chauca, E.N.P.; Vaca, L.A.L.; Campaña, G.G.R. Crashworthiness analysis based on vehicle color and driver perception. Espirales Rev. Multidiscip. Investig. 2023, 47, 35–47. [Google Scholar] [CrossRef]
  5. World Health Organization. Global Status Report on Road Safety. 2023. Available online: https://iris.who.int/bitstream/handle/10665/375016/9789240086517-eng.pdf?sequence=1 (accessed on 27 January 2025).
  6. Lian, Y.; Yasmin, S.; Haque, M.M. Influence of road safety policies on the long-term trends in fatal Crashes: A Gaussian Copula-based time series count model with an autoregressive moving average process. Accid. Anal. Prev. 2024, 211, 107795. [Google Scholar] [CrossRef]
  7. Abdulrahman, R.; Almoshaogeh, M.; Haider, H.; Alharbi, F.; Jamal, A. Development and application of a risk analysis methodology for road traffic accidents. Alex. Eng. J. 2025, 111, 293–305. [Google Scholar] [CrossRef]
  8. Road Safety Agency. Statistical Report on the State of Traffic Safety in the Republic of Serbia. 2023. Available online: https://www.abs.gov.rs/admin/upload/documents/20231010092110-statisticki-izvestaj-o-stanju-bezbednosti-saobracaja-u-republici-srbiji-za-2022.-godinu.pdf (accessed on 27 January 2025).
  9. Peña-García, A.; de Oña Lopez, R.; Espín Estrella, A.; Aznar Dols, F.; Calvo Poyo, F.J.; Molero Mesa, E.; de Oña López, J. Influence of daytime running lamps on visual reaction time of pedestrians when detecting turn indicators. J. Saf. Res. 2010, 41, 385–389. [Google Scholar] [CrossRef]
  10. Cavallo, V.; Pinto, M. Are car daytime running lights detrimental to motorcycle conspicuity? Accid. Anal. Prev. 2012, 49, 78–85. [Google Scholar] [CrossRef]
  11. Sparks, G.A.; Neudore, R.D.; Smith, A.E.; Wapman, K.R.; Zador, P.L. The effect of daytime running lights on crashes between two vehicles in Saskatchewan: A study of a government fleet. Accid. Anal. Prev. 1993, 25, 619–625. [Google Scholar] [CrossRef]
  12. Pešić, D.; Trifunović, A.; Ivković, I.; Čičević, S.; Žunjić, A. Evaluation of the effects of daytime running lights for passenger cars. Transp. Res. Part F Traffic Psychol. Behav. 2019, 66, 252–261. [Google Scholar] [CrossRef]
  13. Lee, Y.M.; Sheppard, E. The effect of lighting conditions and use of headlights on drivers’ perception and appraisal of approaching vehicles at junctions. Ergonomics 2018, 61, 444–455. [Google Scholar] [CrossRef]
  14. Marković, N.; Ivanišević, T.; Čičević, S.; Trifunović, A. Fuzzy Logic Model for Assessing Accident Proneness Based on Passenger Vehicle Speed in Real and Virtual Traffic Conditions. Mathematics 2024, 12, 421. [Google Scholar] [CrossRef]
  15. Simović, S.; Ivanišević, T.; Trifunović, A.; Čičević, S.; Taranović, D. What affects the e-bicycle speed perception in the era of eco-sustainable mobility: A driving simulator study. Sustainability 2021, 13, 5252. [Google Scholar] [CrossRef]
  16. Ivanišević, T.; Ivković, I.; Čičević, S.; Trifunović, A.; Pešić, D.; Vukšić, V.; Simović, S. The impact of daytime running (LED) lights on motorcycles speed estimation: A driving simulator study. Transp. Res. Part F Traffic Psychol. Behav. 2022, 90, 47–57. [Google Scholar]
  17. Trifunović, A.; Ivanišević, T.; Čičević, S.; Simović, S.; Vukšić, V.; Slović, Ž. Do Statistics Show Differences between Distance Estimations of 3D Objects in the Traffic Environment Using Glances, Side View Mirrors, and Camera Display? Mathematics 2023, 11, 1258. [Google Scholar] [CrossRef]
  18. Milić, A. Traffic Psychology; Faculty of Transport and Traffic Engineering: Belgrade, Serbia, 2007. [Google Scholar]
  19. Eustace, D.; Alanazi, F.K.; Hovey, P.W. Investigation of the effect of vehicle color on safety. Adv. Transp. Stud. 2019, 47, 77–88. [Google Scholar]
  20. Newstead, S.; D’Elia, A. Does vehicle colour influence crash risk? Saf. Sci. 2010, 48, 1327–1338. [Google Scholar] [CrossRef]
  21. Koenderink, J.; van Doorn, A.; Witzel, C.; Gegenfurtner, K. Hues of color afterimages. i-Perception 2020, 11, 2041669520903553. [Google Scholar] [CrossRef]
  22. Jonauskaite, D.; Parraga, C.A.; Quiblier, M.; Mohr, C. Feeling blue or seeing red? Similar patterns of emotion associations with colour patches and colour terms. i-Perception 2020, 11, 2041669520902484. [Google Scholar]
  23. Grandi, B.; Cardinali, M.G. Colours and price offers: How different price communications can affect sales and customers’ perceptions. J. Retail. Consum. Serv. 2022, 68, 103073. [Google Scholar] [CrossRef]
  24. Sawilla, S.; Keller, C.; Schlegel, T. Conflict Situations and Driving Behavior in Road Traffic—An Analysis Using Eyetracking and Stress Measurement on Car Drivers. In Lecture Notes in Computer Science; Springer International Publishing: Berlin/Heidelberg, Germany, 2020; pp. 86–103. [Google Scholar] [CrossRef]
  25. Wood, J.M. Nighttime driving: Visual, lighting and visibility challenges. Ophthalmic Physiol. Opt. 2020, 40, 187–201. [Google Scholar]
  26. Myburgh, L. Investigating Contrast Sensitivity as Part of the Assessment of visual Requirements for Driving. Master’s Thesis, University of the Free State, Bloemfontein, South Africa, 2023. [Google Scholar]
  27. Tang, Y.B. The Effects of Age and Glare on Driving. 2012. Available online: https://theses.lib.polyu.edu.hk/handle/200/6949 (accessed on 28 January 2025).
  28. Schütz, A.C.; Billino, J.; Bodrogi, P.; Polin, D.; Khanh, T.Q.; Gegenfurtner, K.R. Robust underestimation of speed during driving: A field study. Perception 2015, 44, 1356–1370. [Google Scholar] [CrossRef] [PubMed]
  29. Young, K.L.; Salmon, P.M.; Cornelissen, M. Distraction-induced driving error: An on-road examination of the errors made by distracted and undistracted drivers. Accid. Anal. Prev. 2013, 58, 218–225. [Google Scholar] [CrossRef] [PubMed]
  30. Krstačić, R.; Žužić, A.; Orehovački, T. Safety Aspects of In-Vehicle Infotainment Systems: A Systematic Literature Review from 2012 to 2023. Electronics 2024, 13, 2563. [Google Scholar]
  31. Mahomed, A.S.; Saha, A.K. Driver Posture Recognition: A Review. IEEE Access 2024, 12, 176301–176345. [Google Scholar] [CrossRef]
  32. Hu, C.; Bai, X.; Qi, L.; Chen, P.; Xue, G.; Mei, L. Vehicle color recognition with spatial pyramid deep learning. IEEE Trans. Intell. Transp. Syst. 2015, 16, 2925–2934. [Google Scholar]
  33. Wen, Y.; Lin, J.; Ming, Y.; Zhang, J.; Wu, X.; Bao, L.; Yu, K.; Xiao, Y. Role of inhibition in overcoming interferences of misconception under similar feature saliency: An eye-tracking study of the projectile motion problem. Phys. Rev. Phys. Educ. Res. 2024, 20, 020121. [Google Scholar] [CrossRef]
  34. Will, S. Development of a Presence Model for Driving Simulators Based on Speed Perception in a Motorcycle Riding Simulator. Ph.D. Thesis, Universität Würz-burg, Würz-burg, Germany, 2017. [Google Scholar]
  35. Senić, A.; Dobrodolac, M.; Stojadinović, Z. Development of Risk Quantification Models in Road Infrastructure Projects. Sustainability 2024, 16, 7694. [Google Scholar] [CrossRef]
  36. Senić, A.; Simić, N.; Dobrodolac, M.; Stojadinović, Z. Development of a Hybrid Model for Risk Assessment and Management in Complex Road Infrastructure Projects. Appl. Sci. 2025, 15, 2736. [Google Scholar] [CrossRef]
  37. Senić, A.; Dobrodolac, M.; Stojadinović, Z. Predicting Extension of Time and Increasing Contract Price in Road Infrastructure Projects Using a Sugeno Fuzzy Logic Model. Mathematics 2024, 12, 2852. [Google Scholar] [CrossRef]
  38. Senić, A.; Ivanović, M.; Dobrodolac, M.; Stojadinović, Z. Prioritization of Preventive Measures: A Multi-Criteria Approach to Risk Mitigation in Road Infrastructure Projects. Mathematics 2025, 13, 278. [Google Scholar] [CrossRef]
  39. Elvik, R. Some implications of an event-based definition of exposure to the risk of road accident. Accid. Anal. Prev. 2015, 76, 15–24. [Google Scholar] [CrossRef] [PubMed]
  40. Yuan, J.; Jiao, Z.; Chai, J.; Farnham, C.; Emura, K. Reflective coatings: Enhancing building performance and sustainability. Nano-Struct. Nano-Objects 2024, 39, 101296. [Google Scholar] [CrossRef]
  41. Rossi, G.; Iacomussi, P.; Zinzi, M. Lighting implications of urban mitigation strategies through cool pavements: Energy savings and visual comfort. Climate 2018, 6, 26. [Google Scholar] [CrossRef]
  42. Wang, W.; Qie, T.; Yang, C.; Liu, W.; Xiang, C.; Huang, K. An intelligent lane-changing behavior prediction and decision-making strategy for an autonomous vehicle. IEEE Trans. Ind. Electron. 2021, 69, 2927–2937. [Google Scholar] [CrossRef]
  43. Qu, D.; Zhang, K.; Song, H.; Wang, T.; Dai, S. Analysis of Lane-Changing Decision-Making Behavior of Autonomous Vehicles Based on Molecular Dynamics. Sensors 2022, 22, 7748. [Google Scholar] [CrossRef]
  44. Shin, S.; Lee, S. Correlation between Car Accident and Car Color for Intelligent Service. J. Intell. Inf. Syst. 2013, 19, 11–20. [Google Scholar] [CrossRef]
  45. Solomon, S.S.; King, J.G. Influence of color on fire vehicle accidents. J. Saf. Res. 1995, 26, 41–48. [Google Scholar] [CrossRef]
  46. Lardelli-Claret, P.; Luna-del-Castillo, D.; Jimenez-Moleon, J.; Femia-Marzo, P.; Moreno-Abril, O.; Bueno-Cavanillas, A. Does Vehicle Color Influence the Risk of being Passively Involved in a Collision? Epidemiology 2002, 13, 721–724. [Google Scholar] [CrossRef]
  47. Furness, S.; Connor, J.; Robnson, E.; Norton, R.; Ameratunga, S.; Jackson, R. Car color and risk of car crash injury: Populationbased case control study. Br. Med. J. 2003, 327, 1455–1456. [Google Scholar]
  48. Nathan, R.A. What’s the Safest Color for a Motor Vehicle? Traffic Saf. 1969, 69, 13. [Google Scholar]
  49. Monash University. An Investigation into the Relationship Between Vehicle Colour and Crash Risk. 2007. Available online: https://www.monash.edu/__data/assets/pdf_file/0007/216475/An-investigation-into-the-relationship-between-vehicle-colour-and-crash-risk.pdf (accessed on 28 January 2025).
  50. Owusu-Ansah, S.O. Investigation of the Relationship Between Vehicle Color and Safety. Master’s Thesis, University of Dayton, Dayton, OH, USA, 2010. [Google Scholar]
  51. Wu, C. The effects of vehicle color and travel direction on perceived speed error varies by judgment type among older pedestrians. Traffic Inj. Prev. 2024, 25, 925–932. [Google Scholar] [CrossRef] [PubMed]
  52. Wu, C. Impacts of brightness contrast, road environment complexity, travel direction and judgement type on speed perception errors among older adult pedestrians’ road-crossing decision-making. J. Ageing 2024, 43, 725–732. [Google Scholar] [CrossRef] [PubMed]
  53. Bener, A.; Crundall, D. Role of gender and driver behaviour in road traffic crashes. Int. J. Crashworthiness 2008, 13, 331–336. [Google Scholar] [CrossRef]
  54. Atombo, C.; Wu, C. Traffic safety climate factors in explaining driving behaviours and traffic crash involvement: Comparative study among male and female drivers. J. Road Saf. 2022, 33, 49–62. [Google Scholar] [CrossRef]
  55. Oltedal, S.; Rundmo, T. The effects of personality and gender on risky driving behaviour and accident involvement. Saf. Sci. 2006, 44, 621–628. [Google Scholar] [CrossRef]
  56. Gwyther, H.; Holland, C. The effect of age, gender and attitudes on self-regulation in driving. Accid. Anal. Prev. 2012, 45, 19–28. [Google Scholar] [CrossRef]
  57. Lim, T.; Stephens, A.N.; Sheppard, D. Personality and demographic differences in the perceived risks of potentially timid driving behaviours. Transp. Res. Part F Traffic Psychol. Behav. 2022, 88, 197–207. [Google Scholar] [CrossRef]
  58. Zhou, N.; Dong, W.; Wang, J.; Paul, J.C. Simulating human visual perception in nighttime illumination. Tsinghua Sci. Technol. 2009, 14, 133–138. [Google Scholar] [CrossRef]
  59. Liu, M.; Li, R.; Zhang, B.; Jiao, W.; Luo, T.; Portnov, B.A.; Zhang, H. Evaluation of perception and analysis of energy saving potential of nighttime illumination in different types of residential areas: A case study of Dalian, China. Sustain. Cities Soc. 2024, 114, 105753. [Google Scholar] [CrossRef]
  60. Gibson, J.J. A Theory of Direct Visual Perception. In The Psychology of Knowing; Royce, J., Rozenboom, W., Eds.; Gordon & Breach: New York, NY, USA, 1972. [Google Scholar]
  61. Čolić, Z. Multimedia Production; School of Electrical and Computer Engineering of Applied Studies: Belgrade, Serbia, 2011. [Google Scholar]
  62. Pešić, A.; Stephens, A.N.; Newnam, S.; Čičević, S.; Pešić, D.; Trifunović, A. Youth Perceptions and Attitudes towards Road Safety in Serbia. Systems 2022, 10, 191. [Google Scholar] [CrossRef]
  63. Law on Road Traffic Safety Publication No. 41/2009, 53/2010, 101/2011, 32/2013, 2/2018, 87/2018 23/2019, 128/2020 and 76/2023. 2023. Available online: https://www.paragraf.rs/propisi/zakon_o_bezbednosti_saobracaja_na_putevima.html (accessed on 28 January 2025).
  64. Kruijff, E.; Orlosky, J.; Kishishita, N.; Trepkowski, C.; Kiyokawa, K. The influence of label design on search performance and noticeability in wide field of view augmented reality displays. IEEE Trans. Vis. Comput. Graph. 2018, 25, 2821–2837. [Google Scholar] [CrossRef] [PubMed]
  65. Goedicke, D.; Li, J.; Evers, V.; Ju, W. Vr-oom: Virtual reality on-road driving simulation. In Proceedings of the 2018 CHI Conference on Human Factors in Computing Systems, Montreal, QC, Canada, 21–26 April 2018; pp. 1–11. [Google Scholar]
  66. Li, N.; Jain, J.J.; Busso, C. Modeling of driver behavior in real world scenarios using multiple noninvasive sensors. IEEE Trans. Multimed. 2013, 15, 1213–1225. [Google Scholar] [CrossRef]
  67. Jones, P.R.; Ungewiss, J.; Eichinger, P.; Wörner, M.; Crabb, D.P.; Schiefer, U. Contrast sensitivity and night driving in older people: Quantifying the relationship between visual acuity, contrast sensitivity, and hazard detection distance in a night-time driving simulator. Front. Hum. Neurosci. 2022, 16, 914459. [Google Scholar] [CrossRef] [PubMed]
  68. Hwang, A.D.; Peli, E. Development of a headlight glare simulator for a driving simulator. Transp. Res. Part C Emerg. Technol. 2013, 32, 129–143. [Google Scholar] [CrossRef]
  69. Hecht, D.; Reiner, M.; Karni, A. Multisensory enhancement: Gains in choice and in simple response times. Exp. Brain Res. 2008, 189, 133–143. [Google Scholar] [CrossRef]
  70. Peng, X.; Zhang, Y.; Jiménez-Navarro, D.; Serrano, A.; Myszkowski, K.; Sun, Q. Measuring and predicting multisensory reaction latency: A probabilistic model for visual-auditory integration. IEEE Trans. Vis. Comput. Graph. 2024, 30, 7364–7374. [Google Scholar] [CrossRef]
  71. Berthoz, A.; Bles, W.; Bülthoff, H.H.; Grácio, B.C.; Feenstra, P.; Filliard, N.; Wentink, M. Motion scaling for high-performance driving simulators. IEEE Trans. Hum. Mach. Syst. 2013, 43, 265–276. [Google Scholar] [CrossRef]
  72. Perello-March, J.R.; Burns, C.G.; Birrell, S.A.; Woodman, R.; Elliott, M.T. Physiological measures of risk perception in highly automated driving. IEEE Trans. Intell. Transp. Syst. 2022, 23, 4811–4822. [Google Scholar] [CrossRef]
  73. Eloholma, M.; Ketomäki, J.; Orreveteläinen, P.; Halonen, L. Visual performance in night-time driving conditions. Ophthalmic Physiol. Opt. 2006, 26, 254–263. [Google Scholar] [CrossRef]
  74. Kimlin, J.A.; Black, A.A.; Wood, J.M. Nighttime driving in older adults: Effects of glare and association with mesopic visual function. Opthalmology Vis. Sci. 2017, 58, 2796–2803. [Google Scholar] [CrossRef]
  75. Ryu, J.; Hashimoto, N.; Sato, M. Influence of resolution degradation on distance estimation in virtual space displaying static and dynamic image. In Proceedings of the 2005 International Conference on Cyberworlds (CW’05), Singapore, 23–25 November 2025; pp. 8–50. [Google Scholar]
  76. Zhu, S.; Zhang, X. Enabling high-precision visible light localization in today’s buildings. In Proceedings of the 15th Annual International Conference on Mobile Systems, Applications, and Services, Niagara Falls, NY, USA, 19–23 June 2017; pp. 96–108. [Google Scholar]
  77. Evans, T.; Stuckey, R.; Macdonald, W. Young drivers’ perceptions of risk and difficulty: Day versus night. Accid. Anal. Prev. 2020, 147, 105753. [Google Scholar] [CrossRef] [PubMed]
  78. Hassan, H.M.; Abdel-Aty, M.A. Exploring the safety implications of young drivers’ behavior, attitudes and perceptions. Accid. Anal. Prev. 2013, 50, 361–370. [Google Scholar] [CrossRef] [PubMed]
  79. Evans, T.; Stuckey, R.; Macdonald, W. Young drivers’ perception of hazards: Variation with experience and day versus night. Transp. Res. Part F Traffic Psychol. Behav. 2022, 88, 258–280. [Google Scholar] [CrossRef]
  80. Fällman, K. Cognition, Everyday Function and Driving Performance in Old Age; Linköping University Electronic Press: Linköping, Sweden, 2024. [Google Scholar]
  81. Dukic Willstrand, T.; Broberg, T.; Selander, H. Driving characteristics of older drivers and their relationship to the useful field of view test. Gerontology 2017, 63, 180–188. [Google Scholar] [CrossRef]
  82. Tomczak, M.V. Cognitive Impairment in Relation to On-Road Driving. Master’s Thesis, Department of Psychology, University of Alberta, Edmonton, AB, Canada, 2022. [Google Scholar]
  83. Lohman, D.F. The effect of speed-accuracy tradeoff on sex differences in mental rotation. Percept. Psychophys. 1986, 39, 427–436. [Google Scholar] [CrossRef]
  84. Brunner, F.; Ruedl, G.; Kopp, M.; Burtscher, M. Factors associated with the perception of speed among recreational skiers. PLoS ONE 2015, 10, e0132002. [Google Scholar] [CrossRef]
  85. Diederichs, F.; Muthumani, A.; Feierle, A.; Galle, M.; Mathis, L.A.; Bopp-Bertenbreiter, V.; Bengler, K. Improving driver performance and experience in assisted and automated driving with visual cues in the steering wheel. IEEE Trans. Intell. Transp. Syst. 2022, 23, 4843–4852. [Google Scholar] [CrossRef]
  86. Shinar, D. Driver information processing: Attention, perception, reaction time, and comprehension. In Traffic Safety and Human Behavior; Emerald Publishing Limited: Leeds, UK, 2017; pp. 189–256. [Google Scholar]
  87. Struckman-Johnson, C.; Gaster, S.; Struc Stone kman-Johnson, D.; Johnson, M.; May-Shinagle, G. Gender differences in psychosocial predictors of texting while driving. Accid. Anal. Prev. 2015, 74, 218–228. [Google Scholar] [CrossRef]
  88. Cordellieri, P.; Baralla, F.; Ferlazzo, F.; Sgalla, R.; Piccardi, L.; Giannini, A.M. Gender effects in young road users on road safety attitudes, behaviors and risk perception. Front. Psychol. 2016, 7, 1412. [Google Scholar] [CrossRef]
  89. Stone, L.S.; Thompson, P. Human speed perception is contrast dependent. Vis. Res. 1992, 32, 1535–1549. [Google Scholar] [CrossRef]
  90. Blakemore, M.R.; Snowden, R.J. The effect of contrast upon perceived speed: A general phenomenon? Perception 1999, 28, 33–48. [Google Scholar] [CrossRef] [PubMed]
  91. Bobick, A.F. Movement, activity and action: The role of knowledge in the perception of motion. Philosophical Transactions of the Royal Society of London. Ser. B Biol. Sci. 1997, 352, 1257–1265. [Google Scholar] [CrossRef] [PubMed]
  92. De Silva, H.R. An analysis of the visual perception of movement 1. Br. J. Psychol. Gen. Sect. 1929, 19, 268–305. [Google Scholar]
  93. Elliot, A.J.; Maier, M.A. Color psychology: Effects of perceiving color on psychological functioning in humans. Annu. Rev. Psychol. 2014, 65, 95–120. [Google Scholar] [CrossRef]
  94. Livingstone, M.; Hubel, D. Segregation of form, color, movement, and depth: Anatomy, physiology, and perception. Science 1988, 240, 740–749. [Google Scholar] [CrossRef]
  95. Chen, C.; Mitsudo, H. The gender-based facing bias in 3-D biological motion perception. Perception 2023, 52, 183–194. [Google Scholar] [CrossRef]
  96. Liu, D.Y.; Li, M.; Yu, J.; Gao, Y.; Zhang, X.; Hu, D.; Zhu, J. Sex differences in the human brain related to visual motion perception. Biol. Sex Differ. 2024, 15, 92. [Google Scholar] [CrossRef]
  97. Agnew, H.C.; Phillips, L.H.; Pilz, K.S. Visual attention, biological motion perception, and healthy ageing. Psychol. Res. 2020, 84, 625–642. [Google Scholar] [CrossRef]
  98. Allen, T.; McClure, R.; Newstead, S.V.; Lenné, M.G.; Hillard, P.; Symmons, M.; Day, L. Exposure factors of Victoria’s active motorcycle fleet related to serious injury crash risk. Traffic Inj. Prev. 2016, 17, 870–877. [Google Scholar] [CrossRef]
  99. Austin, R. Traffic Violence, Disparate Pedestrian Deaths, and Transportation Justice via Vision Zero; Public Law Research Paper; University of Pennsylvania: Philadelphia, PA, USA, 2024. [Google Scholar]
  100. Hussain, Q.; Alhajyaseen, W.K.; Pirdavani, A.; Reinolsmann, N.; Brijs, K.; Brijs, T. Speed perception and actual speed in a driving simulator and real-world: A validation study. Transp. Res. Part F Traffic Psychol. Behav. 2019, 62, 637–650. [Google Scholar] [CrossRef]
  101. Ivan, K.; Haidu, I.; Benedek, J.; Ciobanu, S.M. Identification of traffic accident risk-prone areas under low-light conditions. Nat. Hazards Earth Syst. Sci. 2015, 15, 2059–2068. [Google Scholar] [CrossRef]
  102. King, M.J.; Wood, J.M.; Lacherez, P.F.; Marszalek, R.P. Optimism about safety and group-serving interpretations of safety among pedestrians and cyclists in relation to road use in general and under low light conditions. Accid. Anal. Prev. 2012, 44, 154–159. [Google Scholar] [CrossRef] [PubMed]
  103. Kovačević, M. Hijacked: How Neoliberalism Turned the Work Ethic against Workers and How Workers Can Take It Back. J. Appl. Philos. 2024, 41, 2. [Google Scholar] [CrossRef]
  104. Jurecki, R.S.; Stańczyk, T.L.; Ziubiński, M. Analysis of the Structure of Driver Maneuvers in Different Road Conditions. Energies 2022, 15, 7073. [Google Scholar] [CrossRef]
  105. Biassoni, F.; Gnerre, M. Understanding Elderly Drivers’ Perception of Advanced Driver Assistance Systems: A Systematic Review of Perceived Risks, Trust, Ease of Use, and Usefulness. Geriatrics 2024, 9, 144. [Google Scholar] [CrossRef]
  106. Chen, X.; Hu, R.; Luo, K.; Wu, H.; Biancardo, S.A.; Zheng, Y.; Xian, J. Intelligent ship route planning via an A∗ search model enhanced double-deep Q-network. Ocean Eng. 2025, 327, 120956. [Google Scholar] [CrossRef]
  107. Chen, S.; Piao, L.; Zang, X.; Luo, Q.; Li, J.; Yang, J.; Rong, J. Analyzing differences of highway lane-changing behavior using vehicle trajectory data. Phys. A Stat. Mech. Its Appl. 2023, 624, 128980. [Google Scholar] [CrossRef]
  108. Simić, N.; Ivanišević, N.; Nedeljković, Ð.; Senić, A.; Stojadinović, Z.; Ivanović, M. Early Highway Construction Cost Estimation: Selection of Key Cost Drivers. Sustainability 2023, 15, 5584. [Google Scholar] [CrossRef]
Figure 1. Summary statistics of the passenger vehicle speed observed based on the analyzed colors.
Sustainability 17 03591 g001
Figure 2. Average error in estimating the passenger vehicle speed observed according to the analyzed colors.
Sustainability 17 03591 g002
Figure 3. Mean estimated vehicle speeds by gender, vehicle color, and actual speed conditions (30 km/h and 50 km/h).
Sustainability 17 03591 g003
Table 1. Demographic and driving profile of the respondents.
Demographic Profile of the Respondents
AgeResidential AreaEducation Level
15–2555.3%City center31%Primary school8.6%
26–3518.6%Narrow urban area16.5%Secondary school43.8%
46–5514.9%Wider urban area20.5%Bachelor’s degree27.2%
55+11.20%Rural21.7%Master’s degree15.4%
Suburban10.3%Doctoral studies (PhD)5.0%
Driving Profile of Participants
Driver’s License CategoriesDriving ExperienceDriving Frequency
Motorcycles5.2%Less than 3 years32.9%Daily72.7%
Passenger vehicles78.3%3–5 years24.8%3 to 5 times per week18.1%
Trucks11.8%5–10 years28.6%Less than 3 times per week6.8%
Buses3.1%>10 years13.7%Rarely or never drives2.4%
Others4.6%
Disclaimer/Publisher’s Note: The statements, opinions and data contained in all publications are solely those of the individual author(s) and contributor(s) and not of MDPI and/or the editor(s). MDPI and/or the editor(s) disclaim responsibility for any injury to people or property resulting from any ideas, methods, instructions or products referred to in the content.

