Abstract
Solid waste governance actions are important to achieve sustainable urban development. This study uses the “zero-waste city” pilot policy as a natural experiment to evaluate the impact of solid waste governance actions on corporate environmental, social, and governance (ESG) performance. The research shows that solid waste governance actions improve corporate ESG performance by enhancing government environmental concerns, public environmental concerns, and corporate green innovation. The analysis of spillover effects indicates that solid waste governance exerts positive spatial spillover effects. Heterogeneity tests reveal that the positive effect of solid waste governance actions on corporate ESG performance is more pronounced in enterprises characterized by higher-quality information disclosure and stronger internal governance, industries with greater solid waste output and more advanced technology, regions with a closer government–market relationship, and in central–eastern regions. These findings contribute to understanding the micro-level effects of solid waste governance actions and the determinants of corporate ESG performance, providing valuable insights for other developing countries to govern solid waste and improve corporate ESG performance.
1. Introduction
In recent years, global ecological challenges—including resource waste, climate change, and waste accumulation—have intensified, prompting widespread governmental attention [1,2]. The United Nations’ “the 2030 Agenda for Sustainable Development” emphasizes the importance of environmental protection and sustainable development, with effective waste management being a crucial component (https://sdgs.un.org/sites/default/files/publications/21252030%20Agenda%20for%20Sustainable%20Development%20web.pdf (accessed on 9 April 2025)). Since the concept of “zero-waste” was first introduced in the 1970s, the development of Zero-Waste Cities has evolved into a global sustainable development objective. Cities such as San Francisco (United States), Sydney (Australia), Kamikatsu (Japan), and Vancouver (Canada) have successfully implemented zero-waste urban initiatives, providing valuable insights for global sustainable urban governance practices. Following its reform and opening-up policies, China has experienced rapid industrialization and urbanization, achieving remarkable economic progress. Nevertheless, the resource-intensive development paradigm has precipitated inefficient material usage and exponential growth in solid waste outputs. The annual generation of solid waste in China approaches 10 billion metric tons, with cumulative stockpiles exceeding 60–70 billion metric tons [2]. Conventional waste management practices—such as indiscriminate stockpiling, landfilling, and unregulated incineration—have caused cross-system environmental degradation, compromising urban soil, air quality, and groundwater resources. These practices collectively pose public health risks and create systemic barriers to ecologically sustainable urban development.
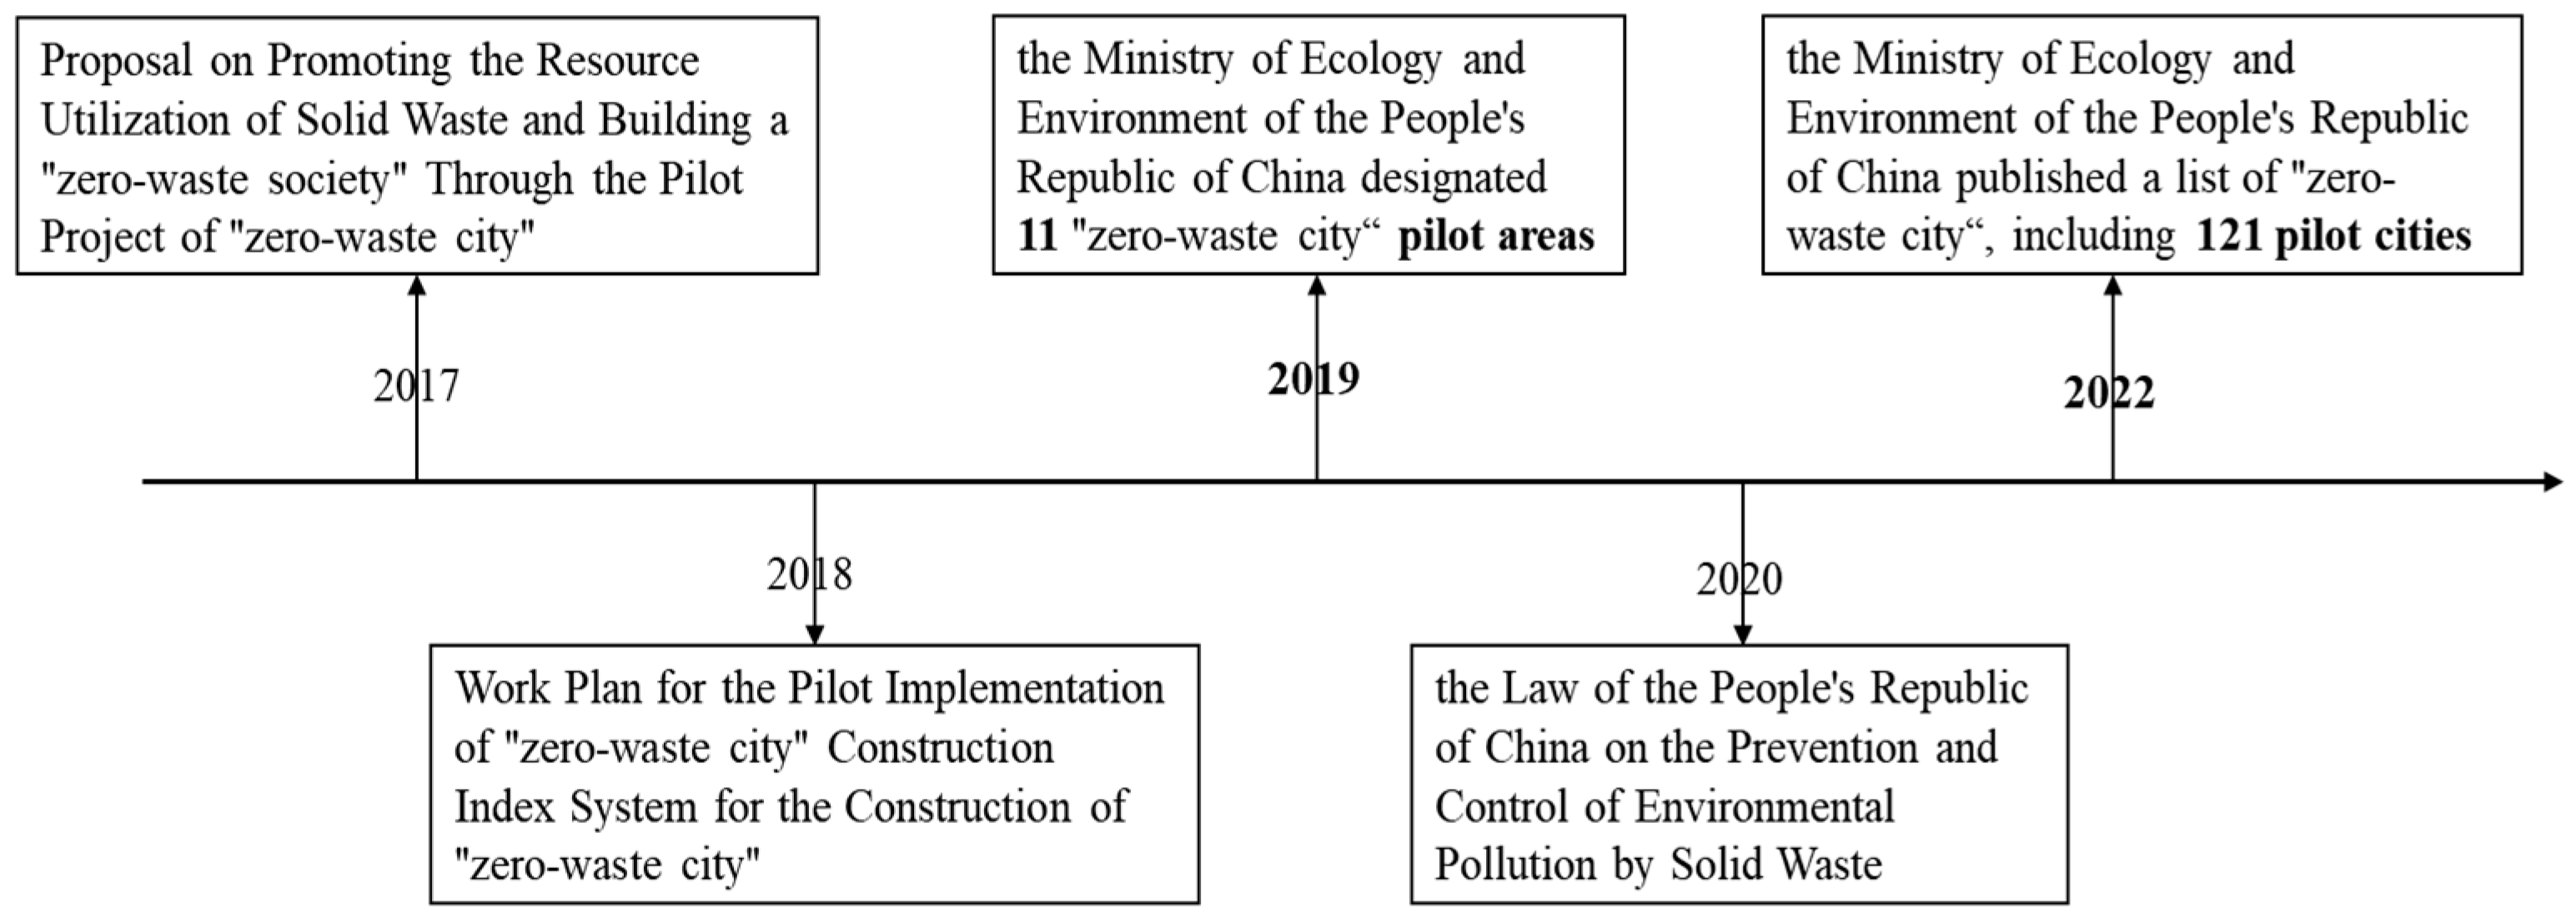
To address environmental challenges posed by solid waste, China has implemented progressive governance measures in this domain (see Figure 1). In 2017, the Chinese Academy of Engineering proposed the “Proposal on Promoting the Resource Utilization of Solid Waste and Building a ‘zero-waste society’ Through the Pilot Project of ‘zero-waste city’”, which received significant guidance from the central leadership (https://www.tsinghua.edu.cn/info/1662/110875.htm (accessed on 9 April 2025)). In 2018, the General Office of the State Council of the People’s Republic of China issued the “Work Plan for the Pilot Implementation of ‘zero-waste city’ Construction” and the “Index System for the Construction of ‘zero-waste city’”. These documents delineated the objectives, principles, pilot scope, and primary tasks associated with the construction of a “zero-waste city” (https://www.gov.cn/zhengce/content/2019-01/21/content_5359620.htm (accessed on 9 April 2025)). In 2019, the Ministry of Ecology and Environment of the People’s Republic of China designated 11 cities, including Shenzhen, Baotou, and Xuzhou, as well as five representative areas, such as Xiong’an, as pilot demonstration zones of a “zero-waste city” (https://www.mee.gov.cn/xxgk2018/xxgk/xxgk01/201905/t20190505_701858.html (accessed on 9 April 2025)). In 2020, the National People’s Congress convened its 13th session, during which it reviewed and approved the “Law of the People’s Republic of China on the Prevention and Control of Environmental Pollution by Solid Waste” (hereinafter referred to as the “Solid Waste Law”). This legislation established a legal foundation for the development of “zero-waste city.” (https://www.mee.gov.cn/ywgz/fgbz/fl/202004/t20200430_777580.shtml (accessed on 9 April 2025)). In 2022, the Ministry of Ecology and Environment of the People’s Republic of China published a list of cities designated for “zero-waste city” development during the 14th Five-Year Plan period, which includes a total of 121 cities. This initiative further extends the scope of “zero-waste city” programs (https://www.mee.gov.cn/xxgk2018/xxgk/xxgk06/202204/t20220425_975920.html (accessed on 9 April 2025)).

Figure 1.
China’s solid waste governance policies.
As an important carrier of solid waste governance, enterprises can improve their ESG performance, which aligns closely with the “zero-waste city” pilot policy’s green and sustainable development concept [2,3]. This has significant implications for the sustainable development of cities [2,4]. Nevertheless, the adoption of environmental and social responsibilities by corporations can generate negative externalities [5,6]. Achieving significant improvements in ESG performance cannot be accomplished solely through market forces and corporate awareness. The guidance and supervision of environmental regulation are indispensable [7,8,9]. Existing scholarship has extensively investigated the impacts of environmental regulations on corporate environmental responsibility compliance, firm valuation, and ESG performance [6,7,8,9], with studies broadly categorized into two streams: the pollution haven hypothesis [10] and the Porter hypothesis [11]. However, research on the environmental regulation within the solid waste governance sector is relatively limited, particularly regarding the examination of typical environmental regulations associated with “zero-waste city” construction. Current research on solid waste governance and the “zero-waste city” pilot policy primarily consists of synthesizing experiences from various countries and conducting case analyses [12,13,14,15]. Limited empirical studies have primarily examined the policy effects of solid waste governance at the city level [2,4]. The research investigating the economic consequences of solid waste governance from the perspective of enterprises is limited.
Therefore, this study examines the impact of solid waste governance actions on corporate ESG performance, using a quasi-natural experiment based on the “zero-waste city” pilot policy. The research focuses on listed companies in China’s Shanghai and Shenzhen A-share markets over the period 2014–2023. The key innovations are reflected in the following two aspects: On one hand, it is the first to apply a Staggered Difference-in-Differences (DID) method to analyze the impact of solid waste governance on corporate ESG performance. As global solid waste generation increases yearly and environmental pollution worsens, it is vital to explore if corporate ESG performance is affected by solid waste governance. This research examines how China’s solid waste governance influences corporate ESG performance and reveals the underlying mechanisms, adding a new perspective to the existing research on factors shaping corporate ESG performance. On the other hand, this study deepens the understanding of solid waste governance by viewing it through the lens of enterprises as microeconomic entities, thus expanding the research scope. Unlike prior studies that mainly focused on specific cases and experience summaries in solid waste governance, this study uses the “zero-waste city” pilot policy as a case study. It explores the micro-level effects of solid waste governance on corporate ESG performance, which helps address potential endogeneity issues and enriches the existing research.
2. Hypothesis Development
In line with contemporary corporate governance and stakeholder theories, enterprises are expected to be accountable to a diverse range of stakeholders, including governments, shareholders, and consumers, by prioritizing non-financial aspects and optimizing the collective interests of all stakeholders. However, enterprises often lack inherent motivation to undertake environmental and social responsibilities, primarily due to two factors. First, investments in non-financial areas may negatively impact shareholder interests and diminish the competitiveness of enterprises. Second, challenges such as resource scarcity, technological stagnation, conceptual backwardness, and information asymmetry hinder many enterprises from implementing effective environmental protection practices. Environmental regulations exert a significant deterrent and guiding influence, prompting enterprises to enhance their ESG performance.
As a solid waste governance practice, the “zero-waste city” pilot policy is regarded as a robust environmental regulatory measure. This policy mandates pilot cities to make substantial advancements in key areas and critical stages of solid waste governance. The total volume of industrial solid waste storage and disposal is targeted to approach zero growth. The reduction and resource utilization of solid waste is comprehensively enhanced. Incidents of illegal transfer and dumping of solid waste are to be eliminated. Furthermore, a number of backbone enterprises for the resource utilization of solid waste are to be fostered. On the one hand, according to the external pressure theory, solid waste governance actions can exert a deterrent effect [16,17]. The “zero-waste city” pilot policy has the potential to draw attention from external stakeholders, including government entities and the public. This external scrutiny can exert pressure on businesses, compelling management to prioritize solid waste governance. Enterprises are driven to reduce resource consumption and waste generation, enhance solid waste reuse practices, fulfill environmental obligations, and ultimately improve their ESG performance. On the other hand, solid waste governance actions play a significant role in providing guidance. ESG refers to the practice whereby enterprises integrate environmental, social, and governance factors into their operations and decision-making processes. The “zero-waste city” pilot policy serves as an effective framework for managing solid waste and fostering sustainable development, aligning closely with the principles of corporate ESG criteria. The government employs a range of policy measures, including subsidies and tax incentives, to guide and encourage enterprises to enhance green innovation in their production and R&D processes. This initiative aims to promote the reduction and efficient resource utilization of solid waste and enhance the proactive engagement of enterprises in improving corporate ESG performance.
H1.
Solid waste governance actions can enhance corporate ESG performance.
Improving ESG performance frequently conflicts with a company’s short-term profit maximization objectives. Therefore, enterprises often lack inherent motivation to enhance ESG performance. In this context, effective external incentives are essential for enterprises to enhance ESG performance. Existing research suggests that regulatory measures, administrative approaches, industrial policies, and public oversight are all salient factors influencing corporate decision-making [18]. The “zero-waste city” pilot policy, an environmental regulation focused on solid waste governance, aims to foster zero-waste enterprises and industries, achieving a model of sustainable urban development. This initiative is expected to influence corporate ESG performance. However, the mechanisms by which solid waste governance actions influence corporate ESG performance require further analysis.
On one hand, effective solid waste governance actions can bolster corporate ESG performance by heightening government environmental concerns. Firstly, environmental regulations can motivate companies to fulfill their responsibilities for environmental protection by providing some supports such as institutional guarantees, subsidies, and tax incentives [7,8]. The government plays a pivotal role in solid waste governance. Regarding policy support, the government has issued documents outlining the goals, tasks, and measures for developing a “zero-waste city.” These policy documents demonstrate the government’s commitment to addressing environmental issues and governing solid waste. At the implementation level, the “zero-waste city” pilot areas have formed a leadership group for the construction of these initiatives. This group is co-led by the Municipal Party Secretary and the Mayor, ensuring a unified and coordinated approach to promoting the pilot construction efforts. With regard to guarantees and incentives, the government supports the construction of a “zero-waste city” through various financial incentives. According to the “Action Plan for the Construction of a ‘zero-waste city’ in Anhui Province,” this support will be provided through financial assistance, taxation benefits, land allocation, talent development, and technological advancements. Secondly, environmental regulations may exert a deterrent effect, compelling enterprises to enhance their ESG performance. With regard to performance evaluation, the effectiveness of “zero-waste city” initiatives was incorporated into the evaluation framework for government performance in the pilot regions. To achieve these performance targets, local authorities will inevitably intensify their oversight of enterprises, thereby compelling enterprises to improve ESG performance. Regarding regulatory enforcement, the government integrates solid waste governance into corporate environmental credit assessments, imposing stringent penalties on entities with poor environmental records. Imposing higher costs for environmental infractions on companies incentivizes them to enhance ESG performance.
On the other hand, solid waste governance actions enhance corporate ESG performance by increasing public environmental concerns. In recent years, public concerns over environmental issues have intensified. This “bottom-up” force has become an important complement to environmental governance. Through “voting with their voices” or “voting with their wallets”, the public can express their environmental demands and influence corporate ESG performance [19,20]. The solid waste governance actions underscore a progressive green city management concept that promotes public participation. The primary objective is to promote the establishment of a sustainable development model that continually encourages source reduction and optimizes the resource utilization of solid waste. This will enhance the enthusiasm of urban residents for participating in environmental governance and increase their preference for green products, thereby exerting both a supervisory and incentivizing effect on corporations. Firstly, the public influences and regulates enterprises through the “voting with their wallets”. This approach allows individuals to express their environmental preferences and demands directly through investment behavior, thereby supporting green innovation and environmentally friendly companies while imposing market penalties on those associated with negative environmental incidents. The solid waste governance actions are anticipated to foster a shift in public environmental preferences, thereby increasing investor inclination towards environmentally responsible companies. Consequently, enterprises are motivated to improve their ESG quality to meet investor demands. Secondly, the public can articulate their demands for environmental protection on social media platforms and government service websites by “voting with their voices.” Such incidents can potentially incite public outrage and negative media attention, subsequently leading to a decline in corporate stock prices and resulting in regulatory sanctions. The solid waste governance actions have not only increased public awareness of environmental issues but have also enhanced public oversight of enterprises, thereby contributing to the improvement of corporate ESG performance.
H2.
Solid waste governance actions improve corporate ESG performance by increasing government environmental concerns.
H3.
Solid waste governance actions improve corporate ESG performance by increasing public environmental concerns.
According to the innovation compensation effect of the Porter hypothesis, a suitable regulatory intensity can incentivize companies to invest in green innovation, thereby generating compensatory benefits that facilitate their green development [21]. Firstly, solid waste governance actions provide policy support and incentivize measures to foster green innovation among enterprises. The government employs various mechanisms, including tax incentives, financial subsidies, and green credit, to channel capital towards green and low-carbon industries, thereby mitigating the financing hurdles that companies encounter in enhancing their innovative capabilities. Secondly, solid waste governance actions stimulate market demand for environmental protection, thereby motivating enterprises to innovate in green technologies. As the advancement of the “zero-waste city” pilot policy, the demand for solid waste reduction, resource utilization, and safe treatment increases, creating numerous market opportunities for enterprises. By developing new technologies and products that address market demands for environmental protection, enterprises can achieve a win–win situation, realizing both economic and environmental benefits. Finally, solid waste governance actions promote collaborative innovation, thereby enhancing corporate green innovation capabilities. The “zero-waste city” pilot policy promotes collaboration among businesses, universities, and research institutions to collectively engage in research and development on technologies for solid waste governance. This cross-sectoral cooperation accelerates technological innovation and promotes industrial upgrading and green transformation. Corporate green innovation can help enterprises reduce production costs, gain a competitive advantage, and establish a green image, thereby enhancing their ESG performance.
H4.
Solid waste governance actions improve corporate ESG performance by increasing the level of corporate green innovation.
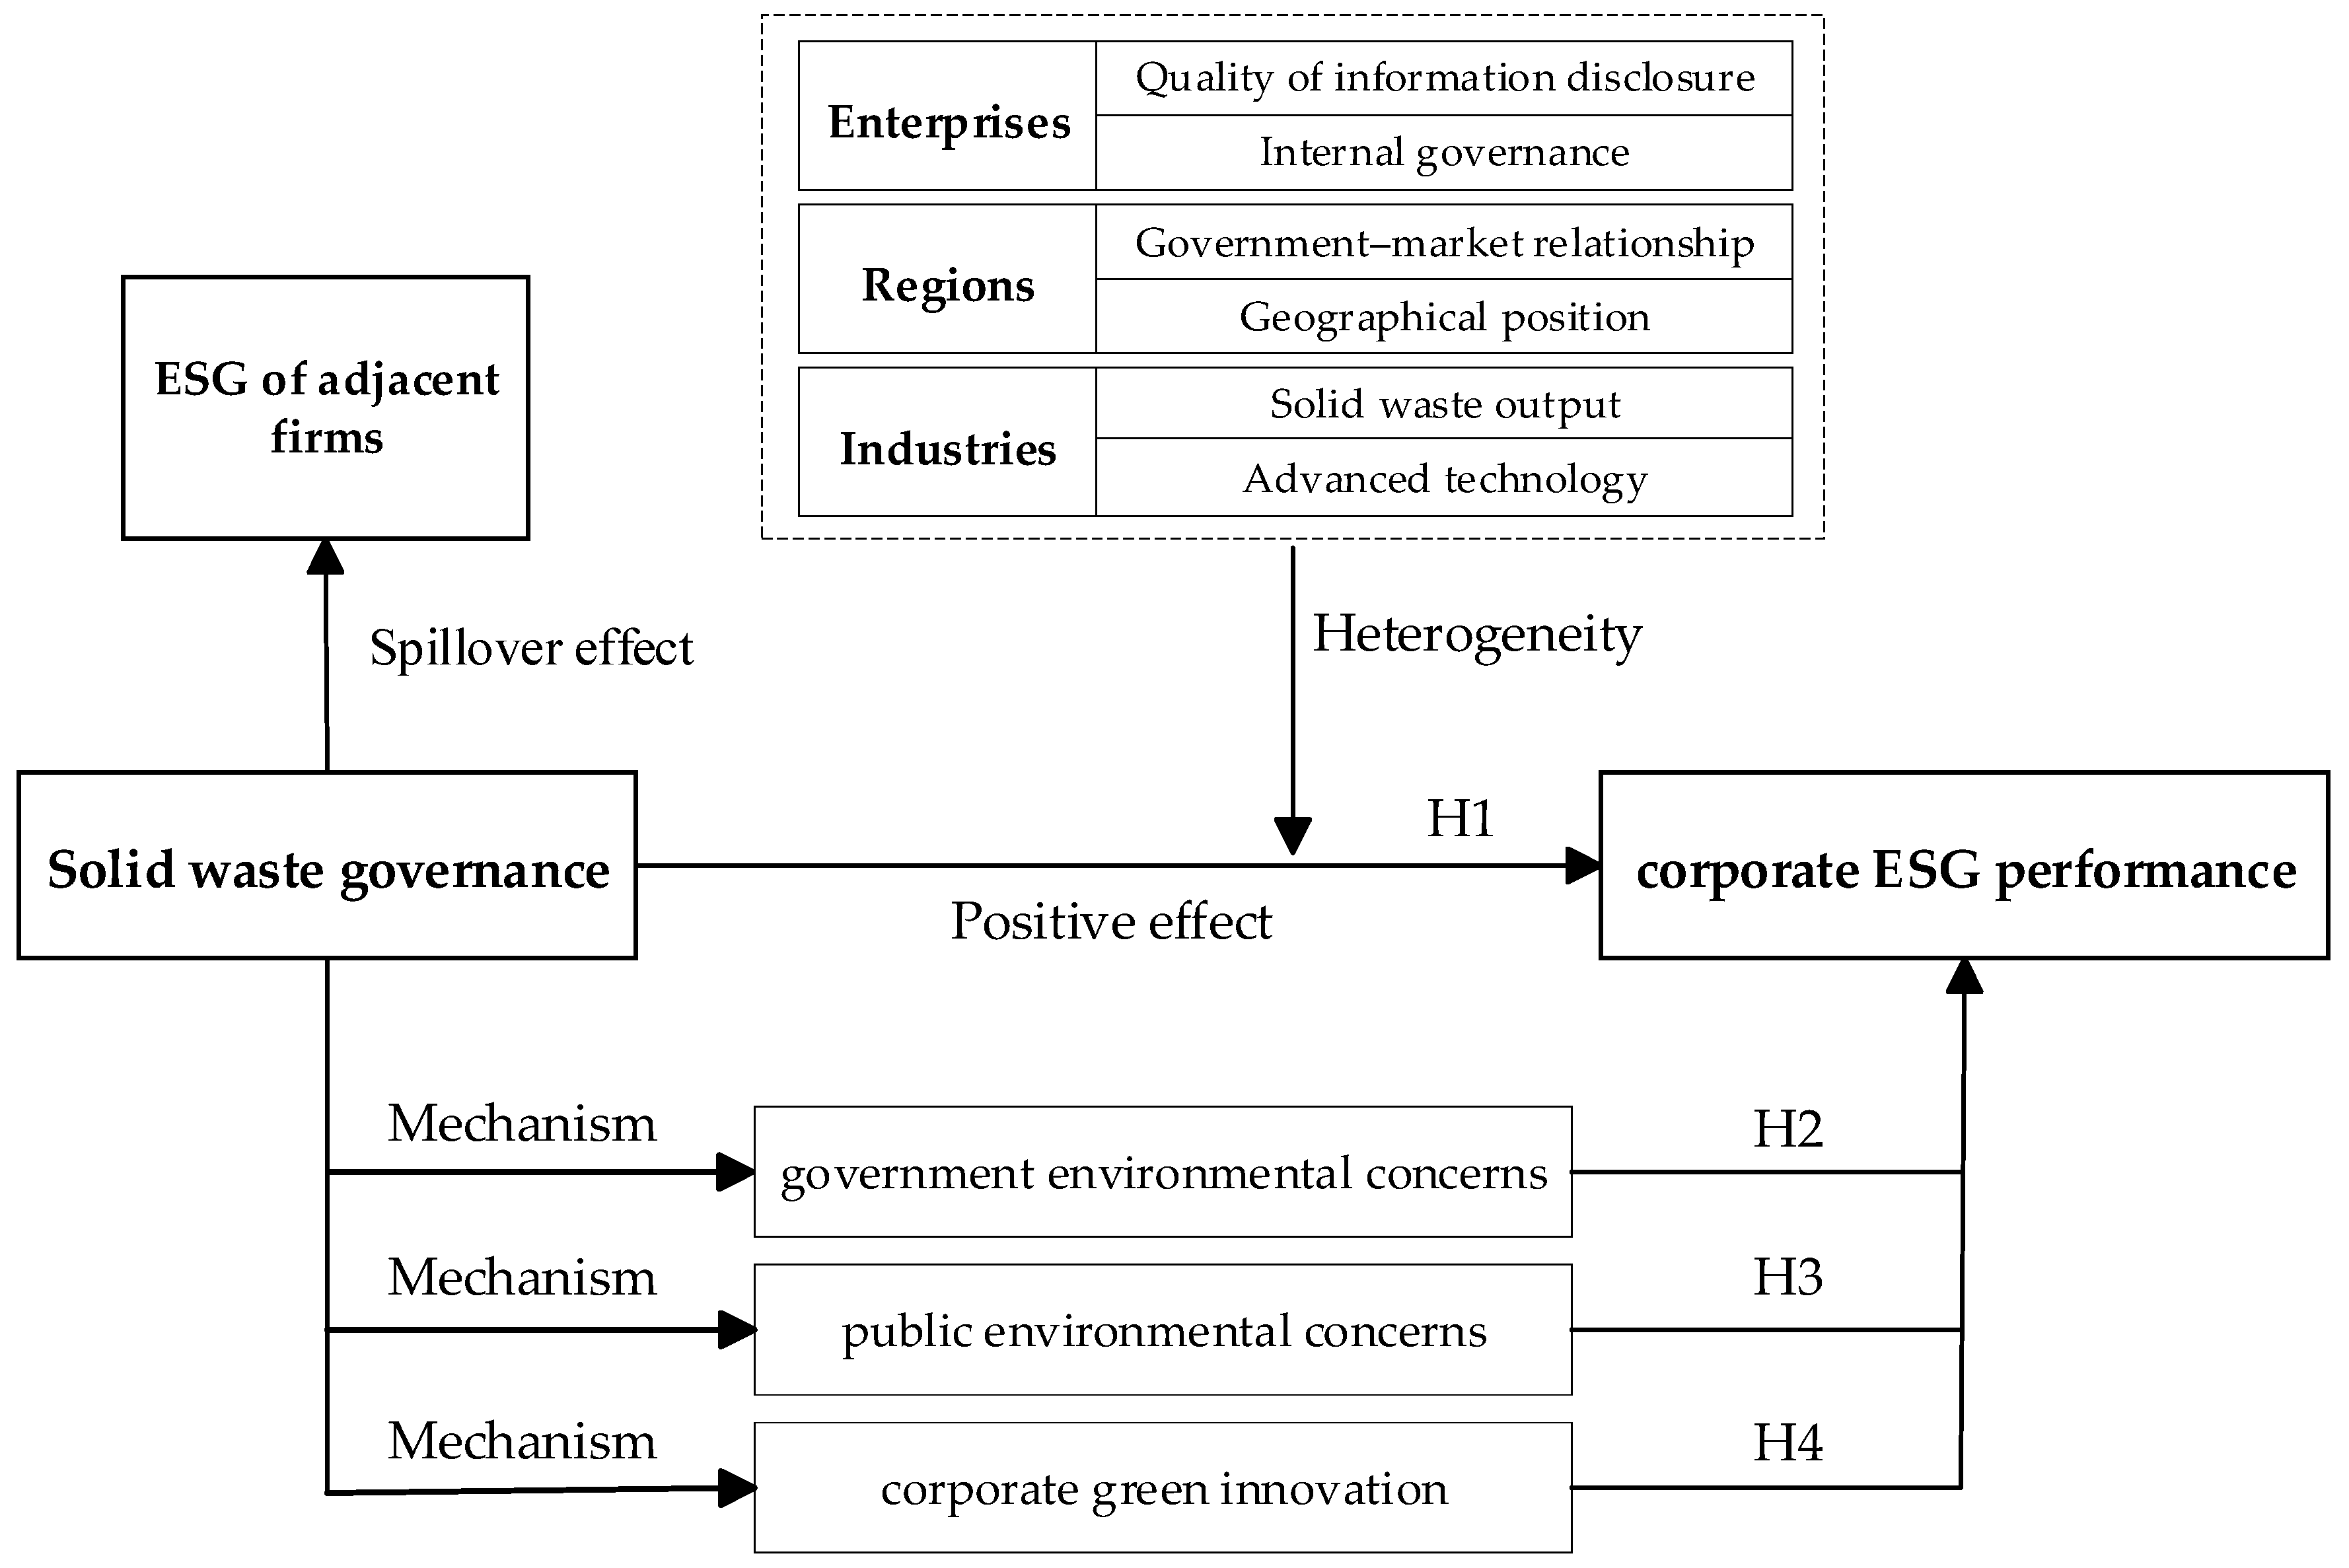
The specific logical framework is illustrated in Figure 2.
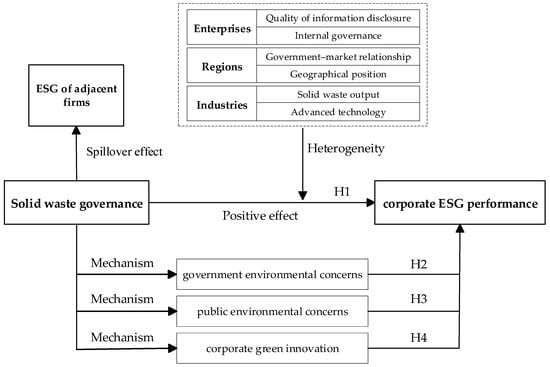
Figure 2.
Theoretical analysis framework.
3. Research Design
3.1. Data and Sample
We utilized a sample of Chinese A-share listed companies from 2014 to 2023. Meanwhile, the sample data were processed as follows: At first, we deleted the samples of ST, *ST, and PT companies. Secondly, we excluded companies in the financial industry. In addition, the insolvent companies (that is, the financial leverage exceeds 1) were excluded. Then, we removed samples with missing data. Finally, we winsorized all continuous variables in the sample at the 1% and 99% levels. A total of 34,456 firm-year observations were obtained.
The ESG performance ratings are from the Huazheng ESG database. The data pertaining to the list of “zero-waste cities” is obtained from the Ministry of Ecology and Environment of the People’s Republic of China. Company-level financial data are sourced from the China Stock Market & Accounting Research Database (CSMAR).
3.2. Variable Selection
3.2.1. Dependent Variable
Corporate ESG performance (ESG): Following Fu et al. (2022) [17], this paper employs the Huazheng ESG rating as a proxy for ESG performance. The Huazheng ESG rating system consists of nine levels, ranging from C to AAA, which are quantified by assigning scores from 1 to 9. Higher scores indicate better ESG performance for the entire year.
3.2.2. Independent Variable
Solid waste governance actions (SWGA): The “zero-waste city” pilot policy aims to achieve three primary objectives: reducing solid waste generation, promoting resource utilization of solid waste, and implementing harmless treatment of solid waste. This paper uses the “zero-waste city” pilot policy as a case study of China’s solid waste governance actions. Listed companies with registered addresses within the pilot areas are designated as the treatment group, with a corresponding SWGA value of 1, whereas those in non-pilot areas comprise the control group, assigned a SWGA value of 0. Specific pilot batches and timelines are provided in Supplementary Table S1. The variable “SWGA” is defined as the interaction between the group and time dummy variables. This paper mainly focuses on the coefficients of SWGA.
3.2.3. Mechanism Variables
Government Environmental Concerns (GECs): The government’s work report provides a clear indication of policymakers’ attention allocation during a specific annual period. Drawing on the research of Lv et al. (2022) [22], this study collects government work reports from prefecture-level cities and municipalities spanning 2014 to 2023. Utilizing Python 3.11 software, the study quantifies the frequency of environmental protection-related keywords in each report and employs the natural logarithm of these frequencies to gauge government environmental concerns.
Public Environmental Concerns (PECs): Public environmental concerns substantially impact the coordination of collective environmental behavior, and social networking platforms further augment the inclusivity of public engagement in environmental conservation efforts. Therefore, referring to Wang et al. (2024) [23], this study employs the Baidu Search Index for “environmental pollution” across prefecture-level cities as a proxy variable for public environmental concern.
Corporate Green Innovation (CGI): Green patents are regarded as a vital component driving sustainable green development. Following the approach of Jia et al. (2023) [24], this study adopts green utility patents as the metric for assessing green innovation levels, calculated as the ratio of the number of independently obtained green utility model patents in a given year to the total patent count. The data were sourced from the Chinese Research Data Services Platform (CNRDS) database.
3.2.4. Control Variables
This study controls for a range of firm characteristics that may affect corporate ESG performance. The firm-specific controls include firm size (Size), financial leverage (Lev), return on assets (Roa), growth rate of operating income (Grow), operating cash flow (Cash), capital intensity (Density), board size (Board), independent directors (Indep), dual-occupation rate (Dual), shareholding concentration (Top), enterprise age (Age), and enterprise ownership (Soe). The definitions of the main variables are provided in Table 1.

Table 1.
Variable definitions.
3.3. Model Design
The implementation of China’s “zero-waste city” pilot policy serves as a quasi-natural experiment in solid waste governance. To examine the impact of solid waste governance actions on corporate ESG performance, we utilize the Staggered Difference-in-Differences (DID) methodology and construct the following regression model (1):
In Equation (1), denotes the corporate ESG performance, is a dummy variable that represents solid waste governance actions. If a company is located within the “zero-waste city” pilot areas during the current year and subsequent years, takes a value of 1; otherwise, it is assigned a value of 0. Controls represents a set of control variables, Firm and Year denote firm and year fixed effects, respectively. The standard errors for the regression coefficients in the model are clustered at the firm level.
4. Empirical Analysis
4.1. Descriptive Statistics of Main Variables
Table 2 presents the descriptive statistics for the main variables. The mean value of ESG is 4.165. This indicates that the average ESG rating of the listed companies is approximately at the BB level. The minimum ESG score is 1, and the maximum score is 8, with a standard deviation of 1.013. This indicates substantial variation in ESG performance among companies. The mean value for the SWGA variable is 0.264, indicating that 26.4% of the firms in the sample are situated in areas designated as “zero-waste city” pilot regions.
Table 2.
Descriptive statistics.
4.2. Baseline Results
Table 3 depicts the results of baseline regression. Columns (1) and (2) report the effect of solid waste governance actions on corporate ESG performance. Regardless of the inclusion of the control variables, the estimated coefficients of SWGA demonstrate positive effects at the 1% significance level. This finding suggests that solid waste governance actions can improve corporate ESG performance.
Table 3.
Baseline results.
4.3. Robustness Checks
4.3.1. Parallel Trend Test
Satisfying the parallel trend assumption is a critical prerequisite for the validity of the staggered DID model. This study employs an event study methodology [25] to conduct a parallel trends test. The estimation model is presented as follows:
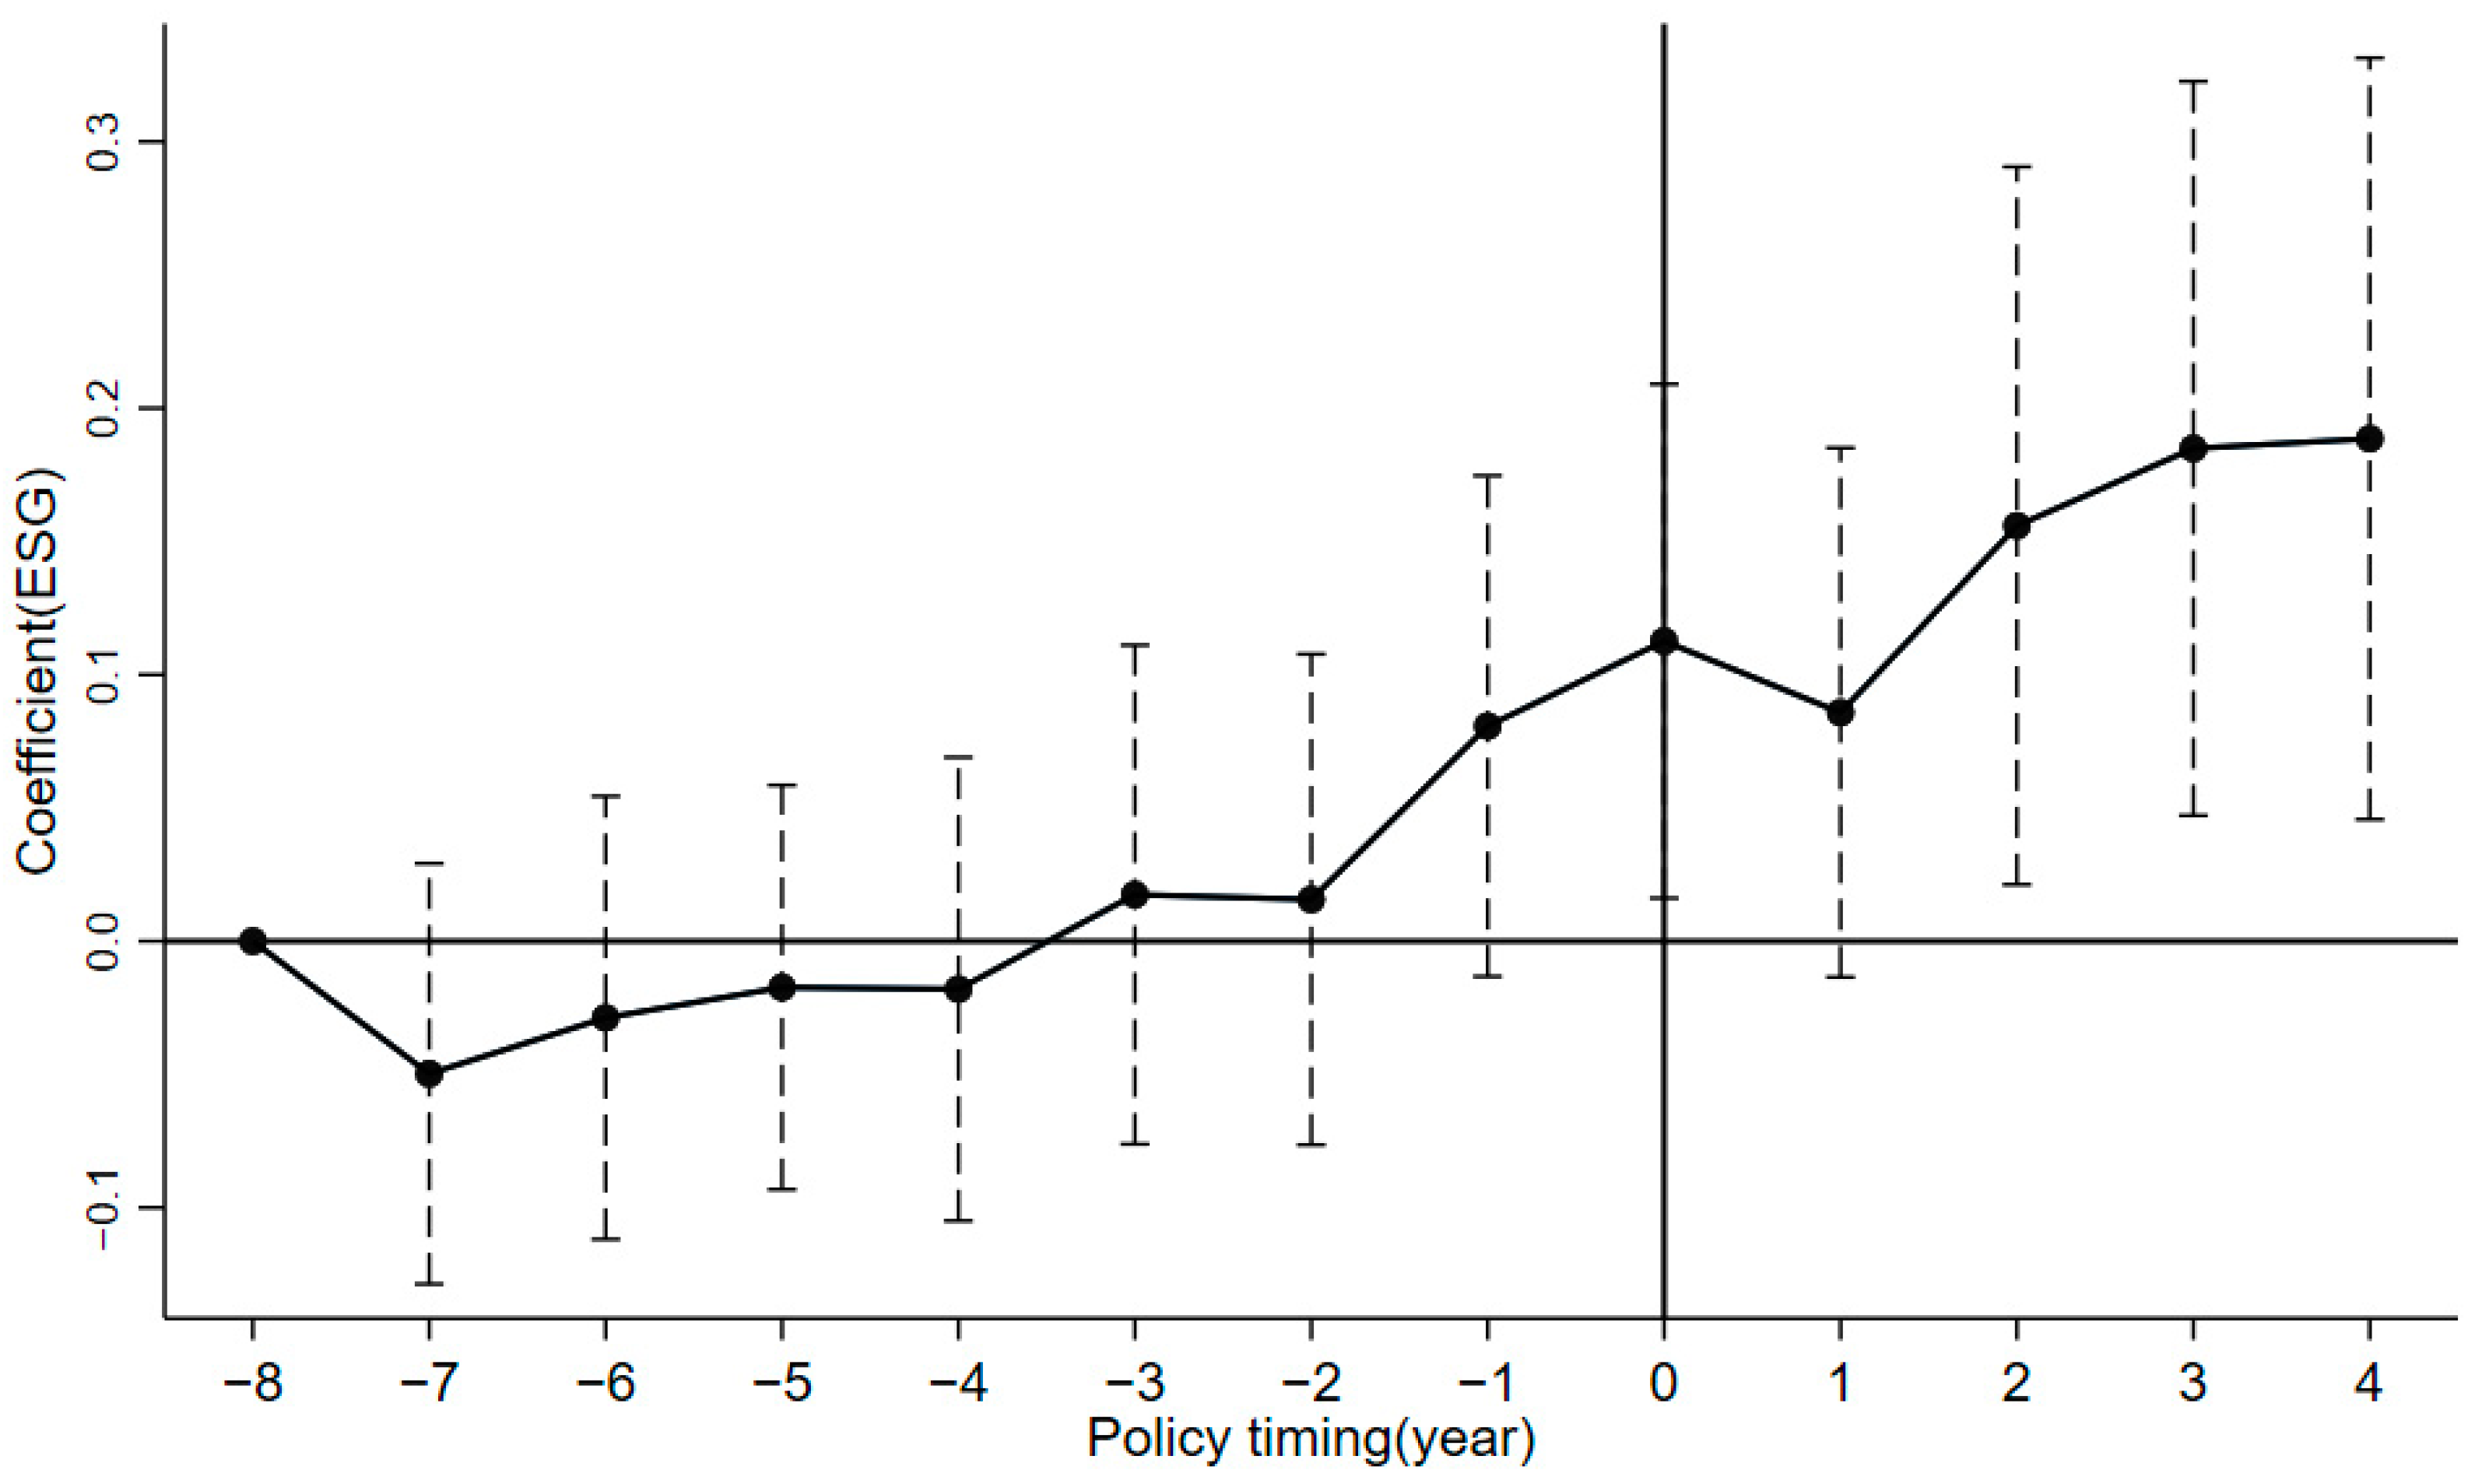
In Equation (2), represents a series of dummy variables, where k denotes the number of years since the implementation of the “zero-waste city” pilot policy. The remaining variables remain consistent with those in Equation (1). The coefficient represents the difference in ESG performance between listed companies in the treatment group and those in the control group in the k-th year. The eighth period prior to the implementation of the “zero-waste city” pilot policy was chosen as the base period. Figure 3 presents the result of the parallel trend test, and Table 4 provides the corresponding coefficients and 95% confidence intervals. The findings indicate that there is no significant difference in corporate ESG performance between pilot cities and non-pilot cities before the policy was implemented, as corroborated by the parallel trend test. The coefficients for the pre-policy periods (Year-8 to Year-1) are not significantly different from zero, suggesting that the parallel trends assumption holds. The significant positive coefficient in the post-policy period (Year0) implies that the “zero-waste city” policy has a positive impact on ESG performance.
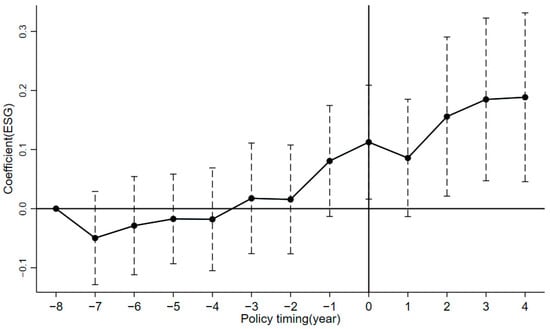
Figure 3.
Parallel trend test results.
Table 4.
The corresponding coefficients and 95% confidence intervals.
4.3.2. Placebo Test
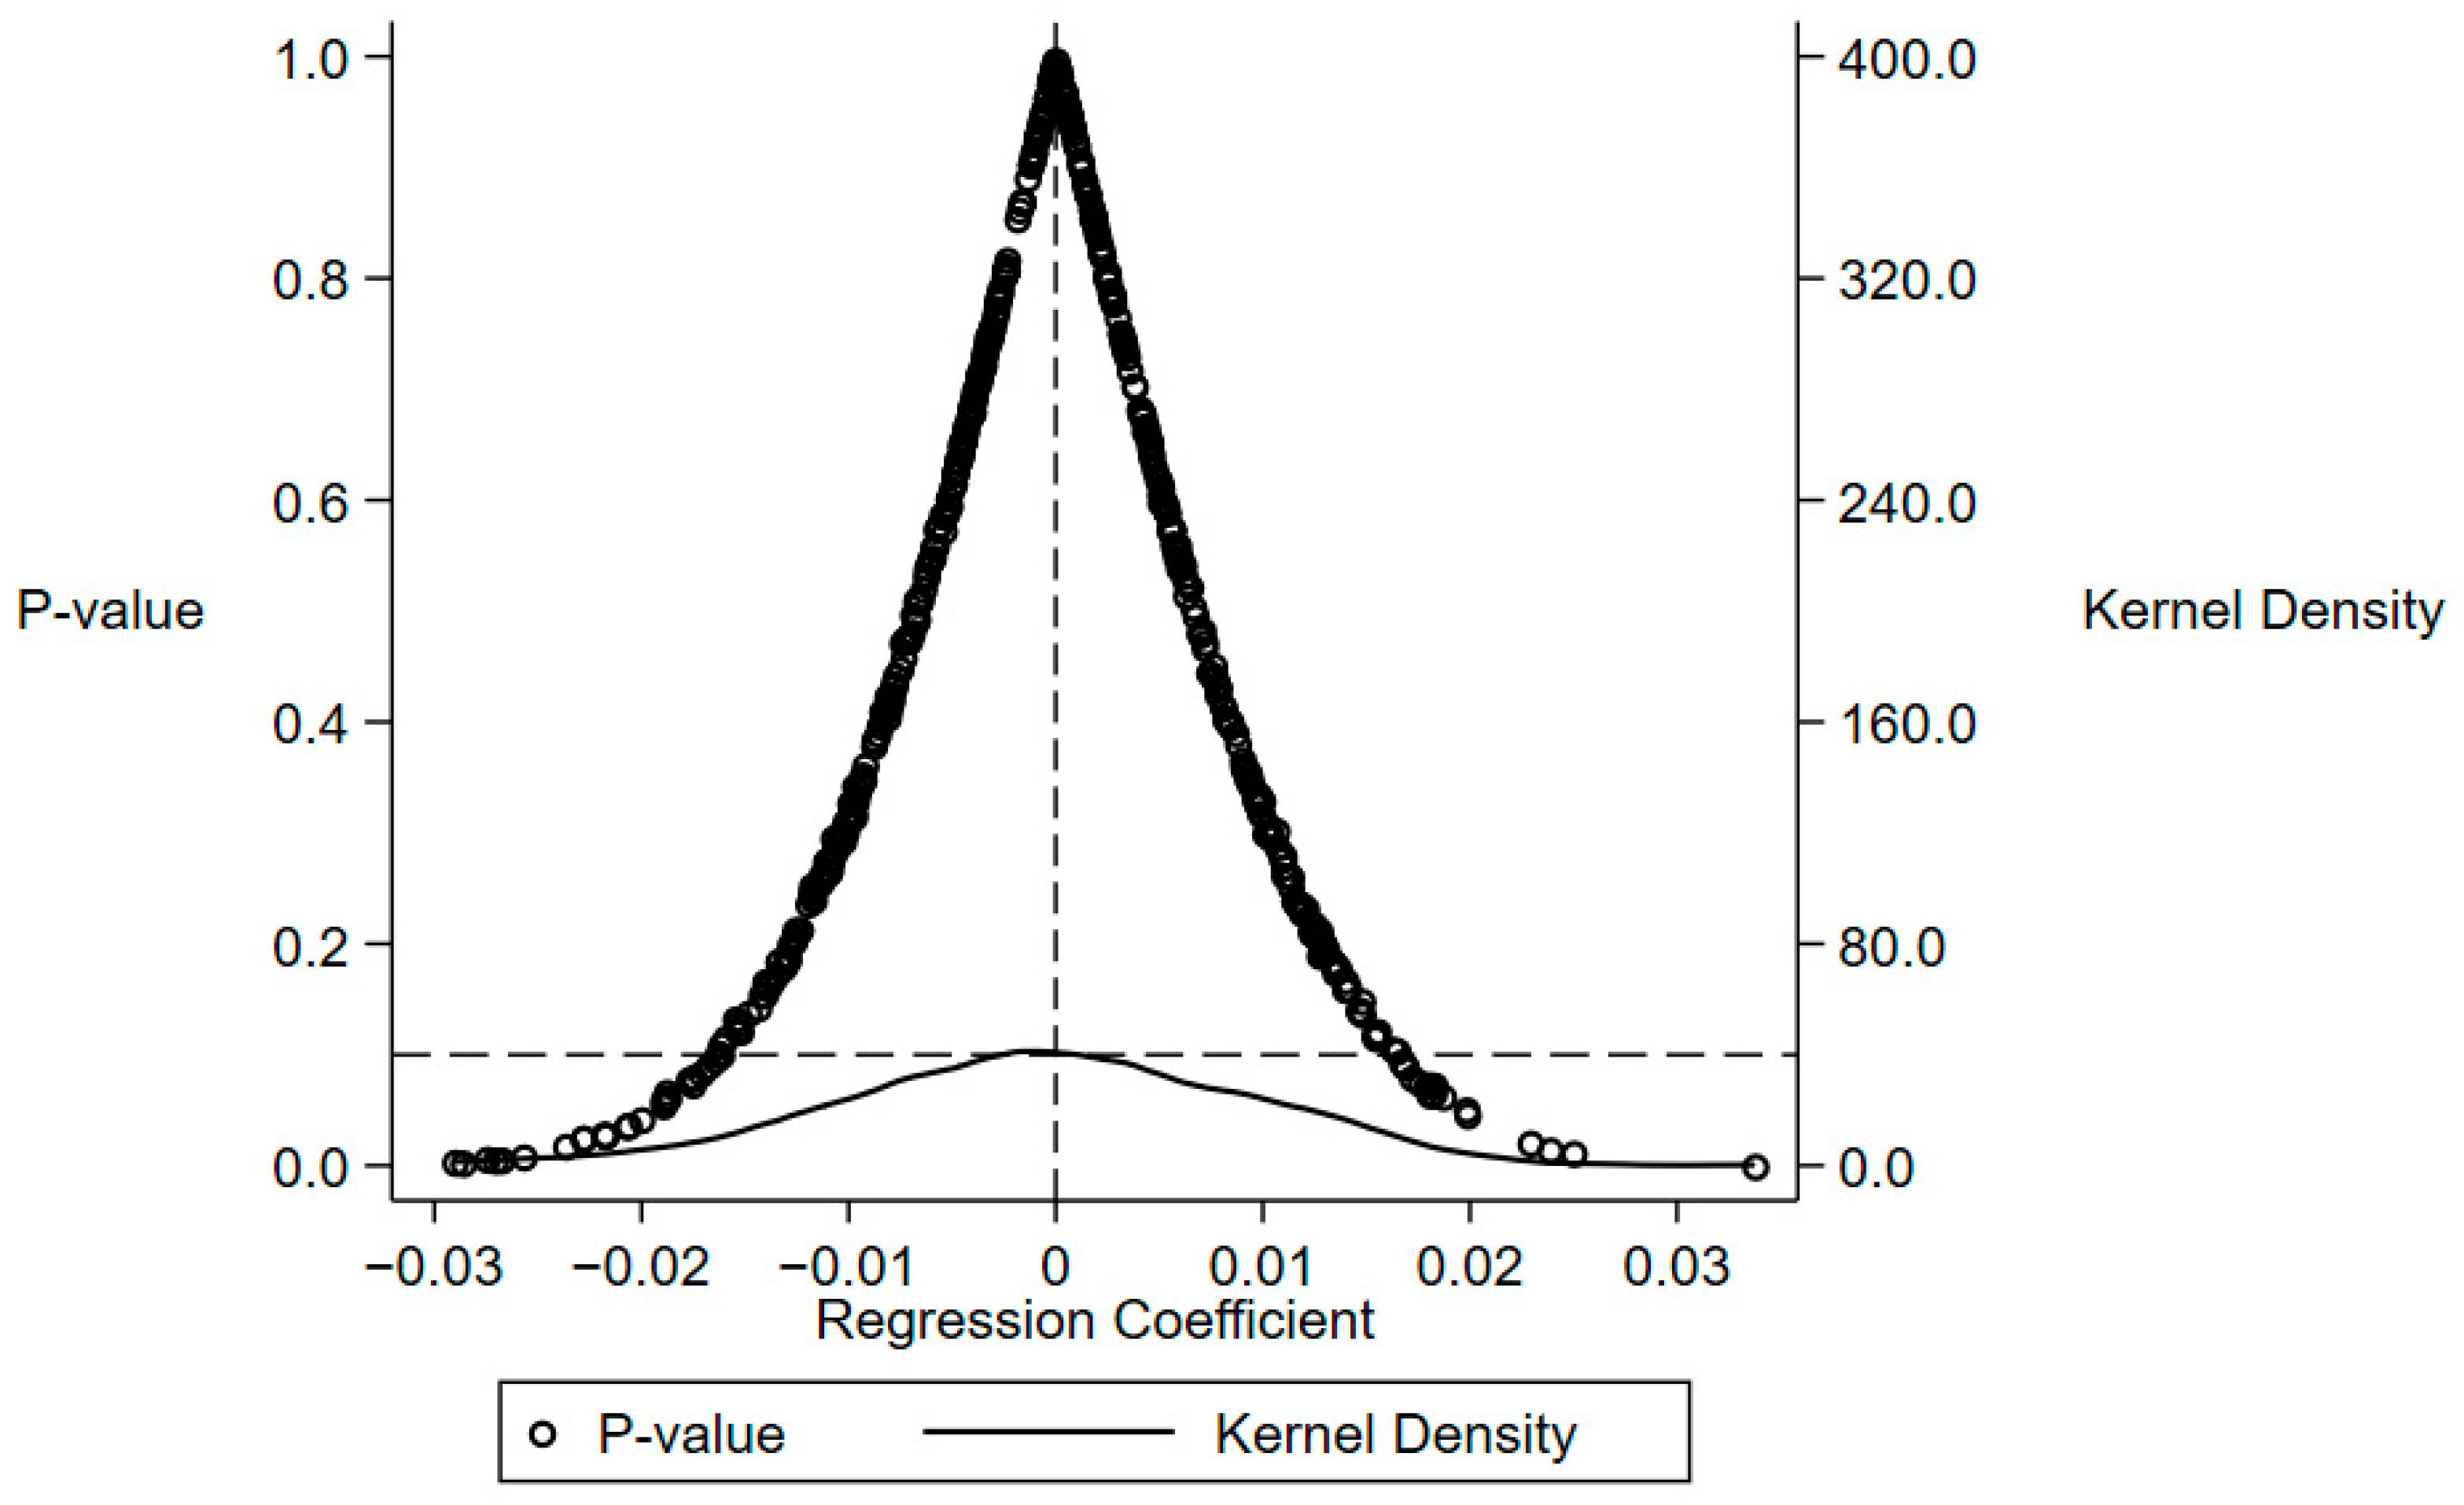
An additional concern regarding the identification assumption of the DID model is that the unobservable factors influencing the designation of “zero-waste city” pilot areas may not be random. Therefore, this study adopts the approach of Cai et al. (2016) [26] by randomly selecting the pilot cities and conducting 500 regressions based on this randomization. As shown in Figure 4, the coefficient estimates from the randomly assigned regressions are uniformly distributed around the 0 value, which is consistent with the expectations of a placebo test. The p-values are predominantly clustered near 1, indicating that, in most cases, the placebo lacks a significant effect. This finding upholds the robustness of the original model.
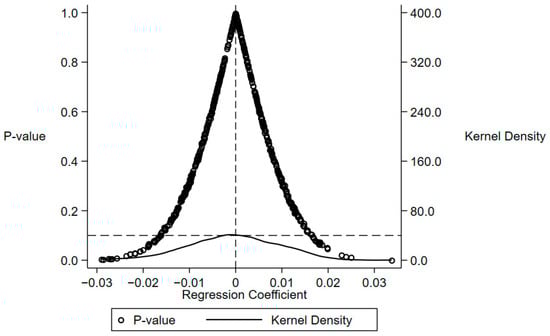
Figure 4.
Placebo test.
4.3.3. Propensity Score Matching (PSM) Approach
To mitigate the endogeneity concerns stemming from sample selection bias, this study utilizes a PSM model to enhance the robustness of the baseline results. Using the control variables identified in the baseline regression as feature variables, we calculate the propensity scores and conduct 1:2 nearest neighbor matching within a specified caliper range. The regression results presented in column (1) of Table 5 demonstrate that the coefficient of SWGA remains significant and positive. This indicates that the results of the baseline regression are robust.
Table 5.
Robustness test results.
4.3.4. Alternative Dependent Variable
ESG ratings may vary across different rating agencies due to differences in methodologies, data sources, and weighting schemes. To address the potential subjectivity or variability in Huazheng ESG ratings and to ensure the robustness of our findings, we conduct additional robustness checks using alternative ESG metrics. Specifically, we employ the CNRDS ESG rating score (ESG2) [27] and Bloomberg ESG rating score (ESG3) [28] as supplementary measures of corporate ESG performance. The results, presented in columns (2) and (3) of Table 5, show that the coefficient for SWGA remains significantly positive across all specifications, which is consistent with our baseline regressions. This demonstrates that the positive impact of the “zero-waste city” policy on ESG performance is not contingent on a single data source and holds across different ESG rating methodologies.
4.3.5. Excluding Other Interfering Factors
Through the collection and analysis of relevant documents and research literature, it was determined that the “Notice on Launching Pilot Projects for Low-Carbon Provinces and Low-Carbon Cities” (hereinafter referred to as the low-carbon pilot policy) and the “Environmental Protection Tax Law of the People’s Republic of China” (hereinafter referred to as the environmental protection fee-to-tax reform), which took effect in 2018, may overlap with the “zero-waste city” pilot policy, potentially interfering with the baseline regression results. To address estimation bias caused by these confounding factors, we introduce two policy dummy variables into the baseline model. Specifically, LCC is assigned a value of 1 if the company is registered in low-carbon city pilot areas during the relevant year; otherwise, it is assigned a value of 0. The environmental protection fee-to-tax reform policy was implemented in 2018. Etax is assigned a value of 1 for heavily polluting enterprises after 2018; otherwise, it is assigned a value of 0. The regression results are presented in columns (4)–(6) of Table 5. The coefficient of SWGA remains significantly positive. This suggests that, after accounting for the effects of the previously mentioned policies, the baseline conclusion remains valid.
4.3.6. Omitted Variable Problem
Considering that omitted variables at the industry and city levels may affect corporate ESG performance, this paper further incorporates industry fixed effects and city-level fixed effects. Meanwhile, we include per capita GDP (Rgdp), urbanization rate (Urban), and fiscal revenue (Fiscal) of prefecture-level cities as control variables and subsequently re-estimate the benchmark model. From columns (7) to (10) of Table 5, it is evident that the coefficient for SWGA is significantly positive, thereby reinforcing the robustness of the baseline regression results.
5. Mechanism Testing
The aforementioned research suggests that solid waste governance actions can enhance corporate ESG performance. According to the previous analysis, solid waste governance actions primarily improve corporate ESG performance through three key factors: government environmental concerns, public environmental concerns, and corporate green innovation. Therefore, this paper develops the following model to test the mechanism.
In Equation (3), represents the mediating variables, including government environmental concerns (GECs), public environmental concerns (PECs), and corporate green innovation (CGI). All other variables are defined as previously specified.
Table 6 presents the results of the mechanism test. In column (1), the coefficient of SWGA is significantly positive. This indicates that solid waste governance actions enhance the government’s attention to environmental governance, consequently augmenting corporate ESG performance [22]. This validates hypothesis H2. In column (2), the coefficient of SWGA is significantly positive. This indicates that solid waste governance actions enhance public environmental concerns. The growing public concern for environmental issues has compelled enterprises to increase their investments in environmental protection, thereby improving their ESG performance [19]. This validates hypothesis H3. In column (3), the coefficient of SWGA is significantly positive, indicating that solid waste governance actions promote corporate green innovation. Green innovations not only enhance corporate environmental responsibility efficiency but also improve market competitiveness and brand image, thereby improving corporate ESG performance [24]. This validates hypothesis H4. Based on the Sobel test results, the mechanism through which solid waste governance enhances corporate ESG performance by influencing governmental environmental concern, public environmental concern, and corporate innovation is statistically significant at the 1% level. Additionally, the Bootstrapping test reveals that the 95% confidence intervals for the total, direct, and indirect effects of solid waste governance actions on corporate ESG performance do not include zero, indicating that all these effects are significant.
Table 6.
Mechanism test results.
6. Further Analysis
6.1. Spillover Effect Analysis
The solid waste management initiative may enhance the ESG performance of non-targeted firms in neighboring areas through spillover effects. This is due to the demonstration effect of the “Zero-Waste City” initiative. Firms in pilot regions may drive neighboring firms to enhance environmental awareness, focus on social responsibility, and improve internal governance. This can lead to better ESG performance. Drawing on Alder et al. (2016) [29], this study defines a variable Radius as 1 if a firm is within 400 km of a “Zero-Waste City” pilot area, and 0 otherwise. Regression results in Table 7 show that in columns (1) and (2), Radius has a significant positive coefficient. In columns (3) and (4), both SWGA and Radius are significant and positive. This indicates that firms within 400 km of pilot areas exhibit better ESG performance, suggesting that solid waste management has positive externalities that transcend geographical boundaries and broadly enhance corporate ESG practices.
Table 7.
Regional spillover effect.
6.2. Heterogeneity Analysis
Furthermore, we examine the heterogeneous impacts of solid waste governance actions on corporate ESG performance across different dimensions, specifically at the firm, industry, and regional levels.
6.2.1. Different Types of Enterprises
High-quality information disclosure can assist companies in establishing a positive image. Firms with information disclosure quality rated as “excellent” and “good” are classified as high-quality information disclosure enterprises, while those with lower ratings are categorized as low-quality information disclosure enterprises. The grouped regression results displayed in columns (1) and (2) of Table 8 demonstrate that solid waste governance actions significantly enhance the ESG performance of firms characterized by high-quality information disclosure. Conversely, no significant impact is observed on firms with low-quality information disclosure. High-quality information disclosure requires that companies maintain consistency in their environmental protection commitments to the public. In alignment with the requirements of the “zero-waste city” pilot policy, enterprises will proactively implement measures related to ESG criteria. Enterprises with lower information disclosure quality often face higher financing costs and risk premiums, which may result in insufficient motivation for adopting ESG practices.
Table 8.
Heterogeneity results.
Effective internal governance can mitigate agency issues and enable management to make decisions that align with the long-term interests of the company. This study assesses corporate governance using the management expense ratio, where a higher ratio indicates lower levels of internal governance. The sample is categorized into two groups based on the median management expense ratio: companies with high governance levels and those with low governance levels. The grouped regression results presented in columns (3) and (4) of Table 8 indicate that solid waste governance actions significantly enhance the ESG performance of companies with high governance levels. Companies with low governance levels did not achieve statistical significance. This indicates that effective corporate governance during solid waste governance ensures that enterprises incorporate environmental and social considerations into their strategic planning and decision-making processes, thereby enhancing corporate ESG performance.
6.2.2. Different Types of Industries
Different industries demonstrate significant variations in their generation of solid waste. The manufacturing sector generates a significant volume of solid waste. Industries such as steel, non-ferrous metals, and chemical manufacturing generate high levels of pollution. Consequently, this study categorizes manufacturing and heavily polluting industries as sectors that generate high volumes of solid waste, while other industries are classified as those that generate low volumes of solid waste. The grouped regression results presented in columns (5) and (6) of Table 8 demonstrate that solid waste governance actions significantly enhance the ESG performance of enterprises operating in industries characterized by high solid waste generation. The “zero-waste city” pilot policy targets industries characterized by high pollution and substantial solid waste generation. To avoid being excluded from the market due to stringent policy regulations, enterprises within these sectors must urgently enhance their ESG performance to comply with these requirements.
To assess the impact of solid waste governance actions on corporate ESG performance across varying technological levels, this study categorizes the sample into high-tech and non-high-tech industries for analysis. The results in columns (7) and (8) of Table 8 show that solid waste governance actions can significantly improve corporate ESG performance in high-tech industries. High-tech industries are characterized by greater technical talent and investment, which foster R&D innovations aimed at reducing solid waste and enhancing resource utilization of solid waste. These advancements contribute to the improvement of corporate ESG performance.
6.2.3. Different Types of Cities
Due to variations in resources and geographical conditions, there are significant disparities in the resource distribution across different regions of China. This study classifies samples into two groups based on geographical locations: the western region and the central–eastern region. The grouped regression results displayed in columns (9) and (10) of Table 8 reveal that the coefficient for SWGA in the central–eastern region is significantly positive, whereas the western region does not exhibit any significance. This disparity is primarily attributable to the higher economic development in the central–eastern regions compared to their western counterparts, resulting in a greater concentration of resources such as green finance and skilled personnel. Moreover, these regions exhibit heightened public awareness of environmental issues and more stringent environmental regulations, which contribute to enhancing ESG performance.
If local governments have a closer relationship with the market, enterprises are more likely to respond to the government’s environmental policies. This paper employs the “government-market relationship” index, as reported in the “China Provincial Marketization Index Report”, as a proxy to assess the intimacy of the government–market nexus. The sample is dichotomized into high and low market intimacy areas based on the median value of the government–market intimacy. The results presented in Table 8 (11) and (12) indicate that the coefficient of SWGA is significantly positive in regions characterized by high government–market intimacy. Regions with low government–market intimacy are not significant. This finding indicates that when local governments are more closely aligned with the market, companies are more likely to comply with and implement environmental regulatory policies, thereby improving their ESG performance.
7. Conclusions and Recommendations
Solid waste pollution is a global environmental issue that poses a significant threat to human health and the ecological environment. The “zero-waste city” pilot policy represents a pivotal initiative in solid waste governance, reflecting China’s profound commitment to environmental governance. This study employs China’s “zero-waste city” pilot policy as a quasi-natural experiment and utilizes a Staggered Difference-in-Differences (DID) model to investigate the impact of solid waste governance actions on corporate ESG performance. The research indicates that solid waste governance actions significantly enhance corporate ESG performance by addressing governmental and public environmental concerns and fostering corporate green innovation. The spillover effects analysis reveals that solid waste governance generates positive spatial spillover effects, significantly enhancing the ESG performance of non-treated firms in adjacent regions not directly subjected to the “zero-waste city” pilot policy. Heterogeneity tests reveal that the positive effect of solid waste governance actions on corporate ESG performance is more pronounced in enterprises characterized by higher-quality information disclosure and stronger internal governance, industries with greater solid waste output and more advanced technology, and regions with a closer government–market relationship, as well as in central–eastern regions.
This study makes possible major contributions. First, it pioneeringly applies a Staggered Difference-in-Differences (DID) method to explore the impact of solid waste governance on corporate ESG performance. Given rising global solid waste and worsening pollution, understanding if ESG performance is influenced by such governance becomes crucial. This study delves into China’s governance actions and their mechanisms, offering a novel perspective on ESG drivers. Second, it clarifies the enhancement mechanisms of ESG performance: externally, governance eases governmental and public environmental concerns; internally, it spurs corporate green innovation, thus revealing the causal link. Third, by analyzing solid waste governance from a corporate viewpoint, it enriches research and reduces endogeneity. Unlike prior case-focused studies, this paper uses the “zero-waste city” policy to examine micro-level impacts. Theoretically, this research deepens the understanding of how environmental policies influence corporate behavior, providing insights for ESG studies. Practically, it offers guidance for policymakers to enhance corporate ESG performance via solid waste governance and advises firms on leveraging governance actions for sustainable development.
Based on the findings, we make the following policy recommendations. Firstly, the government should recognize the significant role of microenterprises in enhancing solid waste governance. Local authorities should purposefully encourage enterprises to harness their strengths and innovative capabilities, thereby actively engaging in solid waste governance. Secondly, governments should improve their responsiveness to environmental protection and cultivate public environmental consciousness. This includes strengthening the government’s role in solid waste governance, enhancing environmental awareness, and refining environmental monitoring systems. Additionally, promoting public environmental oversight and fostering public concern for environmental issues are essential steps toward sustainable development. Thirdly, enterprises should prioritize enhancing the quality of information disclosure, strengthening internal governance, and capitalizing on opportunities arising from the development of a “zero-waste city”. Finally, the effective management of solid waste in industrial sectors, particularly those with high pollution levels, is a crucial aspect of “zero-waste city” initiatives. Developing tailored environmental governance plans for these sectors is essential to mitigate the environmental impact. Furthermore, harnessing advanced technologies to enhance resource recovery and source reduction in solid waste governance should be prioritized.
Supplementary Materials
The following supporting information can be downloaded at: https://www.mdpi.com/article/10.3390/su17083625/s1. Figure S1: Theoretical analysis framework; Table S1: Pilot Phases and Timeline of the “Zero-Waste City” Policy Implementation.
Author Contributions
Conceptualization, X.Z. and Z.W.; methodology, L.L.; software, L.L. and M.C.; validation, X.Z. and L.L.; formal analysis, X.Z. and Z.W.; investigation, X.Z. and L.L.; resources, X.Z. and Z.W.; data curation, X.Z. and L.L.; writing—original draft preparation, L.L.; writing—review and editing, X.Z., L.L. and M.C.; visualization, X.Z. and L.L.; supervision, X.Z. and M.C.; project administration, Z.W.; funding acquisition, Z.W. All authors have read and agreed to the published version of the manuscript.
Funding
This research was funded by the Program of The National Natural Science Foundation of China, grant number 72162006, “Research on the Formation Mechanism and Buffering Strategy of Forgetting Corporate Social Responsibility”.
Institutional Review Board Statement
Not applicable.
Informed Consent Statement
Not applicable.
Data Availability Statement
The data presented in this study are available on request from the corresponding author (email: lilingling@stu.shzu.edu.cn).
Conflicts of Interest
The authors declare no conflicts of interest.
References
- Ishaan, D.; Anisha, S.; Maanas, S.; Nirjara, D.; Suvi, R. A systematic literature review on municipal solid waste management using machine learning and deep learning. Artif. Intell. Rev. 2025, 58, 183. [Google Scholar]
- Liu, M.Y.; Chen, L.P.; Sheng, X.R.; Xu, Y.; Yuan, X.L.; Wang, Q.S.; Ma, Q.; Zuo, J. Zero-waste city pilot and urban green and low-carbon transformation: Quasi-experimental evidence from China. Resour. Conserv. Recycl. 2024, 206, 107625. [Google Scholar] [CrossRef]
- Moktadir, M.A.; Ren, J.Z. Leveraging environmental, social, and governance strategies for sustainable tannery solid waste management towards achieving sustainable development goals. Sustain. Dev. 2024, 32, 2869–2898. [Google Scholar] [CrossRef]
- Yang, G.; Zhang, Q.; Zhao, Z.L.; Zhou, C.B. How does the “Zero-waste City” strategy contribute to carbon footprint reduction in China? Waste Manag. 2023, 156, 227–235. [Google Scholar] [CrossRef]
- Chava, S. Environmental Externalities and Cost of Capital. Manag. Sci. 2014, 60, 2223–2247. [Google Scholar] [CrossRef]
- Ma, S.; Ma, T. ESG Controversies and Firm Value: Evidence from A-Share Companies in China. Sustainability 2025, 17, 2750. [Google Scholar] [CrossRef]
- Tian, B.W.; Yu, J.Y.; Tian, Z.L. The impact of market-based environmental regulation on corporate ESG performance: A quasi-natural experiment based on China’s carbon emission trading scheme. Heliyon 2024, 10, e26687. [Google Scholar] [CrossRef]
- Zhu, N.P.; Zhang, S.Y.; Zhou, Y.Y. Impacts of environmental regulation on corporate ESG performance: Evidence from China. Rom. J. Econ. Forecast. 2023, 26, 62–82. [Google Scholar]
- Qian, J.; Chen, C.; Zhong, Y. Environmental Regulation and Sustainable Growth of Enterprise Value: Mediating Effect Analysis Based on Technological Innovation. Sustainability 2022, 14, 13723. [Google Scholar] [CrossRef]
- Cherniwchan, J.; Najjar, N. Do Environmental Regulations Affect the Decision to Export? Am. Econ. J. Econ. Policy 2022, 14, 125–160. [Google Scholar] [CrossRef]
- Porter, E. America’s green strategy. Sci. Am. 1991, 264, 168. [Google Scholar] [CrossRef]
- Amin, S.; Khandaker, M.K.; Jannat, J.; Khan, F.; Rahman, S.Z. Cooperative environmental governance in urban South Asia: Implications for municipal waste management and waste-to-energy. Environ. Sci. Pollut. Res. 2023, 30, 69550–69563. [Google Scholar] [CrossRef] [PubMed]
- Rao, C.J.; He, Y.W.; Xiao, X.P. Selection decision-making mechanism of “zero-waste city” in the Yangtze River Economic Zone. Environ. Dev. Sustain. 2023, 25, 11421–11454. [Google Scholar] [CrossRef]
- Cong, X.H.; Su, P.K.; Wang, L.; Wang, S.; Qi, Z.P.; Saparauskas, J.; Górecki, J.; Skibniewski, M.J. Measuring the Construction Efficiency of Zero-Waste City Clusters Based on an Undesirable Super-Efficiency Model and Kernel Density Estimation Method. Systems 2023, 11, 473. [Google Scholar] [CrossRef]
- Hao, M.G.; Xu, S.C.; Meng, X.N.; Xue, X.F. How does the digital economy affect the provincial “zero-waste city” construction? Evidence from China. Environ. Sci. Pollut. Res. 2024, 31, 18448–18464. [Google Scholar] [CrossRef]
- Clementino, E.; Perkins, R. How do companies respond to environmental, social and governance (ESG) ratings? Evidence from Italy. J. Bus. Ethics 2021, 171, 379–397. [Google Scholar] [CrossRef]
- Fu, T.; Chang, D.; Miao, C. Fuel regulation in a developing country: An interventional perspective. Energy Econ. 2022, 113, 106031. [Google Scholar] [CrossRef]
- Chen, Q.; Li, M.H. Environmental regulatory system reform and corporate ESG ratings: Evidence from China. Econ. Model. 2024, 135, 106710. [Google Scholar] [CrossRef]
- Gu, Y.; Ho, K.C.; Yan, C.; Gozgor, G. Public environmental concern, CEO turnover, and green investment: Evidence from a quasi-natural experiment in China. Energy Econ. 2021, 100, 105379. [Google Scholar] [CrossRef]
- Yan, K.; Chen, Z.W.; Wang, J.G.; Wang, P.P.; Liang, W.M. The power from folk monitoring: Leading Officials’ Natural Resources Accountability Audit (NRAA) and corporate ESG performance. Finance Res. Lett. 2023, 58, 104575. [Google Scholar] [CrossRef]
- Gui, Z.; Lu, X.Y. Strengthening of rule of law and ESG performance of corporations. Finance Res. Lett. 2024, 66, 105705. [Google Scholar] [CrossRef]
- Lv, Y.Q.; Fan, T.Z.; Zhao, B.; Zhang, J.N.; Zheng, Y.; Zhang, Z.Y. How do government environmental concerns affect haze pollution? Front. Environ. Sci. 2022, 10, 945226. [Google Scholar] [CrossRef]
- Wang, Z.W.; Sun, H.; Ding, C.X.; Zhang, X.F. Does public environmental concern cause pollution transfer? Evidence from Chinese firms’ off-site investments. J. Clean. Prod. 2024, 466, 142825. [Google Scholar] [CrossRef]
- Jia, J.S.; He, X.Y.; Zhu, T.Y.; Zhang, E.R.Y. Does green finance reform promote corporate green innovation? Evidence from China. Pac.-Basin Financ. J. 2023, 82, 102165. [Google Scholar] [CrossRef]
- Jacobson, L.S.; Lalonde, R.J.; Sullivan, D.G. Earnings losses of displaced workers. Am. Econ. Rev. 1993, 83, 685–709. [Google Scholar]
- Cai, X.Q.; Lu, Y.; Wu, M.Q. Does environmental regulation drive away inbound foreign direct investment? Evidence from a quasi-natural experiment in China. J. Dev. Econ. 2016, 123, 73–85. [Google Scholar] [CrossRef]
- Wang, Y.; Wang, D.D. The Dual Path of the Impact of Digital Technology Adoption on ESG Performance. Sustainability 2025, 17, 2341. [Google Scholar] [CrossRef]
- Xie, H.; Wu, F. Artificial Intelligence Technology and Corporate ESG Performance: Empirical Evidence from Chinese-Listed Firms. Sustainability 2025, 17, 420. [Google Scholar] [CrossRef]
- Alder, S.; Shao, L.; Zilibotti, F. Economic Reforms and Industrial Policy in a Panel of Chinese Cities. J. Econ. Growth 2016, 21, 305–349. [Google Scholar] [CrossRef]
Disclaimer/Publisher’s Note: The statements, opinions and data contained in all publications are solely those of the individual author(s) and contributor(s) and not of MDPI and/or the editor(s). MDPI and/or the editor(s) disclaim responsibility for any injury to people or property resulting from any ideas, methods, instructions or products referred to in the content. |
© 2025 by the authors. Licensee MDPI, Basel, Switzerland. This article is an open access article distributed under the terms and conditions of the Creative Commons Attribution (CC BY) license (https://creativecommons.org/licenses/by/4.0/).