Article

Long-Term Strategy for Determining the Potential of Climate-Smart Agriculture to Maximize Efficiency Under Sustainability in Thailand †

by
Pruethsan Sutthichaimethee
1,2,3,
Phayom Saraphirom
1,2 and
Chaiyan Junsiri
1,2,3,*
1
Department of Agricultural Engineering, Faculty of Engineering, Khon Kaen University, Khon Kaen 40002, Thailand
2
Agricultural Machinery and Postharvest Technology Center, Khon Kaen University, Khon Kaen 40002, Thailand
3
Postharvest Technology Innovation Center, Science, Research and Innovation Promotion and Utilization Division, Office of the Ministry of Higher Education, Science, Research and Innovation, Bangkok 10400, Thailand
*
Author to whom correspondence should be addressed.
This research aims to develop mitigation and adaptation strategies for greenhouse gas emissions Thailand in accordance with Climate-Smart Agriculture policies.
Sustainability 2025, 17(8), 3635; https://doi.org/10.3390/su17083635
Submission received: 2 March 2025 / Revised: 11 April 2025 / Accepted: 16 April 2025 / Published: 17 April 2025

Abstract

:
This research aims to develop mitigation and adaptation strategies for greenhouse gas emissions Thailand in accordance with Climate-Smart Agriculture policies. The research employs a mixed-methods approach, integrating both quantitative and qualitative research as a crucial framework for impact analysis and an early warning tool for the government in achieving sustainability. On the quantitative side, an advanced model called the Longitudinal Mediated Moderation Analysis Based on the Fuzzy Autoregressive Hierarchical Process (LMMA-FAHP) model has been developed. This model meets all validity criteria, shows no signs of spuriousness, and outperforms previous models in terms of performance. It is highly suitable for policy formulation and strategic planning to guide the country’s long-term governance toward achieving net-zero emissions by 2065. The findings indicate that the new scenario policy, with an appropriateness rating of over 80%, includes factors such as the clean technology rate, biogas energy, biofertilizers, organic fertilizers, anaerobic digestion rate, biomass energy, biofertilizer rate, renewable energy rate, green material rate, waste biomass, and organic waste treatments. All indicators demonstrate a high sensitivity level. When the new scenario policy is incorporated into future greenhouse gas emissions forecasts (2025–2065), the research reveals a declining growth rate of emissions, reaching 78.51 Mt CO2 Eq., with a growth rate of 11.35%, which remains below the carrying capacity threshold (not exceeding 101.25 Mt CO2 Eq.). Moreover, should the government adopt and integrate these indicators into national governance frameworks, it is projected that greenhouse gas emissions by 2065 could be reduced by as much as 36.65%, significantly exceeding the government’s current reduction target of 20%. This would enable the government to adjust its carbon sequestration strategies more efficiently. Additionally, qualitative research was conducted by engaging stakeholders from the public sector, private sector, and agricultural communities to develop adaptive strategies for future greenhouse gas emissions. If the country follows the research-driven approach outlined in this research, it will lead to effective long-term policy and governance planning, ensuring sustainability for Thailand.

1. Introduction

The occurrence of various phenomena, such as seasonal variability, rising temperatures, and changes in sea level, reflects the impacts of climate change [1]. Scientific studies indicate that a key cause of climate change is the accumulation of greenhouse gases in the atmosphere, leading to the Greenhouse Effect, where heat from the sun is trapped by these gases instead of being reflected back into space, gradually increasing the Earth’s temperature [2]. This growing concern has led to a global response, particularly through the Kyoto Protocol, which identifies six major greenhouse gases resulting from human activities (Anthropogenic Greenhouse Gas Emissions): carbon dioxide (CO2), methane (CH4), nitrous oxide (N2O), hydrofluorocarbons (HFCs), perfluorocarbons (PFCs), and sulfur hexafluoride (SF6) [1,2,3]. Each of these gases has a different Global Warming Potential (GWP), which measures their capacity to trap heat in the atmosphere compared to CO2. Methane (CH4) has a GWP of 27.2–29.8 CO2 equivalent, nitrous oxide (N2O) 273 CO2 equivalent, hydrofluorocarbons (HFCs) 771–1526 CO2 equivalent (depending on the type), perfluorocarbons (PFCs) 7380 CO2 equivalent, and sulfur hexafluoride (SF6) 25,200 CO2 equivalent, highlighting the varying degrees of warming impact among different greenhouse gases and emphasizing the importance of reducing emissions to mitigate climate change [2,3,4,5].
Thailand is among the countries that have participated in international climate conferences and committed to reducing greenhouse gas (GHG) emissions. Since 1992, the Thai government has implemented continuous policies to reduce emissions, with efforts spanning 1992–2024 [2,6,7]. It has been observed that the energy and transportation sectors contribute the highest GHG emissions, followed by the agriculture and waste sectors, with annual emissions increasing by no less than 10% each year [3,8,9]. The government has designated the Ministry of Agriculture as the lead agency, working in collaboration with the Ministry of Natural Resources and Environment to achieve net-zero GHG emissions by 2065 [3,4,10,11]. This goal requires balancing GHG emissions with removal rates without relying on carbon credit purchases, as outlined in the country’s long-term national strategy [12]. As a result, Thailand is implementing policies across all sectors to ensure long-term sustainability [3,4,13].
Thailand, with its strong foundation in agriculture and its role as a key global food producer, depends significantly on this sector as a primary driver of national production. A large portion of the population is involved in farming activities, which has led to a gradual increase in greenhouse gas (GHG) emissions, particularly carbon dioxide (CO2), methane (CH4), and nitrous oxide (N2O) [2,3,14,15]. In response, the country has embraced the Climate-Smart Agriculture (CSA) strategy, aiming to strengthen the resilience of the agricultural system in the face of climate change. CSA has three key objectives: (1) sustainably increasing productivity and income, (2) adapting to climate change, and (3) reducing GHG emissions [3,16,17]. These objectives do not necessarily need to be achieved simultaneously but should align with local contexts. CSA involves on-farm and off-farm practices that integrate technology, policies, institutions, and investments. Key components of CSA include farm management (covering crops, livestock, aquaculture, and fisheries) to balance short-term food security with long-term sustainability, ecosystem and landscape management to conserve essential ecological services, and adaptation and mitigation practices to reduce emissions [4]. Additionally, CSA promotes climate risk management for farmers and land managers, encourages transformations in the broader food system, and incorporates demand-side measures and value chain interventions to maximize climate-smart agricultural benefits [2,3,18].
In Thailand, the agriculture sector represents one of the major sources of greenhouse gas (GHG) emissions, following the energy sector. In 2018, which recorded the lowest agricultural GHG emissions, the sector emitted 58,486.02 GgCO2 eq. Livestock contributed 13,115.64 GgCO2 eq. (22.43%), with 10,052.24 GgCO2 eq. from enteric fermentation and 3063.39 GgCO2 eq. from direct and indirect manure management [2,3]. Meanwhile, crop-related emissions accounted for 45,370.38 GgCO2 eq. (77.57%), with rice cultivation being the largest contributor at 29,990.25 GgCO2 eq. (51.28%). Agricultural soils emitted 11,974.34 GgCO2 eq. (20.47%), with 8715.01 GgCO2 eq. from direct sources and 3259.34 GgCO2 eq. from indirect sources. Agricultural waste burning and urea application released 1706.82 GgCO2 eq. (2.92%) and 1671.38 GgCO2 eq. (2.86%), respectively, while lime application had the lowest emissions at 27.59 GgCO2 eq. (0.05%) [4]. Since then, GHG emissions have surged significantly and continue to rise in 2025. While the Thai government has effectively implemented policies to reduce production costs and increase farmers’ incomes, two key objectives of Climate-Smart Agriculture (CSA), adaptation to climate change and GHG emissions reduction, have not been successfully achieved. Emissions continue to grow, and there is still a lack of decision-making tools or frameworks to mitigate risks, which this research aims to address [3,19].
The Thai government has initiated actions to protect ecosystems in alignment with its net-zero greenhouse gas (GHG) emissions target by 2065, with a strong focus on the land use, land-use change, and forestry (LULUCF) sector, which is expected to absorb 120 Mt CO2 eq. The goal is to achieve this reduction between 2037 and the end of the century, based on Thailand’s National Strategy (2018–2037), which aims to increase forest and green areas to 55% of the country’s total land area [2,3]. GHG emissions from various sources are projected to peak at 388 Mt CO2 eq. by 2025, with the energy sector playing a crucial role in post-2025 emissions reduction. Beyond 2050, Thailand’s emission pathway will follow the IPCC’s 1.5 °C trajectory, with the country expected to achieve a balance between emissions and carbon removal by 2065 [4,5]. However, the agriculture sector is also expected to contribute to emission reductions but current data suggests that the Climate-Smart Agriculture (CSA) policy remains largely unimplemented and has a low likelihood of success. Particularly, the CSA has failed to reduce GHG emissions and support climate adaptation, primarily due to the lack of a clear sustainability strategy from the government. This research identifies a long-standing research gap and aims to provide decision-making tools to minimize agricultural GHG emissions. Additionally, relying solely on carbon sequestration remains uncertain and poses considerable challenges for Thailand. Therefore, this research aims to develop effective mitigation and adaptation strategies for greenhouse gas emissions in alignment with Climate-Smart Agriculture policies. To support this goal, an advanced model, referred to as the LMMA-FAHP model, was developed. The study employed a mixed-methods approach, integrating findings from quantitative research into qualitative inquiry to identify key strategies that can guide Thailand toward long-term sustainable development.

2. Literature Review and Research Methodology

The literature on greenhouse gas (GHG) emissions in the agricultural sector highlights the importance of various models and strategies aimed at mitigating the environmental impacts of farming practices. Gołasa et al. [20] explored Poland’s legal and economic frameworks related to carbon farming and certification systems, emphasizing the challenges faced in securing farmer participation and funding. Was et al. [21] examined the energy efficiency of Polish agriculture after the country’s EU accession, revealing a notable 40% reduction in energy intensity, yet noting that energy costs remained persistently high. In Thailand, Soilueang et al. [22] analyzed the role of agroforestry in reducing emissions, finding that coffee intercropped with forest trees not only increased soil carbon stocks but also mitigated deforestation. Kuranc et al. [23] evaluated the use of biogas-powered tractors, discussing their potential for lowering GHG emissions and fostering sustainable resource use. Meanwhile, Wang et al. [24] demonstrated how biochar in paddy fields in the Yangtze River region contributed significantly to carbon sequestration, reducing both emissions and the need for synthetic fertilizers. Ye et al. [25] assessed nitrous oxide emissions in China’s Anhui province, identifying regional disparities and offering strategies to reduce emissions through better practices.
Recent studies have introduced innovative strategies aimed at enhancing agricultural sustainability while reducing GHG emissions. Taha et al. [26] demonstrated how optimizing nitrogen fertilizer use in garlic farming could reduce emissions by maintaining high yields, with a 75% nitrogen dose proving the most efficient. In the Baltic countries, Štreimikiene et al. [27] applied multi-criteria decision-making to assess agri-environmental indicators, finding Latvia as a leader in sustainability due to practices such as organic farming and biodiversity conservation. Prigoreanu et al. [28] focused on the EU’s Green Deal policies, underscoring the need for coordinated approaches to cut emissions and conserve resources by 2030. Additionally, Hamam et al. [29] proposed wastewater reuse in agriculture, highlighting its role in the circular economy by reducing carbon footprints and supplying nutrient-rich fertigation solutions. Htike et al. [30] explored converting agricultural biomass waste into bio-chemicals like xylitol and ethanol, presenting a promising model for sustainable emissions reduction. Zafeiriou et al. [31] examined enteric fermentation in livestock, challenging the environmental Kuznets curve and advocating for region-specific policies to address agricultural emissions.
The integration of water and fertilizer management practices has also been identified as key to promoting sustainable agriculture and reducing GHG emissions. Ma et al. [32] investigated the role of climate-smart drip irrigation and fertilizer strategies in tomato production, showing how it improved water use efficiency, crop quality, and yield, while also cutting GHG emissions. Similarly, Chen et al. [33] found that adjusting seedling rates in rice paddies could significantly reduce methane emissions without sacrificing crop yield. Ma et al. [34] also developed a dynamic simulation model using multivariate regression to predict CO2 emissions in winter wheat fields, highlighting the critical influence of environmental factors on carbon fluxes. Hu et al. [35] emphasized the growing importance of transitioning from emission accounting to management practices in reducing agricultural carbon emissions. Yu et al. [36] examined the water-carbon nexus in the Yarkand River Basin, stressing the need for integrated resource management to address both water scarcity and GHG emissions. Eismann et al. [37] used the eddy covariance method to measure methane emissions from dairy cows, providing insights into effective mitigation techniques. Tindwa et al. [38] reviewed regenerative agricultural practices in Africa, noting the significance of sustainable technologies, like smart irrigation and waste-to-fertilizer systems. Chowdhury and Agarwal [39] developed a novel model to assess the role of soil organic carbon (SOC) in mitigating CO2 emissions, highlighting the potential of organic amendments to help meet global sustainability goals. Nelson et al. [40] explored the impact of land conversions on soil-based GHG emissions in Georgia, USA, revealing the often-overlooked role of land degradation caused by agricultural and urbanization activities in contributing to CO2 emissions.
This literature review also explores diverse methods used in forecasting agricultural parameters, particularly focusing on crop yields, water usage, and disease occurrence in agriculture, while also emphasizing the role of greenhouse gas emissions and environmental control. For example, Chebykina and Abakumov [41] investigated the effects of climate change on land suitability in Russia’s Leningrad region, highlighting the role of soil fertility and climate factors in crop productivity. Liang et al. [42] presented the WASH_2D model to optimize irrigation for potatoes, improving water efficiency and nitrogen uptake. Rathod et al. [43] utilized machine learning to forecast rice prices in India, demonstrating how national crises can be anticipated. Liu et al. [44] and Haider et al. [45] focused on forecasting crop diseases and yields, with Liu et al. [46] proposing a model for hot pepper diseases in China and Haider et al. [45] using LSTM networks to predict wheat production in Pakistan. Additionally, Roy et al. [47] applied LSTM and Bi-LSTM models for predicting evapotranspiration, a critical factor for crop water management, and Rathod et al. [48] improved rice yield predictions through a two-stage spatiotemporal time series model, combining linear and nonlinear approaches to enhance forecast accuracy across different regions.
Building upon these studies, another set of research emphasizes the application of advanced predictive modeling techniques in agricultural management, particularly in the context of improving greenhouse gas emission forecasts and resource management. Han and Bae [49] explored the use of AutoML to predict water levels for agricultural reservoirs in South Korea, improving predictive accuracy through machine learning pipelines. Tan et al. [50] integrated eco-evolutionary principles into crop yield forecasting, considering the impact of climate change on wheat yields across China. Karasu et al. [51] investigated the use of historical agricultural data for forecasting road freight demand, while Zamani-Noor et al. [52] examined factors influencing the germination of Sclerotinia sclerotiorum, impacting disease management in crops. Shin et al. [53] used time-series models to predict CO2 concentrations in strawberry greenhouses, underlining the significance of frequent data collection for precise environmental control. Wang et al. [54] applied deep learning models to forecast evapotranspiration trends in Shandong Province, China, under varying climate scenarios, offering insights for irrigation management. Liu [46] developed a prediction model for cucumber downy mildew in solar greenhouses using the Long Short-Term Memory (LSTM) neural network. This model predicts disease occurrence based on environmental factors, achieving high accuracy and offering valuable insights for disease management. Finally, Yousif et al. [55] used geostatistical methods to assess soil variability in Egypt, contributing to sustainable agriculture through site-specific management zone mapping.
After reviewing the existing research, it can be noted that Thailand’s governance under sustainability lacks essential tools for impact analysis and decision-making to mitigate risks. The country’s Climate-Smart Agriculture (CSA) management still has weaknesses in reducing greenhouse gas emissions and adapting to climate change. The government has not taken concrete actions in the past, lacks a clear implementation strategy, and is without high-quality decision-support tools. To address these gaps, this research develops the LMMA-FAHP model as a key strategic tool for reducing greenhouse gas emissions. This research is quantitative and employs secondary data from 1992 to 2024, sourced from government agencies responsible for data collection to determine key indicators. Each agency was required to prepare its data in alignment with the sustainability policy. The data sources include the Office of the National Economic and Social Development Council (NESDC), National Statistical Office, Ministry of Information and Communication Technology, and Department of Alternative Energy Development and Efficiency. Additionally, this research conducted a focus group discussion involving 60 stakeholders to gather insights from key decision-makers. The participants included 10 senior officials from the Ministry of Agriculture, 10 senior officials from the Ministry of Natural Resources and Environment, 10 senior officials from the Office of the National Economic and Social Development Council (NESDC), 10 experts from the Thailand Development Research Institute, and 20 representatives from the agricultural sector. These insights were used to inform policy formulation and the sustainable development plan. The software utilized in this research was RISREL 8.0, which was employed to analyze the causal relationships through path analysis, an advanced statistical technique. Additionally, the model development took into account the key principle of ensuring that the estimated residuals exhibit characteristics of white noise, meaning that the model must not be affected by issues, such as heteroscedasticity, multicollinearity, or autocorrelation. The research methodology is outlined as follows:
  • Selection of indicators based on the national governance framework;
  • Analysis of adaptive capacity to achieve equilibrium under policy implementation;
  • Examination of causal relationships among influencing factors;
  • Prioritization analysis using the LMMA-FAHP model combined with sensitivity analysis;
  • Forecasting of greenhouse gas emissions in the agriculture sector for the long term (2025–2065);
  • Integration of quantitative research findings into the focus group discussion;
  • Discussion and recommendations for sustainable national governance, as shown in Figure 1.
Figure 1 illustrates the research process using a mixed-methods approach, primarily focusing on quantitative research through the development of the LMMA-FAHP model. This model is designed to identify strategies for establishing new scenario policies to guide decision-making and national governance toward achieving net zero GHG emissions by 2065, in alignment with the long-term national strategy. A key focus is on Climate-Smart Agriculture to reduce greenhouse gas emissions and develop adaptation strategies for climate change. These efforts aim to enhance the country’s governance capacity to ensure long-term sustainability.

3. Material and Methods

This research develops a model for optimal decision-making analysis in response to long-term equilibrium changes by applying advanced statistical methods and eliminating weaknesses in previous models. The proposed model, called the Longitudinal Mediated Moderation Analysis Based on the Fuzzy Autoregressive Hierarchical Process (LMMA-FAHP model), differs from traditional models, including structural equation modeling (SEM). While SEM illustrates the influence of latent variables based on theories or empirical studies across various contexts, regression analysis typically focuses only on the causal influence of independent variables without considering whether these influences may be excessively high or low. This limitation has led to the concepts of mediator and moderator variables and their integration into moderated mediation and mediated moderation models. To determine the most appropriate influencing factors, the estimation principle using Fuzzy set theory is necessary. However, simply applying the Fuzzy set approach is insufficient; selecting a suitable and valid model is crucial. This research addresses this by employing the LMMA-FAHP model, ensuring both accuracy and validity in decision-making analysis [56].
A mediator variable plays a crucial role in analyzing the influence of causal relationships between variables, acting as an intermediary between the independent variable (X) and the dependent variable (Y) to establish a connection between them. In some cases, X and Y may not initially appear strongly related, meaning that X’s influence on Y is minimal. However, after analysis, the relationship might be found to be stronger due to the presence of a mediator variable, which can be either a single mediator or multiple mediators, often as latent variables. When reanalyzing data with mediators, if a moderator variable is also introduced, the total effect of X on Y may decrease, potentially reducing to zero or becoming statistically insignificant. This indicates a full mediation effect. Alternatively, if the effect is reduced but remains significant, it suggests a partial mediation effect. The significance of mediation effects is tested through indirect effect analysis using the bootstrapping method. Bootstrapping is one of the resampling techniques derived from Monte Carlo Simulation. It was first introduced and published by Bradley Efron, an American statistician, in 1979. The key advantage of the bootstrapping process is that it allows the creation of new datasets from the original dataset by using a method called sampling with replacement. This can be most easily visualized as follows [56]. Additionally, if the mediator variable collaborates with the independent variable as an auxiliary independent variable, it may modify the influence of X on Y or create comparative effects between groups. This can result in the mediator having a stronger influence, reducing the direct effects of X and Y beyond expected levels, or enhancing the strength and direction of their relationship, as indicated by changes in path coefficients [56,57].
The study of causal influence with a moderator variable (Mo) follows a structural model representation, as illustrated below.
From Figure 2, the relationship follows a hierarchical regression model, which can be expressed using the following equation [56,58]:
Y = f ( X , M o ) + ε
Y = f ( X , M o ) , X M o + ε
From Equations (1) and (2), the influence of the relationships among the variables is illustrated, where the variable on the left-hand side of the function represents the dependent variable, ( Y ) , and the variable on the right-hand side represent the independent variable, denoted as ( f ( X , M o ) ) . In this analysis, a causal relationship approach is employed, comprising causal (independent) variables and outcome (dependent) variables. This causal effect may occur when the independent variable transmits its influence through a moderator variable. Thus, when estimating these equations, all possible relationships must be considered. Failure to account for this may lead to spurious results, undermining the accuracy of the analysis and its predictive applications. Moreover, researchers must be particularly cautious in selecting the appropriate estimation model, as prioritizing mere computational results over methodological rigor can compromise the model’s validity, ultimately affecting long-term policy decisions at the national level. To ensure optimal decision-making in response to long-term equilibrium shifts, this study employs the Fuzzy Autoregressive Hierarchical Process (FAHP). This model integrates Fuzzy set theory with the Fuzzy Analytic Hierarchy Process (FAHP) under the autoregressive properties of the analyzed data. The following section outlines the methodological framework adopted in this study [58,59].

3.1. Estimation Methodology Using the Fuzzy Autoregressive Hierarchical Process (FAHP)

  • Let M F ( R ) be a Fuzzy number if x 0 R satisfies μ m ( x 0 ) = 1 and λ ( 0 , 1 ) , M λ = x , μ m ( x ) λ . The value of μ m can be determined as the membership function of M : R 0 , 1 , as follows [58]:
    μ m ( x 0 ) = ( x l ) / ( m l ) , x l , m ( x u ) / ( m u ) , x m , u 0 o t h e r w i s e
From Equation (3), let l and u be the lower and upper values of the membership function, respectively, while m represents the central value of M . The Triangular Fuzzy Number is represented as l , m , u .
2.
The value of Fuzzy Synthesis can be determined as follows [56,59]:
S i = j = 1 m M ˜ g i j i = 1 n j = 1 m M ˜ g i j 1
From Equation (4), given that
j = 1 m M ˜ g i j = j = 1 m l j . j = 1 m m j . j = 1 m u j
And given that
i = 1 n j = 1 m M ˜ g i j = i = 1 n l j . i = 1 n m j . i = 1 n u j
From Equations (5) and (6), the results can be summarized as follows:
i = 1 n j = 1 m M ˜ g i j 1 = 1 i = 1 n l j . 1 i = 1 n m j . 1 i = 1 n u j
3.
The Degree of Possibility can be determined as follows:
V ( M ˜ 2 M ˜ 1 ) = Y X min ( M ˜ 1 ( x ) , M ˜ 2 ( y ) )
From Equation (8), it is found that
V ( M ˜ 2 M ˜ 1 ) = h g t ( M ˜ 1 M ˜ 2 ) = M ˜ 2 ( d ) = 1 i f   m 2 m 1 0 i f   l 1 u 2 l 1 u 2 ( m 2 u 2 ) ( m 1 l 1 ) o t h e r w i s e
4.
The degree of possibility for k convex fuzzy numbers can be determined as follows:
V ( M ˜ M ˜ 1 , M ˜ 2 M ˜ k ) = min V ( M ˜ M ˜ i ) , i = 1 , 2 , 3 , , k
From Equation (10), given that d ˙ ( A i ) = min V ( s i s k ) for k = 1 , 2 , 3 , , n ; k i , the weight value can be determined as follows [58,60,61]:
W ˙ = ( d ˙ ( A 1 ) , d ˙ ( A 2 ) , , d ˙ ( A n ) t
From Equation (11), when A i = ( i = 1 , 2 , 3 , , n ) is given, the normalization of the weight values can be performed using the following equation:
W = ( d ( A 1 ) , d ( A 2 ) , , d ( A n ) t
From Equation (12), multiplying the obtained values by the decision criteria will yield the final score. The researcher will then rank the scores and select the best one.

3.2. Performance Evaluation of the LMMA-FAHP Model

In this study, the performance of the Longitudinal Mediated Moderation Analysis Based on the Fuzzy Autoregressive Hierarchical Process (LMMA-FAHP) model was evaluated using key statistical metrics, including Mean Absolute Percentage Error (MAPE), Mean Absolute Error (MAE), and Root Mean Square Error (RMSE) [56,57]. These measures were used to assess the model’s accuracy and suitability for future forecasting. To validate its effectiveness, the LMMA-FAHP model was compared against various traditional and advanced predictive models, such as the Artificial Neural Network (ANN), Adaptive Neuro-Fuzzy Inference System (ANFIS), Machine Learning (ML), Deep Learning (DL), Grey Models GM(1,1), Bayesian Network BG(1,1), Neural Network Model (NN), ARIMA, Convolutional Neural Network (CNN), Support Vector Machine (SVM), Genetic Algorithm (GA), Fuzzy Logic, Fuzzy VIKOR, and ARIMAX model. By benchmarking against these models, this study aims to determine whether the LMMA-FAHP model demonstrates superior forecasting capabilities and greater applicability in long-term decision-making.

4. Empirical Analysis

4.1. Selection of Indicators Based on the National Administration Framework

The selection of indicators is based on the national administration framework to achieve the goal of Climate-Smart Agriculture under the sustainability policy. These indicators are used for impact analysis and as an early warning tool, which the government utilizes to guide national administration. To achieve this, the study employs the LMMA-FAHP model to analyze the influence of causal factors, considering four latent variables: the economic sector, civil politics sector, social sector, and environmental sector. All the indicators have been selected in alignment with Thailand’s national administration framework across these four sectors and an analysis of their properties was conducted. The results indicate that only 29 indicators are suitable. The selection of the 29 indicators in this study was based on a set of key national indicators that have been consistently utilized in Thailand’s policy formulation and national planning. Each responsible agency within the respective sectors uses these indicators to support the country’s development, which is categorized into four sectors: economic, social, civil politics, and environmental. These indicators consist of both those originally developed by Thailand and those adapted from international frameworks. Each of them plays a critical role in guiding the country’s long-term development. Some indicators were excluded from this study due to the lack of stationarity, such as the oil price rate and human resource rate, making them unsuitable for inclusion in the model. These selected indicators are designated as observed variables, which explain the variations in each latent variable, including urbanization rate ( X 1 ) , industrial structure rate ( X 2 ) , foreign investment rate ( X 3 ) , total export rate ( X 4 ) , expenditure rate ( X 5 ) , foreign tourism rate ( X 6 ) , ecotourism rate ( X 7 ) , employment rate ( S 1 ) , health and illness rate ( S 2 ) , education rate ( S 3 ) , income distribution rate ( S 4 ) , protection rate ( S 5 ) , clean technology rate ( M 1 ) , Biofertilizer ( M 2 ) , Organic Fertilizer ( M 3 ) , Anaerobic Digestion rate ( M 4 ) , Biomass energy ( M 5 ) , Biofertilizers rate ( M 6 ) , renewable energy rate ( M 7 ) , green material rate ( M 8 ) , waste biomass ( M 9 ) , organic waste treatments ( M 10 ) , taxonomy rate ( M 11 ) , and Biogas Energy ( M 12 ) , total energy consumption ( Z 1 ) , energy intensity rate ( Z 2 ) , Carbon dioxide emissions ( Z 3 ) , Methane emission ( Z 4 ) , and Nitrous oxide emission ( Z 5 ) . All 29 indicators underwent a logarithmic transformation and were subjected to a unit root test. The results from the Augmented Dickey-Fuller (ADF) test indicate that the test statistic for each indicator is greater than the MacKinnon critical value at the first difference level, I(1). This demonstrates statistical significance at the given significance level, α = 0.01 .

4.2. Analysis of Adaptability to Equilibrium upon Policy Implementation

This study analyzes the adaptability to equilibrium upon policy implementation using the co-integration test. The researcher conducted the test by applying all indicators at the first difference at the given statistical significance level. The results are presented as follows:
From Table 1, *** denotes significance α = 0.01 As for the economic sector, it consists of the observed variables: X 1 is the urbanization rate, X 2 is the industrial structure rate, X 3 is the foreign investment rate, X 4 is the total export rate, X 5 is the expenditure rate, X 6 is the foreign tourism rate, X 7 is the ecotourism rate, the social sector comprises the observed variables, including S 1 is the employment rate, S 2 is the health and illness rate, S 3 is the education rate, S 4 is the income distribution rate, S 5 is the protection rate, the civil politics sector includes the observed variables, namely M 1 is the clean technology rate, M 2 is the Biofertilizer, M 3 is the Organic Fertilizer, M 4 is the Anaerobic Digestion rate, M 5 is the Biomass energy, M 6 is the Biofertilizers rate, M 7 is the renewable energy rate, M 8 is the green material rate, M 9 is the waste biomass, M 10 is the organic waste treatments, M 11 is the taxonomy rate, and M 12 is the Biogas Energy, while the environmental sector includes the observed variables, including Z 1 is the total energy consumption, Z 2 is the energy intensity rate, Z 3 is the Carbon dioxide emissions, Z 4 is the Methane emission, and Z 5 is the Nitrous oxide emission. The test results indicate that when the government takes action or implements a policy that causes an impact, different indicators exhibit varying abilities to adjust back to equilibrium. This study applies the co-integration test using all indicators at the first difference level. The findings show that the Trace Statistic Test and Max-Eigen Statistic Test are 215.05 and 255.10, respectively, with both exceeding the MacKinnon critical value at the α = 0.01 significance level. This confirms that any government action induces changes, and all indicators in Table 1 demonstrate the ability to adjust back to equilibrium. Among the four sectors analyzed, the civil politics sector exhibits the fastest adaptability to equilibrium, followed by the economic sector, social sector, and environmental sector, in that order. This adaptability analysis provides the government with insights on which policy areas should be prioritized, ensuring that policy implementation in sectors with faster equilibrium adjustments will drive changes more effectively and influence other sectors more rapidly. Thus, this study confirms that all indicators can be utilized in developing the LMMA-FAHP model.
The findings of this study reveal that the environmental sector has the slowest adaptability compared to the civil politics sector, economic sector, and social sector. This indicates that if the government implements policies with a direct effect on the environmental sector, they may be ineffective due to the sector’s low adaptability, as reflected in a E c m t 1 value lower than 10%. Therefore, it is necessary to design policies that create an indirect effect, influencing other latent variables, which in turn impact the environmental sector more effectively. The details regarding direct effects and indirect effects are presented as follows:

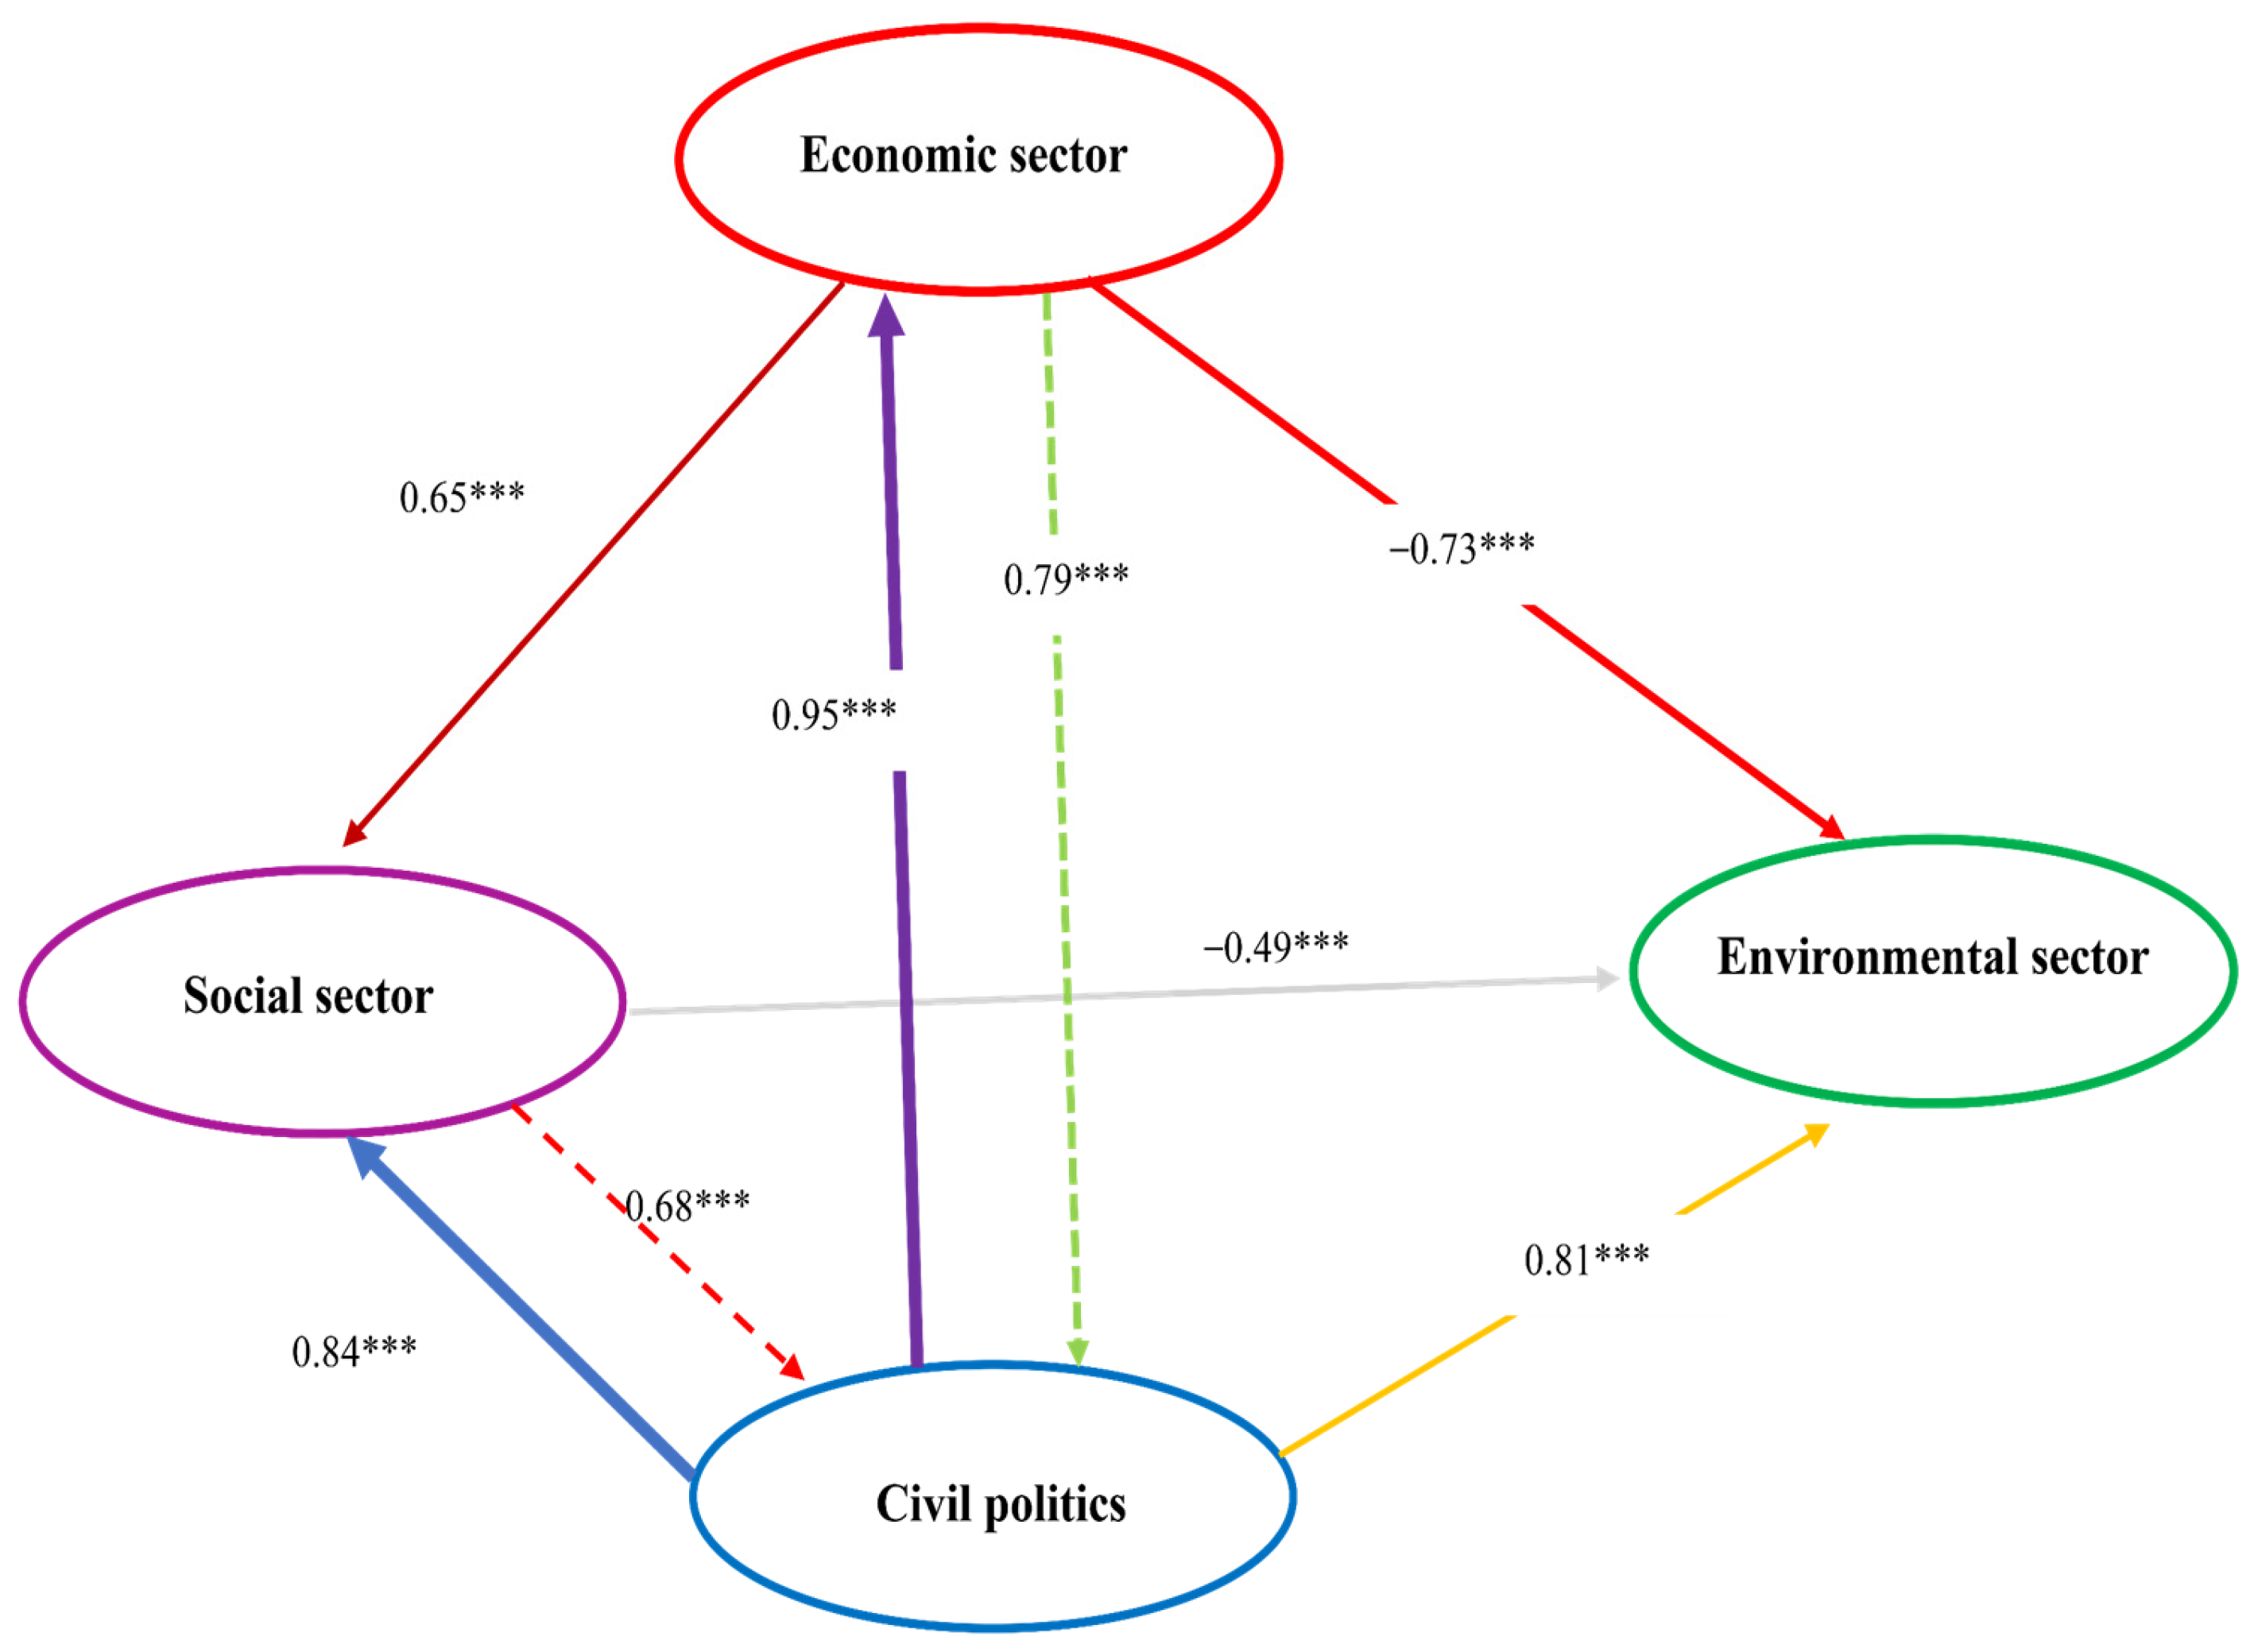
4.3. Analysis of the Influence Pathways of Causal Relationships

The analysis of the influence pathways among the four latent variables, namely the economic sector, social sector, environmental sector, and civil politics sector, is presented as follows:
From Table 2, the researcher conducted an evaluation of the validity, measurement of model fit, and white noise for the LMMA-FAHP model using various statistical criteria, with the details as follows:
  • Validity Assessment: The validity check of the LMMA-FAHP model confirms that the model meets the required standards. The statistical criteria used for assessment are the following: H T M T i j = 0.75 , A V E q = 0.95 , Cronbach’s alpha α q = 0.97 , and Composite Reliability (CR) p q = 0.09 ; all passed the evaluation benchmarks;
  • Measurement of Model Fit: The model fit assessment details are as follows:
    1
    Chi-square statistic = χ 2 / d f = 2.60 ;
    2
    Root Mean Squared Residual (RMSR) = R M R = 0.05 ;
    3
    Root Mean Square Error of Approximation (RMSEA) = R M S E A = 0.08 ;
    4
    Standardized Root Mean Square Residual (SRMR) = S R M R = 0.02 ;
    5
    Normal Fit Index (NFI) = N F I = 0.95 ;
    6
    Non-Normed Fit Index (NNFI) = N N F I = 0.95 ;
    7
    Comparative Fit Index (CFI) = C F I = 0.92 ;
    8
    Goodness of Fit Index (GFI) = G F I = 0.90 ;
    9
    Adjusted Goodness of Fit Index (AGFI) = A G F I = 0.95 ;
  • Spurious Relationship Testing: The assessment found no issues of heteroscedasticity ( L M t e s t > L M v a l u e ), multicollinearity ( V I F = 2.55 ), or autocorrelation (Durbin Watson: D.W. = 1.95).
Based on the above evaluation, the LMMA-FAHP model meets all statistical assessment criteria, confirming that it is a suitable model for long-term forecasting.
Table 2 illustrates the relationship pathways derived from the LMMA-FAHP model, which has been rigorously tested and validated across all necessary dimensions. The researcher found that the causal factors ranked highest in terms of influence, with relationship effect values exceeding 0.80 at a statistically significant level, α = 0.01 . Specifically, the civil politics sector demonstrated the highest direct effect on the economic sector, with a value of 0.84, indicating its suitability for further moderator analysis. This was followed by the direct effect of the civil politics sector on the social sector, with a value of 0.82, and on the environmental sector, with a value of 0.80, each at their respective levels of a statistical significance of α = 0.01 . The analytical findings can be summarized as follows.
From Figure 3, the results reflect an improved model analysis. Compared to the original LMMA-FAHP model, incorporating a moderator variable, the civil politics sector, which is an exogenous latent variable, shows that it has a direct effect on the economic sector, social sector, and environmental sector, with the influence levels increasing to 0.95%, 0.84%, and 0.81%, respectively, at a statistically significant level of α = 0.01 . Additionally, the economic sector and social sector exhibit a direct influence on the civil politics sector, with effect sizes of 0.79% and 0.68%, respectively. These influences are further transmitted to the environmental sector, demonstrating that while the civil politics sector directly affects the environmental sector, it also exerts indirect effects through the economic and social sectors at a statistically significant level of α = 0.01 . Thus, if the government aims to directly impact the environmental sector, it may face challenges in achieving immediate success due to the slow equilibrium adjustment of this sector. The findings suggest that the environmental sector lacks the capacity to adapt quickly when policies are implemented. Therefore, for policy effectiveness in the long run, the government should implement policies through the economic and social sectors, ensuring a more sustainable and efficient approach.

4.4. Priority Analysis Using the LMMA-FAHP Model Combined with Sensitivity Analysis

In this study, the LMMA-FAHP model was applied to assess the suitability of indicators for establishing a new scenario policy. The priority ranking of these indicators is as follows: clean technology rate, biogas energy, biofertilizer, organic fertilizer, anaerobic digestion rate, biomass energy, biofertilizer rate, renewable energy rate, green material rate, waste biomass, and organic waste treatments. To ensure the appropriateness of these indicators for policy formulation, a sensitivity analysis was conducted. The results indicate that the clean technology rate has the highest sensitivity at 95%, followed by biogas energy (93%), green material rate (93%), biofertilizer (90%), organic fertilizer (90%), anaerobic digestion rate (90%), biomass energy (85%), biofertilizer rate (85%), renewable energy rate (83%), waste biomass (80%), and organic waste treatments (80%). However, the sensitivity analysis only considers indicators with a sensitivity level of 80% or higher, aligning with the selection criteria of the LMMA-FAHP model. Indicators that do not meet this threshold were excluded from consideration in this study. Nevertheless, these excluded indicators may still be relevant for formulating national policies and plans in the medium or short term.

4.5. Long-Term Forecasting of Greenhouse Gas Emissions in the Agricultural Sector (2025–2065)

In this study, the performance of the LMMA-FAHP model was evaluated before being applied for long-term forecasting. The evaluation involved a comparison with historical models, using statistical metrics such as Mean Absolute Percentage Error (MAPE), Mean Absolute Error (MAE), and Root Mean Square Error (RMSE). The LMMA-FAHP model was compared against various past models, including the Artificial Neural Network (ANN), Adaptive Neuro-Fuzzy Inference System (ANFIS), Machine Learning (ML), Deep Learning (DL), Grey Models GM(1,1), Bayesian Network BG(1,1), Neural Network Model (NN), ARIMA, Convolutional Neural Network (CNN), Support Vector Machine (SVM), Genetic Algorithm (GA), Fuzzy Logic, Fuzzy VIKOR, and ARIMAX. The performance results of these models are presented below.
Table 3 presents the performance evaluation results using MAPE, RMSE, and MAE to compare the performance of this study’s model with previous research models. The findings indicate that the LMMA-FAHP model demonstrates the highest performance, with the lowest statistical values of MAPE, RMSE, and MAE recorded at 1.05%, 1.30%, and 1.35%, respectively. In comparison, the next best-performing model is the ARIMAX model, with MAPE, RMSE, and MAE values of 3.25%, 3.50%, and 3.99%, respectively. Other models ranked as follows: Fuzzy VIKOR (3.68%, 3.98%, 4.02%), Fuzzy Logic (3.81%, 4.11%, 4.27%), GA (4.05%, 4.36%, 4.52%), SVM (4.32%, 4.57%, 4.77%), CNN (4.79%, 4.87%, 4.95%), ARIMA (5.19%, 5.34%, 5.45%), NN (5.46%, 5.59%, 5.72%), BG(1,1) (5.50%, 5.61%, 5.75%), GM(1,1) (5.79%, 5.85%, 5.92%), ML (6.21%, 6.35%, 6.44%), ANFIS (6.35%, 6.79%, 6.87%), and ANN (6.56%, 7.11%, 7.89%). These results confirm that the LMMA-FAHP model is the most suitable for long-term forecasting of greenhouse gas emissions in the agricultural sector from 2025 to 2065, aligning with the net-zero GHG emissions policy objectives. The results are illustrated as follows.
Figure 4 illustrates the long-term forecasting of greenhouse gas emissions in the agricultural sector for the period 2025–2065. The results indicate a significant increase in greenhouse gas emissions, with a projected growth rate of 76.92% (2065/2025). The total greenhouse gas emissions are expected to reach 123.93 Mt CO2 Eq., exceeding the designated carrying capacity limit of 101.25 Mt CO2 Eq. However, when incorporating the indicators derived from this study, including clean technology rate, biogas energy, biofertilizer, organic fertilizer, anaerobic digestion rate, biomass energy, biofertilizers rate, renewable energy rate, green material rate, waste biomass, and organic waste treatments, the growth rate of greenhouse gas emissions declines significantly. Under these conditions, total emissions are projected to reach 78.51 Mt CO2 Eq., with a reduced growth rate of 11.35%, staying well below the carrying capacity threshold of 101.25 Mt CO2 Eq. Furthermore, if the government adopts policies based on these indicators, greenhouse gas emissions in 2065 can be reduced by 36.65%, surpassing the government’s target reduction of 20%. This study confirms that utilizing the LMMA-FAHP model as a policy and planning tool can effectively support decision-making toward achieving net-zero GHG emissions by 2065, ensuring long-term sustainability.

4.6. Integrating Quantitative Research Findings into a Focus Group Discussion

The findings from the quantitative research were integrated into a focus group discussion. The results provided strategies for reducing greenhouse gas emissions, which were then used to develop climate adaptation planning strategies. Through brainstorming sessions, these findings contributed to proposing national management strategies based on Climate-Smart Agriculture. It is crucial for the agricultural sector to have a development plan that effectively adapts to climate change. This focus group session was organized to allow stakeholders to engage in strategic brainstorming. A semi-structured approach was adopted, where the researcher outlined key themes to guide the discussion, while the core insights and recommendations emerged organically from the participants. This approach maximized stakeholder engagement, enabling them to share their opinions and suggestions in-depth. The ultimate objective is to formulate strategic policies that support the sustainable development of Thailand’s agricultural sector. This goal is of national importance, as farmers, Thailand’s largest occupational group, are central to the country’s economic and social fabric. Proper, inclusive, and adaptive strategies are essential to ensure their long-term well-being and productivity. Since a major portion of the country’s land use is dedicated to agriculture, the role of responsible agencies in policy-making is even more vital. The focus group involved 60 key stakeholders, including 10 senior officials from the Ministry of Agriculture, 10 from the Ministry of Natural Resources and Environment, 10 from the Office of the National Economic and Social Development Council (NESDC), 10 experts from the Thailand Development Research Institute (TDRI), and 20 representatives from the agricultural sector. The insights gathered were instrumental in shaping policy direction and sustainable development plans. The key conclusion from the discussion is as follows:
  • Key Development Area 1: Enhancing the Adaptive Capacity of Farmers and Agricultural Supply Chain Stakeholders. This development area consists of three main approaches:
    1.1
    Strengthening Farmers’ Adaptability to Climate Change (Climate-Smart Agriculture)
    (a)
    Promoting and supporting the implementation of Alternative Wetting and Drying (AWD) for irrigated rice cultivation. This practice is already partially implemented by the Ministry of Agriculture and Cooperatives as a core national policy. It was strongly recommended that this policy be scaled and expanded to cover the entire country in order to enhance its impact;
    (b)
    Encouraging agricultural insurance by utilizing technology to design efficient and sustainable programs, leveraging behavioral insights to drive strong market participation from both supply and demand sides, and reforming the government’s role in market development, including redesigning subsidies and disaster assistance to support the insurance market;
    (c)
    Supporting and promoting integrated farming systems to increase net income and reduce production and market risks, as opposed to monoculture farming;
    (d)
    Encouraging New Theory Agriculture to enhance farmers’ net income and reduce household food expenses;
    (e)
    Strengthening farmer organizations in all areas to build resilience;
    (f)
    Promoting land consolidation and the sharing economy for small-scale farmers to improve access to modern machinery and digital technology at affordable costs.
    1.2
    Increasing the Adoption and Integration of Technology Across the Agricultural Supply Chain
    1.3
    Enhancing Soil Fertility, Ecosystems, and Water Availability and Accessibility. This includes four key activities:
    (a)
    Improving water demand management policies to enhance water use efficiency, particularly by implementing appropriate water pricing both within and beyond the agricultural sector in water-scarce areas with multi-sectoral water usage, in accordance with applicable legal frameworks;
    (b)
    Investing in the expansion of irrigation areas and supporting the development of various water sources outside irrigation zones for farmers and agricultural institutions;
    (c)
    Promoting agricultural production in suitable cultivation areas that align with soil types and water availability;
    (d)
    Strengthening agricultural resilience by sustainably enhancing soil fertility and ecosystems in a way that aligns with the local context.
  • Key Development Area 2: Participation in Reducing Greenhouse Gas Emissions Throughout the Agricultural Supply Chain to Mitigate Long-Term Climate Change Impacts. This development area consists of two main approaches:
    2.1
    Promoting Environmentally Friendly and Low-Carbon Agricultural Production Aligned with Nationally Determined Contributions (NDCs) and Long-Term Strategies (LTSs). This includes six key activities:
    (a)
    Encouraging and supporting the reduction in open-field burning for harvesting and land management by utilizing agricultural residues in rice, sugarcane, and maize cultivation. This aims to lower greenhouse gas emissions and mitigate air pollution from PM2.5 (Group 1 carcinogen), which has widespread health impacts across all regions of the country. Specific targets will be set for reducing burning practices in rice and maize production within an appropriate timeframe;
    (b)
    Promoting and supporting the optimal use of fertilizers based on soil analysis and crop nutrient requirements (Site-Specific Nutrient Management—SSNM), which helps reduce production costs and greenhouse gas emissions;
    (c)
    Encouraging and facilitating the improvement in livestock and aquaculture production processes to increase net income and reduce greenhouse gas emissions;
    (d)
    Supporting and promoting agricultural production in compliance with Good Agricultural Practices (GAPs) standards;
    (e)
    Enhancing circular economy practices in agriculture by establishing demonstration sites for agricultural recycling, fostering research and development of recycling technologies, and adding value to agricultural by-products for reuse;
    (f)
    Promoting and facilitating greenhouse gas emission reductions in agricultural production, including developing carbon credit market mechanisms for the agricultural sector to incentivize adaptation and emission reductions.
    2.2
    Supporting the Market for Low-Carbon Agricultural Products: This involves promoting and facilitating the expansion of the market value for low-carbon agricultural products through various tools, such as incentive measures, access to low-interest credit, marketing education, packaging design, and management support for farmers and entrepreneurs.
  • Key Development Area 3: Building a Knowledge Database and Raising Awareness on Climate Change Impacts, Adaptation, and Greenhouse Gas Emission Reduction.
    This development issue focuses on enhancing knowledge, data management, and awareness regarding the impact of climate change and the importance of adaptation and greenhouse gas emission reduction. It consists of three key development approaches:
    3.1
    Enhancing Resource and Risk Management Efficiency
    (a)
    Promote and support the development of an integrated climate change database to forecast future climate change impacts on the agricultural sector;
    (b)
    Promote and support the development of risk management systems, such as early warning systems.
    3.2
    Expanding Knowledge and Research
    3.3
    Developing Databases and Knowledge Dissemination
    (a)
    Support the development of scientific, technological, and adaptive tools for climate change across different regions of the country to facilitate the Ministry of Agriculture and Cooperatives’ regional operations;
    (b)
    Promote diverse accessible knowledge dissemination methods tailored to different age groups, capacities, and levels of vulnerability to climate change impacts;
    (c)
    Promote and support farmers’ access to essential information (e.g., production, marketing, and regulations) to facilitate timely and informed decision-making in agricultural production.
  • Key Development Area 4: Enhancing Workforce Capacity in the Agricultural Sector and Strengthening Partnerships to Address Climate Change Across All Sectors and Levels
    This development issue focuses on building human resource capacity in the agricultural sector and fostering collaboration among stakeholders to effectively respond to climate change. The key development approaches are as follows:
    4.1
    Raising Awareness of Climate Change. It is to promote and support awareness-raising efforts on the negative impacts of climate change, the importance of adaptation, and participation in greenhouse gas emission reduction in the agricultural sector. These efforts should be implemented across all levels, including farmers, government administrators, the private sector, and consumers.
    4.2
    Enhancing Personnel Competencies Aligned with Local Contexts
    (a)
    Promoting and supporting the upskilling and reskilling of farmers by providing knowledge and hands-on training on suitable adaptation methods. These include alternative low-water crops to replace rice, alternate wet and dry rice cultivation, heat stress reduction in livestock, and sustainable fishing practices amid changing monsoon patterns. This should be integrated with local educational institutions and supported with funding to address limitations in government staffing;
    (b)
    Developing and recruiting new-generation researchers to tackle climate change challenges. Key areas of expertise include plant, livestock, and aquatic physiology and breeding; genetic improvement in economically significant aquatic species; soil science; rice production technology; plant pathology; epidemiology and disease prevention in livestock and aquatic species; and entomology;
    (c)
    Promoting and supporting capacity building for personnel in the Measurement, Reporting, and Verification (MRV) of greenhouse gas emissions across the entire agricultural supply chain. This includes enhancing knowledge and expertise in agricultural climate action planning and implementation.
  • Development Issue 5: Driving and Advancing Climate Change Actions
    This development issue focuses on promoting and accelerating climate change actions. It consists of three key development approaches:
    5.1
    Enhancing Integration with Agencies Outside the Ministry of Agriculture and Cooperatives
    (a)
    Develop up-to-date climate change curricula that balance academic content with practical applications and meet the needs of stakeholders through a participatory approach;
    (b)
    Promote access to credit and financial support, which are key factors influencing farmers’ decisions to adapt to climate change;
    (c)
    Promote and support the development of measurable, reportable, and verifiable (MRV) processes for greenhouse gas emissions and reductions at the policy and measure levels by integrating efforts with relevant agencies;
    (d)
    Promote and support carbon credit trading in the agricultural sector, both in domestic and international markets;
    (e)
    Promote and support collaboration in applying Cold Chain Management and Development to reduce food loss and maintain agricultural product quality in response to climate change;
    (f)
    Promote and support the development of mechanisms and initiatives to enhance the added value of the low-carbon agricultural market;
    (g)
    Amend and revise laws and regulations that hinder the advancement of climate change solutions in the agricultural sector.
    5.2
    Enhancing Integration Among Agencies Within the Ministry of Agriculture and Cooperatives
    (a)
    Develop regional action plans and budgets for climate change adaptation that align with the missions of different agencies within the Ministry of Agriculture and Cooperatives;
    (b)
    Encourage department-level agencies within the ministry to develop their own climate change adaptation plans that identify climate risks, prioritize necessary actions, and integrate climate adaptation into project planning, operations, and management, as well as drive project and activity implementation accordingly;
    (c)
    Develop a monitoring and evaluation system for climate-responsive agricultural action plans that ensures timely implementation, collaboration among all ministry agencies, and continuous improvement.
    5.3
    Reforming and Developing Regulations, Laws, Standards, Incentives, and Environmental Policies to Influence Behavior
    (a)
    Establish regional and/or provincial climate change learning centers related to agriculture to promote knowledge transfer, increase awareness, and facilitate the adoption of Climate-Smart Adaptation Strategies;
    (b)
    Shift from unconditional farmer assistance policies to conditional support policies to enhance production efficiency and reduce climate change impacts;
    (c)
    Promote and support the use of economic measures and financial mechanisms to aid climate adaptation and greenhouse gas reduction in the agricultural sector.
Promote and support the development of production standards to facilitate climate adaptation and greenhouse gas reduction in the agricultural sector.

5. Discussion

This study introduces an advancement with the LMMA-FAHP model, a validated model that demonstrates robust estimation results without spurious effects, as no issues of autocorrelation, multicollinearity, or heteroscedasticity were detected. When analyzing the causal relationships of influencing factors, the model accurately and appropriately explains their effects. Given that the LMMA-FAHP model outperforms historical models, it is highly suitable for long-term forecasting (2025–2065). The findings indicate that this model serves as a crucial decision-making tool for impact analysis and as an early warning system for governments to take timely and effective actions. This ensures alignment with Climate-Smart Agriculture strategies and supports the goal of achieving net-zero emissions by 2065.
The findings of this study reveal that for the effective implementation of Climate-Smart Agriculture policies, the government must take action in three key areas: enhancing productivity and sustainable income, adapting to climate change, and reducing greenhouse gas emissions. However, past governance efforts have largely succeeded in only one aspect, boosting productivity and income sustainability, which is closely linked to economic management. In contrast, the other two areas, climate change adaptation and emission reduction, have failed completely, particularly in terms of reducing greenhouse gas emissions. The research indicates that greenhouse gas emissions in Thailand’s agricultural sector have been growing exponentially, yet no clear strategy has been established to address the issue. Moreover, there are no effective tools in place to mitigate emissions, and key decision-makers continue to overlook the problem, under the mistaken belief that the agriculture sector emits less than the energy and transport sectors. This misconception has severe consequences for the country. To achieve net-zero GHG emissions by 2065, every sector must reduce emissions by at least 20–40%, with the remainder being offset through carbon sequestration. However, if emissions from the agriculture sector continue to grow unchecked, Thailand will fail to meet its targets, leading to severe ecological consequences in the future. This highlights the urgent need for concrete action across all sectors before it is too late.
The analysis conducted in this study aimed to develop a new scenario policy using the LMMA-FAHP model. The findings indicate that the model successfully generates a strategic decision-making framework for national governance, ensuring an optimal and effective direction. The proposed new scenario policy incorporates key indicators such as clean technology rate, Biogas Energy, Biofertilizer, Organic Fertilizer, Anaerobic Digestion rate, Biomass Energy, Biofertilizers rate, Renewable Energy rate, Green Material rate, Waste Biomass, and Organic Waste Treatments. All these indicators demonstrate a high sensitivity level, exceeding 80%, aligning with long-term national objectives for achieving net-zero GHG emissions. When applying this new scenario policy for future projections (2025–2065), the results indicate a continuous decline in greenhouse gas emissions growth, reaching 78.51 Mt CO2 Eq., with a growth rate of 11.35%, which remains below the carrying capacity threshold of 101.25 Mt CO2 Eq. If the government’s policies are fully committed—alongside active participation from the population, productive sectors, farmers, and other relevant stakeholders—there is potential to achieve up to a 36.65% reduction by 2065. However, several challenges hinder the realization of this target. These include environmental management policies that lack effective implementation tools and strategic frameworks for achieving long-term continuous sustainable development; insufficient budgetary support from the government; limited capacity for greenhouse gas sequestration; the absence of modernized laws and regulations with flexible enforcement mechanisms; and the lack of an appropriate monitoring and evaluation system, among others, surpassing the government’s initial 20% reduction target. This outcome is highly beneficial, as it enhances the balance between emission reductions and carbon sequestration. However, to achieve true sustainability, the government must take decisive action in adopting advanced carbon capture technologies alongside expanding forest plantations. These efforts must be reinforced by strict legal frameworks and proper enforcement to ensure Thailand’s successful transition to net-zero GHG emissions in the long term.
The findings of this study align with the hypothesis in all aspects. Moreover, the research has led to significant insights and strategic recommendations for national governance, aiming to achieve Climate-Smart Agriculture and ultimately reach net-zero emissions by 2065 efficiently. Additionally, the study is consistent with previous research, including Wattana et al. [62], Wattana and Wattana [63], Sutthichaimethee et al. [64], Sutthichaimethee et al. [65], and Sutthichaimethee et al. [66], further reinforcing its validity. In the long term, if Thailand successfully implements the proposed action plans and transforms all aspects of the agricultural sector as outlined in this study, it will lead to a substantial reduction in greenhouse gas emissions, fostering a truly sustainable future.
Future Policy Recommendations: The implementation of Climate-Smart Agriculture under Sustainability Policy is crucial for the long-term management of natural resources and the environment to maximize efficiency. Therefore, careful planning is essential for development initiatives. The government must act prudently and establish a clear strategic direction for future actions. The following recommendations should be considered:
  • Develop action plans tailored to the specific context of each region;
  • Promote group-based farming for alternate wetting and drying (AWD) rice cultivation;
  • Set clear targets for reducing greenhouse gas emissions in the agricultural sector;
  • Create incentives for private investment in agricultural carbon credits and establish a well-functioning carbon market;
  • Link research efforts with the Greenhouse Gas Management Organization (Public Organization) to improve carbon credit measurement and facilitate actual trading;
  • Provide financial support to small-scale farmers who lack sufficient budget to participate in carbon trading;
  • Prioritize adaptation strategies that enhance primary income sources first, before considering revenue from carbon credit sales;
  • Increase awareness across the entire supply chain, from production to consumption, and design appropriate incentive measures;
  • Establish demonstration sites or learning centers for integrated low-carbon agricultural production;
  • Identify specific agricultural products that will be prioritized for greenhouse gas reduction during the action plan’s implementation period;
  • Strengthen research and knowledge development to explore adaptive strategies and mitigation measures suited to local conditions, especially through Climate-Smart Agriculture approaches;
  • Develop data collection, monitoring, and evaluation systems to track agricultural activities continuously.
Furthermore, this study faced limitations in terms of missing indicators that ideally should have been included to enhance the model, particularly those related to the international sector and neighboring countries, which significantly influence greenhouse gas emissions reductions in agriculture. For instance, the cross-border waste rate is relevant but could not be analyzed due to incomplete data collection and limited cooperation from foreign entities. Additionally, the absence of clear international legal frameworks between Thailand and its neighboring countries in terms of enforcement and accountability has posed ongoing constraints in this area.
When it comes to the limitations of Climate-Smart Agriculture governance in Thailand, Thailand’s approach to Climate-Smart Agriculture itself has not been genuinely focused on addressing environmental issues or mitigating climate change impacts. Instead, past efforts have primarily aimed at reducing production costs for farmers, emphasizing maximizing income without adequate consideration for environmental sustainability in agriculture. This approach stems from the perception that the agricultural sector contributes minimally to environmental problems compared to the energy and transportation sectors. Additionally, a lack of transparency in disclosing in-depth data on agricultural governance has further hindered effective climate action. As a result, efforts to manage and respond to environmental challenges have consistently fallen short of achieving their intended goals, preventing Thailand from making meaningful progress toward sustainable agricultural development. Nevertheless, the 12 aforementioned recommendations are highly beneficial for advancing the country’s development and overcoming past challenges that have persisted from 1990 to 2025—provided that the government offers full support and the Cabinet actively promotes them to their fullest capacity. These measures have long been embedded within the framework of the country’s long-term national strategy. To achieve true and sustainable success, the government, as both the administrator and executor, must govern with sincerity and commitment, ensuring that environmental development progresses hand in hand with economic and social growth, which has been steadily evolving to the present day.

Author Contributions

Conceptualization, P.S. (Pruethsan Sutthichaimethee), P.S. (Phayom Saraphirom) and C.J.; methodology, P.S. (Pruethsan Sutthichaimethee), P.S. (Phayom Saraphirom) and C.J.; software, P.S. (Pruethsan Sutthichaimethee), P.S. (Phayom Saraphirom) and C.J.; validation, P.S. (Pruethsan Sutthichaimethee), P.S. (Phayom Saraphirom) and C.J.; formal analysis, P.S. (Pruethsan Sutthichaimethee), P.S. (Phayom Saraphirom), and C.J.; investigation, P.S. (Pruethsan Sutthichaimethee), P.S. (Phayom Saraphirom) and C.J.; resources, P.S. (Pruethsan Sutthichaimethee), P.S. (Phayom Saraphirom) and C.J.; data curation, P.S. (Pruethsan Sutthichaimethee), P.S. (Phayom Saraphirom) and C.J.; writing—original draft preparation, P.S. (Pruethsan Sutthichaimethee), P.S. (Phayom Saraphirom) and C.J.; writing—review and editing, P.S. (Pruethsan Sutthichaimethee), P.S. (Phayom Saraphirom) and C.J.; visualization, P.S. (Pruethsan Sutthichaimethee), P.S. (Phayom Saraphirom) and C.J.; supervision, C.J. and P.S. (Phayom Saraphirom); project administration, C.J. and P.S. (Pruethsan Sutthichaimethee) All authors have read and agreed to the published version of the manuscript..

Funding

This research work was supported by the Research Fund of the Faculty of Engineering, Khon Kaen University, under the Research Scholarship for Ph.D. Students project under Contract Nos. Ph.D-004/2567.

Institutional Review Board Statement

Not applicable.

Informed Consent Statement

Not applicable.

Data Availability Statement

Data are contained within the article.

Acknowledgments

This research work was supported by the Research Fund of the Faculty of Engineering, Khon Kaen University under the Research Scholarship for Ph.D. Students project under Contract Nos. Ph.D-004/2567. This research was supported by the Postharvest Technology Innovation Center, Science, Research and Innovation Promotion and Utilization Division, Office of the Ministry of Higher Education, Science, Research and Innovation, Thailand, and Agricultural Machinery and Postharvest Technology Center, Khon Kaen University, Thailand.

Conflicts of Interest

The authors declare no conflicts of interest.

References

  1. The World Bank: Energy Use (Kg of Oil Equivalent Per Capita) Home Page. Available online: https://data.worldbank.org/indicator/EG.USE.PCAP.KG.OE (accessed on 2 December 2024).
  2. Office of the National Economic and Social Development Council (NESDC). Available online: https://www.nesdc.go.th/nesdb_en/main.php?filename=index (accessed on 2 December 2024).
  3. Thailand Greenhouse Gas Management Organization (Public Organization). Net Zero GHG Emissions. Available online: https://www.tgo.or.th/2023/index.php/th/page/PAG232 (accessed on 5 December 2024).
  4. Department of Alternative Energy Development and Efficiency. Available online: https://pei.dede.go.th/my_MM/dataset/energy-balance-of-thailand (accessed on 12 December 2024).
  5. National Statistical Office Ministry of Information and Communication Technology. Available online: https://dl.parliament.go.th/handle/20.500.13072/425815 (accessed on 10 December 2024).
  6. OECD. Historical Crude Oil Import Prices (Indicator), Organization for Economic Co-operation and Development. Available online: https://data.oecd.org/energy/crude-oil-import-prices.htm (accessed on 5 December 2024).
  7. ONEP. Thailand’s Fourth Biennial Update Report, Office of Natural Resources and Environmental Policy and Planning. Available online: https://www.onep.go.th (accessed on 5 December 2024).
  8. Sutthichaimethee, P. A Framework on Setting Strategies for Enhancing the Efficiency of State Power use in Thailand’s Pursuit of a Green Economy. Int. J. Energy Econ. Policy 2024, 14, 108–120. [Google Scholar] [CrossRef]
  9. United Nations Framework Convention on Climate Change (UNFCCC, Bonn, Germany). The Paris Agreement: An Early Assessment. Environ. Policy Law 2014, 44, 485–488. [Google Scholar]
  10. United Nations Framework Convention on Climate Change (UNFCCC, Bonn, Germany). Global Progress in Environmental Law. Environ. Policy Law 2016, 46, 23–27. [Google Scholar]
  11. Sutthichaimethee, P. Forecasting Economic, Social and Environmental Growth in the Sanitary and Service Sector Based on Thailand’s Sustainable Development Policy. J. Ecol. Eng. 2018, 19, 205–210. [Google Scholar] [CrossRef]
  12. Pollution Control Department Ministry of Natural Resources and Environment. Enhancement and Conservation of National Environmental Quality Act, B.E. 2535. Available online: https://www.pcd.go.th/laws/5406/ (accessed on 11 October 2024).
  13. Thailand Development Research Institute, Carbon Capture Utilization, Carbon Capture Utilization and Storage. Available online: https://thaicarbonlabel.tgo.or.th/tools/files.php?mod=YjNKbllXNXBlbUYwYVc5dVgyUnZkMjVzYjJGaw&type=WDBaSlRFVlQ&files=TkRrPQ (accessed on 11 December 2024).
  14. Pollution Control Department Ministry of Natural Resources and Environment. Principle 4: In Order to Achieve Sustainable Development, Environmental Protection Shall Constitute an Integral Part of the Development Process and Cannot Be Considered in Isolation from It. Available online: https://www.pcd.go.th/laws/ (accessed on 11 December 2024).
  15. Wattana, B.; Sa-Ngiamvibool, W.; Sutthichaimethee, P.; Luo, J.H.; Wattana, S. A well-to-wheel analysis of greenhouse gas emissions from passenger vehicles in Thailand: Strategies for enhancing sustainable transportation. Int. J. Sustain. Dev. Plan. 2025, 20, 981–991. [Google Scholar] [CrossRef]
  16. Sutthichaimethee, P.; Ariyasajjakorn, D. Forecast of Carbon Dioxide Emissions from Energy Consumption in Industry Sectors in Thailand. Environ. Clim. Technol. 2018, 22, 107–117. [Google Scholar] [CrossRef]
  17. Sutthichaimethee, P.; Ariyasajjakorn, D. Forecasting Model on Carrying Capacity for Government’s Controlling Measure under Environmental Law in Thailand: Adapting Non-recursive Autoregression Based on the Var-X Model. Int. J. Energy Econ. Policy 2020, 10, 645–655. [Google Scholar] [CrossRef]
  18. Sutthichaimethee, P.; Mentel, G.; Voloshyn, V.; Mishchuk, H.; Bilan, Y. Modeling the Efficiency of Resource Consumption Management in Construction Under Sustainability Policy: Enriching the DSEM-ARIMA Model. Sustainability 2024, 16, 10945. [Google Scholar] [CrossRef]
  19. DEDE. Energy Balance of Thailand 2022, Department of Alternative Energy Development and Efficiency, Bangkok. Available online: https://www.dede.go.th/ (accessed on 5 December 2024).
  20. Gołasa, P.; Bieńkowska-Gołasa, W.; Cyrek, P.; Cyrek, M. Legal and Economic Framework for Carbon Farming and Carbon Certificates in the EU Using the Example of Poland. Sustainability 2025, 17, 232. [Google Scholar] [CrossRef]
  21. Was, A.; Tsybulska, J.; Sulewski, P.; Krupin, V.; Rawa, G.; Skorokhod, I. Energy Efficiency of Polish Farms Following EU Accession (2004–2021). Energies 2025, 18, 101. [Google Scholar] [CrossRef]
  22. Soilueang, P.; Chromkaew, Y.; Mawan, N.; Wicharuck, S.; Kullachonphuri, S.; Buachun, S.; Wu, Y.-T.; Chen, Y.; Iamsaard, K.; Khongdee, N. Temporal Dynamics of Soil Carbon Stocks and Mineralization Rates in Coffea arabica Agroforestry Systems. Agriculture 2025, 15, 14. [Google Scholar] [CrossRef]
  23. Kuranc, A.; Bawej, S.; Słowik, T.; Šarkan, B.; Dudziak, A.; Zając, G.; Paciolla, F.; Pascuzzi, S.; Łyp-Wrońska, K. Experimental Assessment of Energy-Ecological Parameters of Biogas-Powered Tractor Within Circular Economy. Energies 2025, 18, 7. [Google Scholar] [CrossRef]
  24. Wang, H.; Dong, W.; Shao, D.; Liu, L.; Liao, B.; Gu, W.; Tang, C.; Liu, J.; Hu, W.; Feng, J.; et al. Biochar Enhances Paddy Productivity, Carbon Sequestration, and Reduces Greenhouse Gas Emissions in the Middle Yangtze River Region. Agronomy 2024, 14, 3067. [Google Scholar] [CrossRef]
  25. Ye, Z.; Sun, Y.; Zhang, X.; Yao, Y. Estimation of Nitrous Oxide Emissions from Agricultural Sources and Characterization of Spatial and Temporal Changes in Anhui Province (China). Atmosphere 2024, 15, 1538. [Google Scholar] [CrossRef]
  26. Taha, N.M.; Bukhari, N.A.; Hatamleh, A.A.; Górnik, K.; Sabah, S.S.; Hashem, F.A.; El-Gabry, Y.A.-E.; Shahin, M.G.E.; Lamlom, S.F.; Ahmed, Y.N.; et al. An Attempt to Reduce Nitrogen Fertilization Levels and Their Impact on the Growth and Productivity of Garlic (Allium sativum L.) Under Different Planting Dates. Horticulturae 2024, 10, 1377. [Google Scholar] [CrossRef]
  27. Štreimikiene, D.; Bathaei, A.; Streimikis, J. Evaluating Agri-Environmental Indicators for Land Use Impact in Baltic Countries Using Multi-Criteria Decision-Making and Eurostat Data. Land 2024, 13, 2238. [Google Scholar] [CrossRef]
  28. Prigoreanu, I.; Ungureanu, B.A.; Ungureanu, G.; Ignat, G. Analysis of Sustainable Energy and Environmental Policies in Agriculture in the EU Regarding the European Green Deal. Energies 2024, 17, 6428. [Google Scholar] [CrossRef]
  29. Hamam, M.; Pergamo, R.; Manganiello, V.; Ferrigno, M. Agricultural Wastewater Reuse as a Circular Economy Model: Future Scenarios Considering Reg. (EU) 2020/741. Water 2024, 16, 3638. [Google Scholar] [CrossRef]
  30. Htike, S.L.; Khemacheewakul, J.; Techapun, C.; Phimolsiripol, Y.; Rachtanapun, P.; Phongthai, S.; Tochampa, W.; Taesuwan, S.; Jantanasakulwong, K.; Porninta, K.; et al. Production of Xylitol and Ethanol from Agricultural Wastes and Biotransformation of Phenylacetyl carbinol in Deep Eutectic Solvent. Agriculture 2024, 14, 2043. [Google Scholar] [CrossRef]
  31. Zafeiriou, E.; Galatsidas, S.; Moulogianni, C.; Sofios, S.; Arabatzis, G. Evaluating Enteric Fermentation- Driven Environmental Kuznets Curve Dynamics: A Bayesian Vector Autoregression Comparative Study of the EU and Least Developed Countries. Agriculture 2024, 14, 2036. [Google Scholar] [CrossRef]
  32. Ma, X.; Yang, Y.; Tan, Z.; Cheng, Y.; Wang, T.; Yang, L.; He, T.; Liang, S. Climate-Smart Drip Irrigation with Fertilizer Coupling Strategies to Improve Tomato Yield, Quality, Resources Use Efficiency and Mitigate Greenhouse Gases Emissions. Land 2024, 13, 1872. [Google Scholar] [CrossRef]
  33. Chen, Q.; Li, H.; Huang, H.; Wang, W. Effect of Seedling Rates on Crop Yield and Methane Emissions from Rice Paddies. Atmosphere 2024, 15, 1342. [Google Scholar] [CrossRef]
  34. Ma, J.; Xu, X.; Cui, B.; Hao, X.; Yang, J.; Yang, S.; Liu, L. Multivariate Regression-Based Dynamic Simulation Modeling of Cumulative Carbon Emissions from Fields. Sustainability 2024, 16, 9700. [Google Scholar] [CrossRef]
  35. Hu, J.; Dong, J.; Xu, D.; Yang, Q.; Liang, J.; Li, N.; Wang, H. Trends in Global Agricultural Carbon Emission Research: A Bibliometric Analysis. Agronomy 2024, 14, 2617. [Google Scholar] [CrossRef]
  36. Yu, J.; Pu, S.; Cheng, H.; Ren, C.; Lai, X.; Long, A. Promoting Sustainability: Collaborative Governance Pathways for Virtual Water Interactions and Environmental Emissions. Sustainability 2024, 16, 9309. [Google Scholar] [CrossRef]
  37. Eismann, M.-S.R.; Smit, H.P.J.; Poyda, A.; Loges, R.; Klus, C.; Taube, F. Combining the Eddy Covariance Method and Dry Matter Intake Measurements for Enteric Methane Emission Estimation from Grazing Dairy Cows. Atmosphere 2024, 15, 1269. [Google Scholar] [CrossRef]
  38. Tindwa, H.J.; Semu, E.W.; Singh, B.R. Circular Regenerative Agricultural Practices in Africa: Techniques and Their Potential for Soil Restoration and Sustainable Food Production. Agronomy 2024, 14, 2423. [Google Scholar] [CrossRef]
  39. Chowdhury, R.; Agarwal, V. Mathematical Models and Dynamic Global Warming Potential Calculation for Estimating the Role of Organic Amendment in Net-Zero Goal Achievement. Energies 2024, 17, 4819. [Google Scholar] [CrossRef]
  40. Nelson, D.G.; Mikhailova, E.A.; Zurqani, H.A.; Lin, L.; Hao, Z.; Post, C.J.; Schlautman, M.A.; Shepherd, G.B. Soil-Based Emissions and Context-Specific Climate Change Planning to Support the United Nations (UN) Sustainable Development Goal (SDG) on Climate Action: A Case Study of Georgia (USA). Land 2024, 13, 1669. [Google Scholar] [CrossRef]
  41. Chebykina, E.Y.; Abakumov, E.V. Agroecological Assessment of Arable Lands in the Leningrad Region of Russia under the Influence of Climate Change. Agronomy 2024, 14, 2113. [Google Scholar] [CrossRef]
  42. Liang, S.; Abd El Baki, H.M.; An, P.; Fujimaki, H. Determining Irrigation Volumes for Enhancing Profit and N Uptake Efficiency of Potato Using WASH_2D Model. Agronomy 2022, 12, 2372. [Google Scholar] [CrossRef]
  43. Rathod, S.; Chitikela, G.; Bandumula, N.; Ondrasek, G.; Ravichandran, S.; Sundaram, R.M. Modeling and Forecasting of Rice Prices in India during the COVID-19 Lockdown Using Machine Learning Approaches. Agronomy 2022, 12, 2133. [Google Scholar] [CrossRef]
  44. Liu, K.; Mu, Y.; Chen, X.; Ding, Z.; Song, M.; Xing, D.; Li, M. Towards Developing an Epidemic Monitoring and Warning System for Diseases and Pests of Hot Peppers in Guizhou, China. Agronomy 2022, 12, 1034. [Google Scholar] [CrossRef]
  45. Haider, S.A.; Naqvi, S.R.; Akram, T.; Umar, G.A.; Shahzad, A.; Sial, M.R.; Khaliq, S.; Kamran, M. LSTM Neural Network Based Forecasting Model for Wheat Production in Pakistan. Agronomy 2019, 9, 72. [Google Scholar] [CrossRef]
  46. Liu, K.; Zhang, C.; Yang, X.; Diao, M.; Liu, H.; Li, M. Development of an Occurrence Prediction Model for Cucumber Downy Mildew in Solar Greenhouses Based on Long Short-Term Memory Neural Network. Agronomy 2022, 12, 442. [Google Scholar] [CrossRef]
  47. Roy, D.K.; Sarkar, T.K.; Kamar, S.S.A.; Goswami, T.; Muktadir, M.A.; Al-Ghobari, H.M.; Alataway, A.; Dewidar, A.Z.; El-Shafei, A.A.; Mattar, M.A. Daily Prediction and Multi-Step Forward Forecasting of Reference Evapotranspiration Using LSTM and Bi-LSTM Models. Agronomy 2022, 12, 594. [Google Scholar] [CrossRef]
  48. Rathod, S.; Saha, A.; Patil, R.; Ondrasek, G.; Gireesh, C.; Anantha, M.S.; Rao, D.V.K.N.; Bandumula, N.; Senguttuvel, P.; Swarnaraj, A.K.; et al. Two-Stage Spatiotemporal Time Series Modelling Approach for Rice Yield Prediction & Advanced Agroecosystem Management. Agronomy 2021, 11, 2502. [Google Scholar] [CrossRef]
  49. Han, J.; Bae, J.H. Developing an Hourly Water Level Prediction Model for Small- and Medium-Sized Agricultural Reservoirs Using AutoML: Case Study of Baekhak Reservoir, South Korea. Agriculture 2025, 15, 71. [Google Scholar] [CrossRef]
  50. Tan, S.; Qiao, S.; Wang, H.; Chang, S. Predicting Wheat Potential Yield in China Based on Eco-Evolutionary Optimality Principles. Agriculture 2024, 14, 2058. [Google Scholar] [CrossRef]
  51. Karasu, T.; Leviakangas, P.; Edwards, D.J. Road Freight Demand Forecasting Using National Accounts’ Data—The Case of Cereals. Agriculture 2024, 14, 1980. [Google Scholar] [CrossRef]
  52. Zamani-Noor, N.; Klocke, B.; Dominic, A.R.; Brand, S.; Wusthoff, N.; Papenbrock, J. In-Vivo and In-Vitro Investigation of Germination Rate of Buried Sclerotia, and Variability in Carpogenic Germination Among Sclerotinia sclerotiorum Isolates. Agriculture 2024, 14, 1939. [Google Scholar] [CrossRef]
  53. Shin, S.H.; Deb, N.C.; Arulmozhi, E.; Tamrakar, N.; Ogundele, O.M.; Kook, J.; Kim, D.H.; Kim, H.T. Prediction of Carbon Dioxide Concentrations in Strawberry Greenhouse by Using Time Series Models. Agriculture 2024, 14, 1895. [Google Scholar] [CrossRef]
  54. Wang, Y.; Pang, G.; Wang, T.; Cong, X.; Pan, W.; Fu, X.; Wang, X.; Xu, Z. Future Reference Evapotranspiration Trends in Shandong Province, China: Based on SAO-CNN-BiGRU-Attention and CMIP6. Agriculture 2024, 14, 1556. [Google Scholar] [CrossRef]
  55. Yousif, I.A.H.; Sayed, A.S.A.; Abdelsamie, E.A.; Ahmed, A.A.R.S.; Saeed, M.; Mohamed, E.S.; Rebouh, N.Y.; Shokr, M.S. Efficiency of Geostatistical Approach for Mapping and Modeling Soil Site-Specific Management Zones for Sustainable Agriculture Management in Drylands. Agronomy 2024, 14, 2681. [Google Scholar] [CrossRef]
  56. Enders, W. Applied Econometrics Time Series; Wiley Series in Probability and Statistics; University of Alabama: Tuscaloosa, AL, USA, 2010. [Google Scholar]
  57. Harvey, A.C. Forecasting, Structural Time Series Models and the Kalman Filter; Cambridge University Press: Cambridge, UK, 1980. [Google Scholar]
  58. Dickey, D.A.; Fuller, W.A. Likelihood ratio statistics for autoregressive time series with a unit root. Econometrica 1981, 49, 1057–1072. [Google Scholar] [CrossRef]
  59. Bollen, K. Structural Equations with Latent Variables; John Wiley & Sons: New York, NY, USA, 1989. [Google Scholar]
  60. Pearl, J. Causality: Models, Reasoning, and Inference; Cambridge University Press: New York, NY, USA, 2000. [Google Scholar]
  61. Johansen, S.; Juselius, K. Maximum likelihood estimation and inference on cointegration with applications to the demand for money. Oxf. Bull. Econ. Stat. 1990, 52, 169–210. [Google Scholar] [CrossRef]
  62. Wattana, B.; Wattana, S.; Sa-Ngiamvibool, W.; Thanarak, P.; Luo, J. Electric vehicles penetration in Thailand: Rationale, challenges and strategies. J. Infrastruct. Policy Dev. 2024, 8, 6829. [Google Scholar] [CrossRef]
  63. Wattana, B.; Wattana, S. Implications of electric vehicle promotion policy on the road transport and electricity sectors for Thailand. Energy Strategy Rev. 2022, 42, 100901. [Google Scholar] [CrossRef]
  64. Sutthichaimethee, P.; Saraphirom, P.; Junsiri, C. A Path Analysis—Generalized Method of Moments Based on a NearestNeighbor with Observed Variable Model for Developing New Scenario Policies to Reduce Greenhouse Gas Emissions from Agricultural Waste Towards Sustainability. Appl. Sci. 2025, 15, 2160. [Google Scholar] [CrossRef]
  65. Sutthichaimethee, P.; Saraphirom, P.; Junsiri, C. An Advanced Model for Greenhouse Gas Emission Reduction in the Agricultural Sector to Achieve Sustainability for Thailand’s Future. Appl. Sci. 2025, 15, 1485. [Google Scholar] [CrossRef]
  66. Sutthichaimethee, P.; Sa-Ngiamvibool, W.; Thanarak, P.; Luo, J.; Wattana, S. A Long-Term CO2 Emission Forecasting Under Sustainability Policy Using an Advanced Model Complementing the PAARIMAX Framework. Agriculture 2024, 14, 2342. [Google Scholar] [CrossRef]
Figure 1. Research process. Source: Author’s Estimation (2025).
Sustainability 17 03635 g001
Figure 2. The structural model framework incorporating a moderator variable.
Sustainability 17 03635 g002
Figure 3. Analysis of the influence of causal relationships through moderator analysis in the LMMA-FAHP Model, *** denotes significance α = 0.01.
Sustainability 17 03635 g003
Figure 4. The Forecasting results of total greenhouse gas emission in the agriculture sector from 2025 to 2065 using the LMMA-FAHP model.
Sustainability 17 03635 g004
Table 1. Testing the adaptability to equilibrium upon government policy implementation.
SectorTrace Statistic TestMax-Eigen Statistic TestError Correction Mechanism ( E c m t 1 ) MacKinnon Critical Value (p-Value)Type of Effect
Economic sector215.05 ***255.10 ***−0.51 ***p < 0.01Direct effect
Social sector−0.35 ***p < 0.01Direct effect
civil politics sector−0.77 ***p < 0.01Direct effect
environmental sector0.00009 ***p < 0.01Indirect effect
*** denotes significance α = 0.01. Source: Author’s Estimate (2025).
Table 2. Results of the influence pathway analysis of causal relationships from the LMMA-FAHP model.
Dependent VariablesType of EffectIndependent Variables
Economic SectorSocial SectorEnvironmental SectorCivil Politics Sector
Economic sectorDE---0.84 ***
IE----
Social sectorDE0.65 ***--0.82 ***
IE---0.01 ***
Environmental sector DE0.73 ***0.49 ***-0.80 ***
IE−0.1 ***--0.21 ***
Civil politics sectorDE----
IE----
Note: *** denotes significance α = 0.01, DE is a direct effect and IE is an indirect effect.
Table 3. Performance evaluation results of the LMMA-FAHP model.
Forecasting ModelMAPE (%)RMSE (%)MAE (%)
ANN model6.567.117.89
ANIF model6.356.796.87
ML model6.216.356.44
DL model5.875.915.98
GM(1,1)5.795.855.92
BG(1,1)5.505.615.75
NN model5.465.595.72
ARIMA model5.195.345.45
CNN model4.794.874.95
SVM model4.324.574.77
GA model4.054.364.52
Fuzzy Logic3.814.114.27
Fuzzy VIKOR3.693.984.02
ARIMAX model3.253.503.99
LMMA-FAHP model1.051.301.35
Source: Author’s Estimate (2025).
Disclaimer/Publisher’s Note: The statements, opinions and data contained in all publications are solely those of the individual author(s) and contributor(s) and not of MDPI and/or the editor(s). MDPI and/or the editor(s) disclaim responsibility for any injury to people or property resulting from any ideas, methods, instructions or products referred to in the content.

