Abstract
Amid the urgent need to align agricultural practices with the United Nations Sustainable Development Goals (SDGs), this study examines the role of agricultural digitalization in promoting sustainable and green development in China. Specifically, it explores demand-side factors that drive improvements in agricultural green development and categorizes development models into three types: market-oriented, policy-driven, and innovation-driven. Utilizing provincial-level data from 2011 to 2021, this study employs semiparametric and spatial Durbin models to empirically assess the effects, underlying mechanisms, and regional disparities of agricultural digitalization in advancing green development. The main findings are as follows: (1) Overall, both agricultural digitalization and the level of green agricultural development have gradually increased during the study period, with agricultural digitalization significantly contributing to sustainable agricultural development. (2) The impact of agricultural digitalization on green agricultural development shows an upward trend in eastern, coastal, and non-grain-producing regions, as well as in the southeastern areas of the “Hu Huanyong Line”. In contrast, inland regions and the northwestern areas of the “Hu Huanyong Line” exhibit a U-shaped relationship, and grain-producing regions experience a clear inhibitory effect. Additionally, the promoting effect of agricultural digitalization is more pronounced in regions with higher levels of green agricultural development. (3) Agricultural digitalization generates positive spillover effects, benefiting not only the local region but also surrounding areas, with a stronger radiative effect on neighboring regions. (4) Mechanism analysis suggests that under all three development models, agricultural digitalization can effectively enhance green agricultural development by improving the alignment of supply and demand for green agricultural products, accelerating the establishment and promotion of green agricultural brands, strengthening environmental regulation, fostering new agricultural business entities, advancing agricultural mechanization, and improving the efficiency of facility agriculture.
1. Introduction
Achieving green agricultural development is not only critical for China’s rural revitalization but also a cornerstone of global sustainability efforts, particularly in addressing climate change (SDG 13) and ensuring food security (SDG 2). Promoting green agricultural development is not only an intrinsic component of high-quality agricultural growth but also an essential requirement for the comprehensive implementation of the rural revitalization strategy and the construction of a strong agricultural nation [1].
China has attached great importance to green agricultural development in recent years. “No. 1 central document” for 2024 specifically emphasizes the importance of strengthening rural ecological civilization [2], providing a clear roadmap for achieving green agricultural development. In fact, green agricultural development, as a concrete expression of the new development philosophy in the agricultural and rural sectors, has attracted significant attention since the 19th CPC (Communist Party of China) National Congress. The publication of the first policy document on green agricultural development, “Opinions on Innovating Systems and Mechanisms to Promote Green Agricultural Development” in 2017 [3], established the general principles and requirements for advancing green agricultural development, alongside clear objectives and tasks. This was followed by the ministry of agriculture and rural affairs issuing annual work priorities for agricultural and rural green development in 2019 and 2020. In 2021, the Ministry of Agriculture and Rural Affairs, together with the National Development and Reform Commission and four other departments, issued the “14th Five-Year Plan for Green Development of the Country’s Agricultural Sector” [4], which established the “four pillars and eight frameworks” for advancing green agricultural development. However, it is important to note that, compared to developed nations, China’s agricultural production still lacks refinement, with a persistent reliance on input-intensive practices, such as the use of chemical fertilizers and pesticides. Additionally, improper management of water and fertilizers has led to significant non-point-source pollution [5]. Therefore, achieving green agricultural development while maintaining food security and enhancing productivity remains a critical challenge in the pursuit of building a strong agricultural nation in the new era.
With the rapid development of information technology, the digitalization of agriculture has emerged as a critical mechanism for accelerating rural economic development and comprehensively advancing the rural revitalization strategy. In 2022, the Cyberspace Administration of China, together with ten other government agencies, jointly issued the “Digital Rural Development Action Plan (2022–2025)”, which provides a robust foundation for agricultural modernization. By June 2023, the number of rural internet users in China had reached 301 million, accounting for 27.9% of the total internet users, with an internet penetration rate of 60.5% in rural areas. Additionally, the continuous implementation of initiatives such as new-type urbanization, the “Broadband Rural” pilot program, and universal telecom service projects has accelerated the integration of digital technologies across various sectors of agriculture. This accelerated digital transformation offers new opportunities to enhance agricultural productivity, improve rural financial services, and achieve high-quality agricultural development [6]. Existing studies have shown that digitalization improves agricultural productivity by reducing costs and optimizing agricultural structures [7]. Other research has indicated that digitalization significantly enhances the allocation of agricultural loans by rural financial institutions, improving credit structures and the proportion of medium- and long-term loans [8], thereby contributing to the high-quality development of rural finance [9]. Furthermore, studies have explored the relationship between agricultural digitalization, agricultural integration, and rural economic development [10,11], finding that digitalization not only promotes deeper integration across agricultural industries but also effectively stimulates rural economic growth. In conclusion, the widespread application of digital technologies in agriculture has become a driving force for achieving high-quality agricultural development.
Research on the impact of agricultural digitalization on green agricultural development primarily concentrates on two key aspects. The first line of research focuses on agricultural productivity, with total factor productivity (TFP) serving as the core indicator for measuring green agricultural development. Comprehensive assessments of agricultural TFP are carried out using techniques such as Stochastic Frontier Analysis (SFA) and Data Envelopment Analysis (DEA) [12,13]. The level of agricultural digitalization is quantified across various dimensions, including the informatization of farmers’ consumption behaviors, agricultural infrastructure, agricultural science and technology, agricultural management, and environmental monitoring systems [14]. The findings suggest that agricultural digitalization significantly enhances agricultural TFP, exhibiting a dual-threshold effect: as human capital increases, the impact of digitalization on agricultural TFP intensifies [15]. Additionally, agricultural digitalization demonstrates spatial spillover effects on green total factor productivity [16].
The second strand of research emphasizes the crucial role of low-carbon development in advancing green agriculture. A comprehensive evaluation index system for green agricultural development is established, incorporating factors such as the concept of national ecological civilization, agricultural modernization, and low-carbon agricultural development [17,18,19]. The index system includes digital infrastructure, digital industrialization, industrial digitization, and inclusive digital finance, among others, to assess the extent of agricultural digitalization [20]. The study further explores the influence of agricultural digitalization on low-carbon green agricultural development and argues that digitalization alleviates constraints such as insufficient capital and information gaps among farmers, providing new impetus for rural households [21]. This, in turn, facilitates the low-carbon transition in agricultural practices.
While the existing literature offers significant insights into the topic, there remain notable areas for further development. First, existing studies predominantly use TFP or carbon emissions as primary indicators to measure green agricultural development [22]. However, improvements in TFP or reductions in carbon emissions are necessary but insufficient conditions for advancing green agriculture. In order to achieve true green agricultural development, it is essential not only to enhance efficiency and reduce carbon emissions, but also to consider improvements in the living standards of rural populations. Second, the relationship between agricultural digitalization and green agricultural development has been under-explored. The majority of the existing literature tends to focus on the general, aggregate effects of digitalization, without a detailed investigation into its dynamic impacts on green agricultural development [23]. Furthermore, most studies examine the mechanisms of digitalization’s impact from a supply-side perspective, limiting the breadth of analysis [24].
Building on these gaps, this study offers three key contributions. First, it expands the existing evaluation framework for green agricultural development by incorporating a dimension related to the improvement of living standards, based on the “Monitoring and Evaluation Guidelines for Green Agricultural Development (Trial)”. This addition aligns with the United Nations Sustainable Development Goals, which emphasize the importance of enhancing rural well-being. Second, this study applies a semiparametric model to capture the dynamic and fluctuating effects of agricultural digitalization on green agricultural development, by overcoming the limitations of traditional linear models, revealing the differentiated impact mechanisms of digital technologies across regions with varying resource endowments. It provides a scientific basis for formulating sustainable development strategies tailored to local conditions. Third, by taking a “demand-side” perspective, this research analyzes the impact of agricultural digitalization on green development within three distinct models: market-driven, policy-incentive, and innovation-driven. This approach deepens the understanding of how digitalization advances green agricultural development and provides China’s experience as a reference for the global transition toward a circular agricultural economy.
The organization of this study is as follows. Section 2 provides a theoretical analysis and research hypotheses. Section 3 outlines the research design, including variable selection, data sources, descriptive analysis, and model specification. Section 4 presents the empirical tests, including overall impact effect analysis, robustness checks, robustness tests, and heterogeneity analysis. Section 5 analyzes the impact mechanisms. Section 6 conducts further tests, including spatial effect analysis. Finally, Section 7 offers conclusions, recommendations, and discussions based on the findings.
2. Theoretical Analysis and Research Hypotheses
Green agricultural development has emerged as a critical focus in the global transformation of agriculture, representing a key pathway for achieving sustainable agricultural practices and addressing the challenges of climate change. Within the framework of China’s strategic goals for high-quality agricultural development, three key dimensions characterize the role of agricultural digitalization in promoting green agricultural growth. First, agricultural digitalization enhances resource utilization efficiency [25], thereby reducing resource waste and mitigating environmental pollution throughout the agricultural production process. Second, it facilitates the optimization of agricultural management by enabling precision farming, which leads to a reduction in the use of chemical inputs such as fertilizers and pesticides [26]. Third, digitalization supports the green transformation of agricultural supply chains [27], steering agriculture away from its traditional high-consumption, high-pollution model towards a low-carbon, circular, and sustainable model. The core objective of advancing green agricultural development lies in harnessing digital technologies to catalyze a fundamental shift in agricultural production practices, ultimately achieving a harmonious coexistence between agriculture and the environment.
2.1. The Empowering Role of Agricultural Digitalization in Green Agricultural Development: Why It Works
From a global perspective on agricultural development trends, leading green agricultural nations typically exhibit highly efficient resource utilization systems, advanced agricultural technologies, intelligent production management, and sustainable supply chain models [28]. These characteristics are fundamentally supported by digital technologies. The existing body of literature explores various mechanisms through which digitalization drives green agricultural development. According to the Food and Agriculture Organization (FAO), digital technologies—such as the Internet of Things (IoT), big data, and artificial intelligence—can significantly enhance the precision and efficiency of agricultural production [29], reduce resource waste, and mitigate environmental pollution, thereby promoting the green transformation of agriculture. Vinod Chandra S.S. and colleagues emphasize that digital technologies, through precise fertilization, irrigation, and intelligent pest and disease control, can substantially reduce the negative environmental impacts of agricultural production while simultaneously improving both the quality and yield of agricultural products [30]. Dongyang Huo et al. argue that agricultural digitalization, via data-driven decision support systems, optimizes resource allocation in agriculture, minimizes the excessive use of fertilizers and pesticides, and fosters the transition toward greener, low-carbon agricultural practices [31]. In general, the existing literature widely acknowledges the positive impact of digital technologies on green agricultural development, with empirical studies primarily focusing on the fundamental functionalities of these digital tools—such as data collection and analysis, intelligent decision support, and precision agricultural management—in evaluating their contributions to agricultural green transformation [32].
2.2. The Empowering Role of Agricultural Digitalization in Green Agricultural Development: How It Works
Agricultural digitalization refers to the comprehensive integration of modern information technologies with agricultural production, management, and services, facilitating the transformation of the agricultural sector toward greater efficiency, intelligence, and sustainability [33]. In line with the fundamental principles of green agricultural development and the strategic orientation of digital technologies, this study categorizes green agricultural development into three distinct models: market-driven, policy-incentive, and innovation-driven. Building on this classification, the paper further explores the operational dynamics through which agricultural digitalization supports green agricultural development within each of these three models.
The market-driven model closely aligns with market demand, leveraging digital technologies to optimize resource allocation and precisely match consumer preferences with emerging green consumption trends, thereby facilitating green agricultural development. Within this framework, agricultural digitalization contributes to the advancement of green agriculture in two key ways. First, it enhances market transparency by improving the efficiency of supply–demand matching for green agricultural products [34]. Through the application of big data analytics and digital platforms, real-time sharing of production information, quality traceability, and consumer feedback increases market transparency. This not only satisfies the growing consumer demand for healthy and environmentally sustainable products but also incentivizes agricultural producers to transition towards greener, organic practices, leading to the production of higher-quality green products [35]. As a result, green agricultural products, due to their superior quality, often gain greater market recognition and price premiums, providing an economic impetus for green agricultural development. Second, the use of e-commerce platforms and digital marketing strategies broadens the sales channels for green agricultural products, accelerating the branding process of green agriculture [36]. These digital tools overcome the limitations of traditional sales models, expanding market access and driving the rapid growth of brand visibility and market share through targeted marketing and social media campaigns. This not only promotes the large-scale production and standardized management of green agricultural products but also enhances consumer trust and loyalty through strong brand effects, establishing a stable market foundation [37]. Furthermore, the convenience of e-commerce reduces distribution costs, increasing profitability for agricultural producers and, in turn, fostering the internal momentum for green agricultural development.
The policy-incentive model seeks to accelerate the promotion of green agriculture through targeted policy interventions [38]. This model relies on government guidance, market mechanisms, comprehensive planning and key support strategies, focusing on supporting the construction of standardized green raw material bases, promoting the green transformation and growth of advantageous agricultural product processing enterprises, and digging deeply into the versatility of agriculture to achieve green development [39]. This series of measures aims to efficiently integrate production factors, promote the seamless docking and collaborative operation of all links of the agricultural industry chain, stimulate the internal vitality of the integrated development of agriculture, form a strong synergy effect, and ultimately promote agriculture to a comprehensive green and sustainable development path [40].
Within this framework, the role of agricultural digitalization in advancing green agricultural development is realized in two key ways: First, by strengthening environmental regulation, digital technologies provide real-time, precise data for environmental management, enabling both government and enterprises to closely monitor critical environmental parameters throughout the agricultural production process [41]. This facilitates the effective enforcement of environmental regulations and guides the deeper integration of green agricultural practices, thereby laying a solid foundation for the long-term sustainability of green agriculture. Second, digitalization encourages the establishment of new agricultural business entities by optimizing operational costs and improving management efficiency. The application of intelligent management systems and resource optimization technologies significantly reduces operational expenses and enhances decision-making accuracy and efficiency [42]. This transformation not only attracts more entities to engage in green agricultural practices but also accelerates the scaling-up and intensification of green agriculture. Through digital platforms that enable precise resource allocation and efficient coordination, the model injects substantial momentum into the sector, fostering the rapid expansion of green agricultural practices [43].
The innovation-driven model continually explores and integrates new technological approaches, leveraging cutting-edge science and digital technologies to significantly enhance agricultural mechanization. This model aims to eliminate the digital divide while implementing comprehensive technological upgrades across multiple stages of the agricultural value chain, including pre-production planning, in-production management, and post-production sales [44]. The objective is to achieve a modernization of traditional agricultural practices while simultaneously facilitating a green upgrade. In this context, agricultural digitalization contributes to green agricultural development in two key areas: First, by advancing agricultural mechanization, digital technologies promote the efficient utilization of resources and environmentally sustainable development [45]. The deployment of smart farming equipment and automation technologies enables precision farming practices, significantly improving operational efficiency and accuracy while reducing resource wastage and environmental impact. This transformation not only accelerates the greening of agricultural production but also enhances the market competitiveness and added value of agricultural products, injecting renewed momentum into the sustainable development of agriculture [46]. Second, digital technologies enhance the efficiency of facility agriculture, steering the sector toward a greener, more efficient transformation. The integration of digital tools in facility agriculture allows for the precise control of environmental variables, the optimization of production processes, and the improved allocation of resources, resulting in significant gains in both production efficiency and resource utilization. These innovations substantially reduce energy consumption and carbon emissions while simultaneously increasing crop yields and product quality, thereby driving the transition of facility agriculture toward a more sustainable, green, and high-efficiency future [47].
Building upon the preceding analysis, this paper posits the following hypotheses: Hypothesis 1: Agricultural digitalization can significantly contribute to the promotion of green agricultural development. Hypothesis 2a: In the market-oriented model, agricultural digitalization fosters green agricultural development by enhancing the efficient alignment of supply and demand for green agricultural products and expediting the branding process of green agriculture. Hypothesis 2b: In the policy-incentive model, agricultural digitalization drives green agricultural development by strengthening environmental regulations and encouraging the establishment of new agricultural business entities. Hypothesis 2c: In the innovation-driven model, policy-driven financial support advances green agricultural development by enhancing agricultural mechanization and improving the efficiency of facility agriculture.
3. Research Design
3.1. Variable Selection
3.1.1. Dependent Variable
The dependent variable in this study is green agricultural development (agd), which is defined as the achievement of sustainable agricultural growth through the integration of modern technologies in production activities, while ensuring respect for and harmony with the natural environment [48]. In December 2023, the General Office of the Ministry of Agriculture and Rural Affairs issued the “Measures for Monitoring and Evaluating the Level of Green Agricultural Development (Trial)” [49], providing a guideline for assessing the level of green agricultural development across regions and offering both theoretical insights and practical guidance for the comprehensive green transformation of agriculture. The 20th National Congress of the CPC (Communist Party of China) emphasized that promoting green development and fostering a harmonious relationship between humans and nature are fundamental priorities. High-quality development must ensure that the public gains increased happiness from the establishment of green production and consumption patterns. This paper adopts measures for monitoring and evaluating the level of green agricultural development, aligning with a people-centered development perspective. Drawing on the existing literature and established green agricultural development measurement frameworks, the study incorporates the dimension of affluence and quality of life into a unified evaluation model. It constructs a comprehensive green agricultural development index that encompasses five key dimensions: resource conservation and utilization, environmental safety and sustainability, ecological conservation and restoration, output quality and efficiency, and affluence and quality of life [50].
In the dimension of output quality and efficiency, agricultural productivity is used as a proxy variable, which is measured using the DEA–Malmquist index method. In this approach, labor input (measured by the total number of workers in the primary industry at the year end), land input (measured by crop sown area), and capital input (measured by expenditure on agricultural, forestry, and water affairs) are treated as input variables, while the total output value per unit of cultivated land serves as the output variable. The input-oriented BCC model is adopted in the DEA to calculate the green development index, allowing for variable returns to scale and focusing on minimizing input usage while maintaining output levels. This produces a value for the output quality and efficiency dimension. To mitigate the drawbacks of subjective weighting and issues associated with overlapping indicators, this study employs the entropy method to assign weights to the green agricultural development indicators. Subsequently, the green agricultural development index is calculated for each province. The detailed indicator design is presented in Table 1.

Table 1.
Green agricultural development level evaluation indicator system.
3.1.2. Core Explanatory Variable
The core explanatory variable in this paper is the level of agricultural digitalization (dc). Agricultural digitalization is a progressive pathway toward agricultural modernization, driven by the development of informatization and networking. It constitutes a crucial component of China’s rural revitalization initiative and the “Digital China” strategy. At present, there is no consensus in the academic community regarding the precise connotation of “agricultural digitalization development”. Two representative perspectives dominate the discourse.
The first is the technology outcome-oriented perspective, which defines agricultural digitalization as the process of applying information and communication technologies (ICTs) to digitally and intelligently transform agricultural production, operations, and management. This view emphasizes the extent of digital technology application across the entire agricultural value chain [51,52], but tends to overlook the external conditions and supporting environment required for digital transformation. The second is the systemic evolution perspective, which regards agricultural digitalization as a complex, dynamic system. In addition to the widespread application of digital technologies in the agricultural sector, it emphasizes the importance of institutional foundations, resource input, technological reserves, and human capital support [53,54]. This perspective highlights that agricultural digitalization is not merely a technological upgrade, but rather a deep transformation involving the coordinated participation of multiple factors.
Drawing on the second perspective, and in light of the policy trajectory and practical logic of agricultural digitalization in China, this study defines agricultural digitalization as a holistic transformation process. It is underpinned by the development of the digital economy, supported by digital infrastructure as its material foundation, centered on information and intelligent technologies, and secured through high-quality human capital and fiscal investment. The process aims to systematically reshape agricultural production methods, organizational models, operational systems, and service frameworks. Ultimately, it seeks to improve the efficiency of resource allocation in agriculture, optimize the combination of production factors, and promote industrial synergy—thus driving transformations in efficiency, drivers of growth, and quality, and contributing to the high-quality development of agriculture.
Based on the above conceptual framework, this study constructs an indicator system by integrating key policy documents, including the Strategic Plan for Digital Rural Development and the Development Plan for Digital Agriculture and Rural Areas (2019–2025). In addition, the indicator design draws on the existing literature and evaluation frameworks related to the integration of the digital economy and agriculture [55], the compilation of the High-Quality Development Index for Digital Agriculture [56], the Agricultural and Rural Digital Economy Development Index [53], the China Digital Village Development Index, and the Coupling Index of Digital Economy and Rural Revitalization [57,58]. These references ensure that the indicator system is both authoritative and grounded in current policy and practice.
Building on this foundation, this study further adopts methodological approaches from domestic and international scholars to systematically examine the representativeness of indicators [59,60], and the openness and accessibility of data sources, and to ensure methodological rigor. During the preliminary testing phase, expert consultations were conducted with specialists in agricultural economics and digital technologies to optimize the framework. As a result, a comprehensive evaluation system comprising three primary dimensions—digital infrastructure, digital processes, and digital support systems—was developed to systematically capture the overall progress and regional disparities in agricultural digitalization. Specifically, digital infrastructure reflects the level of information infrastructure and service network construction in rural areas, serving as the fundamental prerequisite for implementing agricultural digitalization. Digital processes measure the actual application of digital technologies in agricultural production, circulation, and service delivery, representing the core implementation dimension. The digital support system includes critical enabling factors such as policy investment, financial support, IoT infrastructure, and human capital, which are essential for sustaining long-term digital transformation in agriculture.
With regard to specific indicators, the digital infrastructure dimension includes rural broadband penetration rate, household ownership rates of computers and mobile phones, coverage rate of broadcasting and television networks, accessibility of postal and logistics services (e.g., delivery route coverage, proportion of administrative villages with postal service), and the number of agricultural meteorological stations. These indicators reflect the rural areas’ capacity to acquire and transmit information [55]. The digital process dimension consists of three components: (1) digital production, measured by the number of agricultural workers and the number of internet-using enterprises in agriculture; (2) digital operations, indicated by the integration level of rural consumption and online retail; and (3) digital services, represented by the prevalence of “Taobao Villages” [61,62]. The digital support system dimension includes indicators such as the intensity of fiscal and financial support for agriculture, investment in IoT and digital agricultural production, the proportion of agricultural science and technology personnel, and the capacity to purchase digital technologies. Together, these indicators comprehensively capture the capital, technological, and human resource inputs that support agricultural digitalization [63,64]. The complete indicator design is presented in Table 2. All indicators are positively oriented. Based on this system, the Entropy Weight Method is applied to compute a composite index that reflects the level of agricultural digitalization.
Table 2.
Evaluation index system of agricultural digitization construction level.
To eliminate subjective bias arising from manually assigned weights, this study employs the Entropy Weight Method (EWM) to calculate the weights of each indicator, thereby enhancing the objectivity and comparability of the composite index. To further assess the internal consistency and robustness of the constructed indicator system for the core variable—agricultural digitalization level—this study conducts a reliability analysis using Cronbach’s alpha coefficient. The results show that the coefficients for the three dimensions—digital infrastructure (0.723), digital processes (0.626), and the digital support system (0.667)—all exceed the commonly accepted threshold for reliability analysis. This indicates that the indicator system demonstrates good internal consistency and is reliable for empirical application.
3.1.3. Control Variables
To mitigate potential bias stemming from omitted variables, and in line with the existing literature, this study incorporates several factors that may influence green agricultural development [65,66]. The control variables selected for this analysis include industrial structure (ppi), grain-sowing conditions (gsa), crop production levels (tgo), and disaster incidence rate (dr). The industrial structure is represented by the ratio of the gross value added of the primary industry to the total regional GDP. Grain-sowing conditions are measured by the area devoted to grain crops. Crop production levels are represented by the total grain output. The disaster incidence rate is defined as the proportion of agricultural disaster-affected areas to the total area of crops sown.
3.1.4. Moderating Variables
Drawing upon the existing literature, this study identifies the moderating variables that influence the relationship between agricultural digitalization and green agricultural development, based on the three models of green agricultural development: market-driven, policy-incentive, and innovation-driven. First, in the market-driven model, the moderating effect is captured by the number of enterprises with green food certification (gfe) and the number of products certified with green food labels (gfl) [67]. Second, for the policy-incentive model, the moderating variables include the number of new agricultural business entities (nab) and the strength of environmental regulations (er) [68]. The strength of environmental regulations is measured using the ratio of pollution charge revenue to GDP. Lastly, in the innovation-driven model, the moderating effect is assessed through the degree of agricultural technological modernization, which is represented by indicators such as the density of agricultural mechanization (agm) and the intensity of facility agriculture development (fad) [69].
3.2. Data Sources
This study uses panel data from 30 provinces in China covering the period from 2011 to 2021. Due to issues related to data availability and comparability, the analysis excludes Tibet, as well as the Hong Kong, Macau, and Taiwan regions. The primary sources of the raw data include the China Statistical Yearbook, China Rural Statistical Yearbook, China Urban Statistical Yearbook, China Environmental Statistical Yearbook, Provincial Statistical Yearbooks, and the China Economic Big Data Research Platform. For missing data, linear interpolation and mean substitution methods were applied to fill in the gaps.
3.3. Descriptive Analysis
Before constructing the econometric model, this study begins with a descriptive analysis to observe the overall trends in agricultural digitalization and green agricultural development. Kernel density plots are used to examine the distribution characteristics of the sample, which will inform the selection of the appropriate econometric model. Figure 1 displays the trends in agricultural digitalization and green agricultural development from 2011 to 2021.

Figure 1.
(a) Agricultural digitalization and (b) green agricultural development status from 2011 to 2021. (a) Shows the agricultural digitalization level (dc) in eastern, central, and western regions, as well as the national average, over time. (b) Illustrates the green agricultural development index (agd) in the same regions and period, reflecting significant regional disparities.
Figure 1a illustrates the status of agricultural digitalization in China. Between 2011 and 2021, the overall level of agricultural digitalization showed a marked upward trend, with significant regional disparities. Specifically, the eastern region exhibited the highest level of agricultural digitalization, followed by the central region, which was close to the national average. In contrast, the western region had a relatively low level of agricultural digitalization. Figure 1b presents the status of green agricultural development in China. Despite a fluctuating trajectory, the western region achieved the highest level of green development, driven by its natural resource endowments—such as expansive grasslands and solar energy—and targeted policies like the 2015 Zero Growth Action Plan for Fertilizers, which prioritized ecological restoration. The central region aligned with the national average, while the eastern region, despite its digitalization dominance, faced challenges from industrial pollution and climate vulnerabilities, slowing its green progress.
The fluctuations in green development between 2011 and 2017 stemmed from three interconnected factors. First, policy shifts after 2013, including stricter ecological regulations and subsidies for sustainable practices, accelerated green transitions in resource-rich western provinces. Second, the uneven adoption of technologies such as precision irrigation and organic farming created regional disparities, with pilot areas showing rapid improvements. Third, methodological updates to evaluation metrics in 2015, which incorporated indicators like agricultural waste recycling rates, contributed to short-term data volatility. Critically, the coexistence of rising digitalization and steady green development underscores that China’s agricultural modernization did not compromise environmental sustainability. Instead, regional strengths were strategically leveraged: the east focused on efficiency-driven digital tools, while the west capitalized on ecological advantages, reflecting a spatially differentiated yet complementary approach to balancing technological progress and sustainability.
3.4. Model Specification
3.4.1. Two-Way Fixed Effects Model
Building on the theoretical framework outlined earlier, this study applies the fixed effects model with panel data to empirically examine the impact of agricultural digitalization on green agricultural development. The baseline regression model is expressed in Equation (1):
In the equation, represents the province, represents the year, denotes the change in green agricultural development, and refers to agricultural digitalization. The vector contains the control variables, captures the regional effects, and represents the time effects, with denoting the error term. The coefficient reflects the impact of agricultural digitalization on green agricultural development, while represents the relationship with the control variables. To mitigate potential multicollinearity issues among the control variables, the study carefully selects province-level clustering for model specification. Particular attention is paid to the significance of . A significant positive indicates a positive impact of agricultural digitalization on green agricultural development, while a negative would suggest the opposite relationship.
3.4.2. Semiparametric Model
To gain deeper insights into the dynamic impact of agricultural digitalization on green agricultural development, this study proposes a semiparametric model [70], as presented in Equation (2):
In this specification, represents the non-parametric functional form of the variable , represents the coefficient of the control variables, and , , and are defined consistently with Equation (1).
3.4.3. Spatial Spillover Effect Model
Given the regional characteristics of green agricultural development and the potential for “spatial spillover” effects between agricultural digitalization and green agricultural development, this study, drawing on the methodological frameworks of cross-regional research, utilizes the spatial Durbin model (SDM) to estimate these spatial spillover effects. The specific equation is as follows:
In this equation, represents the spatial autocorrelation coefficient, denotes the spatial weight matrix, and and correspond to the spatial coefficients of agricultural digitalization and the control variables, respectively. The error term, , captures the stochastic disturbance, with the remaining variables defined consistently with those in Equation (1).
3.4.4. Quantile Regression Model
Traditional linear regression models are inherently mean-based, providing only the average effect of the explanatory variables on the dependent variable. However, these models do not capture the full impact of the explanatory variables across the entire conditional distribution of the dependent variable. To gain a deeper understanding of how agricultural digitalization affects green agricultural development at various levels, this study employs quantile regression for the econometric analysis. The specific equation is as follows:
In the equation, denotes the level of green agricultural development at the quantile, while and represent the coefficients for agricultural digitalization and the control variables at the quantile, respectively. The interpretation of the remaining variables follows the same definition as in Equation (1).
4. Empirical Analysis
4.1. Overall Impact Effect Analysis
Table 3 (1) and (2) present the results of the total impact effect tests for agricultural digitalization on green agricultural development, estimated using the two-way fixed effects panel model and the semiparametric model, respectively. In the two-way fixed effects model, agricultural digitalization exhibits a positive impact on green agricultural development; however, the effect is not statistically significant, and the corresponding coefficient is relatively small. Conversely, under the semiparametric model, agricultural digitalization has a statistically significant effect on green agricultural development at the 1% significance level, further corroborating the presence of a nonlinear relationship between the two variables. As shown in Figure 2, the trend of the impact effect indicates that agricultural digitalization has a clear positive influence on green agricultural development—i.e., as the level of agricultural digitalization increases, the level of green agricultural development progressively strengthens. This finding supports Hypothesis 1. Additionally, an increase in disaster incidence rates may have an adverse effect on green agricultural development. Natural disasters can lead to substantial crop losses, forcing farmers to overuse fertilizers and pesticides in attempts to quickly restore production, which, in turn, negatively impacts agricultural sustainability and environmental health.
Table 3.
Test results of the impact of agricultural digital construction on green agricultural development.

Figure 2.
Impact of agricultural digitalization on green agricultural development.
4.2. Robustness Checks
- (1)
- Correlation between explanatory variables and residuals
This study investigates the potential endogeneity issue by testing the correlation between the explanatory variables and residuals in the semiparametric model. The results reveal that the correlation between agricultural digitalization and the residuals is insignificant, with a p-value of 1, suggesting no significant correlation. However, it is important to note that existing research on endogeneity tests in semiparametric models is limited, particularly in complex scenarios such as bidirectional causality. Therefore, the testing method used in this study should be viewed as a reference. Future research will explore other suitable methods to more accurately identify and address endogeneity concerns.
- (2)
- Robustness tests
- Lagged core explanatory variable. Considering the potential interdependencies between variables within the same period, this study lags the agricultural digitalization variable by one period and examines its impact on green agricultural development. The results are presented in Table 4 (1). The findings indicate that agricultural digitalization significantly promotes green agricultural development at the 1% significance level. As shown in Figure 3a, the effect gradually increases, supporting the robustness of the results.
Table 4. Robustness test results.
 Figure 3. Robustness test result graph.
 - A 1% data truncation. To address the potential influence of extreme values on the regression outcomes, a 1% truncation is applied to the data, excluding the most extreme outliers. This approach enhances the reliability of the regression results and ensures that the analysis reflects the general characteristics of the majority of the data. The empirical results are shown in Table 4 (2). The findings suggest that agricultural digitalization significantly promotes green agricultural development at the 5% significance level. As illustrated in Figure 3b, the impact effect steadily increases, confirming the robustness of the results.
- Exclusion of data from municipalities directly under central government. Given the substantial differences in administrative levels, economic development, and population sizes between municipalities directly under the central government (e.g., Beijing, Shanghai, Tianjin, and Chongqing) and other regions, excluding these data helps avoid potential distortions in the overall analysis. The results, excluding the municipal data, are presented in Table 4 (3). The results indicate that agricultural digitalization significantly promotes green agricultural development at the 1% significance level. As depicted in Figure 3c, the impact effect shows a fluctuating upward trend, confirming the robustness of the results. However, the observed continuous fluctuations may stem from the larger economic scale and higher population density in municipalities, which could influence the performance of certain variables.
4.3. Heterogeneity Analysis
4.3.1. Regional Heterogeneity
To explore the regional variations in the impact of agricultural digitalization on green agricultural development, this study conducts empirical analyses across four dimensions: geographical location, coastal–inland differences, grain production areas, and the distinction between regions on either side of the Hu Huanyong Line. Specifically, regarding geographical location, this study follows the classification of previous scholars [71], dividing the 30 provinces into three regions: eastern, central, and western. For coastal–inland differentiation, this study adopts the regional division proposed by relevant scholars [72], distinguishing between coastal and inland regions. In terms of grain production areas, the study follows the classification of grain-producing and non-grain-producing regions as outlined by earlier research [73]. Lastly, based on the Hu Huanyong Line, the provinces are classified into the northwestern and southeastern regions according to the methodology used by prior scholars [74]. The empirical results are presented in Table 5.
Table 5.
Heterogeneity test results of the impact of agricultural digitalization on green agricultural development.
1. Regional Heterogeneity
Table 5 (1) to (3) present the results of the impact of agricultural digitalization on green agricultural development across different geographical regions, estimated using the semiparametric model. The findings for the eastern region indicate that agricultural digitalization significantly promotes green agricultural development at the 1% significance level. This conclusion is further corroborated by the trend in Figure 4a, which demonstrates a clear and significant improvement in green agricultural development as agricultural digitalization increases. Moreover, industrial structure upgrading also positively influences green agricultural development in the eastern region. This can be attributed to the higher levels of economic development, technological innovation, market-driven forces, and policy support in the region. The eastern region not only provides substantial financial and technological resources for green agricultural development but also guides agricultural production towards more environmentally sustainable practices through market demand. Furthermore, the efficiency of policy support and industrial chain integration contributes to enhanced agricultural sustainability and overall efficiency.
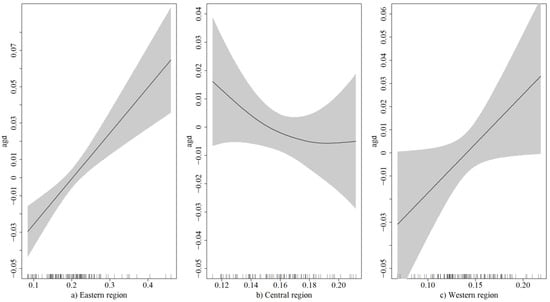
Figure 4.
Impact of agricultural digitalization on green agricultural development across three major regions.
In the central region, the results show that agricultural digitalization has a significant impact on green agricultural development at the 10% significance level. However, the effect fluctuates, showing an upward trend followed by a slight decline. Additionally, industrial structure upgrading and an increase in grain-sowing areas have positive effects on green agricultural development, while increased grain production has a negative impact. These results are likely due to the relatively weak foundation of agricultural digitalization, uneven resource distribution, and improper technology application in the central region. Moreover, while industrial structure upgrading encourages diversification in agricultural models, the increase in grain production may lead to excessive resource consumption and environmental strain.
For the western region, the results indicate that the impact of agricultural digitalization on green agricultural development is highly variable. Furthermore, increases in grain-sowing areas and disaster incidence have a negative effect on green agricultural development, while increases in grain production show a positive impact. These outcomes are largely influenced by the region’s complex topography, lower economic development level, insufficient agricultural investment, and frequent natural disasters. Geographic constraints limit the effectiveness of technology dissemination, while economic disparities lead to the prioritization of resources and funding for non-agricultural sectors. Insufficient agricultural investment exacerbates environmental pressures, and frequent natural disasters further challenge the stability of agricultural production.
2. Coastal–inland Differences
Table 5 (4) to (5) present the results of the impact of agricultural digitalization on green agricultural development in coastal and inland regions, as estimated using the semiparametric model. Specifically, in inland regions, agricultural digitalization significantly impacts green agricultural development, exhibiting a “U-shaped” effect characterized by an initial suppression followed by an eventual increase (Figure 5a). In contrast, in coastal regions, agricultural digitalization demonstrates a significant and sustained positive effect, with green agricultural development noticeably improving as digitalization levels rise (Figure 5b).
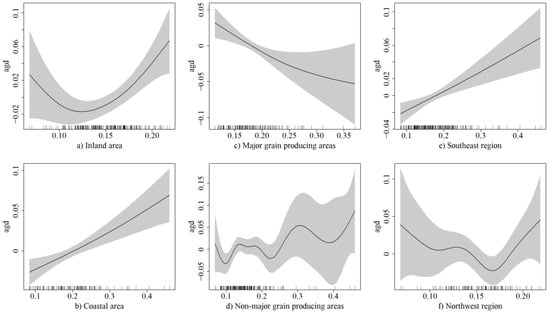
Figure 5.
Impact of agricultural digitalization on green agricultural development across coastal and inland regions, major grain-producing areas, and the Hu Huanyong Line.
This regional disparity can be attributed to several key factors. First, there are differences in economic development levels and infrastructure. Coastal regions, with their more developed economies and advanced infrastructure, are better equipped to introduce and apply digital technologies, thereby enhancing agricultural productivity and environmental sustainability. In contrast, inland regions, which lag in these areas, experience more limited early-stage impacts of agricultural digitalization on green development. Second, disparities in education and technological adoption capacity also play a role. Residents in coastal regions generally have higher levels of education and are more adept at adopting and applying new technologies, enabling faster adoption of digital tools in agricultural practices. In contrast, farmers in inland regions may require more time and resources to adapt to and master these technologies. Finally, differences in policy orientation and resource allocation contribute to this regional gap. Coastal regions, benefiting from better economic conditions, often receive more policy support and financial investments, accelerating the pace of agricultural digitalization and driving green development. In contrast, inland regions face greater challenges and constraints in these areas, limiting the effectiveness of digitalization efforts.
3. Differences Between Major Grain-producing and Non-grain-producing Areas
Table 5 (6) to (7) present the results of the impact of agricultural digitalization on green agricultural development in major grain-producing and non-grain-producing regions, based on the semiparametric model. The findings indicate that in major grain-producing areas, agricultural digitalization significantly suppresses green development at the 5% significance level, with a decreasing trend in green development as digitalization levels increase (Figure 5c). In contrast, non-grain-producing areas exhibit a significant positive impact, with digitalization leading to a fluctuating upward trend in green development (Figure 5d).
This difference can be attributed to three key factors. First, the imbalance in resource allocation and technological application. Grain-producing areas may rely heavily on traditional farming practices, leading to inefficient resource allocation that hinders green development. In contrast, non-grain-producing areas, with a focus on diversified agricultural models, promote sustainability and green development. Second, the rigidity of agricultural production methods in grain-producing areas restricts the adoption of new technologies, whereas the more flexible production systems in non-grain-producing areas make it easier to incorporate new technologies, thereby supporting green development. Finally, differences in economic development and market demands contribute to this disparity. Grain-producing areas may prioritize yield and efficiency, often at the expense of green development, while in non-grain-producing areas, the diversity of market demands encourages farmers to focus on product quality and environmental sustainability, making digitalization more conducive to green development.
4. Differences across the Hu Huanyong Line
Table 5 (8) to (9) present the results of the impact of agricultural digitalization on green agricultural development in the southeastern and northwestern regions, as delineated by the Hu Huanyong Line, using the semiparametric model. The findings show that in the southeastern region, agricultural digitalization significantly promotes green development at the 1% significance level, with green development increasing significantly as digitalization levels rise (Figure 5e). In contrast, the northwestern region exhibits a “U-shaped” pattern at the 10% significance level, where green development initially decreases and then gradually increases as digitalization progresses (Figure 5f).
This difference is primarily attributable to two factors. First, the southeastern region has benefited from early reforms, a strong agricultural base, and high technological capabilities. Digitalization effectively integrates resources, improves production efficiency, and enables precise management. Furthermore, the government’s commitment to agricultural modernization has resulted in substantial investments in digital technologies, driving green development. Second, the northwestern region faces significant challenges, including harsh geographical conditions, limited resources, and a reliance on traditional agricultural practices. While government support has increased, geographical and economic factors continue to limit the pace of digitalization. Additionally, the weak agricultural foundation and low farmer adoption of new technologies have led to initial declines in green development. However, as investments increase and training for farmers intensifies, green agricultural development in the region gradually improves.
4.3.2. Heterogeneity of Green Agricultural Development Levels
As noted earlier, agricultural digitalization has had an impact on both intra-regional and inter-regional green agricultural development. However, there has been a lack of exploration into how the effects of digitalization vary based on the inherent green development endowments across regions. Therefore, to examine whether the effect of agricultural digitalization is confined to provinces with higher green development endowments, this study employs a quantile regression model to assess the impact of agricultural digitalization on green agricultural development across different quantiles. Specifically, this study selects nine quantiles from Q10 to Q90 to capture the variation in the effects of agricultural digitalization at different levels of green agricultural development.
Table 6 presents the results of the quantile regression analysis. As the level of green agricultural development increases, the impact of agricultural digitalization initially suppresses and then promotes green development, with the effect becoming more pronounced. This suggests that in provinces with lower levels of green agricultural development, digitalization does not support, but rather hinders, the advancement of green agriculture. In contrast, in provinces with higher levels of green agricultural development, the level of digitalization significantly enhances green agricultural development. This indicates that in provinces with lower green development levels, digitalization may be constrained by inadequate infrastructure, improper technology application, or outdated management systems, leading to inefficient resource utilization and increased environmental burdens. On the other hand, in the regions with higher levels of green development, digitalization can integrate advanced technologies and management systems to improve resource efficiency, optimize production processes, and reduce environmental pollution, thereby significantly enhancing green agricultural development.
Table 6.
Quantile regression model estimation results.
5. Mechanism Test
In the process of empowering green agricultural development, agricultural digitalization is influenced by the characteristics of different green agricultural development models. The interaction between agricultural digitalization and these characteristics can enhance green agricultural development. This study divides the models of green agricultural development into three types: market-driven, policy-incentive, and innovation-driven. The study selects the number of enterprises with green food certification, the number of green food-certified products, the number of new agricultural business entities, the intensity of environmental regulations, agricultural mechanization density, and the density of facility agriculture development as moderating variables for each model, and examines the mechanisms through which agricultural digitalization empowers green agricultural development.
For the market-driven model, Table 7 (1) to (2) analyze the moderating effect of the number of green food-certified enterprises and the number of green food-certified products on the relationship between agricultural digitalization and green agricultural development. The results show that the interaction terms for the number of green food-certified enterprises and the number of green food-certified products with agricultural digitalization are significantly positive. This suggests that promoting the establishment of green food-certified enterprises and increasing the number of green food-certified products significantly enhance the positive impact of agricultural digitalization on green agricultural development. Green food certification represents the high quality and environmental sustainability of agricultural products, requiring enterprises to adopt advanced environmentally friendly production technologies and management models. This aligns with the goals of agricultural digitalization to improve production efficiency and optimize resource allocation. The combination of these factors forms a complementary advantage, making agricultural production more efficient and environmentally friendly, thereby jointly promoting green agricultural development, which confirms Hypothesis 2a.
Table 7.
Moderating effects of characteristic variables under different green development models.
For the policy-incentive model, Table 7 (3) to (4) examine the moderating role of environmental regulation intensity and the number of new agricultural business entities on the relationship between agricultural digitalization and green agricultural development. The results show that the interaction term for environmental regulation intensity and agricultural digitalization is significantly positive, while its direct effect is negative, indicating that environmental regulations may have a suppressive effect on green agricultural development in the short term. However, in regions with higher levels of agricultural digitalization, the negative impact of environmental regulation is significantly mitigated. The interaction term for the number of new agricultural business entities and agricultural digitalization is significantly positive, suggesting that an increase in the number of new agricultural business entities strengthens the positive effect of agricultural digitalization on green agricultural development. Strengthened environmental regulations encourage producers to adopt more environmentally friendly technologies and management practices, while new agricultural business entities further promote green development through large-scale, intensive production. In regions with stronger environmental regulations and a larger number of new agricultural business entities, agricultural digitalization can more effectively drive green agricultural development, confirming Hypothesis 2b.
For the innovation-driven model, Table 7 (5) to (6) analyze the moderating role of agricultural mechanization density and the density of facility agriculture development on the relationship between agricultural digitalization and green agricultural development. The results show that the interaction terms for agricultural mechanization density and facility agriculture development density with agricultural digitalization are significantly positive. This indicates that promoting agricultural mechanization and facility agriculture development can enhance the positive effect of agricultural digitalization on green agricultural development. The improvement in agricultural mechanization significantly enhances agricultural production efficiency, reduces resource waste, and provides hardware support for the application of agricultural digital technologies. The development of facility agriculture, through intensive and intelligent production methods, significantly improves resource use efficiency, reduces environmental pollution, and promotes green agricultural transformation. In regions with higher levels of agricultural mechanization and more developed facility agriculture, agricultural digitalization can more effectively drive green agricultural development, confirming Hypothesis 2c.
It is worth noting that the three models of green agricultural development—market-driven, policy-incentive, and innovation-driven—do not exist in isolation in real-world practice. Instead, they tend to coexist and interact within and across regions depending on local conditions. For example, eastern coastal regions with advanced market systems and consumer demand for eco-friendly products often exhibit a dominant market-driven approach. In contrast, central and western regions benefit more from policy incentives due to stronger governmental support, while innovation-driven models are more prevalent in technologically advanced areas such as the Yangtze River Delta and Beijing–Tianjin–Hebei region.
Moreover, the empirical evidence suggests that these models are not mutually exclusive but often overlap in practice. A region may simultaneously pursue digital branding of green products (market-oriented), adopt government-subsidized environmental regulations (policy-incentive), and invest in facility agriculture (innovation-driven). This integration reflects a hybrid strategy in which local governments and producers respond to both market signals and policy directives, using digital tools to enhance coordination across supply chains.
Although the current study is based on provincial-level panel data and does not explicitly map the spatial distribution of each model, the significant interaction effects identified in the mechanism tests provide indirect evidence that different regions adopt different emphases based on their structural advantages. Further research using micro-level data or case studies could provide deeper insight into how these models function synergistically at the local level.
6. Further Analysis: Spatial Spillover Effect Analysis
The rapid development of the digital economy has broken traditional geographical constraints, enabling the free flow of various factors of production in agriculture. This not only promotes the green development of local agriculture but may also, through spatial spillover effects, drive transformations in agricultural production methods in other regions. To explore this further, this study uses the spatial Durbin model (SDM) to examine the spatial spillover effects of digitalization in promoting green agricultural development.
To determine the specific form of the spatial econometric model, this study sequentially conducts the LM test, LR test, and Hausman test, with the results shown in Table 8. First, both the LM and R-LM lag tests are significant at the 1% level, indicating that the spatial error model and spatial lag model are appropriate choices. Second, the LR test rejects the null hypothesis at the 1% significance level, suggesting that the SDM is more suitable. Finally, the Hausman test results, significant at the 1% level, confirm that the fixed effects SDM should be selected. Therefore, this study adopts the fixed effects SDM.
Table 8.
Results of the spatial panel model tests.
The SDM is estimated using Maximum Likelihood Estimation (MLE) with three spatial weight matrices—geographical distance, economic distance, and gravity distance. The spatial regression and spatial spillover effect decomposition results of the model are presented in Table 9, as shown in Equation (3). Column (1) of Table 9 displays the empirical results under the geographical distance weight matrix. It can be observed that the spatial autoregressive coefficient in the main regression passes the 5% significance test. Additionally, the direct effect, indirect effect, and total effect of digitalization are all statistically significant, indicating that agricultural digitalization in the 30 provinces of China not only promotes green agricultural development in the region but also generates positive spatial spillover effects in neighboring areas. This can be easily understood, as digital technologies are highly transmissible and adaptable, enabling innovations in agricultural practices and improvements in efficiency to be quickly applied across different regions. Moreover, driven by markets and policies, green agricultural development has become a shared consensus, encouraging mutual learning and cooperation among regions. The common environmental challenges have fostered shared goals and motivations for green agricultural development across provinces, which has contributed to the positive impact of agricultural digitalization on green development in China. Furthermore, the estimation results for the direct and indirect effects show that the indirect spatial spillover effect of agricultural digitalization on green agricultural development far exceeds the direct effect. This suggests that while direct applications in individual regions bring localized optimizations, the diffusion and imitation of digital technologies and innovative concepts have led to the widespread adoption of these optimization experiences in neighboring areas, thereby promoting green agricultural development over a broader geographical area and generating more significant collective benefits.
Table 9.
Spatial spillover effects of agricultural digitalization on green agricultural development.
To assess the robustness of the model, the economic distance weight matrix and gravity distance weight matrix are used as substitutes for the geographical distance weight matrix to analyze the spatial spillover effects of agricultural digitalization on green agricultural development. The results are shown in Column (2) and Column (3) of Table 9. Under both spatial weight matrices, the spatial autoregressive coefficient in the main regression passes the 1% significance test. Additionally, in both the economic distance and gravity distance matrices, the direct, indirect, and total effects of digitalization are all statistically significant, indicating that agricultural digitalization in the 30 provinces of China not only promotes green agricultural development in the region but also generates positive spatial spillover effects in neighboring areas. These results confirm the robustness of the model.
7. Conclusions and Policy Recommendations
7.1. Research Conclusions
Agricultural digitalization and green agricultural development are essential requirements for the comprehensive promotion of rural revitalization in China. A systematic analysis of the logical relationship between the two is of great significance for improving agricultural production efficiency and promoting high-quality agricultural development. Based on a clear theoretical mechanism of the impact of agricultural digitalization on green agricultural development, this study uses panel data from 30 provinces in China between 2011 and 2021. It constructs an evaluation index system for green agricultural development, covering five dimensions: resource conservation, environmental safety, ecological preservation, output quality, and quality of life. Using methods such as fixed effects models, semiparametric models, quantile regression models, and spatial Durbin models, this study empirically examines the impact of agricultural digitalization on green agricultural development from the “demand side” of agricultural green development.
The following conclusions are drawn: First, the level of agricultural digitalization and green agricultural development in China steadily increased during the study period. The agricultural digitalization levels in the three major regions (eastern, central, and western) exhibited a decreasing pattern from east to west, while green agricultural development levels followed the opposite pattern, decreasing from west to east. Over time, regional disparities within the provinces have gradually increased, while inter-regional disparities have gradually decreased. Second, agricultural digitalization has a significant positive impact on green agricultural development. This impact varies across the three major regions, coastal with inland areas, grain-producing with non-grain-producing regions, and regions on either side of the Hu Huanyong Line. Agricultural digitalization has a noticeable positive impact on green agricultural development in the eastern, coastal, non-grain-producing regions, and the southeastern region of the Hu Huanyong Line. In contrast, the “U-shaped” effect is observed in the inland and northwestern regions of the Hu Huanyong Line, while it has an inhibitory effect on grain-producing regions. Furthermore, the positive effects of digitalization are more pronounced in regions with higher levels of green agricultural development. Third, agricultural digitalization in the 30 provinces of China not only promotes green agricultural development within each region but also generates positive spatial spillover effects to neighboring regions. These spillover effects are stronger in surrounding areas, indicating that the benefits of agricultural digitalization extend beyond individual regions. Fourth, under the moderating effects of market orientation, policy incentives, and innovation-driven models, the positive impact of agricultural digitalization on green agricultural development continues to strengthen.
7.2. Policy Suggestion
The policy implications derived from the aforementioned conclusions are as follows:
First, accelerate the development of agricultural digitalization to fully harness its potential to promote green and sustainable agricultural development. Specifically, continue advancing the path of agricultural green development through digitalization, encouraging the integration of digital technologies into agricultural practices. Utilizing big data and artificial intelligence to conduct precision agriculture can reduce the use of chemical inputs and promote sustainable agricultural practices. Furthermore, establish cross-regional cooperation mechanisms for agricultural digitalization to jointly foster green agricultural development. Given the positive spatial spillover effects of digitalization, policies should encourage cross-regional collaboration, such as the creation of comprehensive data-sharing platforms to enable the efficient exchange of information, experience, and technology. This will help regions explore green development models suited to their unique conditions. Additionally, strengthen the roles of market orientation, policy incentives, and innovation-driven approaches in agricultural digitalization. Improving market mechanisms to direct resources towards green agriculture, increasing policy support, and encouraging technological innovation and talent development will provide sustainable momentum for green agricultural development.
Second, implement region-specific policies that account for local conditions and prioritize key areas. For grain-producing regions, the focus should be on balancing traditional farming practices with digitalization, avoiding over-reliance on established production models and technological paths. These regions should actively embrace and integrate new digital technologies, such as smart agriculture and precision farming, to drive green agricultural development. For non-grain-producing regions, continue promoting digital technologies to improve efficiency and sustainability. In inland areas, the government should focus on the diffusion and training of agricultural digital technologies, increasing farmers’ acceptance of these technologies. Tailored green development policies should be implemented, considering the local agricultural resource conditions, to encourage eco-friendly agricultural practices. Coastal regions should continue optimizing digital infrastructure and promote the widespread application of digital technologies in agricultural production to achieve both green development and high-quality output. For the northwestern region of the Hu Huanyong Line, attention should be paid to balancing the application of digital technologies with ecological protection, guiding and regulating digital agriculture to promote sustainable agricultural practices. For the southeastern region of the Hu Huanyong Line, further investment in agricultural technological innovation should be made to foster green agricultural development.
7.3. Discussion
This study investigates the significant role of agricultural digitalization in advancing green agricultural development, providing valuable insights into its dynamic effects, mechanisms, and spatial spillover effects. The findings suggest that agricultural digitalization has a positive and substantial impact on green agricultural development in China, but its effects are not uniform across regions or under different development models.
One of the core insights from this study is the pronounced heterogeneity in the impact of agricultural digitalization on green agricultural development across different geographical regions, particularly the eastern, central, and western regions, as well as coastal versus inland areas. The results indicate that agricultural digitalization fosters green agricultural development most effectively in regions with better infrastructure and higher levels of technological adoption, such as the eastern and coastal regions. These areas benefit not only from advanced digital technologies but also from a conducive economic environment and stronger policy support, which facilitate the transition towards sustainable agricultural practices. Conversely, regions like the northwestern and inland areas face a “U-shaped” effect, where digitalization initially suppresses green development due to infrastructure gaps and inadequate technological adoption, before gradually yielding positive results as these barriers are overcome.
In contrast, the grain-producing regions exhibit a somewhat contradictory relationship, where agricultural digitalization has a negative impact on green agricultural development. This result could be attributed to the sector’s traditional reliance on high-input farming practices, which resist the shift towards more sustainable, digitalized agricultural models. This finding emphasizes the need for region-specific strategies, where grain-producing regions should strike a balance between maintaining food security and transitioning towards more environmentally sustainable farming practices.
Furthermore, this study highlights the importance of the “demand-side” perspective in understanding the dynamics of agricultural digitalization. By examining the roles of market-driven, policy-incentive, and innovation-driven models, this paper sheds light on how different institutional frameworks mediate the effects of agricultural digitalization. In market-driven areas, digital technologies increase transparency, facilitate the development of green agricultural brands, and improve the overall efficiency of the supply–demand relationship. Policy-driven areas benefit from stronger regulatory enforcement and better alignment between government incentives and digitalization efforts. The innovation-driven model, on the other hand, underscores the transformative potential of cutting-edge technologies like artificial intelligence and big data in optimizing agricultural production processes and fostering a green agricultural transformation.
Another significant contribution of this study lies in its spatial spillover analysis. The positive spillover effects of agricultural digitalization extend beyond the immediate region of implementation, benefiting neighboring provinces as well. This spatial diffusion is particularly pronounced in the context of market- and policy-driven initiatives, where successful green agricultural practices in one region can inspire and guide neighboring areas. These findings emphasize the need for cross-regional cooperation and the establishment of platforms for data sharing and technology exchange, enabling a broader, collective transition towards sustainable agricultural practices.
While this study provides valuable insights, several avenues for future research remain. First, future studies should explore the micro-level effects of agricultural digitalization within specific industries or enterprises. By examining the mechanisms at play within particular sectors, researchers can provide more granular recommendations tailored to the needs of individual stakeholders in the agricultural value chain. Second, expanding the scope of the study to include comparisons with other digitalization efforts, such as those in the manufacturing or energy sectors, could provide a more comprehensive understanding of the comparative advantages and challenges of agricultural digitalization. Finally, exploring the role of agricultural digitalization in enhancing rural livelihoods and quality of life is an area that requires further investigation. While this study includes a dimension of affluence, future work should consider how digitalization can improve rural living standards and ensure that the benefits of green agricultural development are equitably distributed.
Although this study is based on data from China, its theoretical framework and key findings have broader relevance and potential applicability in other national contexts. The mechanisms identified—namely market alignment, policy incentives, and innovation-driven digital transformation—are not exclusive to China but reflect universal pathways for promoting green agricultural development. Moreover, the methodological approach adopted in this study, including the use of semiparametric and spatial econometric models, provides a transferable toolkit for analyzing similar dynamics elsewhere. Nevertheless, we acknowledge that differences in agricultural structures, digital infrastructure, and governance capacities may affect the external validity of the results. Future research should thus aim to apply and test this framework in other countries, particularly in developing economies undergoing agricultural and digital transitions, to further validate its generalizability.
In conclusion, the results of this study reinforce the potential of agricultural digitalization to foster green agricultural development in China, especially when tailored to the unique regional and developmental contexts. Policymakers should leverage these findings to strengthen digital infrastructure, incentivize technological innovation, and promote policy frameworks that foster collaboration across regions. By doing so, they can unlock the full potential of digital technologies to drive sustainable, high-quality agricultural growth.
Author Contributions
Y.M.: Conceptualization, methodology, investigation, resources, data curation, writing—original draft preparation, visualization, supervision, project administration; D.L.: validation, formal analysis. All authors have read and agreed to the published version of the manuscript.
Funding
This work was supported by the Capital University of Economics and Business Graduate Student Science and Technology Innovation Project.
Institutional Review Board Statement
Not applicable.
Informed Consent Statement
Not applicable.
Data Availability Statement
All the data adopted in this article are from public resources and have been cited with references accordingly.
Conflicts of Interest
The authors declare no conflicts of interest.
References
- Shen, Z.; Wang, S.; Boussemart, J.-P.; Hao, Y. Digital transition and green growth in Chinese agriculture. Technol. Forecast. Soc. Change 2022, 181, 121742. [Google Scholar] [CrossRef]
- CCTV News. Key Points of the 2024 No. 1 Central Document. China Rural Sci. Technol. 2024, 3, 6–10. [Google Scholar]
- General Office of the CPC Central Committee. Opinions on Innovating Institutional Mechanisms to Promote Green Agricultural Development. In Gazette of the Ministry of Agriculture and Rural Affairs of the People’s Republic of China; Ministry of Agricultur and Rural Affairs of the People’s Republic of China: Beijing, China, 2017; pp. 4–9. [Google Scholar]
- Jin, S.; Lin, Y.; Luan, J. Agricultural Green Development Now Has Clear Guidelines: An Interpretation of the 14th Five-Year National Plan for Agricultural Green Development; China Development Observation: Beijing, China, 2021; pp. 47–49. [Google Scholar]
- Han, A.; Liu, P.; Wang, B.; Zhu, A. E-commerce development and its contribution to agricultural non-point source pollution control: Evidence from 283 cities in China. J. Environ. Manag. 2023, 344, 118613. [Google Scholar] [CrossRef] [PubMed]
- Zhai, X.; Luo, Y. Can Urban Internet Development Attract Labor Force? Evidence from Chinese Cities. Sustainability 2025, 17, 260. [Google Scholar] [CrossRef]
- Pauschinger, D.; Klauser, F.R. The introduction of digital technologies into agriculture: Space, materiality and the public–private interacting forms of authority and expertise. J. Rural Stud. 2022, 91, 217–227. [Google Scholar] [CrossRef]
- Chen, X.; Wang, Q.; Wang, S. Enterprise digital transformation and bank credit loans—Empirical evidence from listed companies in China. Pac. Basin Financ. J. 2025, 90, 102672. [Google Scholar] [CrossRef]
- Ullah, A.; Dogan, M.; Pervaiz, A.; Ather Bukhari, A.A.; Akkus, H.T.; Dogan, H. The impact of digitalization, technological and financial innovation on environmental quality in OECD countries: Investigation of N-shaped EKC hypothesis. Technol. Soc. 2024, 77, 102484. [Google Scholar] [CrossRef]
- Moreno, J.C.; Berenguel, M.; Donaire, J.G.; Rodríguez, F.; Sánchez-Molina, J.A.; Guzmán, J.L.; Giagnocavo, C.L. A pending task for the digitalisation of agriculture: A general framework for technologies classification in agriculture. Agric. Syst. 2024, 213, 103794. [Google Scholar] [CrossRef]
- Zhou, F. The impact of digital economy development on agricultural carbon emissions—Empirical research based on Chinese data. Appl. Econ. Lett. 2024, 1–8. [Google Scholar] [CrossRef]
- Wang, Y.; Qian, Y. Driving factors to agriculture total factor productivity and its contribution to just energy transition. Environ. Impact Assess. Rev. 2024, 105, 107369. [Google Scholar] [CrossRef]
- Kumar, N.; Maiti, D. Long-run macroeconomic impact of climate change on total factor productivity—Evidence from emerging economies. Struct. Change Econ. Dyn. 2024, 68, 204–223. [Google Scholar] [CrossRef]
- Yang, C.; Ji, X.; Cheng, C.; Liao, S.; Obuobi, B.; Zhang, Y. Digital economy empowers sustainable agriculture: Implications for farmers’ adoption of ecological agricultural technologies. Ecol. Indic. 2024, 159, 111723. [Google Scholar] [CrossRef]
- Hu, Y.; Liu, J.; Zhang, S.; Liu, Y.; Xu, H.; Liu, P. New mechanisms for increasing agricultural total factor productivity: Analysis of the regional effects of the digital economy. Econ. Anal. Policy 2024, 83, 766–785. [Google Scholar] [CrossRef]
- Feng, J.; Wang, Y. Does digital inclusive finance promote agricultural development?A test based on threshold and spillover effects. Financ. Res. Lett. 2024, 69, 106104. [Google Scholar] [CrossRef]
- Hu, M.; Chen, G.; Li, Z. The Progress and Framework of Ecological Welfare Performance Within the Context of the “Dual Carbon” Goal: A Comprehensive Literature Review. Sustainability 2025, 17, 410. [Google Scholar] [CrossRef]
- Liu, J.; Fan, X.; Li, X.; Zheng, Y.; Li, Y.; Cui, C.; Bai, Z.; Ma, L.; Zhai, B.; Li, Z. Responses of different agricultural structures to nitrogen loss and agricultural green development in Northwest China. Agric. Ecosyst. Environ. 2024, 367, 108956. [Google Scholar] [CrossRef]
- Gebara, C.H.; Thammaraksa, C.; Hauschild, M.; Laurent, A. Selecting indicators for measuring progress towards sustainable development goals at the global, national and corporate levels. Sustain. Prod. Consum. 2024, 44, 151–165. [Google Scholar] [CrossRef]
- Cao, L.; Wang, G. Impact of digital finance on agricultural output: From the perspective of digital development of agriculture. Financ. Res. Lett. 2024, 66, 105698. [Google Scholar] [CrossRef]
- Ji, M.; Li, J.; Zhang, M. What drives the agricultural carbon emissions for low-carbon transition? Evidence from China. Environ. Impact Assess. Rev. 2024, 105, 107440. [Google Scholar] [CrossRef]
- Wang, X.; Yang, C.; Qiao, C. Agricultural Service Trade and Green Development: A Perspective Based on China’s Agricultural Total Factor Productivity. Sustainability 2024, 16, 7963. [Google Scholar] [CrossRef]
- Guo, J.; Chen, L.; Kang, X. Digital inclusive finance and agricultural green development in China: A panel analysis (2013–2022). Financ. Res. Lett. 2024, 69, 106173. [Google Scholar] [CrossRef]
- Yan, J.; Işık, C.; Ongan, S. Energy intensity, supply chain digitization, technological progress bias in China’s industrial sectors. Energy Econ. 2025, 145, 108442. [Google Scholar] [CrossRef]
- MacPherson, J.; Voglhuber-Slavinsky, A.; Olbrisch, M.; Schobel, P.; Donitz, E.; Mouratiadou, I.; Helming, K. Future agricultural systems and the role of digitalization for achieving sustainability goals. A review. Agron. Sustain. Dev. 2022, 42, 70. [Google Scholar] [CrossRef]
- Vishnoi, S.; Goel, R.K. Climate smart agriculture for sustainable productivity and healthy landscapes. Environ. Sci. Policy 2024, 151, 103600. [Google Scholar] [CrossRef]
- Chen, Y.; Li, M. How does the digital transformation of agriculture affect carbon emissions? Evidence from China’s provincial panel data. Humanit. Soc. Sci. Commun. 2024, 11, 713. [Google Scholar] [CrossRef]
- Liu, Y.; Huang, Y. Assessing the interrelationship between fossil fuels resources and the biomass energy market for achieving a sustainable and green economy. Resour. Policy 2024, 88, 104397. [Google Scholar] [CrossRef]
- Li, X.; Zhang, J. Rural digital credit and residential energy consumption: Evidence from the agricultural production perspective. Energy 2024, 290, 130111. [Google Scholar] [CrossRef]
- S.S., V.C.; S., A.H.; Albaaji, G.F. Precision farming for sustainability: An agricultural intelligence model. Comput. Electron. Agric. 2024, 226, 109386. [Google Scholar] [CrossRef]
- Huo, D.; Malik, A.W.; Ravana, S.D.; Rahman, A.U.; Ahmedy, I. Mapping smart farming: Addressing agricultural challenges in data-driven era. Renew. Sustain. Energy Rev. 2024, 189, 113858. [Google Scholar] [CrossRef]
- Santos, F.J.; Guzmán, C.; Ahumada, P. Assessing the digital transformation in agri-food cooperatives and its determinants. J. Rural Stud. 2024, 105, 103168. [Google Scholar] [CrossRef]
- Latino, M.E.; Menegoli, M.; Corallo, A. Agriculture Digitalization: A Global Examination Based on Bibliometric Analysis. IEEE Trans. Eng. Manag. 2024, 71, 1330–1345. [Google Scholar] [CrossRef]
- Abate, G.T.; Abay, K.A.; Chamberlin, J.; Kassim, Y.; Spielman, D.J.; Paul Jr Tabe-Ojong, M. Digital tools and agricultural market transformation in Africa: Why are they not at scale yet, and what will it take to get there? Food Policy 2023, 116, 102439. [Google Scholar] [CrossRef]
- Abbate, S.; Centobelli, P.; Cerchione, R. The digital and sustainable transition of the agri-food sector. Technol. Forecast. Soc. Change 2023, 187, 122222. [Google Scholar] [CrossRef]
- Qiu, H.; Tang, W.; Huang, Y.; Deng, H.; Liao, W.; Ye, F. E-commerce operations and technology perceptions in promoting farmers’ adoption of green production technologies: Evidence from rural China. J. Environ. Manag. 2024, 370, 122628. [Google Scholar] [CrossRef]
- Zhe, L.; Jie, W.; Yuan, H. The effect of place attachment of geographical indication agricultural products on repurchase intention. J. Retail. Consum. Serv. 2023, 72, 103266. [Google Scholar] [CrossRef]
- Deng, H.; Zheng, W.; Shen, Z.; Štreimikienė, D. Does fiscal expenditure promote green agricultural productivity gains: An investigation on corn production. Appl. Energy 2023, 334, 120666. [Google Scholar] [CrossRef]
- Tang, Y.; Zhao, Q.; Ren, Y. Nexus among government digital development, resource dependence, and carbon emissions in China. Resour. Policy 2024, 95, 105186. [Google Scholar] [CrossRef]
- Hasan, H.R.; Musamih, A.; Salah, K.; Jayaraman, R.; Omar, M.; Arshad, J.; Boscovic, D. Smart agriculture assurance: IoT and blockchain for trusted sustainable produce. Comput. Electron. Agric. 2024, 224, 109184. [Google Scholar] [CrossRef]
- Bibri, S.E.; Krogstie, J.; Kaboli, A.; Alahi, A. Smarter eco-cities and their leading-edge artificial intelligence of things solutions for environmental sustainability: A comprehensive systematic review. Environ. Sci. Ecotechnol. 2024, 19, 100330. [Google Scholar] [CrossRef]
- Chen, P.; Gao, J.; Zhang, M.; Wu, D. New-type professional farmers: How to make use of different types of social capital to engage in agriculture specialization. J. Rural Stud. 2025, 114, 103545. [Google Scholar] [CrossRef]
- Zhang, Y.; Cui, R.; Wei, X.; Chen, T. How digital financial inclusion enhances agroecological efficiency: Impact effects and mechanism tests. Int. Rev. Econ. Financ. 2025, 97, 103755. [Google Scholar] [CrossRef]
- Qu, L.; Li, Y.; Yang, F.; Ma, L.; Chen, Z. Assessing sustainable transformation and development strategies for gully agricultural production: A case study in the Loess Plateau of China. Environ. Impact Assess. Rev. 2024, 104, 107325. [Google Scholar] [CrossRef]
- Gao, D.; Zhi, Y.; Yang, X. Assessing carbon emission reduction benefits of the electrification transition of agricultural machinery for sustainable development: A case study in China. Sustain. Energy Technol. Assess. 2024, 63, 103634. [Google Scholar] [CrossRef]
- Ke, C.; Huang, S.-Z. The effect of environmental regulation and green subsidies on agricultural low-carbon production behavior: A survey of new agricultural management entities in Guangdong Province. Environ. Res. 2024, 242, 117768. [Google Scholar] [CrossRef] [PubMed]
- Saxena, A.; Prakash Gupta, J.; Tiwary, J.K.; Kumar, A.; Sharma, S.; Pandey, G.; Biswas, S.; Raghav Chaturvedi, K. Innovative Pathways in Carbon Capture: Advancements and Strategic Approaches for Effective Carbon Capture, Utilization, and Storage. Sustainability 2024, 16, 10132. [Google Scholar] [CrossRef]
- Sun, X.; Meng, Z.; Zhang, X.; Wu, J. The role of institutional quality in the nexus between green financing and sustainable development. Res. Int. Bus. Financ. 2025, 73, 102531. [Google Scholar] [CrossRef]
- General Office of Ministry of Agriculture and Rural Affairs. Notice of the General Office of the Ministry of Agriculture and Rural Affairs on Issuing the Measures for Monitoring and Evaluating the Level of Green Agricultural Development (Trial). In Gazette of the Ministry of Agriculture and Rural Affairs of the People’s Republic of China; Ministry of Agricultur and Rural Affairs of the People’s Republic of China: Beijing, China, 2023; pp. 50–52. [Google Scholar]
- Zhao, Y.; Wang, J.; Pan, W. Regional characteristics and impact mechanisms of new urbanization and green development level in China at the provincial level. Econ. Geogr. 2023, 43, 1–9. [Google Scholar] [CrossRef]
- Tang, Y.; Chen, M. The Impact of Agricultural Digitization on the High-Quality Development of Agriculture: An Empirical Test Based on Provincial Panel Data. Land 2022, 11, 2152. [Google Scholar] [CrossRef]
- Gao, Y.; Wang, S.; Han, Z. Agricultural Digitalization and the Development of New Agricultural Operators. J. Zhongnan Univ. Econ. Law 2023, 5, 108–121. [Google Scholar] [CrossRef]
- Mu, J.; Ma, L. Measurement of China’s Agricultural and Rural Digital Economy Development Index and Regional Characteristics. J. South China Agric. Univ. 2021, 20, 90–98. [Google Scholar]
- Su, J.; Pan, T.; Dong, C. Study on the Development of Agricultural Digitalization and the Evaluation of Regional Differences in China. J. Northwest AF Univ. 2023, 23, 135–144. [Google Scholar] [CrossRef]
- Wang, D.; Peng, Z.; Li, L. Measuring and evaluating the integrated development level of digital economy and agriculture in China. Chin. Rural Econ. 2023, 6, 48–71. [Google Scholar] [CrossRef]
- Zhang, H.; Wang, H.; Li, Z. Research on High Quality Development Evaluation of Digital Agriculture Under the Background of Rural Revitalization—Based on the Data Analysis of 31 Provinces and Cities in China From 2015 to 2019. J. Shaanxi Norm. Univ. 2021, 50, 141–154. [Google Scholar] [CrossRef]
- Zhu, H.; Chen, H. Measurement, Spatial-temporal Evolution and Promotion Path of Digital Village Development in China. Issues Agric. Econ. 2023, 3, 21–33. [Google Scholar] [CrossRef]
- Zhang, W.; Bai, Y. Theoretical Construction, Empirical Analysis and Optimization Path of the Coupling of Digital Economy and Rural Revitalization. China Soft Sci. 2022, 1, 132–146. [Google Scholar]
- Zhang, J.-Y.; Wang, Y.; Wan, B.-J.; Qi, L.-H.; Shu, T.; Feng, Z.-C. Clinicians’ response ability for public health emergencies: A questionnaire development and validation study. J. Public Health 2023, 32, 2337–2343. [Google Scholar] [CrossRef]
- Di, F.; Hu, Z. Construction and Application of China’s Agricultural Modernizarion Evaluation Index System. Chin. J. Agric. Resour. Reg. Plan. 2020, 41, 46–56. [Google Scholar]
- Wang, Y.; Cheng, J. Digitalization of Agricultural Production and Operation and Farmers’ Economic Performance. J. Soc. Sci. 2021, 8, 80–90. [Google Scholar] [CrossRef]
- Wang, C. The Rural New Industrial and Social Differentiation Mechanisms in the Digital Age. J. China Agric. Univ. 2023, 40, 5–17. [Google Scholar] [CrossRef]
- Zhang, X.; Ran, G. Digitization of Inclusive Finance, Equalization of Public Service and Common Prosperity of Farmers in Rural Areas——Empirical Analysis on County Statisics. J. Shanxi Univ. Financ. Econ. 2023, 45, 30–43. [Google Scholar] [CrossRef]
- Wang, D.; Ran, X. Rural digitalization, human capital and integrated development of rural industries: Empirical evidence based on China provincial panel data. J. Chongqing Univ. 2022, 28, 1–14. [Google Scholar]
- Wang, J.; Yang, G.; Zhou, C. Does internet use promote agricultural green development?Evidence from China. Int. Rev. Econ. Financ. 2024, 93, 98–111. [Google Scholar] [CrossRef]
- Zhou, X.; Zhang, Y. Administration or marketization: Environmental regulation, marketization and agricultural green total factor productivity. J. Environ. Manag. 2024, 370, 122433. [Google Scholar] [CrossRef] [PubMed]
- Ruben, R. From market-based development to value chain transformation: What markets can (not) do for rural poverty alleviation? J. Rural Stud. 2024, 109, 103328. [Google Scholar] [CrossRef]
- Golden, L.A.; Hubbard, M.L.; Som Castellano, R.L.; Lyons, J. Examining cover crop agri-environmental program participation: Evidence from a western US farmer survey. J. Environ. Manag. 2024, 357, 120763. [Google Scholar] [CrossRef]
- Xue, Z.; Hou, Y.; Cao, G.; Sun, G. How does digital transformation drive innovation in Chinese agribusiness: Mechanism and micro evidence. J. Innov. Knowl. 2024, 9, 100489. [Google Scholar] [CrossRef]
- Musolesi, A.; Golinelli, D.; Mazzanti, M. Modelling green knowledge production and environmental policies with semiparametric panel data regression models. Empir. Econ. 2024, 68, 327–352. [Google Scholar] [CrossRef]
- Ma, X.; Feng, X.; Fu, D.; Tong, J.; Ji, M. How does the digital economy impact sustainable development? —An empirical study from China. J. Clean. Prod. 2024, 434, 140079. [Google Scholar] [CrossRef]
- Liu, W.; Gao, Y.; Tang, O.; Cheng, Y. Comprehensive performance analysis of deep integration and innovative development of logistics and manufacturing industries: A comparison analysis between coastal and inland regions in China. Ocean Coast. Manag. 2024, 257, 107332. [Google Scholar] [CrossRef]
- Sun, Y.; Li, S. The impact of digital development on non-agricultural employment of rural women: Evidence from the broadband China strategy. Appl. Econ. 2024, 57, 2224–2240. [Google Scholar] [CrossRef]
- Lou, H.; Shi, X.; Ren, X.; Yang, S.; Cai, M.; Pan, Z.; Zhu, Y.; Feng, D.; Zhou, B. Limited terrestrial carbon sinks and increasing carbon emissions from the Hu Line spatial pattern perspective in China. Ecol. Indic. 2024, 162, 112035. [Google Scholar] [CrossRef]
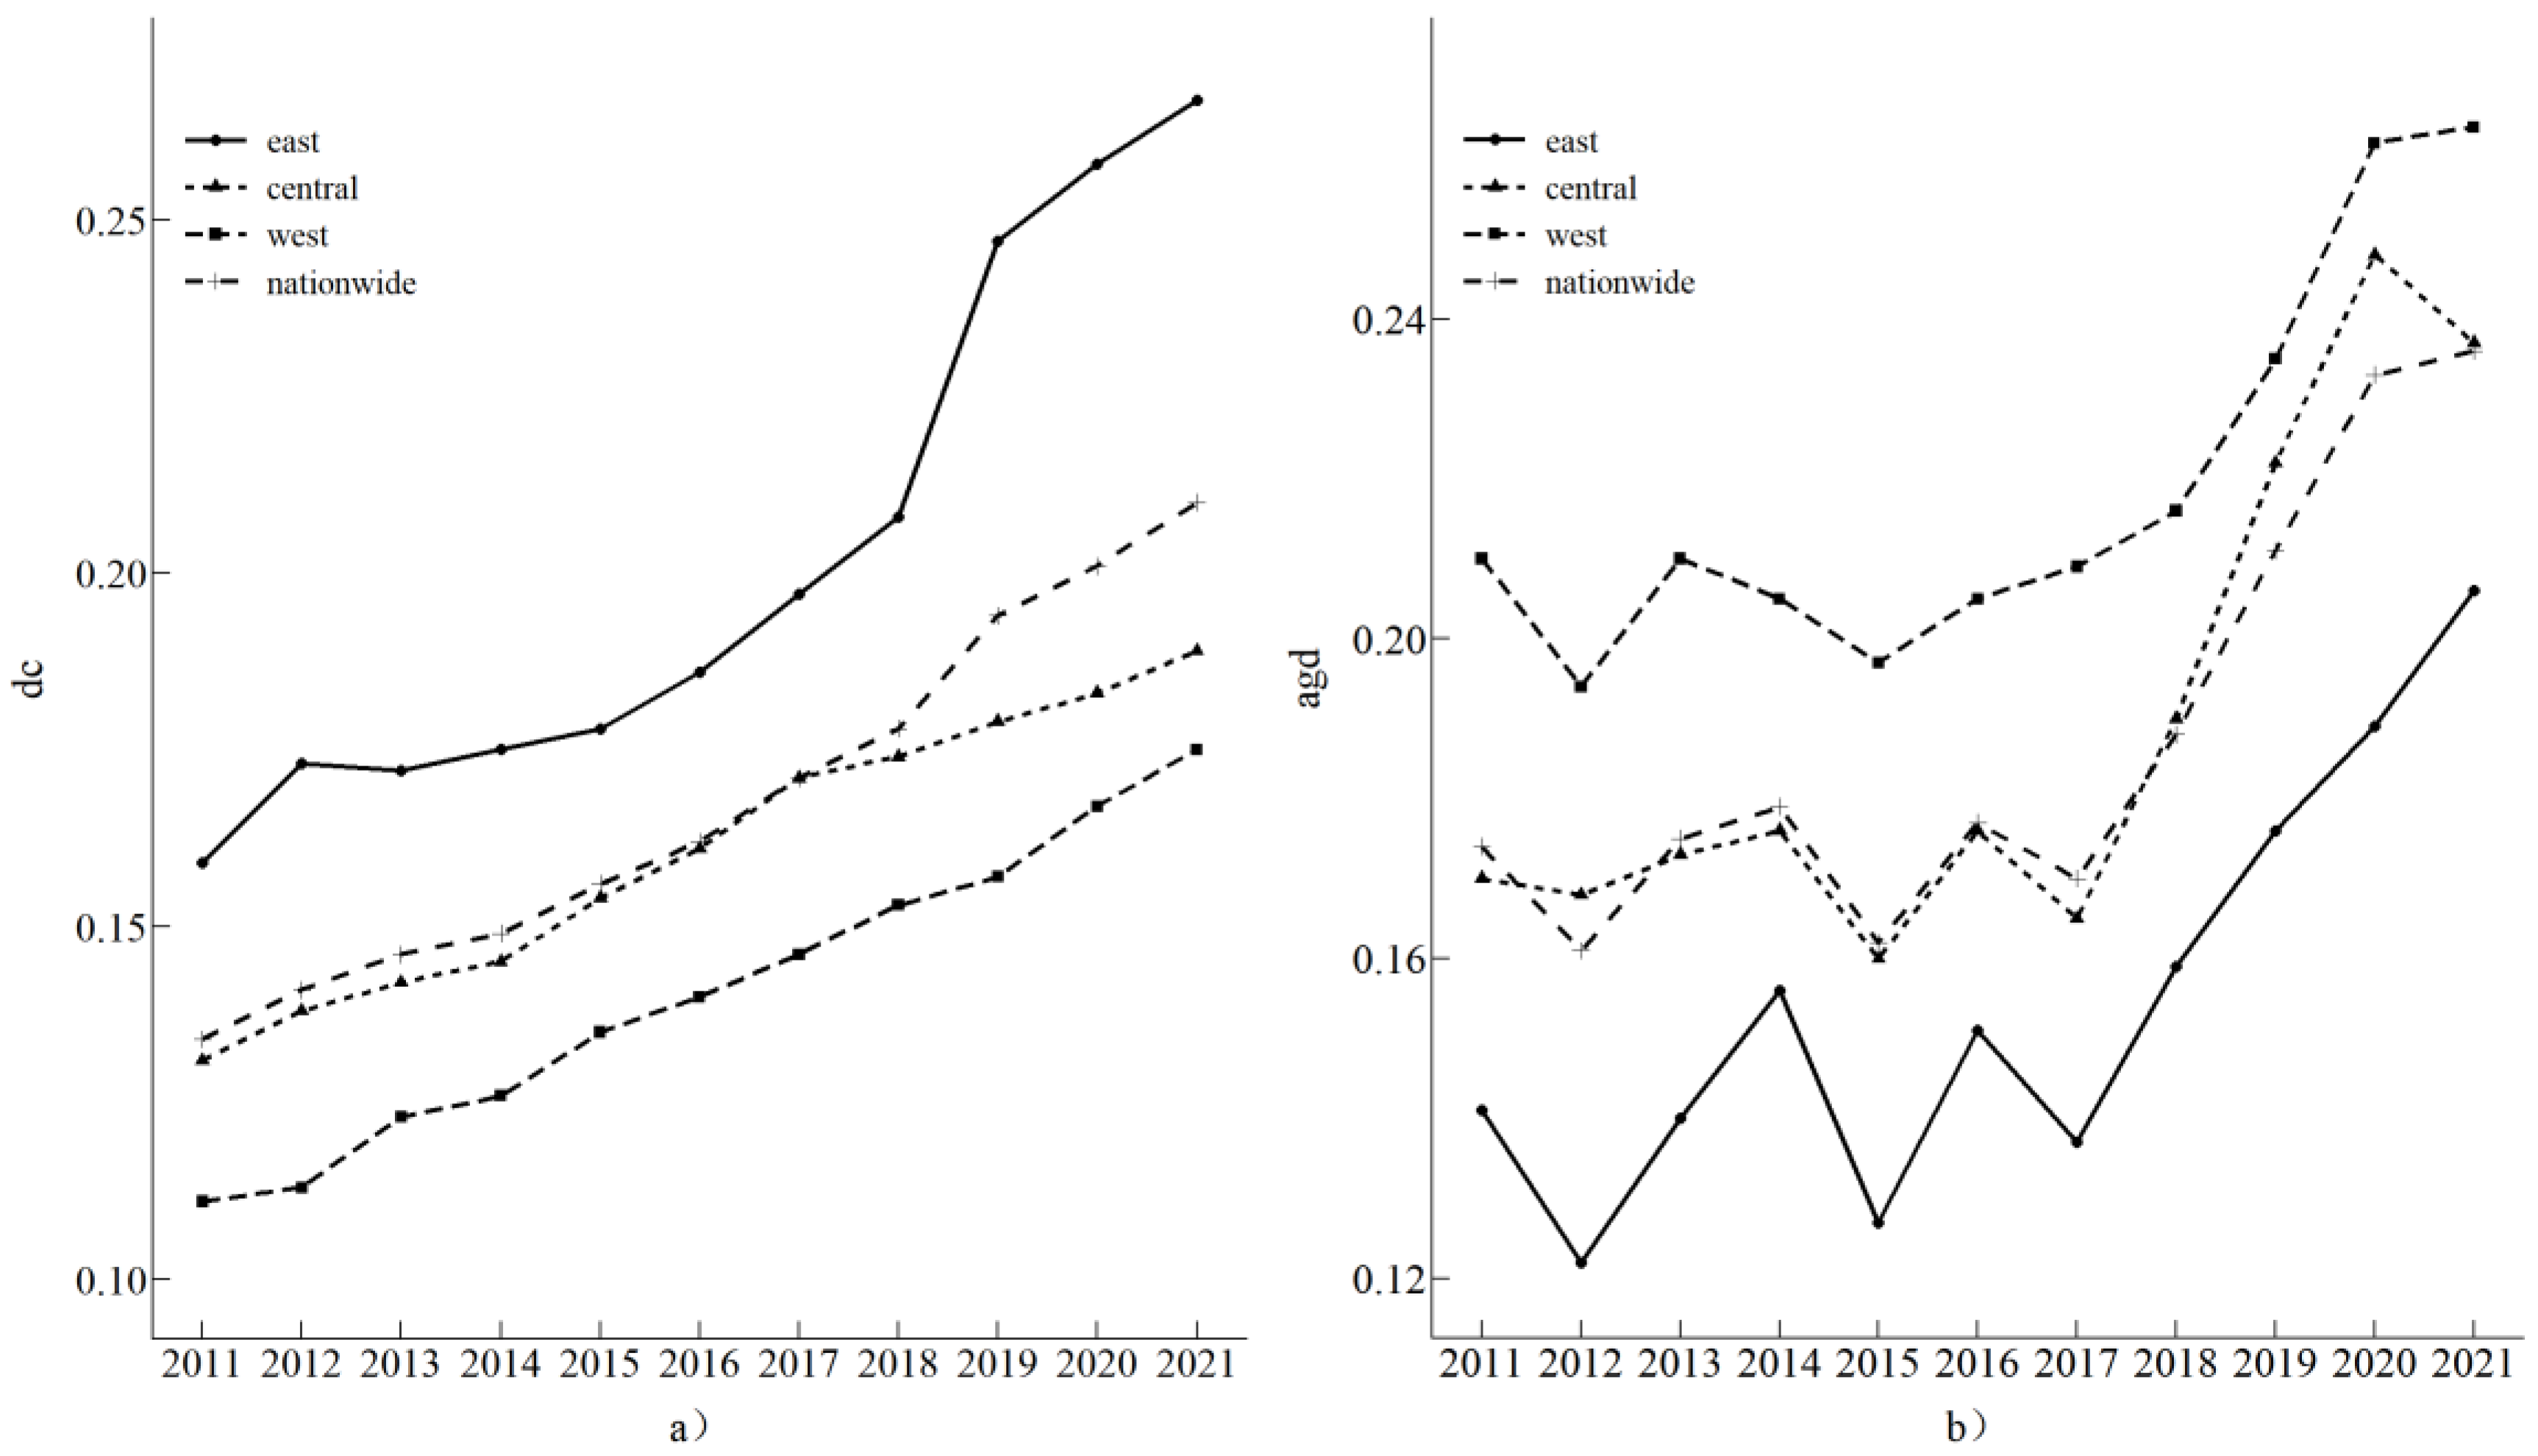
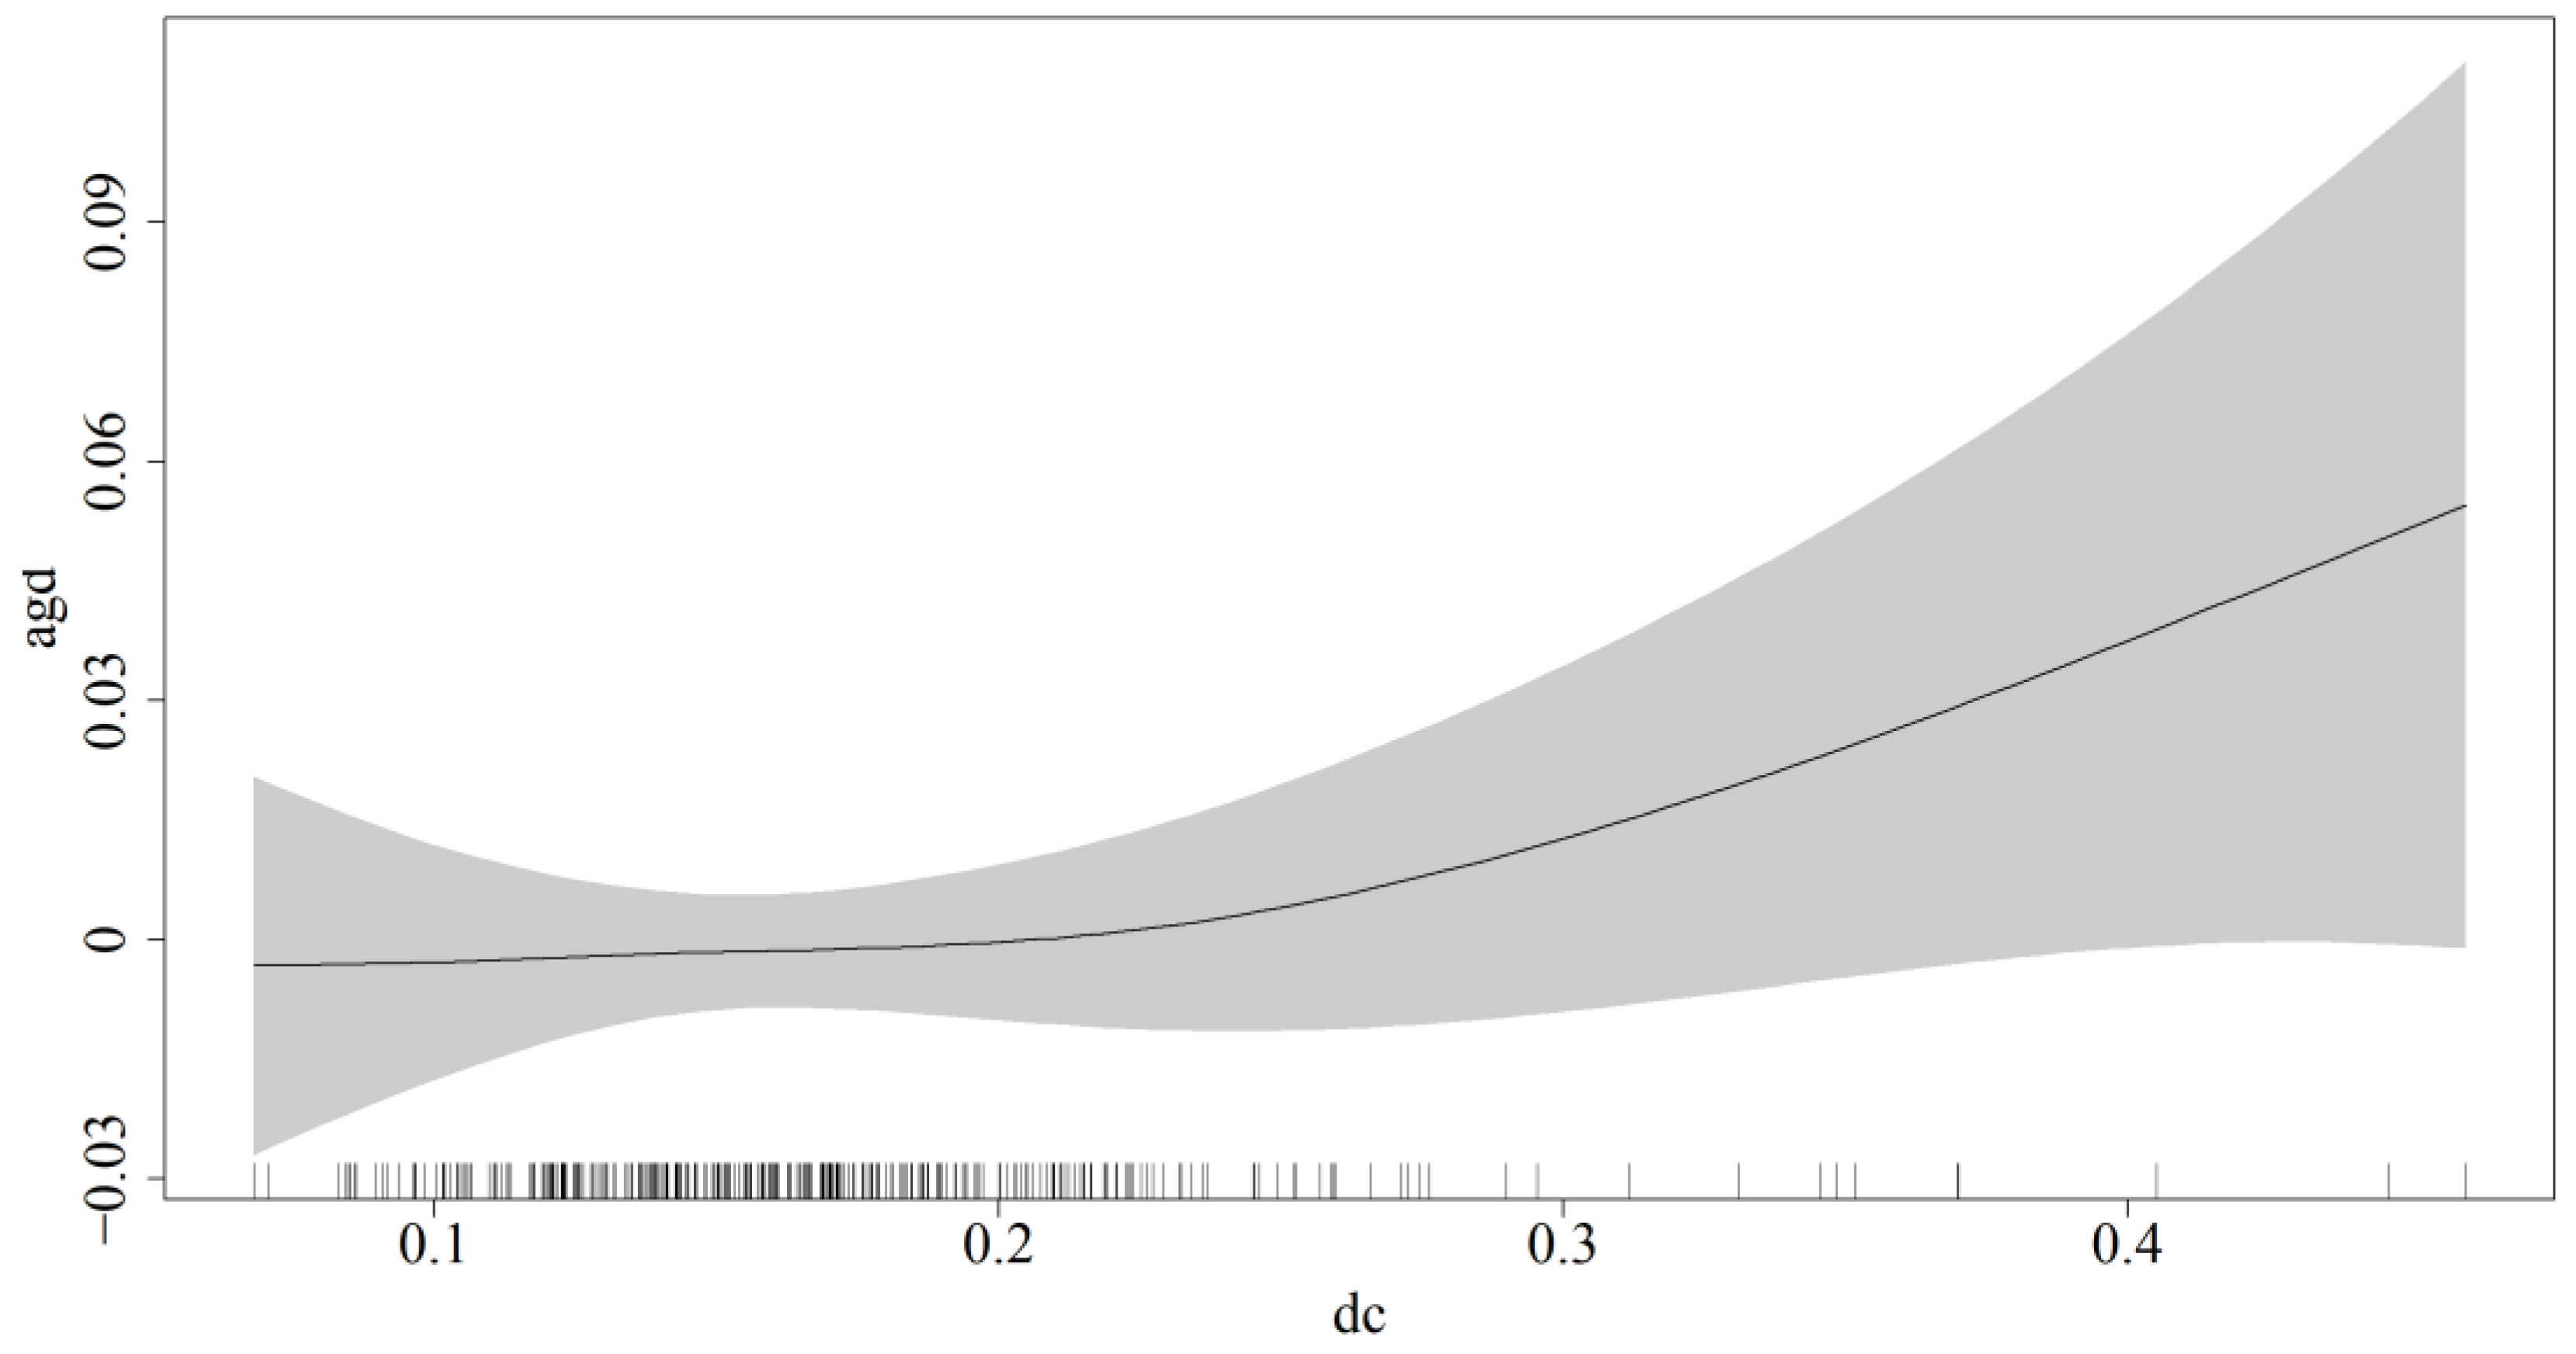
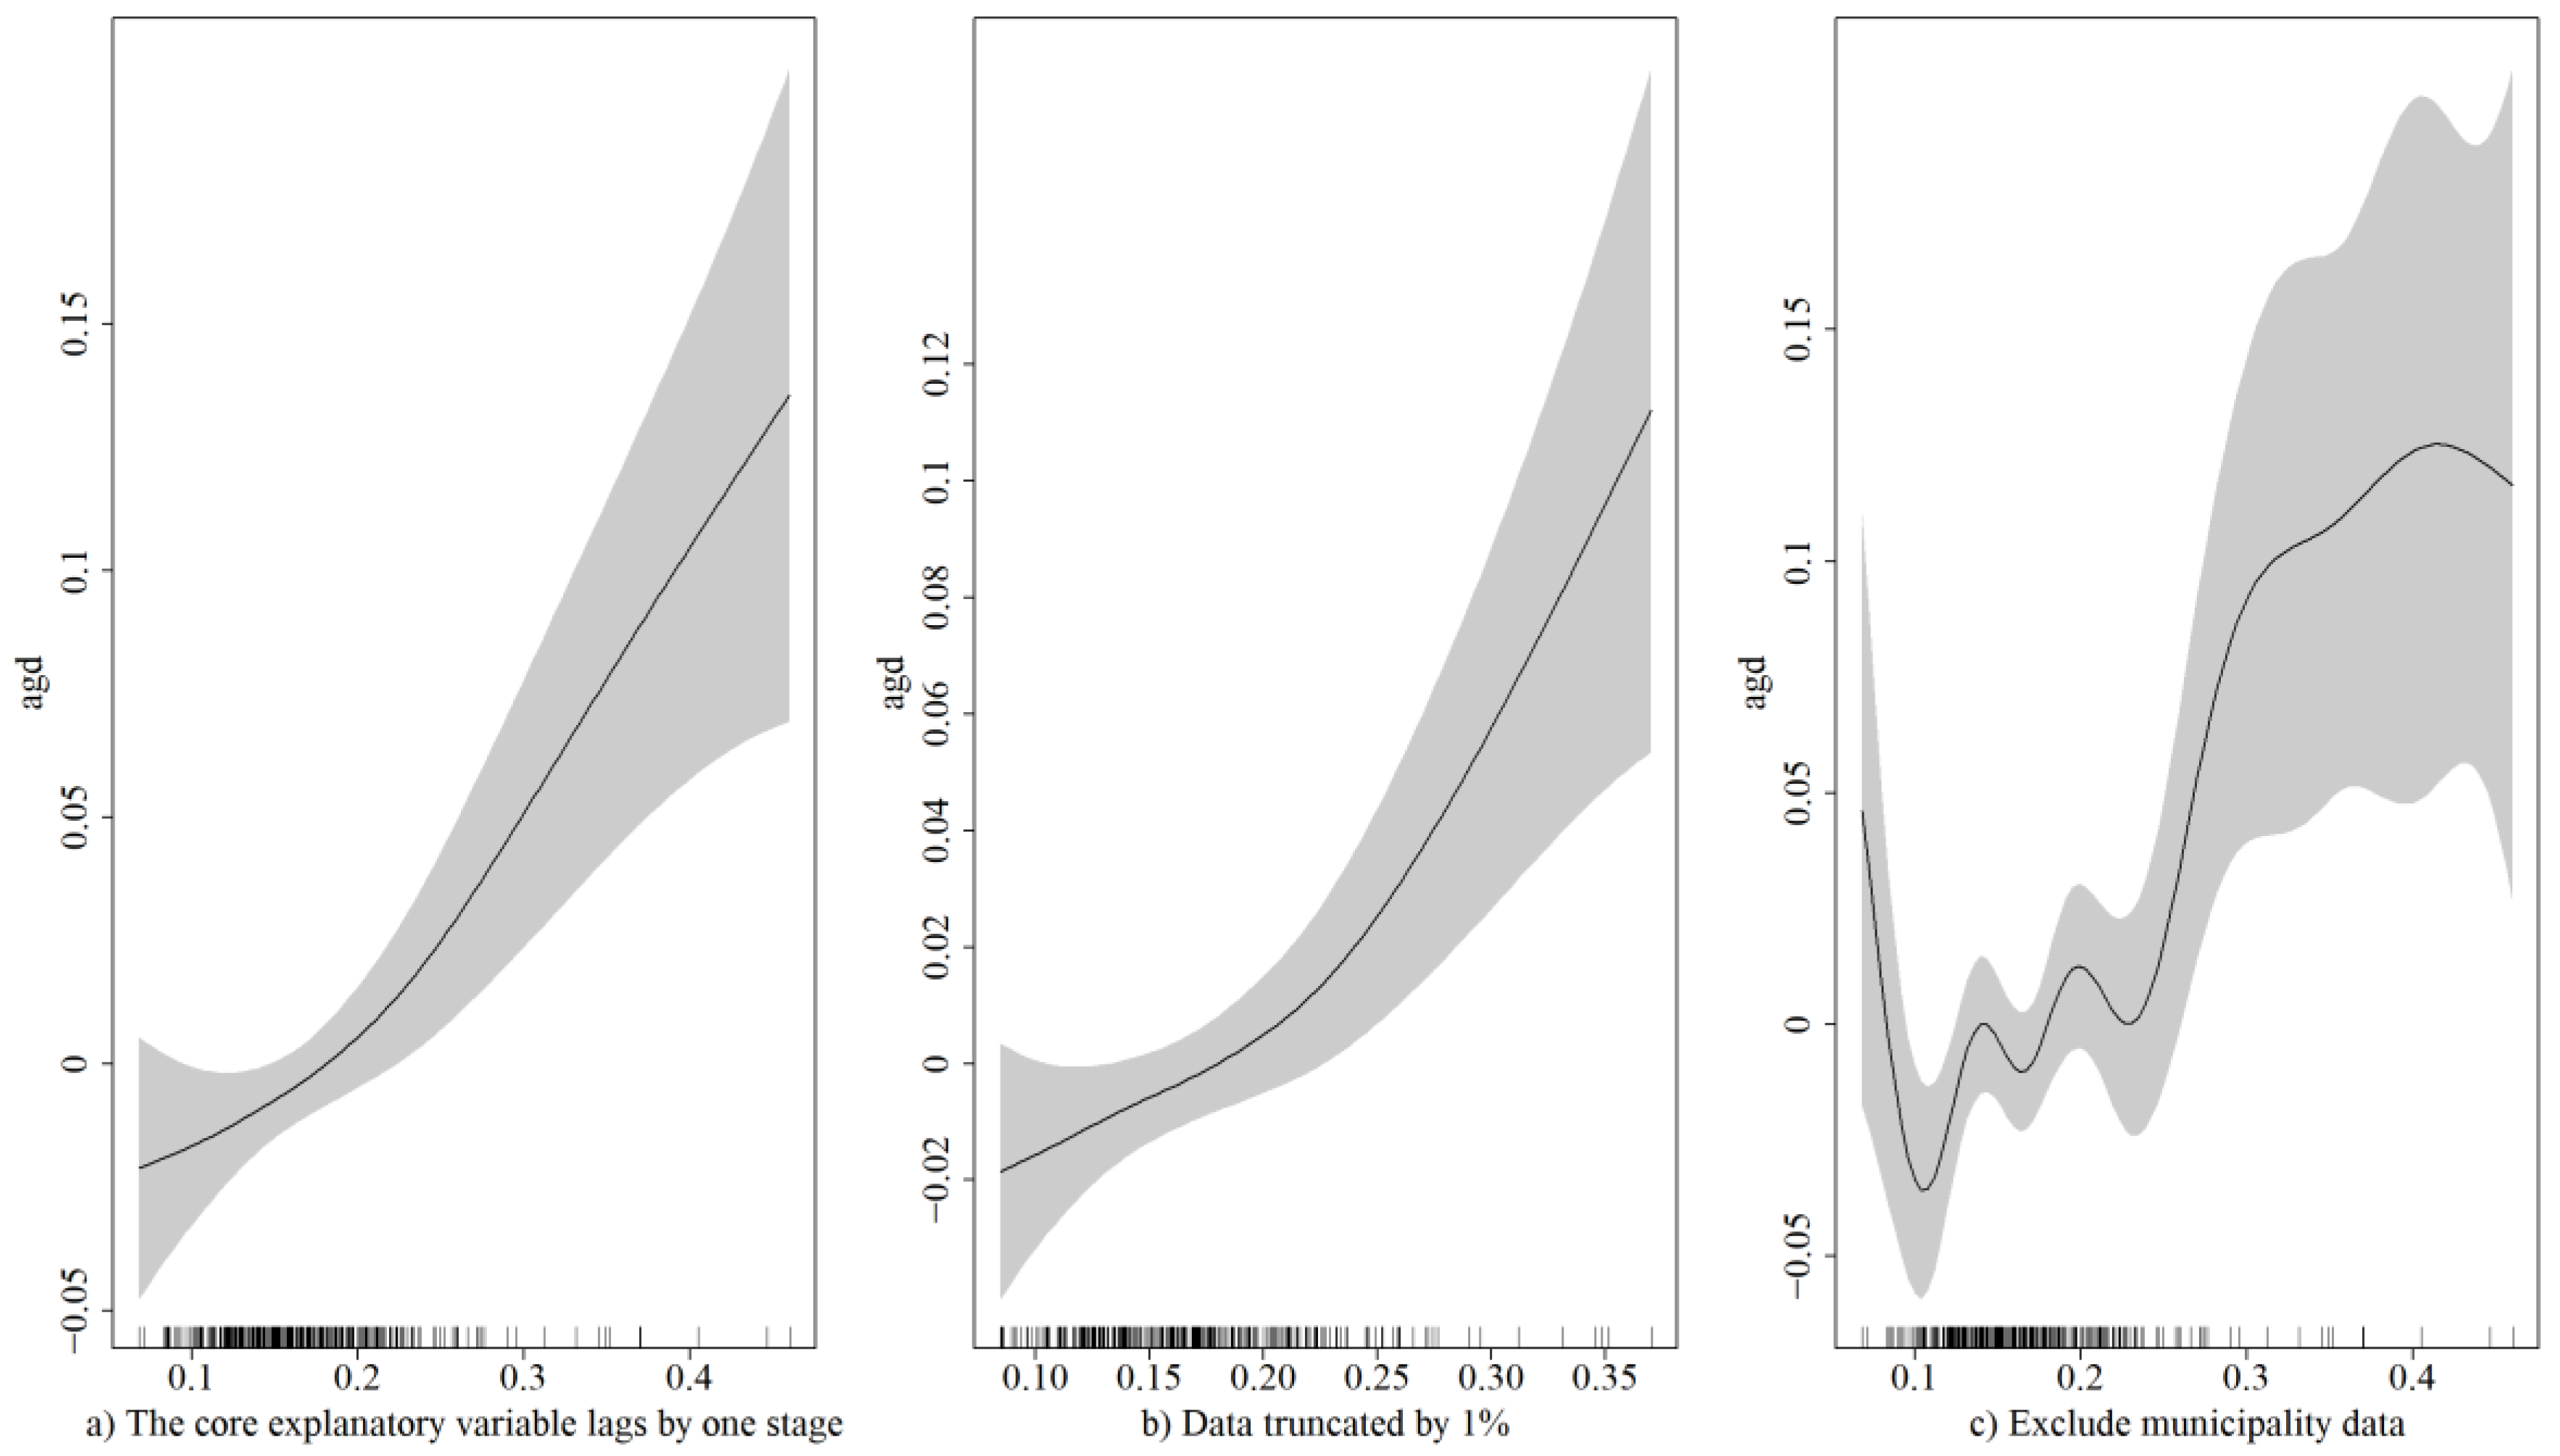
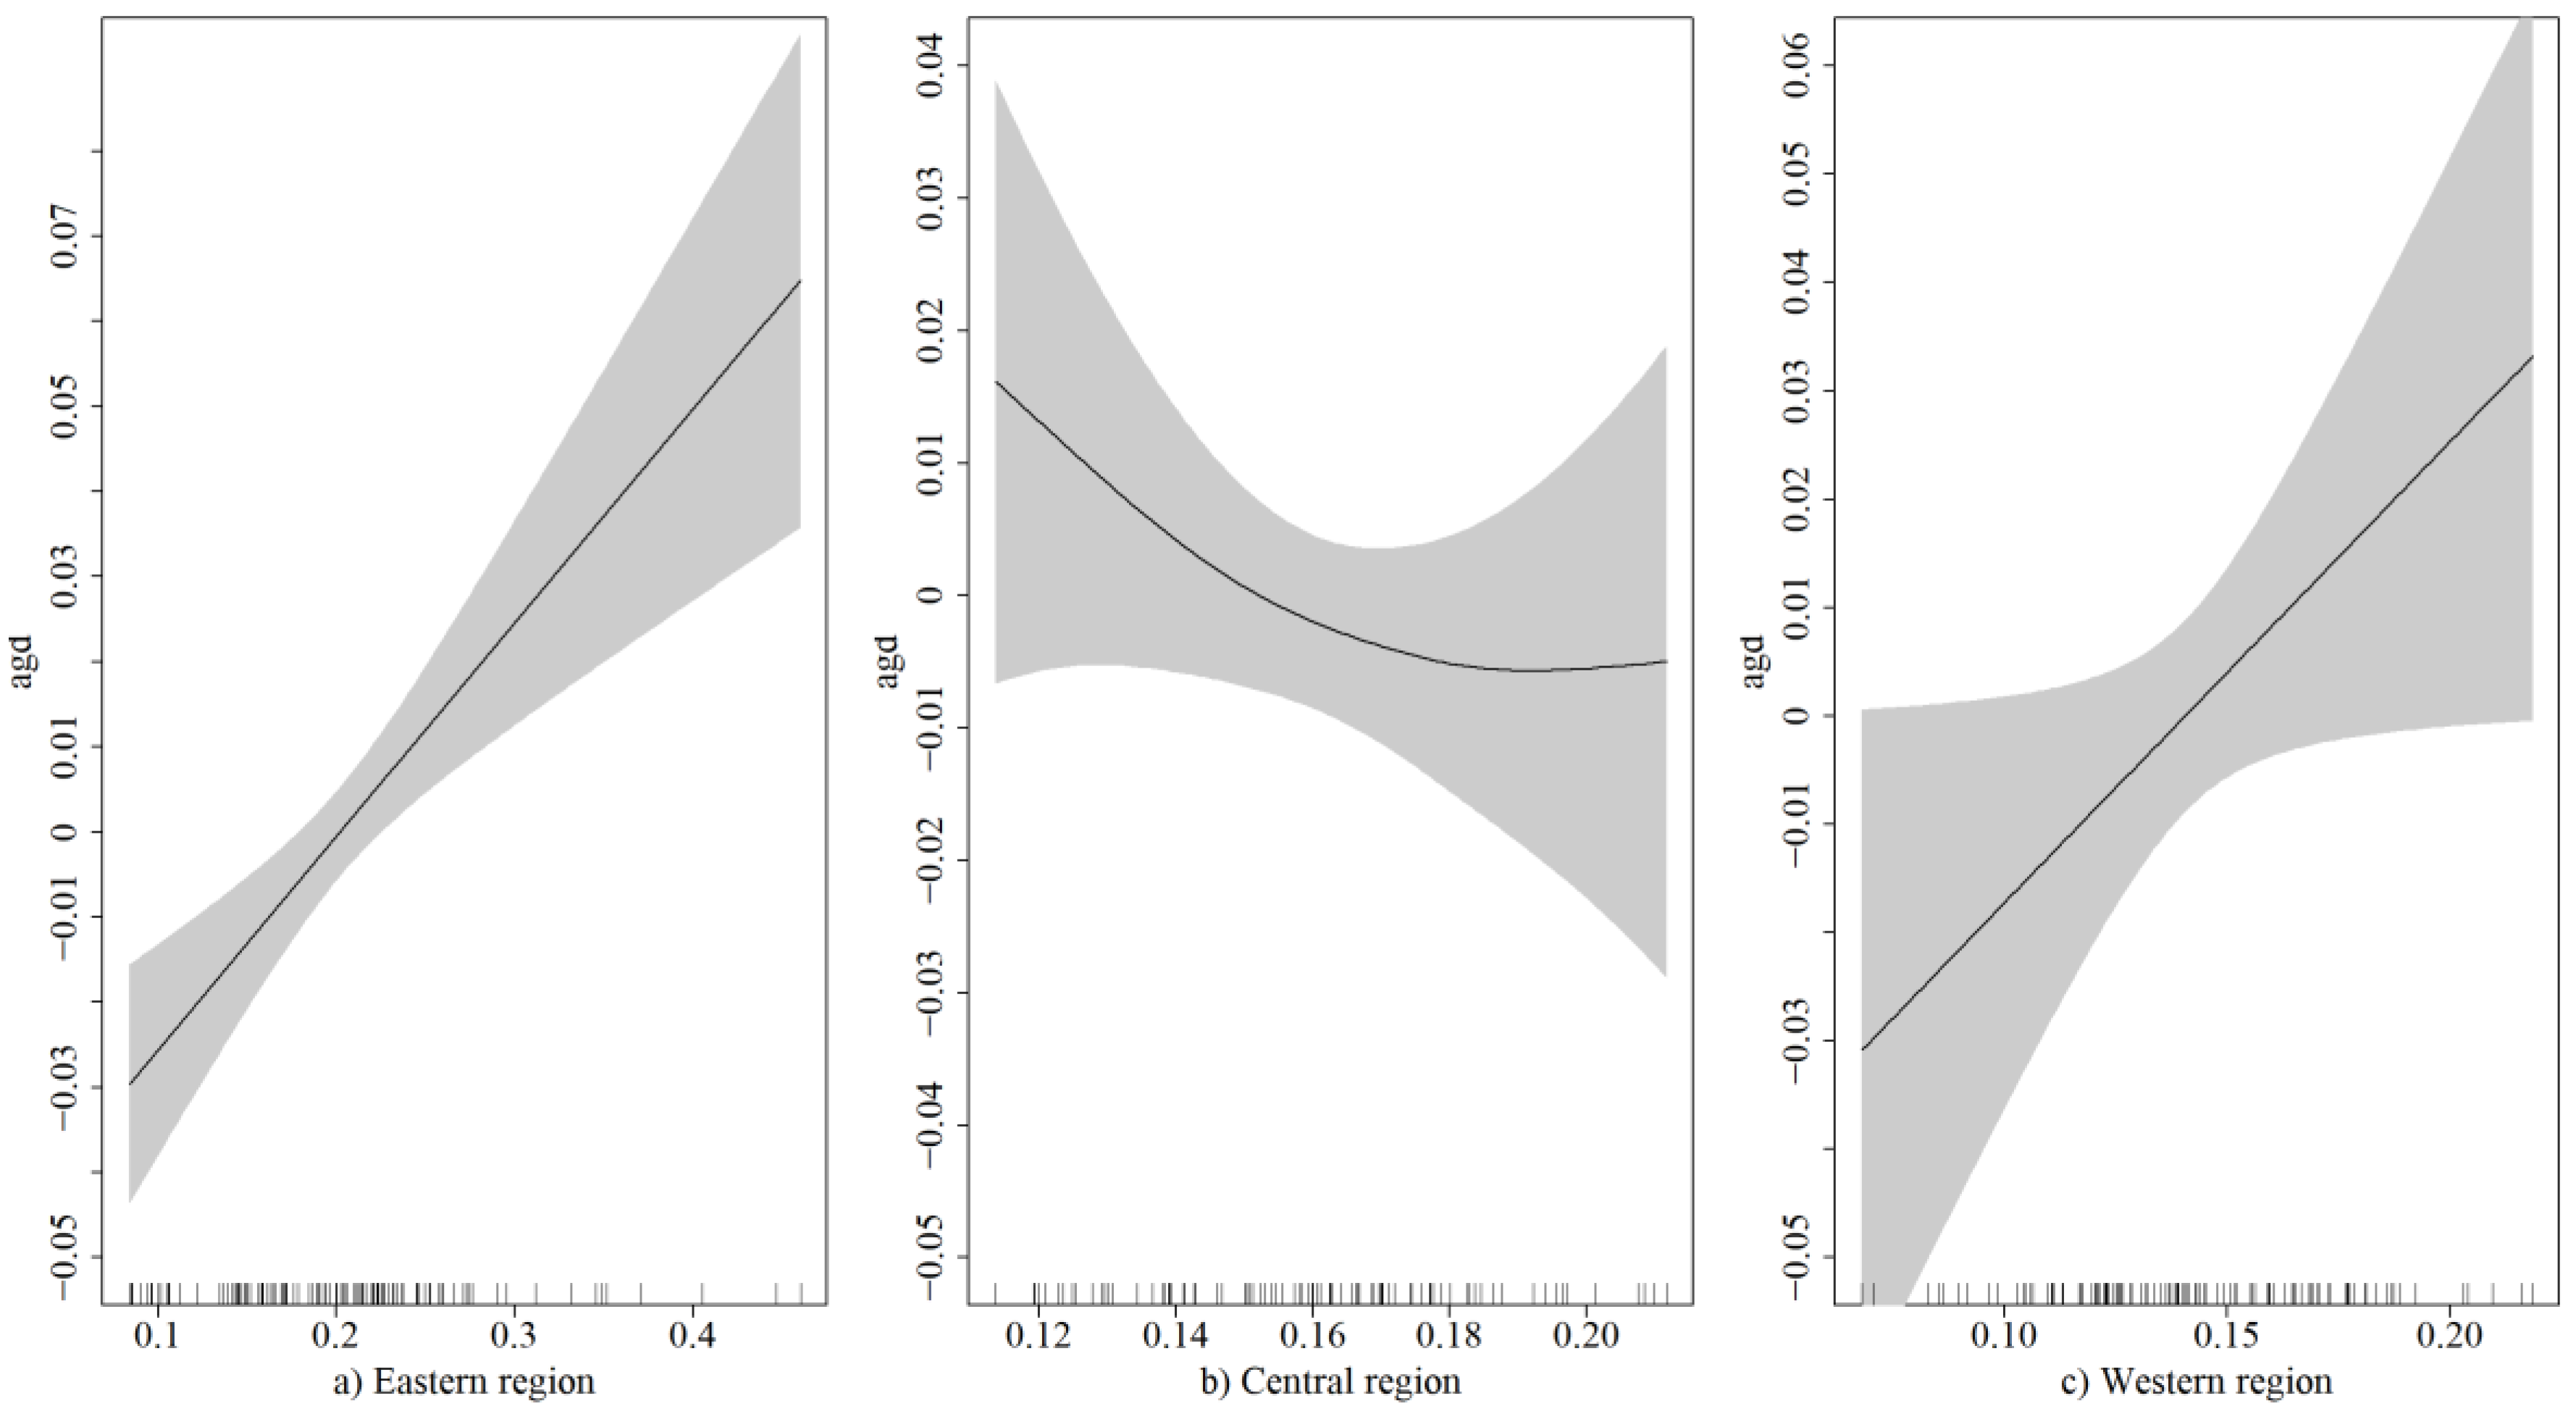

Disclaimer/Publisher’s Note: The statements, opinions and data contained in all publications are solely those of the individual author(s) and contributor(s) and not of MDPI and/or the editor(s). MDPI and/or the editor(s) disclaim responsibility for any injury to people or property resulting from any ideas, methods, instructions or products referred to in the content. |
© 2025 by the authors. Licensee MDPI, Basel, Switzerland. This article is an open access article distributed under the terms and conditions of the Creative Commons Attribution (CC BY) license (https://creativecommons.org/licenses/by/4.0/).